Begin
13 pages · ~26 min
Project Management Metrics Essentials
This course teaches project managers how to define, track, and interpret key performance metrics to monitor project health and drive informed decisions.
A digital instructor presents all 13 pages. Hold “Ask” at any point and ask out loud — the answer comes from this course. No sign-up needed.
What you’ll learn
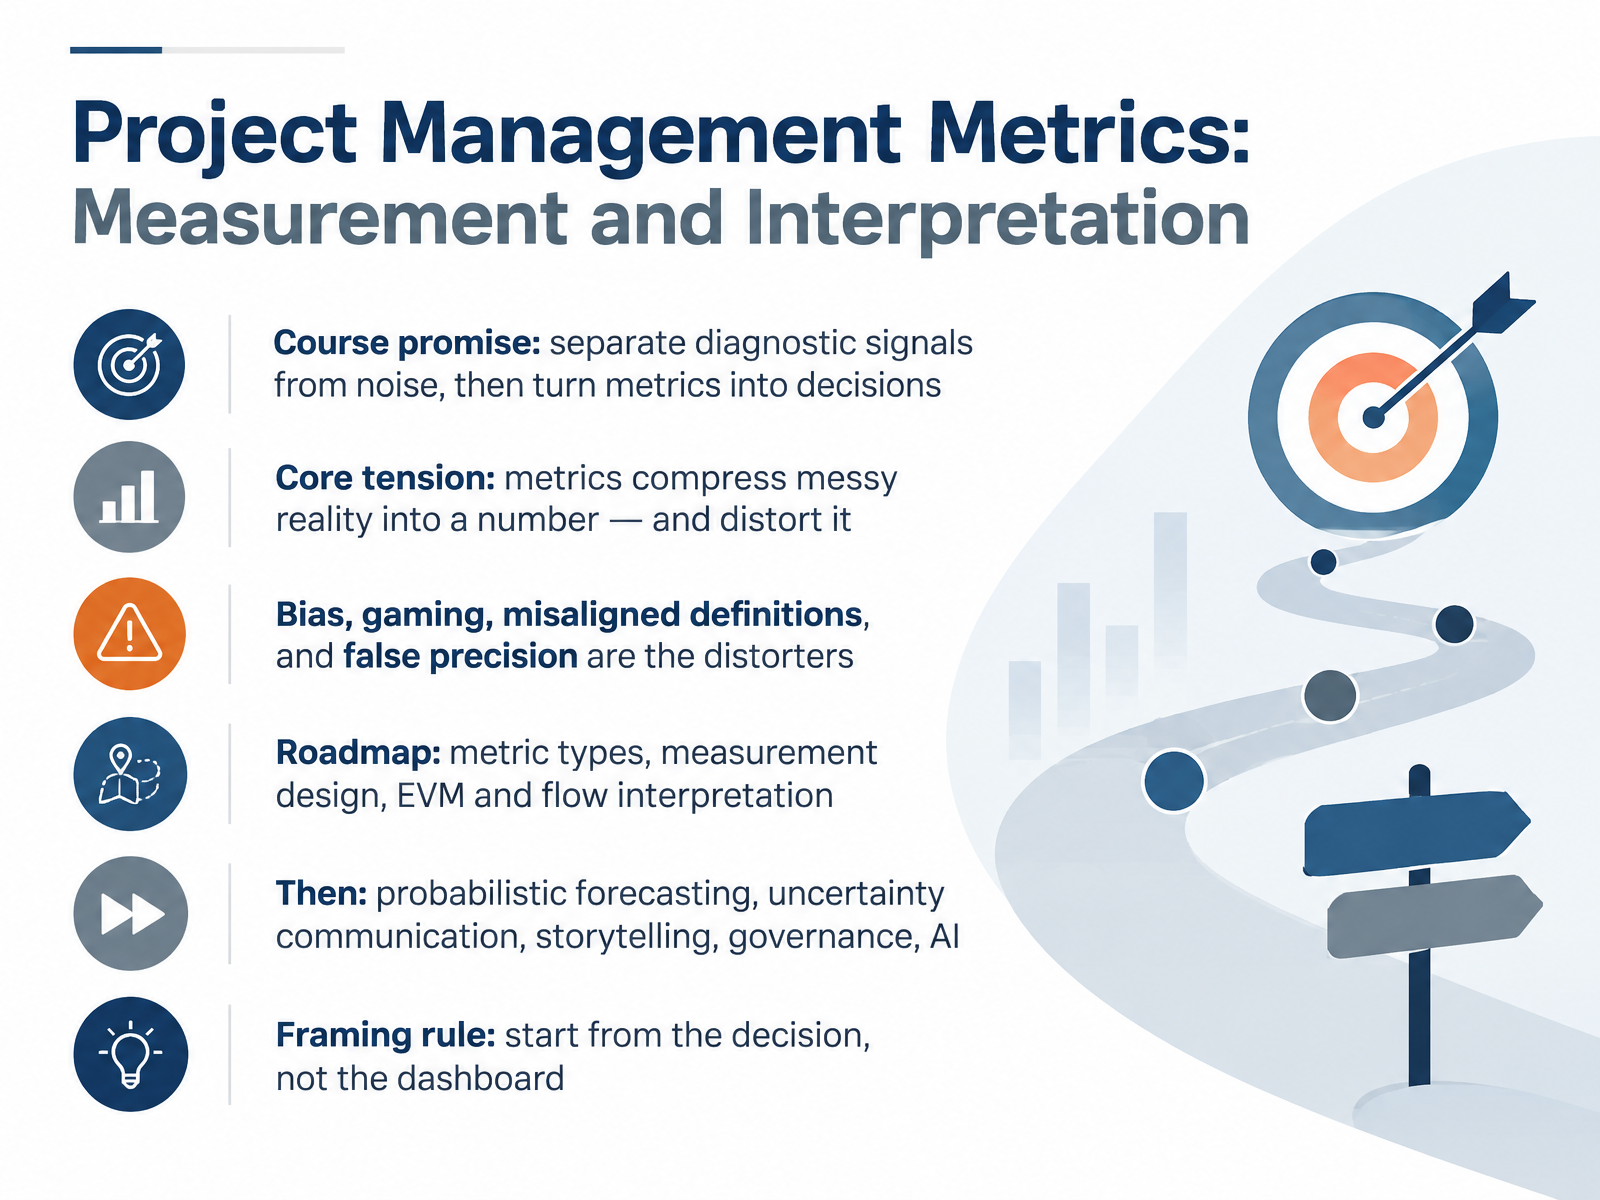
- 01Project Management Metrics: Measurement and InterpretationWelcome. This course is about project management metrics, and specifically about measurement and interpretation. Our promise is simple. We will separate diagnostic signals from noise, then turn those signals into decisions. Here is the core tension. Metrics compress messy reality into a single number, and that compression distorts. Bias, gaming, misaligned definitions, and false precision are the common distorters. Across the course we will cover metric types, measurement design, and how to interpret earned value and flow. Then we move into probabilistic forecasting, communicating uncertainty, storytelling, governance, and AI. One framing rule holds throughout. Start from the decision, not the dashboard. Ask what choice a metric could change before you collect it. Next, we look at how a data point becomes an indicator, and how that indicator earns a place in a decision.pmi.orgpmi.orgpmi.org+21 min
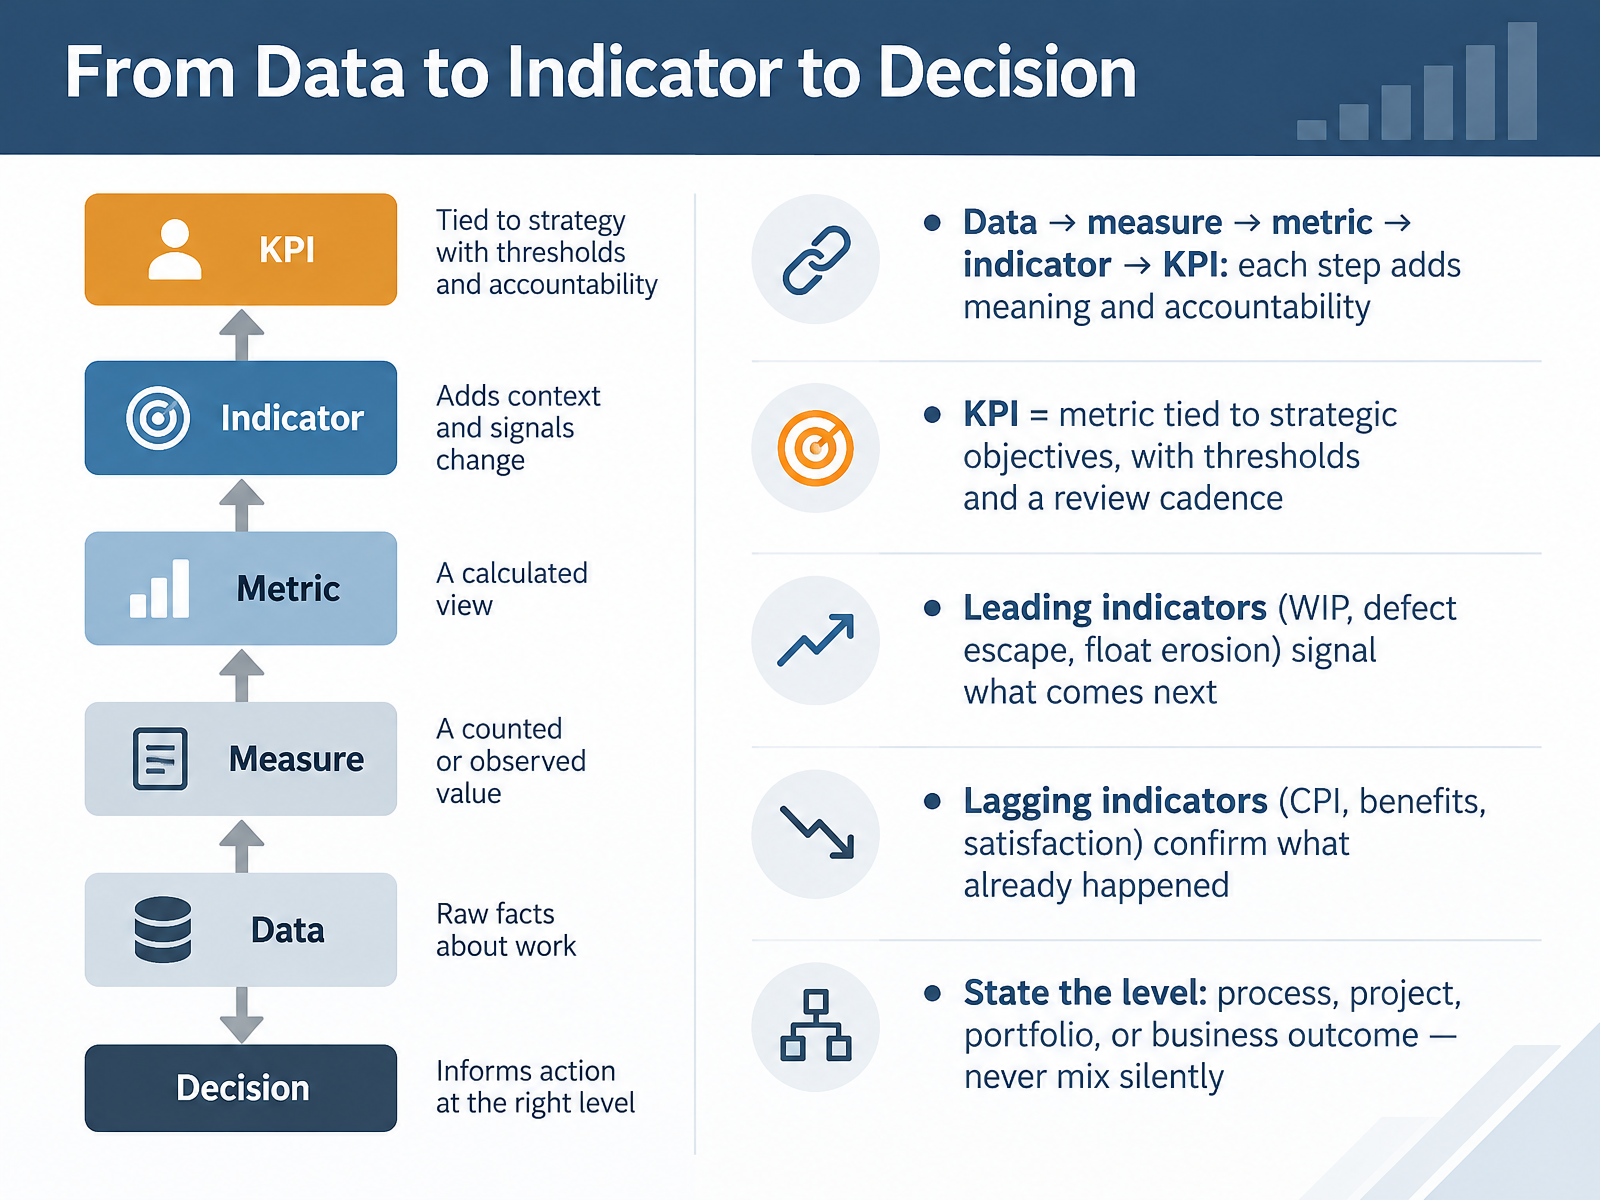
- 02From Data to Indicator to DecisionLet's trace how a raw number becomes a decision. Data becomes a measure once you define what you're counting. A measure becomes a metric when it has a unit and a baseline. A metric becomes an indicator when it carries meaning and a direction. It becomes a KPI when leadership ties it to a strategic objective, with thresholds and a review cadence. You need both types. Leading indicators, like work in progress, defect escape, or float erosion, suggest what comes next. Lagging indicators, like cost performance index, benefits, and satisfaction, confirm what already happened. And state the level: process, project, portfolio, or business outcome. Never mix levels silently, because the comparison baseline changes with each one. Next, we'll look at measurement design, covering validity, reliability, and feasibility.
 pmi.orgpmi.orgpmi.org+21 min
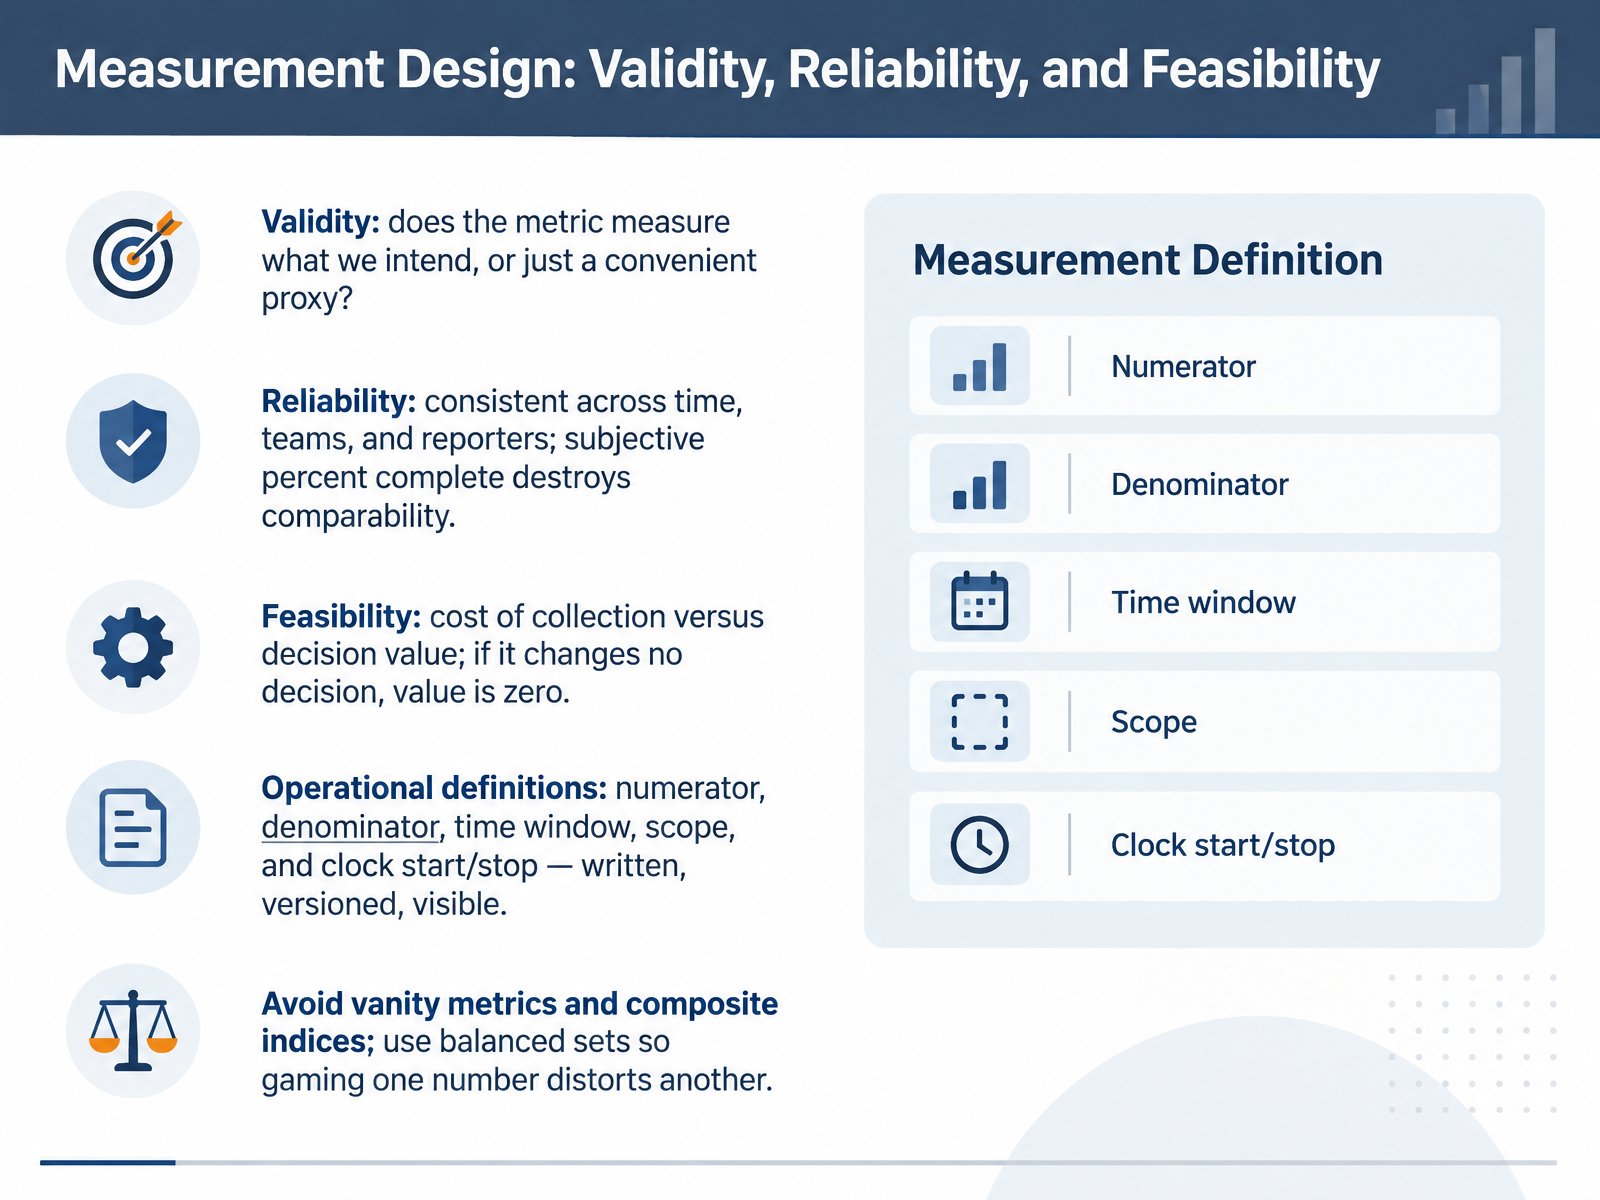
- 03Measurement Design: Validity, Reliability, and FeasibilityLet's look at how to design a measurement you can defend. Three tests matter: validity, reliability, and feasibility.
Validity asks whether the metric measures what you intend, or just a convenient proxy. Reliability means it stays consistent across time, teams, and reporters. Subjective percent complete destroys comparability, so treat it with caution. Feasibility weighs the cost of collection against decision value. If a metric changes no decision, its information value is zero.
So write operational definitions. Name the numerator, the denominator, the time window, the scope, and the clock start and stop. Version them, and keep them visible.
Avoid vanity metrics and composite indices. Use a balanced set, so gaming one number distorts another.
Next, we move to Earned Value: What SPI, CPI, and TCPI Hide.
 leed.dkpmexams.compump.academy+21 min
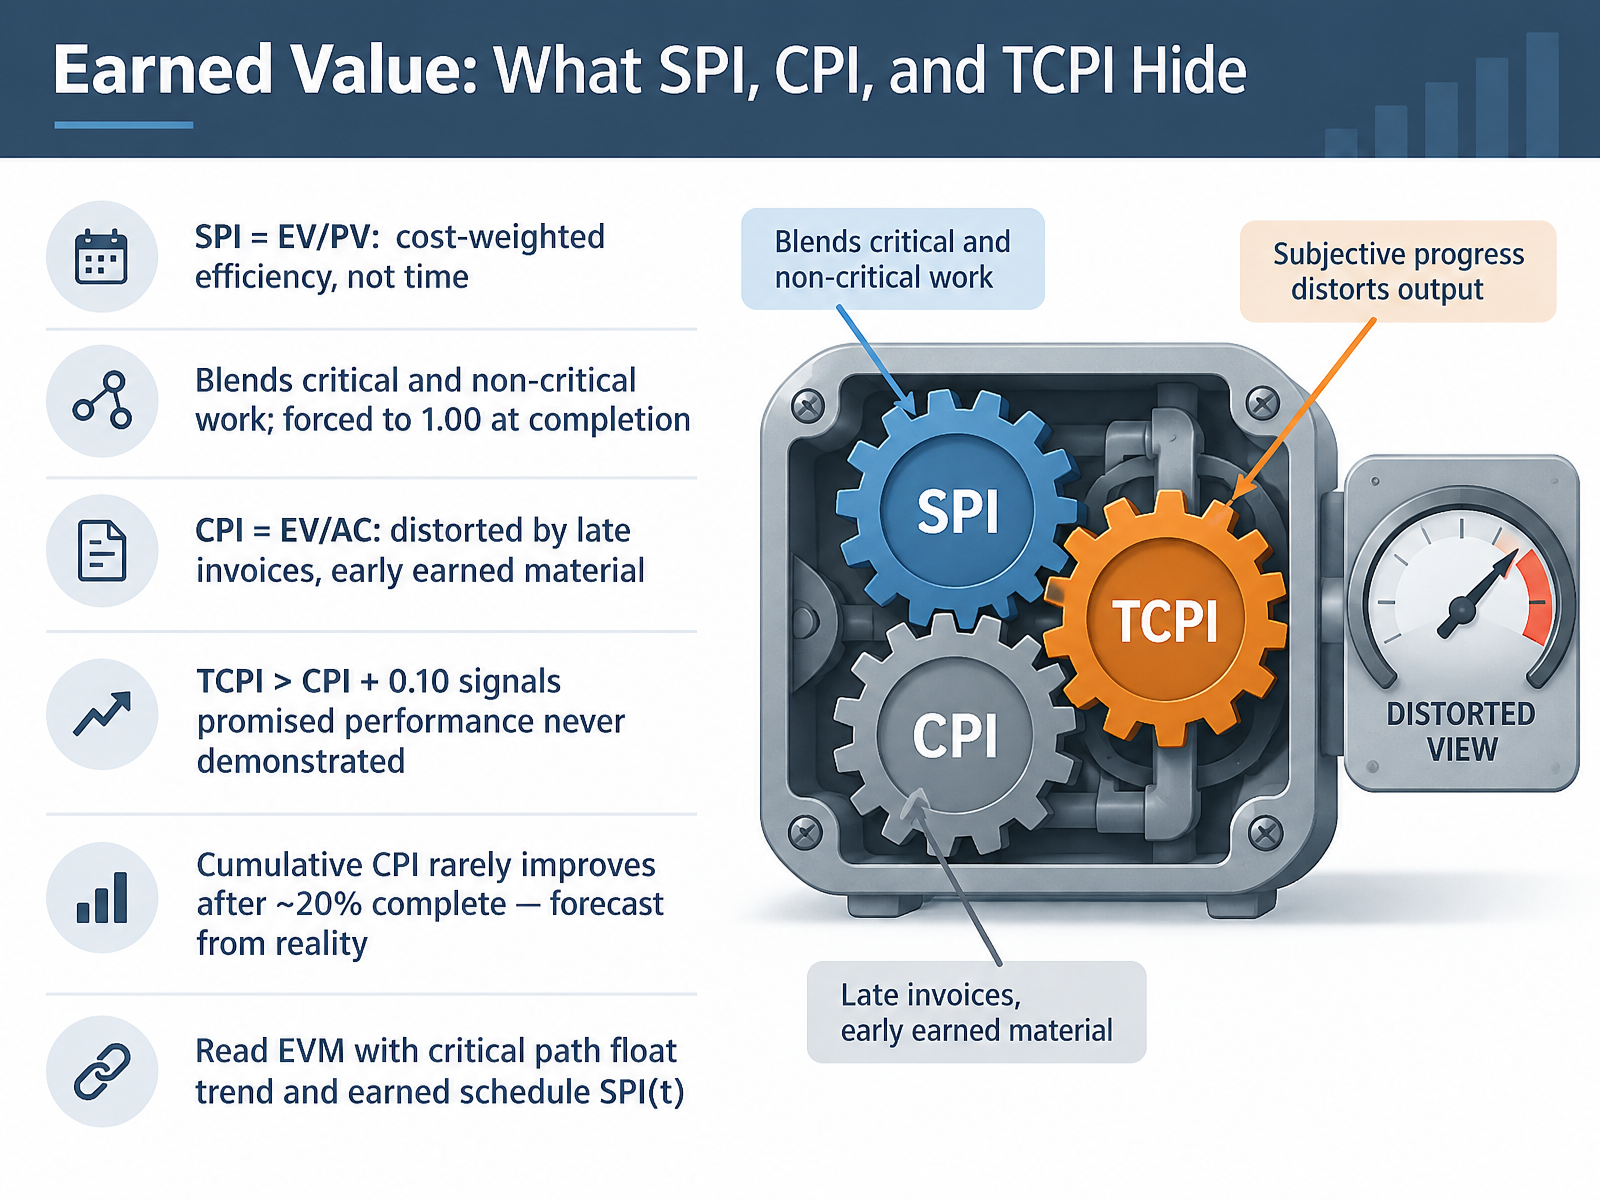
- 04Earned Value: What SPI, CPI, and TCPI HideLet's look at what earned value really tells you, and what it hides. The Schedule Performance Index equals Earned Value divided by Planned Value. It measures cost-weighted efficiency, not time. It blends critical and non-critical work, and it is forced toward one point zero zero as the project completes, no matter how late you actually finish. The Cost Performance Index equals Earned Value divided by Actual Cost. It is distorted by late invoices and by earned material that has not been installed. Now, the To-Complete Performance Index. When it exceeds your cumulative CPI by more than zero point one zero, that signals promised performance you have never demonstrated. And cumulative CPI rarely improves after about twenty percent complete. So forecast from reality, not from hope. Read earned value alongside critical path float trend and the earned schedule time-based SPI. This suggests using these ratios as signals, not verdicts. Next, we move to Forecasting Under Uncertainty: Ranges, Confidence, and Reference Classes.
 pmimontreal.orgmsesj.comapm.org.uk+22 min
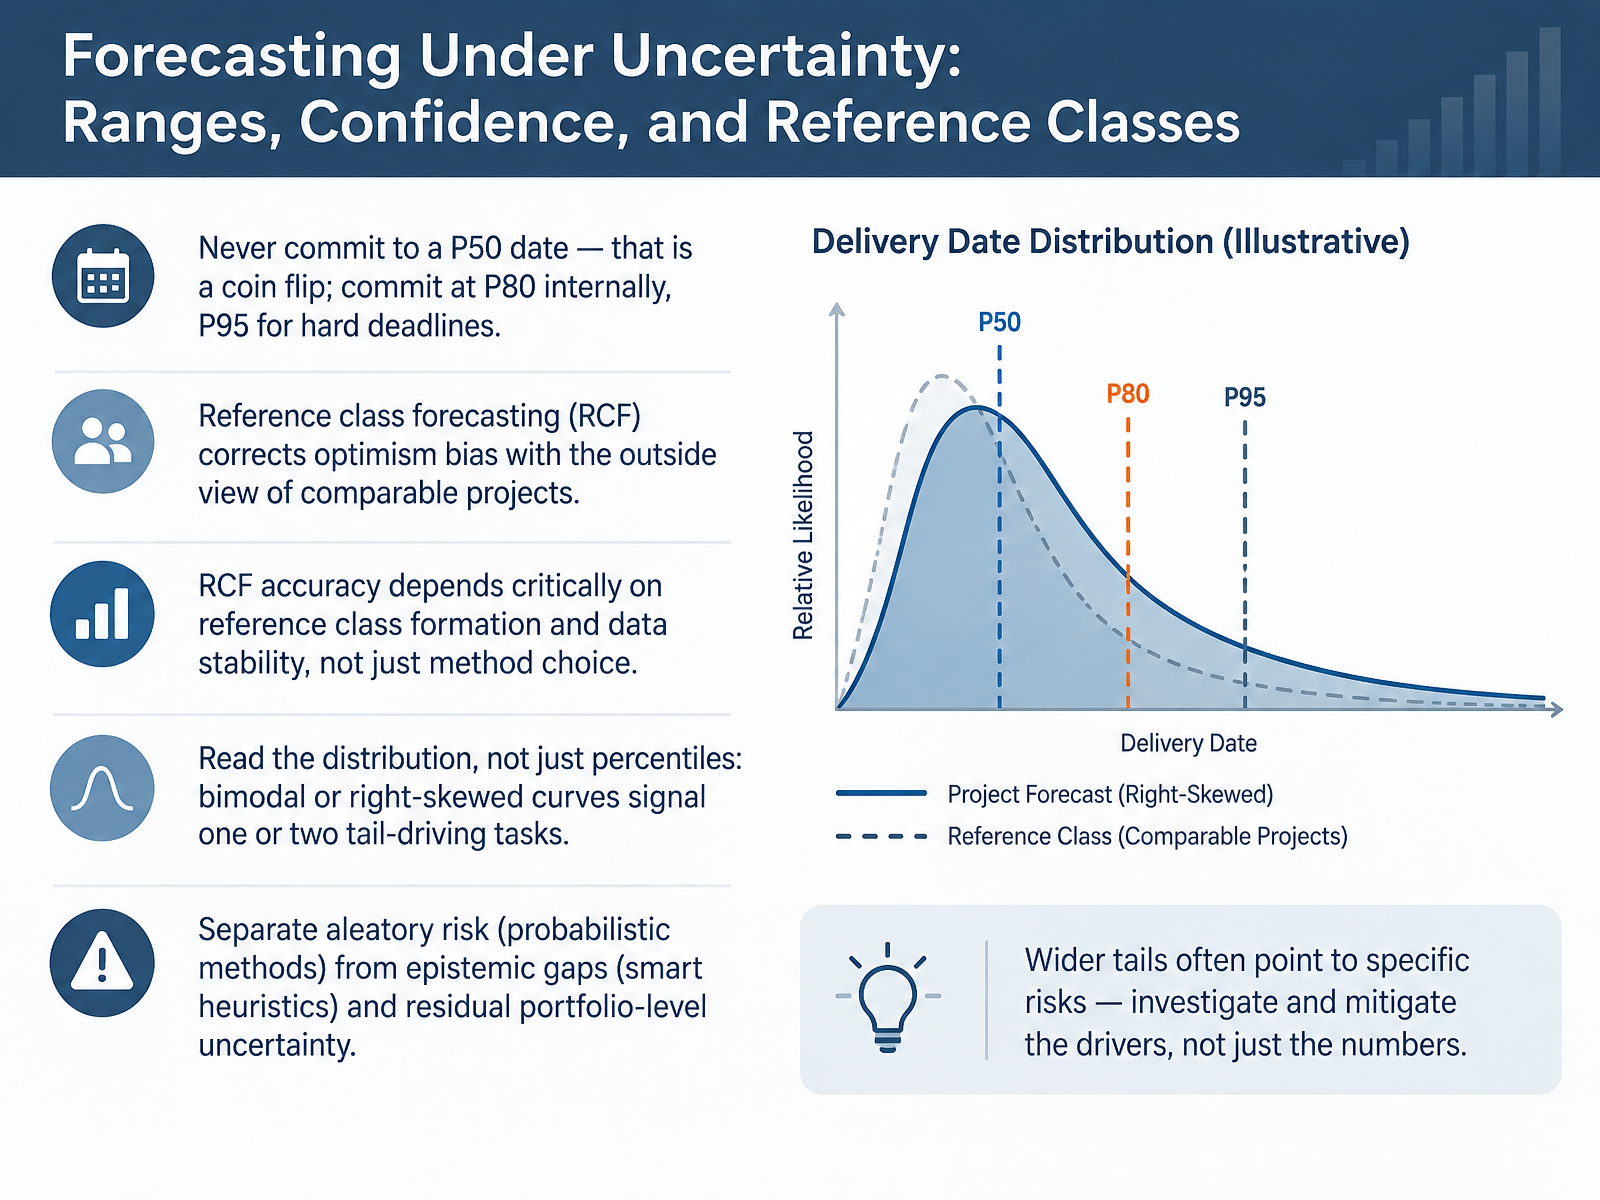
- 05Forecasting Under Uncertainty: Ranges, Confidence, and Reference ClassesLet's turn to forecasting under uncertainty, where ranges carry more information than any single date. First, never commit to a P50 date. P50 means a fifty percent chance of finishing on or before that date, so committing to it is a coin flip. P80 is the standard internal commitment. Use P95 for hard external deadlines. Second, reference class forecasting, or RCF, corrects optimism bias by applying the outside view of comparable past projects. But its accuracy depends on how you form that reference class and how stable the data is, not just on the method. Third, read the distribution, not only the percentiles. A bimodal or right skewed curve usually signals one or two tail driving tasks, and those become your primary risk drivers. Finally, separate aleatory risk, which probabilistic methods can model, from epistemic gaps, which need smart heuristics, and from residual portfolio level uncertainty, which is not a priced line item. Here is the takeaway. Commit at P80 internally, reserve P95 for contractual dates, and always state the baseline and data source behind the range. Next, we look at communicating uncertainty without losing sponsor trust.
 tandfonline.comtandfonline.comascelibrary.com+22 min
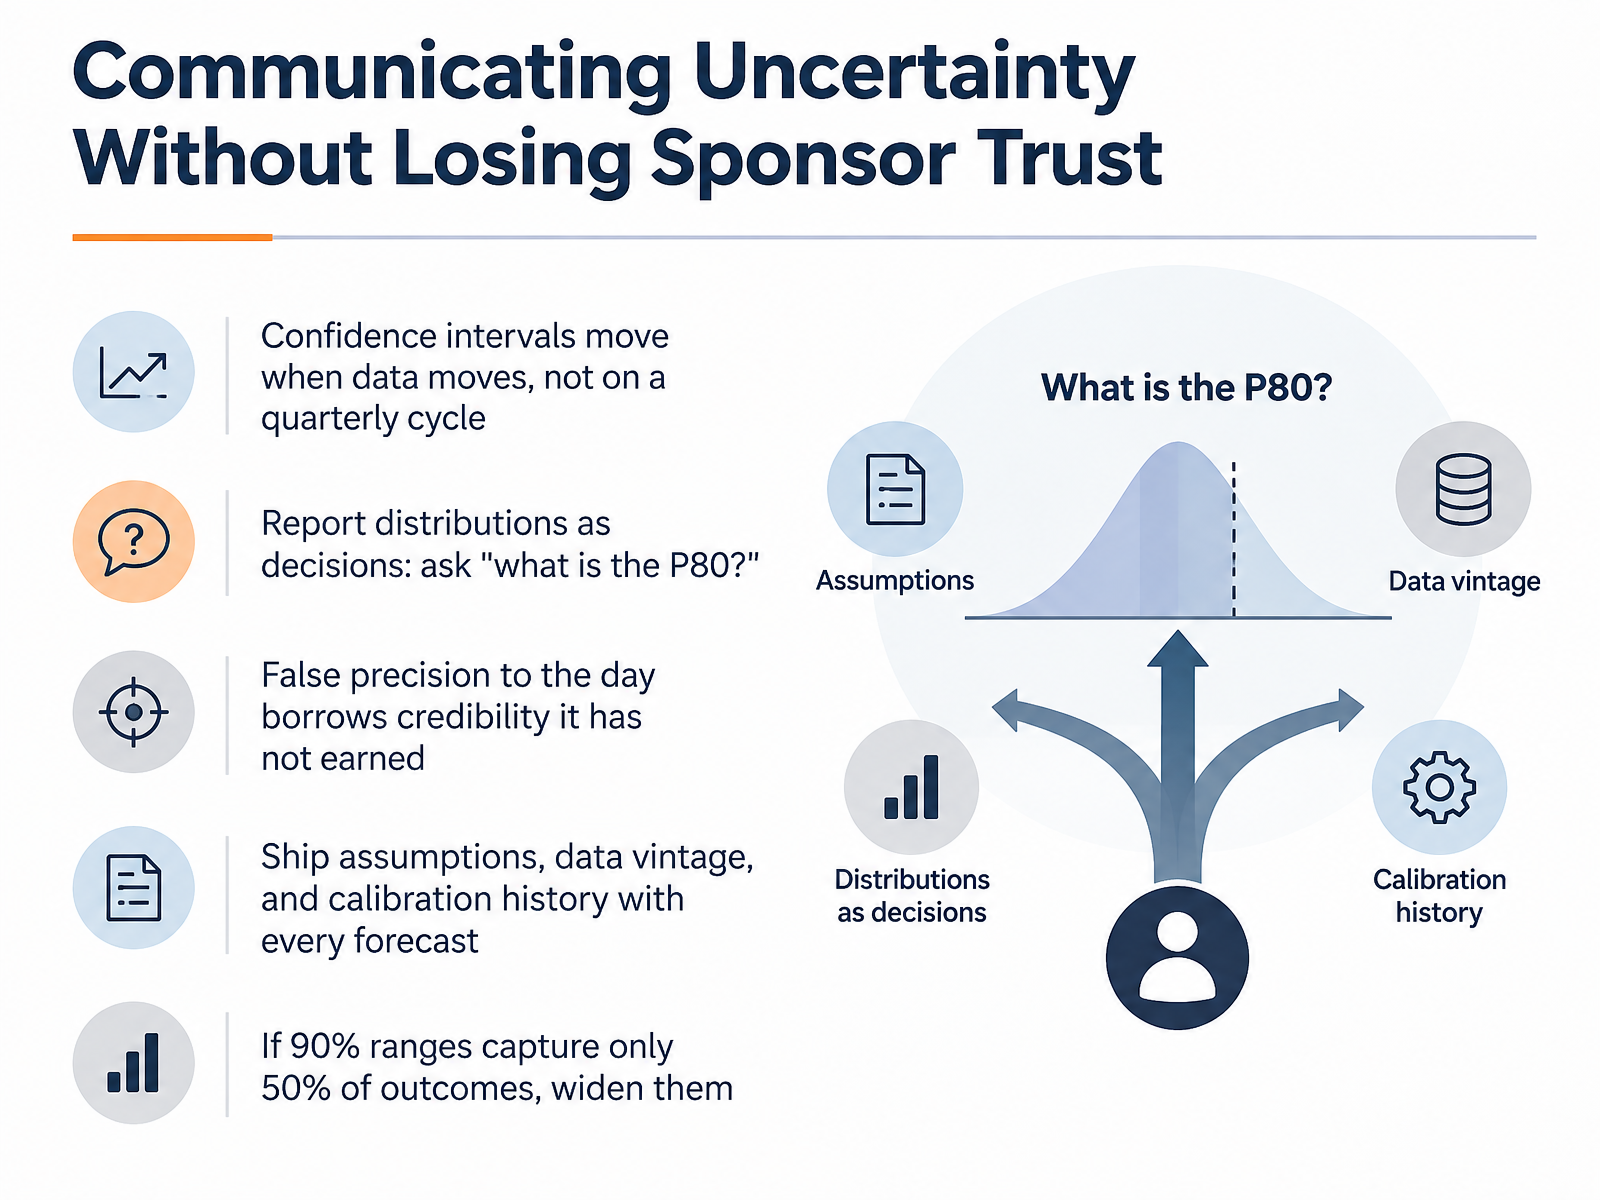
- 06Communicating Uncertainty Without Losing Sponsor TrustLet's talk about communicating uncertainty without losing sponsor trust. Confidence intervals move when data moves, not on a quarterly cycle. So when a supplier delay is logged on Tuesday, the P80 date should widen on Tuesday, not at the next review. A P80 is the date by which eighty percent of simulated runs finish. So report distributions as decisions. Teach your sponsors to ask, what is the P80? And avoid false precision to the day. A confidence interval reported to the exact date, built on unvalidated estimates, borrows credibility it has not earned. Ship assumptions, data vintage, and calibration history with every forecast. Then check your own accuracy. If your ninety percent ranges capture only fifty percent of outcomes, you are overconfident. Widen them. Next, we look at flow metrics and velocity, and how to interpret them without misuse.
 docs.trueppm.comleed.dkpmexams.com+22 min
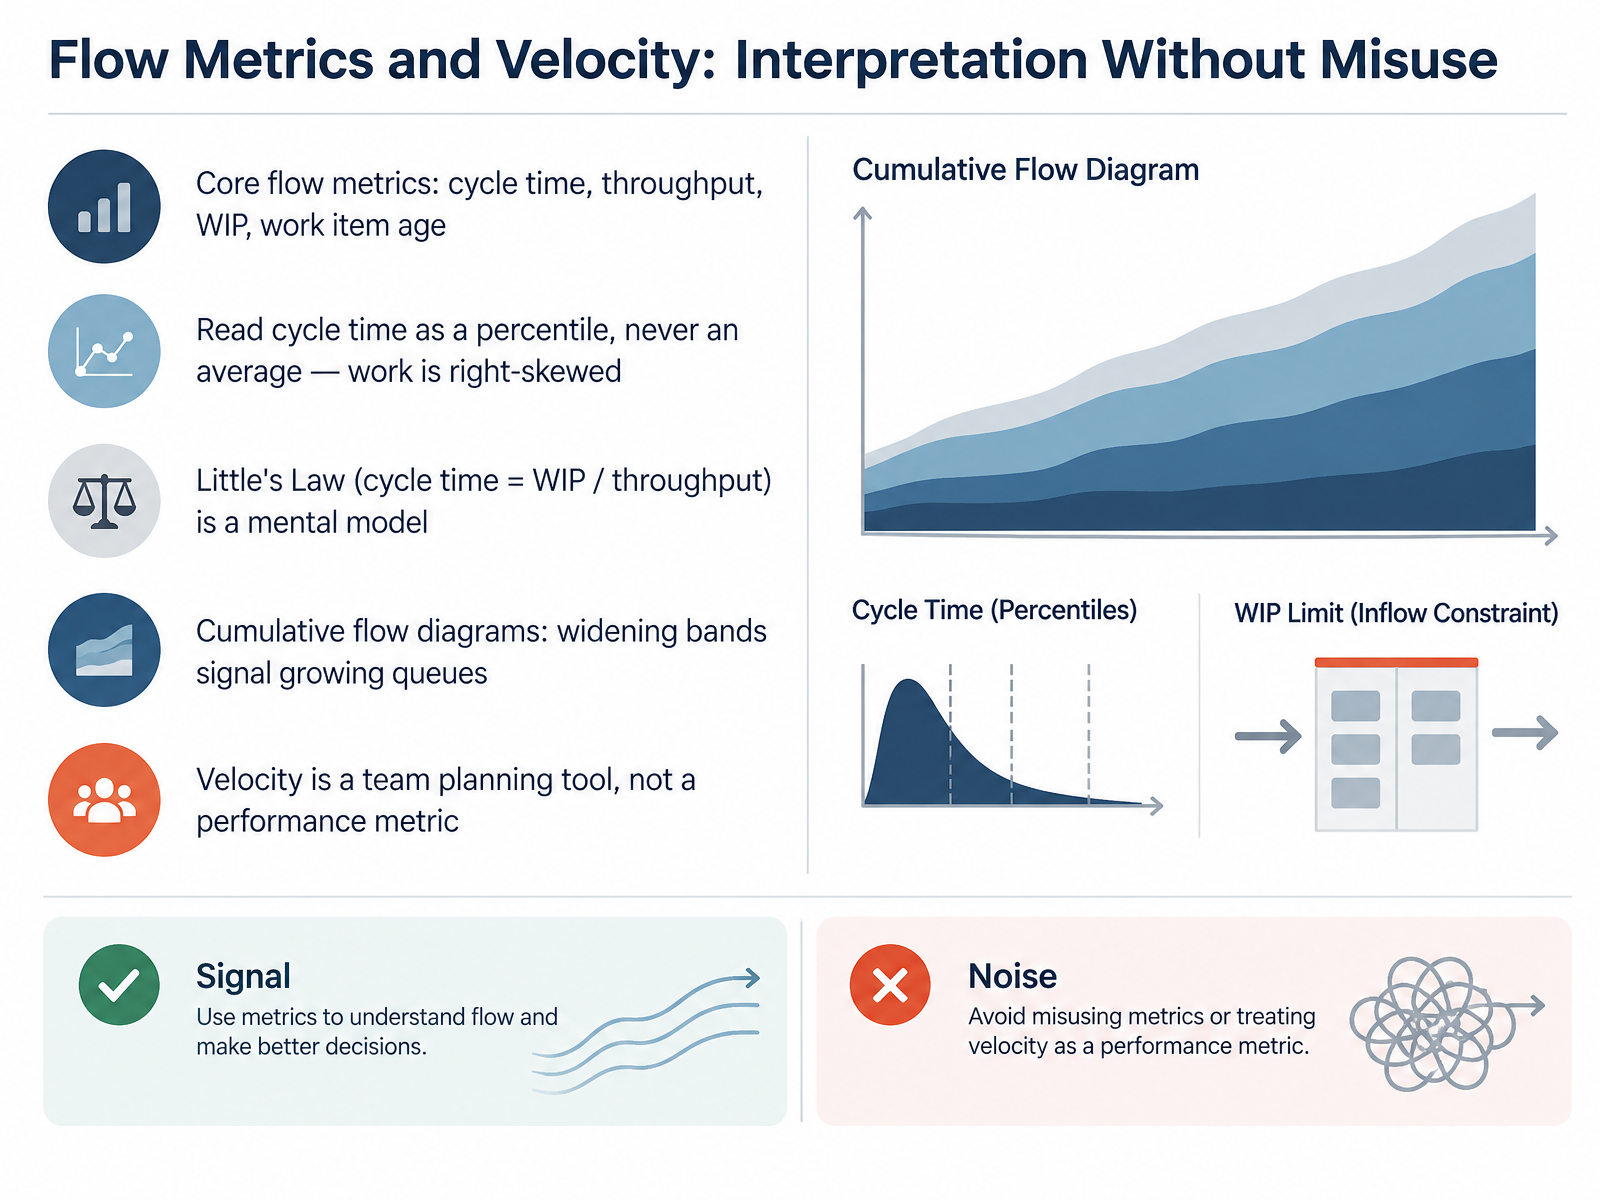
- 07Flow Metrics and Velocity: Interpretation Without MisuseLet's move to flow metrics and how to interpret them without misusing them. Four measures carry most of the weight: cycle time, throughput, work in progress, and work item age. Cycle time is the elapsed time from when work starts to when it finishes. Throughput counts items finished per unit of time, usually per week. Work in progress is the count of items started but not finished. Work item age is how long an in-progress item has been open right now. Read cycle time as a percentile, never an average. Work is right-skewed. A few slow items pull the mean above what most items experience. So report something like, eighty-five percent of our items finish within nine days. That sentence names the share, the window, and the comparison point. Little's Law says average cycle time equals average work in progress divided by average throughput. Use it as a mental model, not a dashboard tile. It explains why limiting work in progress shortens cycle time. On a cumulative flow diagram, widening bands signal growing queues. Parallel bands suggest stable flow. Finally, velocity is a team planning tool, not a performance metric. Comparing velocity across teams is not defensible, because a point is a judgment. Next, we look at analysis and storytelling, separating signal from noise.
 pmi.orgpmi.orgpmi.org+22 min
- 08Analysis and Storytelling: Signal, Noise, and NarrativeLet's look at analysis and storytelling, how to separate signal from noise.
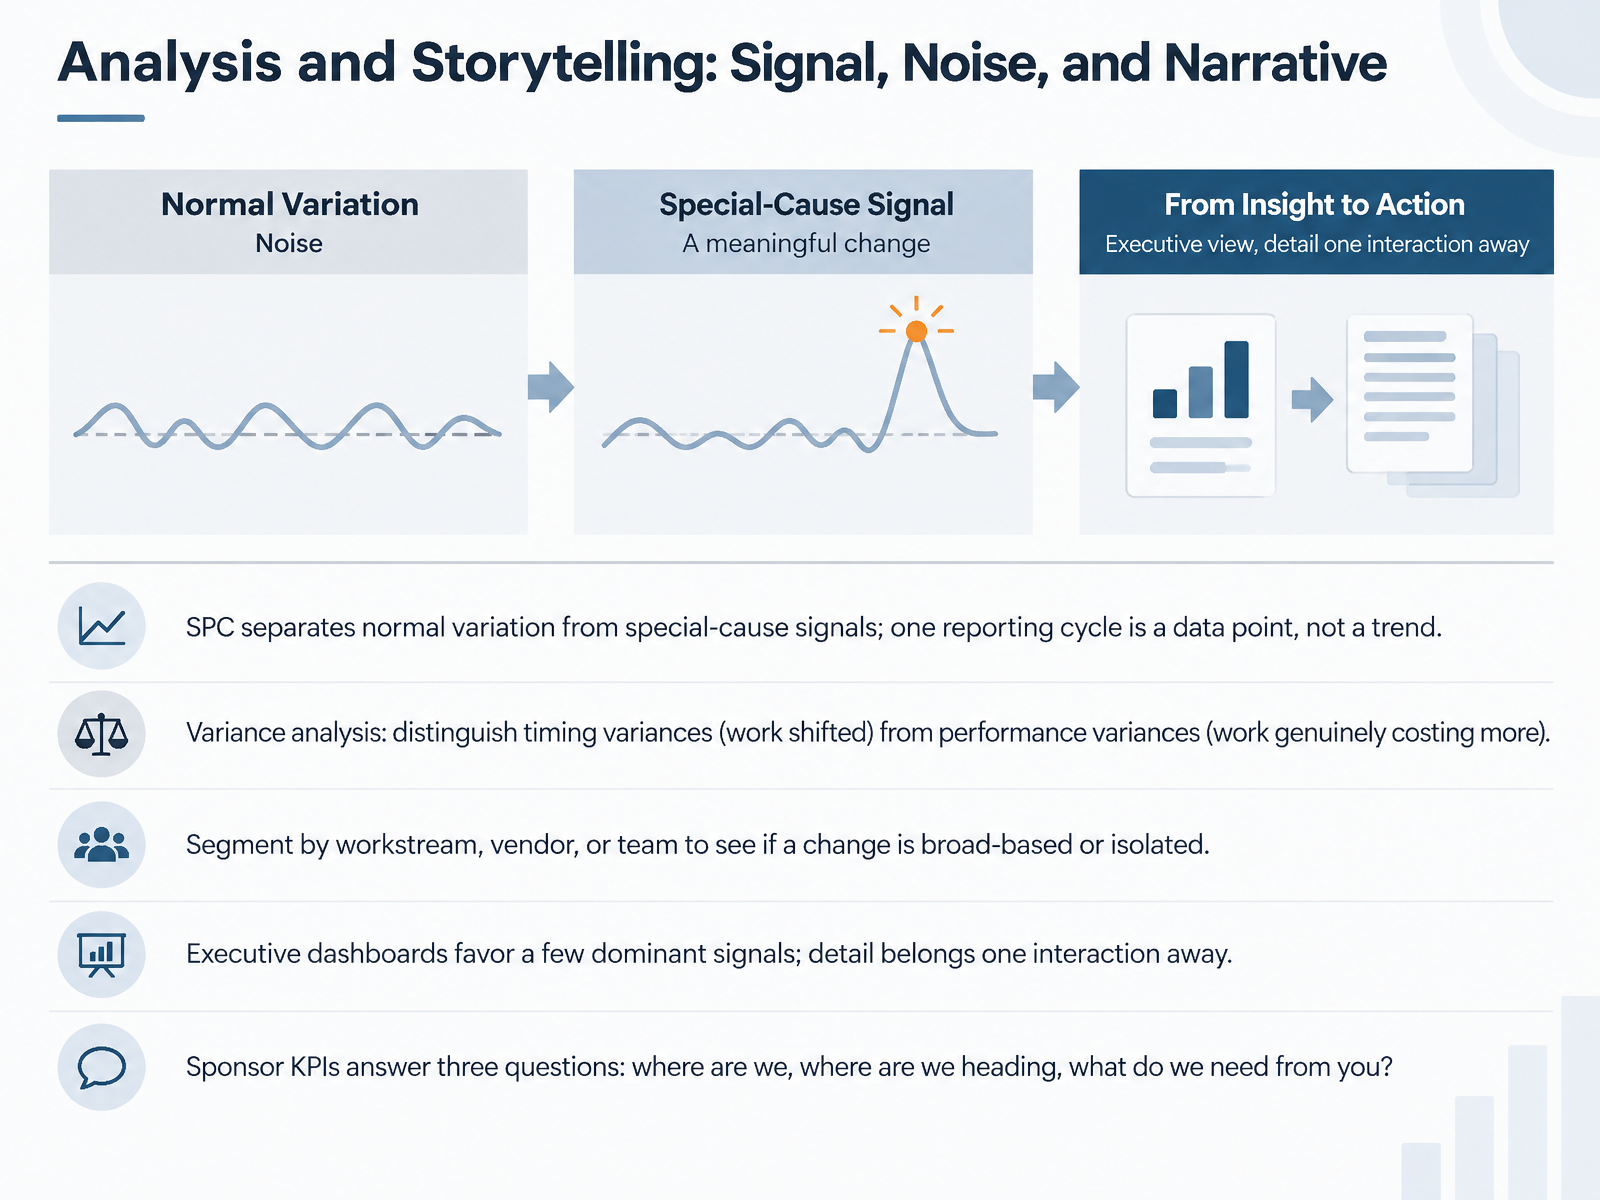
Statistical process control separates normal variation from special-cause signals. One reporting cycle is a data point, not a trend. With a cost performance index, which is earned value divided by actual cost, a single reading of zero point eight eight tells you little. The same index moving from zero point nine six to zero point nine two to zero point eight eight over three periods tells a story.
In variance analysis, distinguish timing variances, where work simply shifted between periods, from performance variances, where work is genuinely costing more. Segment by workstream, vendor, or team. That shows whether a change is broad-based or isolated.
Executive dashboards favor a few dominant signals. Detail belongs one interaction away. Sponsor KPIs answer three questions: where are we, where are we heading, and what do we need from you?
Next, we turn to governance, incentives, and metric integrity.
 leed.dkpmexams.compump.academy+22 min
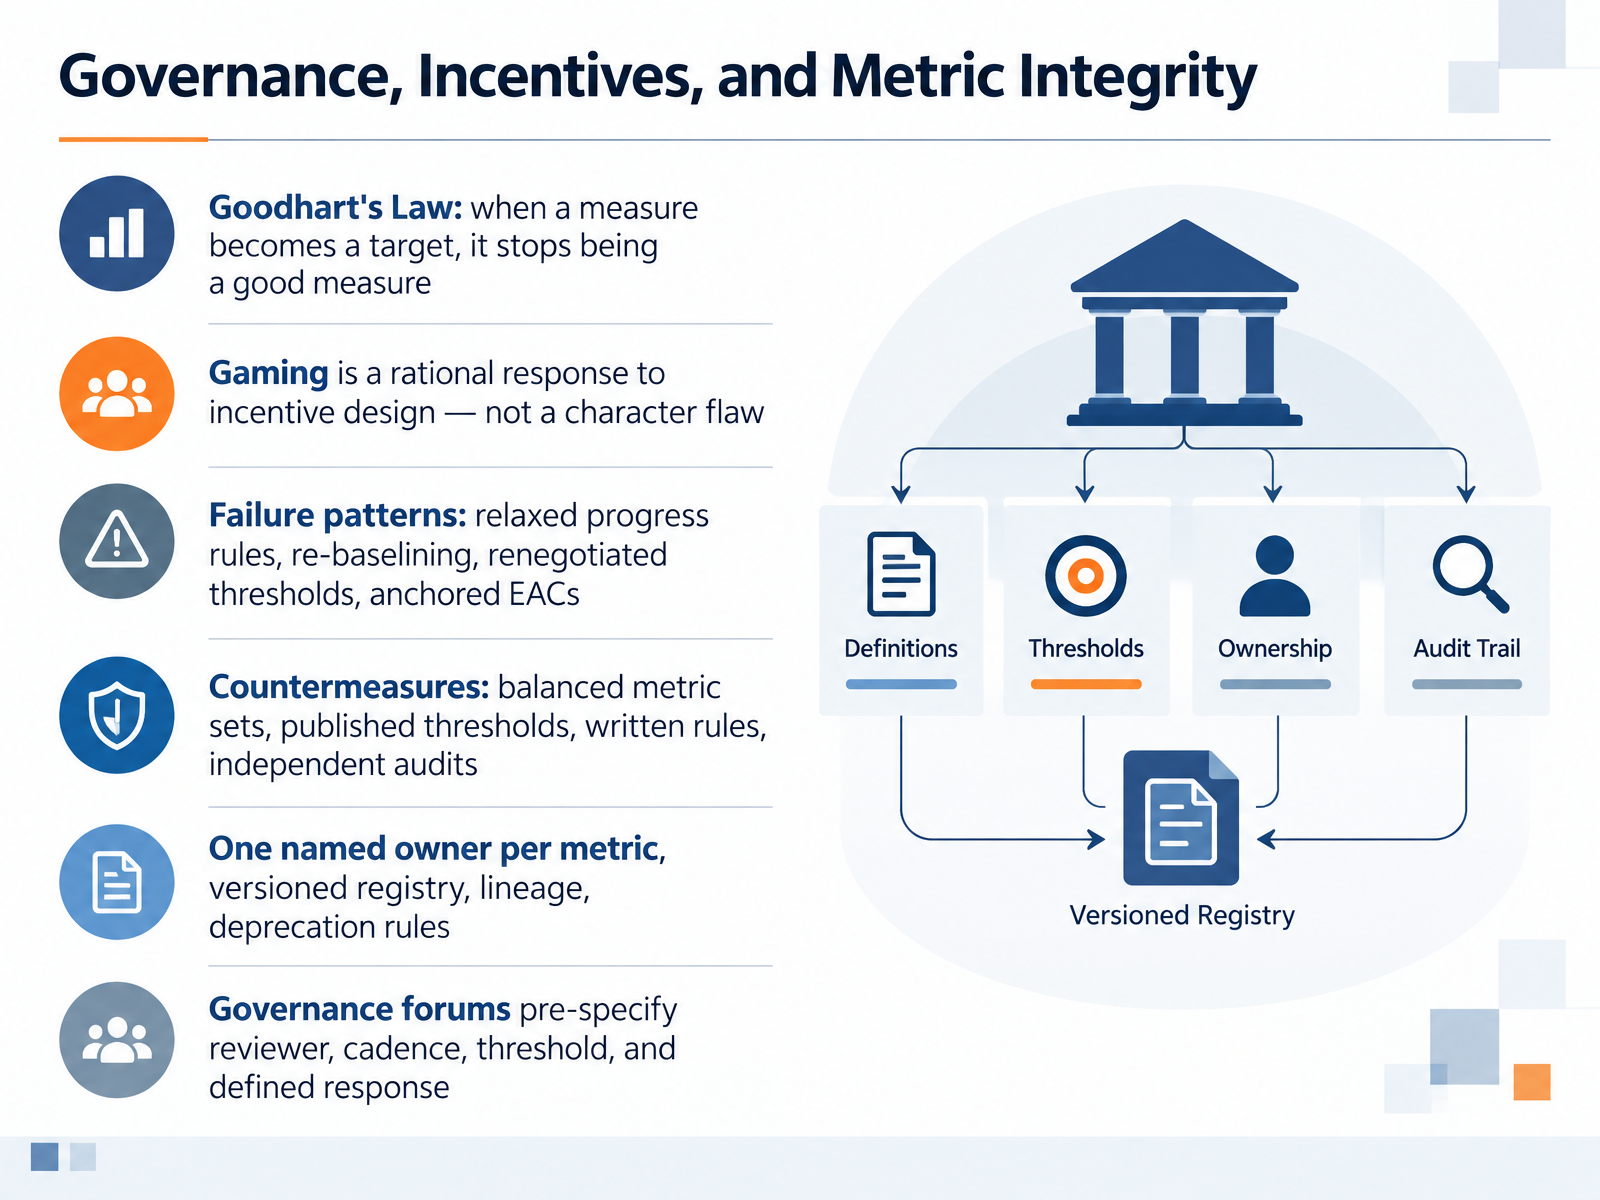
- 09Governance, Incentives, and Metric IntegrityLet's talk about governance and metric integrity. Goodhart's Law says it plainly: when a measure becomes a target, it stops being a good measure. And gaming is a rational response to incentive design, not a character flaw. Four failure patterns recur. Progress rules quietly relaxed to lift earned value. Re-baselining to reset embarrassing variances. Thresholds renegotiated the moment they are crossed. And estimates at completion anchored back toward budget, month after month, until reality arrives all at once. Each is a measurement integrity failure before it is a delivery failure. The countermeasures are structural. Use balanced metric sets. Publish thresholds in advance, so ratings stay mechanical. Put measurement rules in writing and audit them. Give every metric one named owner, a versioned registry entry, and traceable lineage, with deprecation rules agreed before you need them. And have governance forums pre-specify the reviewer, the cadence, the threshold, and the defined response. That last point matters: a threshold with no pre-agreed response is just a number. Next, AI-Augmented Metrics: Opportunities and Guardrails.
 leed.dkpmexams.compump.academy+22 min
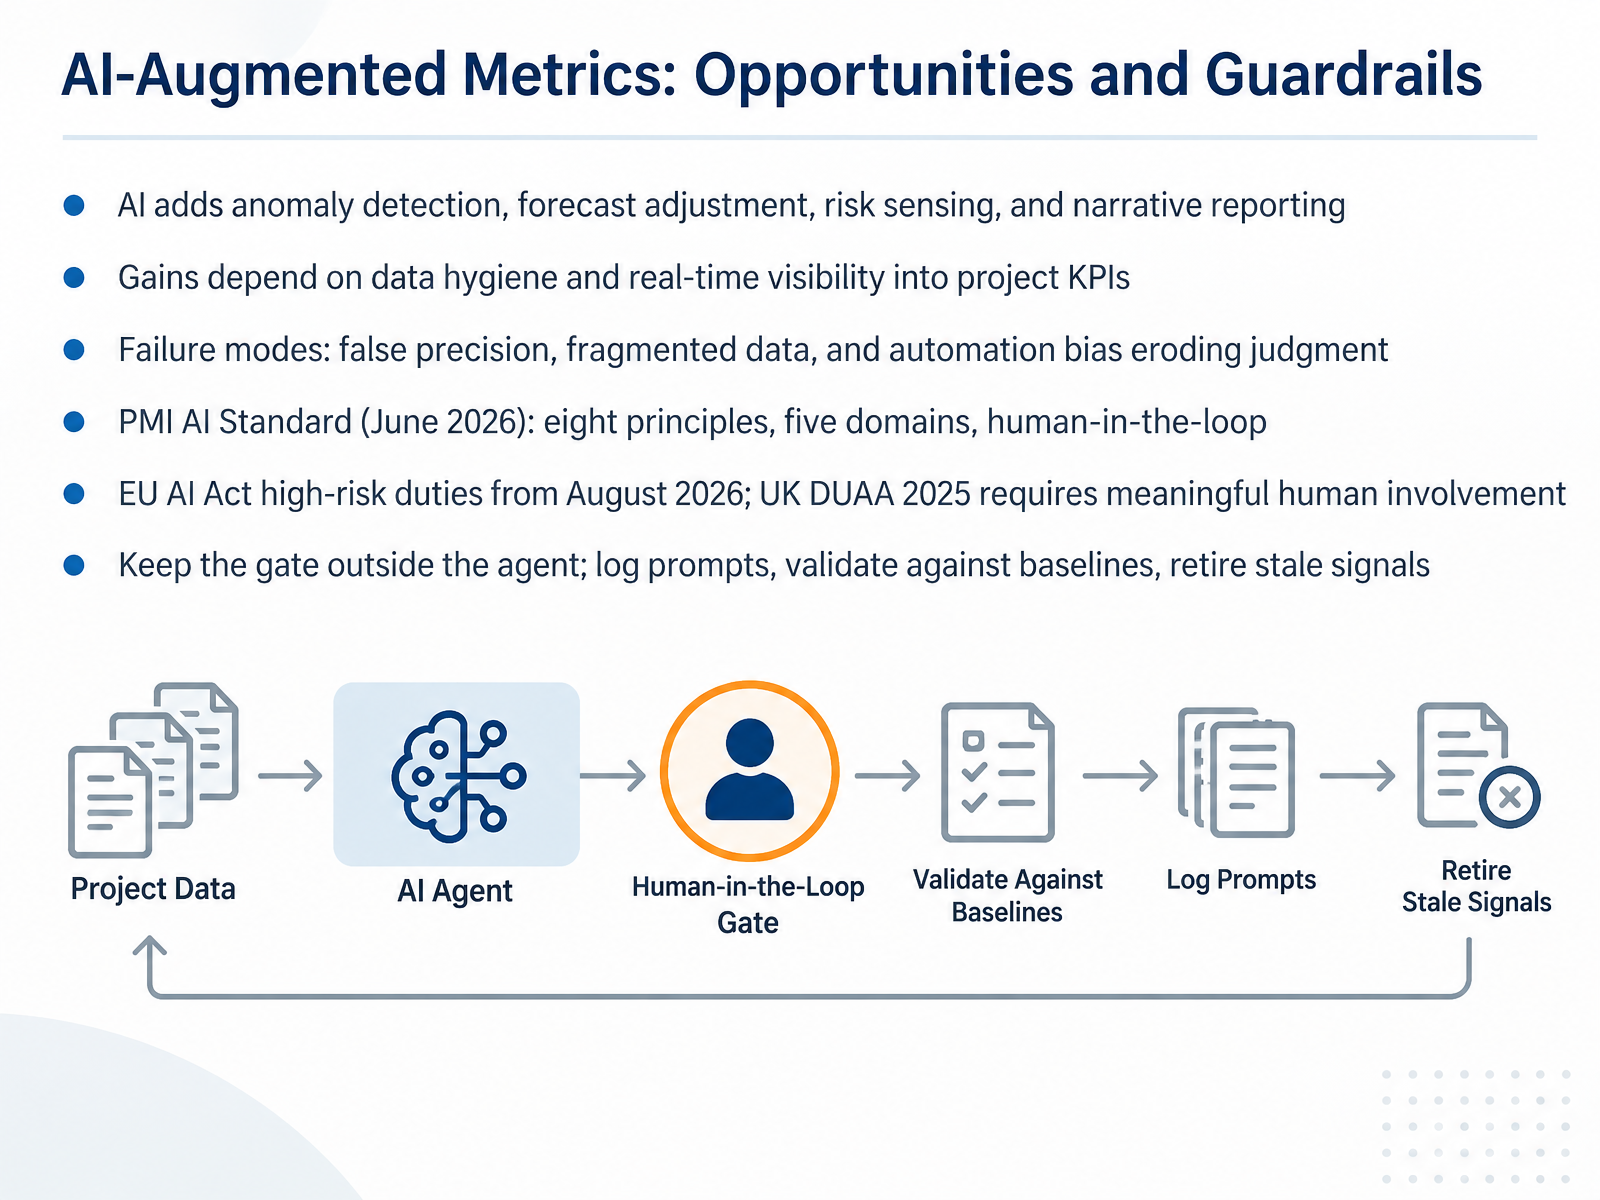
- 10AI-Augmented Metrics: Opportunities and GuardrailsNow let's turn to AI-augmented metrics, and where the real opportunities and guardrails sit. AI can add four practical capabilities: anomaly detection, forecast adjustment, risk sensing, and narrative reporting. The gains, though, depend on data hygiene and real-time visibility into your project KPIs, which means key performance indicators. If your baseline is stale or your data is fragmented, the AI simply automates a weak signal. Watch for three failure modes: false precision, fragmented data, and automation bias, which is the tendency to over-trust machine output and let your own judgment erode. Two frameworks matter here. The PMI AI Standard, published in June 2026, sets out eight principles, five performance domains, and human-in-the-loop practices. And from August 2026, the EU AI Act applies high-risk duties, while the UK Data Use and Access Act 2025 requires meaningful human involvement for significant AI-assisted decisions. The practical rule: keep the gate outside the agent. Log every prompt, validate outputs against your baselines, and retire signals that no longer predict performance. That keeps the AI accountable and your decisions defensible. Next, let's apply this in a case clinic: interpreting a real dashboard under pressure.
 pmi.orgpmi.orgpmi.org+22 min
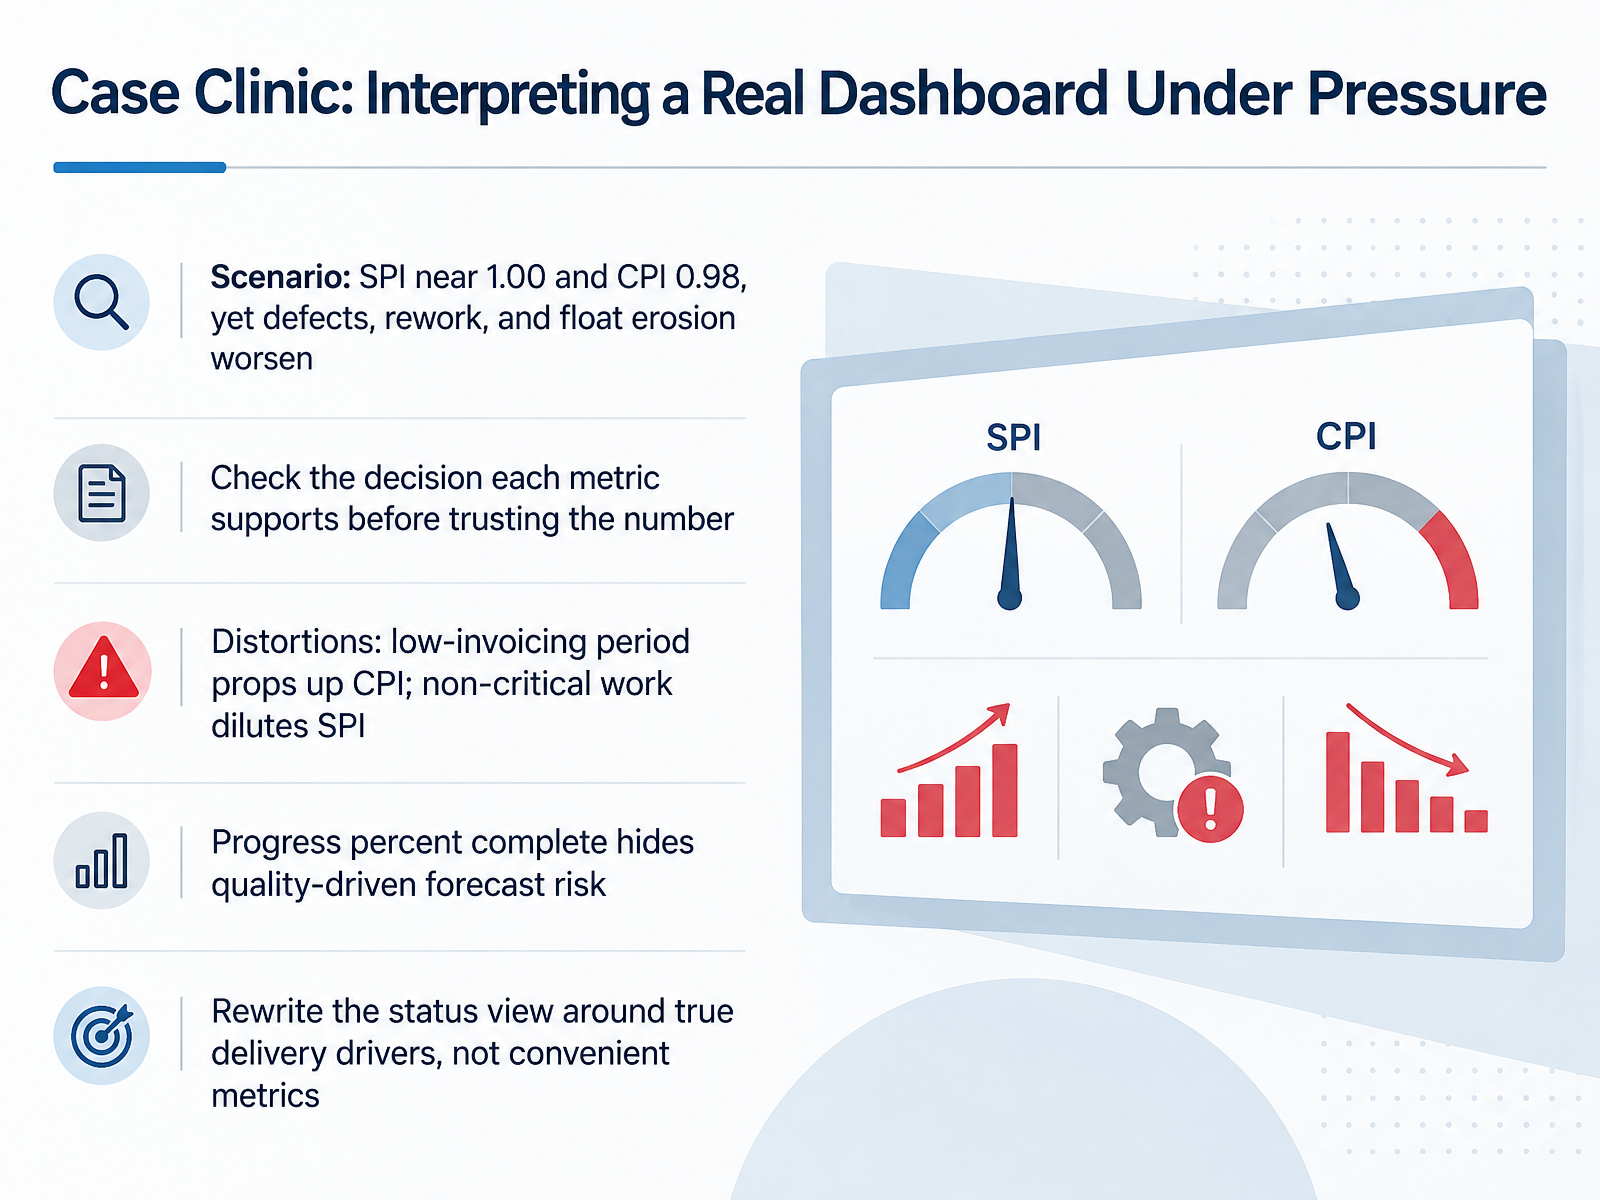
- 11Case Clinic: Interpreting a Real Dashboard Under PressureConsider a dashboard under pressure. The Schedule Performance Index sits near one point zero zero, and the Cost Performance Index at zero point nine eight. Both look calm. Yet defects, rework, and float erosion are all worsening. This is the dangerous case. Before you trust a number, ask what decision it supports. Then check its distortions. A low-invoicing period can prop up the Cost Performance Index, because recorded spend lags real spend. Non-critical work can dilute the Schedule Performance Index, because the ratio blends every task by dollar weight, not by the critical path. And progress percent complete hides quality-driven forecast risk. So rewrite the status view around true delivery drivers: float trend, rework rate, readiness. Not the metrics that are simply convenient. Next, we turn to a five-step discipline for interpreting metrics.
 leed.dkpmexams.compump.academy+22 min
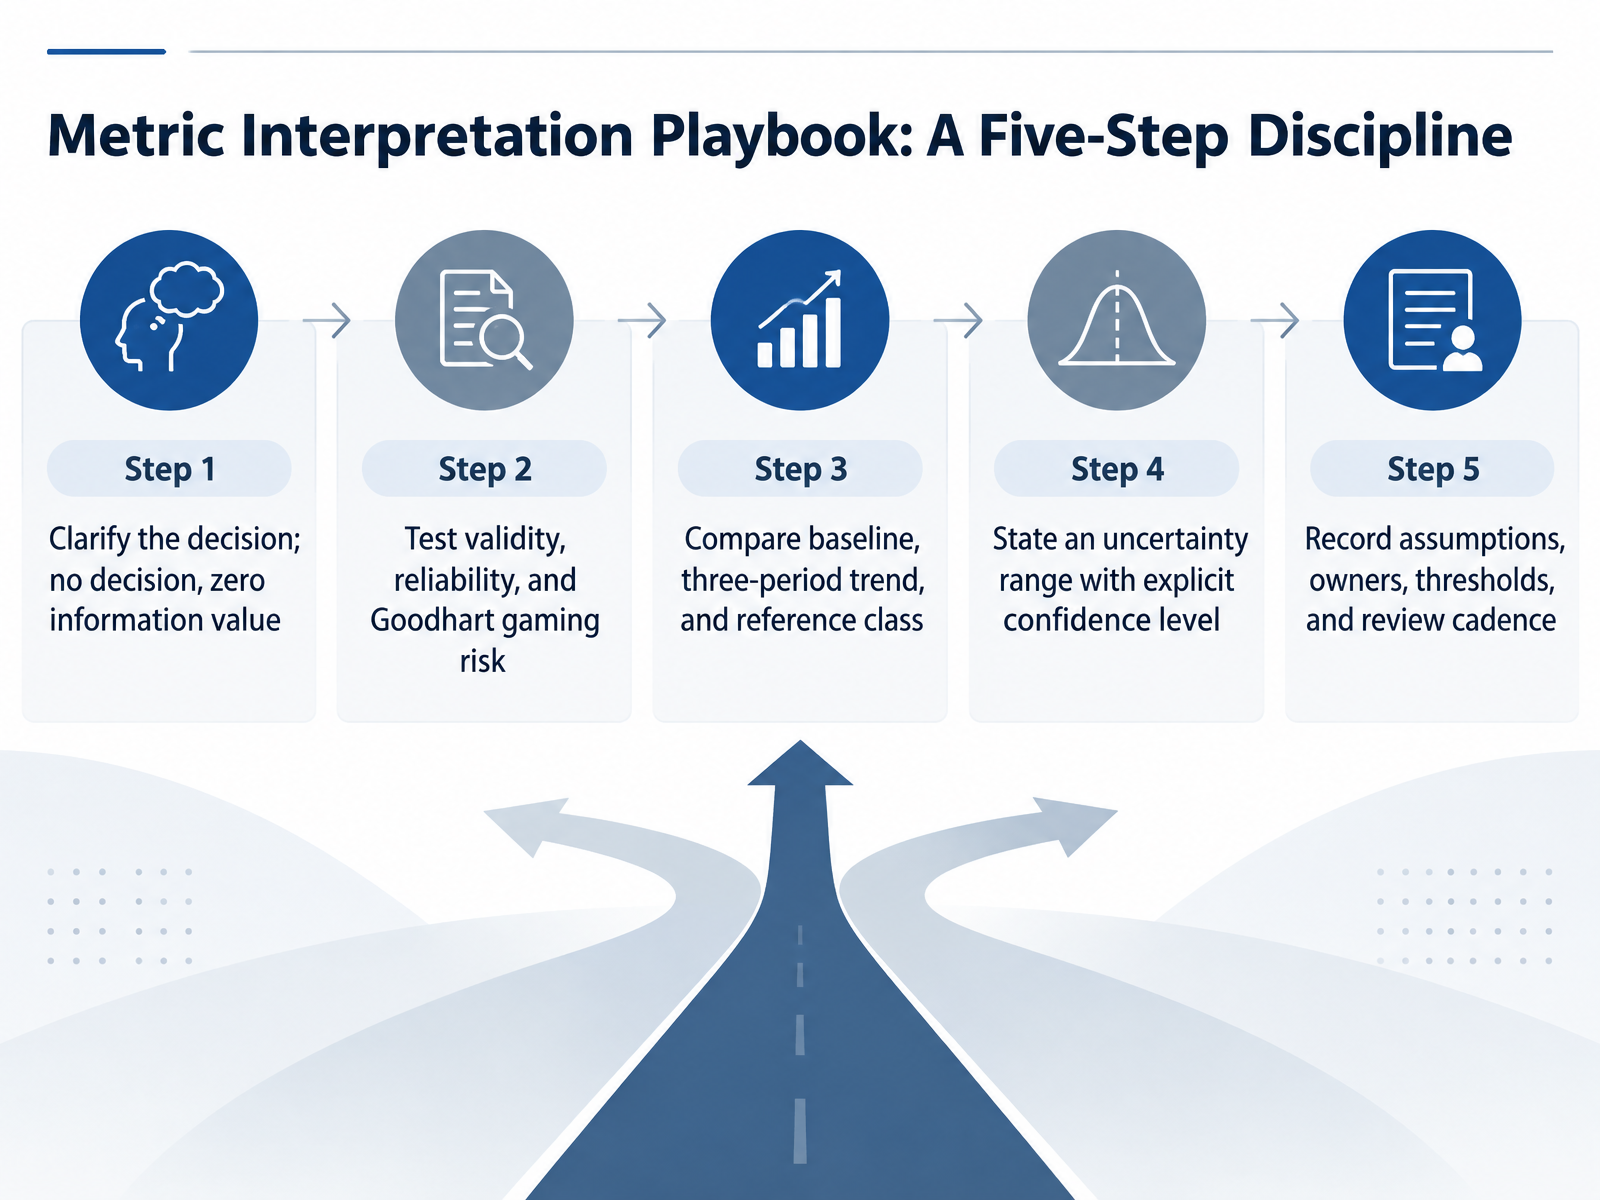
- 12Metric Interpretation Playbook: A Five-Step DisciplineLet's turn all of this into a repeatable discipline. Five steps. Step One: clarify the decision. If a metric would not change any choice you might make, its information value is zero, however impressive the chart looks. Step Two: test validity, reliability, and Goodhart risk. When a measure becomes a target, it ceases to be a good measure, so ask how this number could be gamed. Step Three: compare a baseline, a three-period trend, and a reference class. A single data point is a fact. A sequence is a narrative. Step Four: state an uncertainty range with an explicit confidence level, for example a P80 date, meaning an eighty percent chance of finishing on or before it. Step Five: record assumptions, owners, thresholds, and review cadence. A KPI without an owner and a response threshold is decoration. Together, these five steps are how you make a metric defensible. Applying them is next.
 leed.dkpmexams.compump.academy+22 min
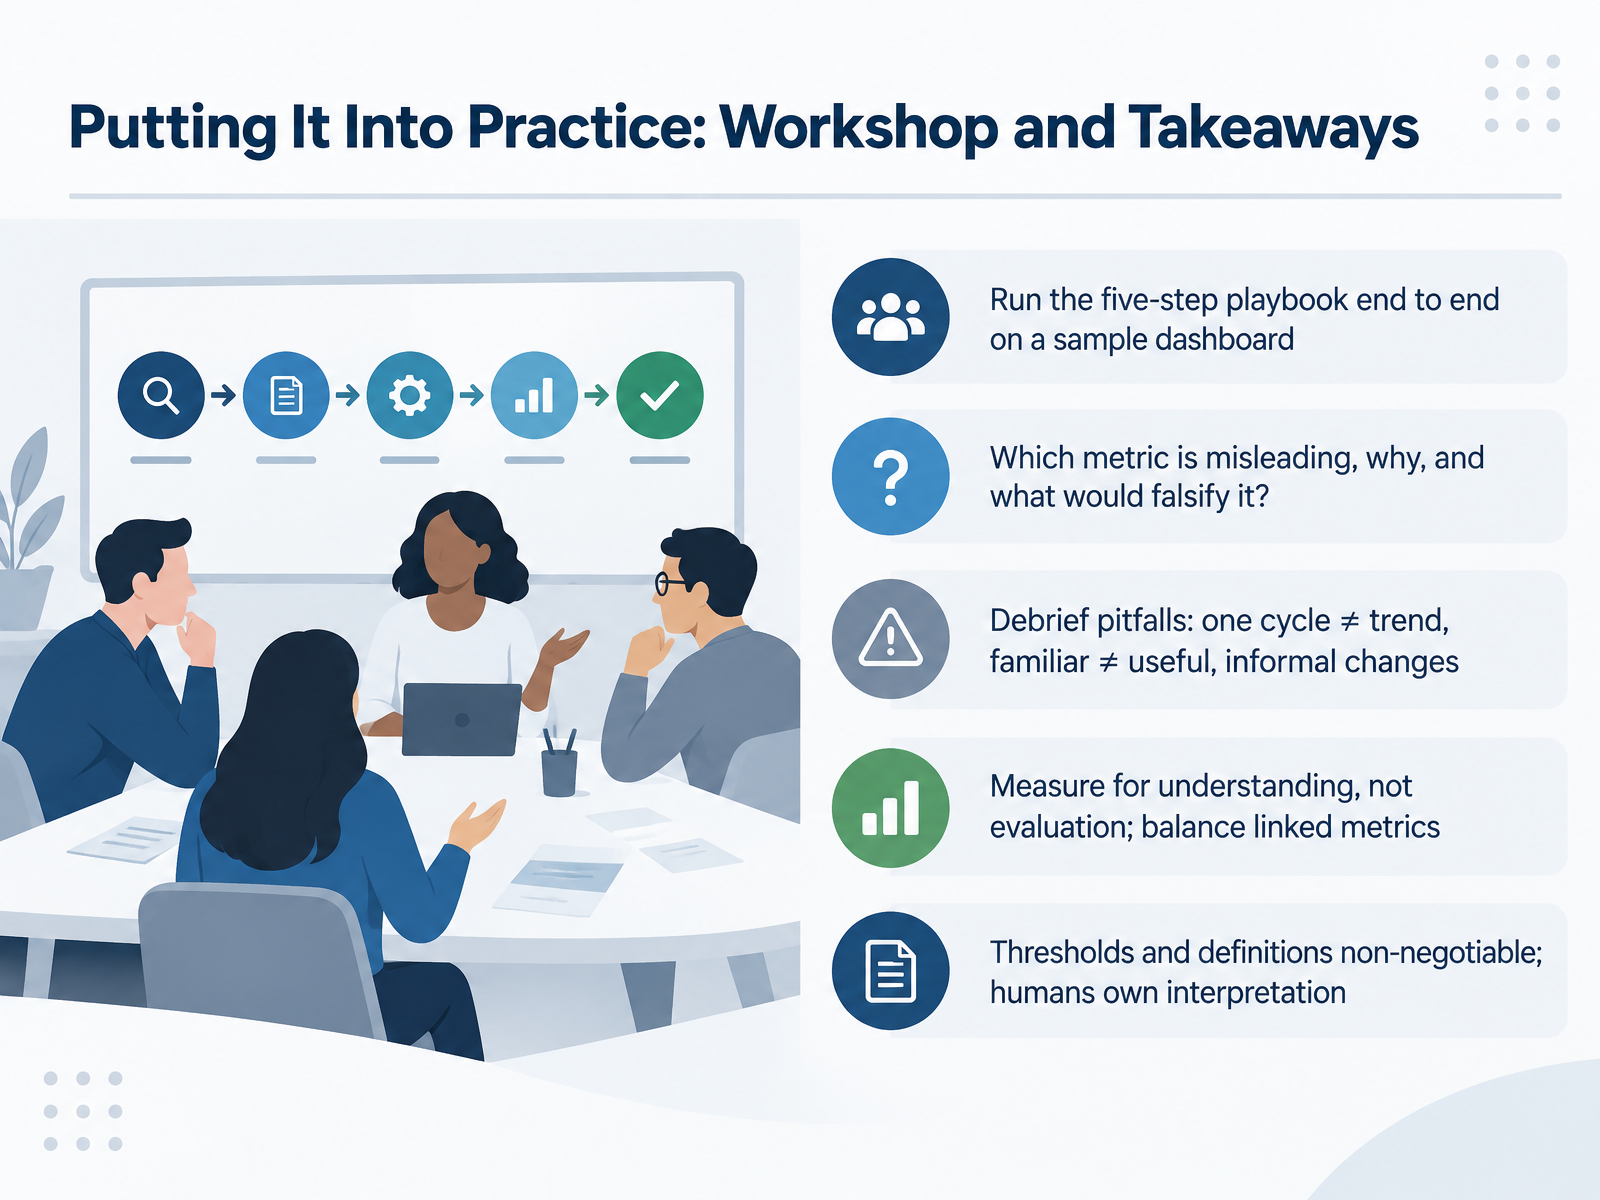
- 13Putting It Into Practice: Workshop and TakeawaysLet's bring this together. Run the five-step playbook end to end on one sample dashboard. Then ask the sharpest question in this course: which metric is misleading, why, and what evidence would falsify your reading? That word, falsify, matters. A defensible interpretation is one you can test against reality, not one you believe.
In the debrief, watch four pitfalls. One cycle is not a trend, so read at least three periods. Familiar is not the same as useful, so retire metrics whose decisions have passed. Informal changes break trust, so document every definition shift. And remember Goodhart's law: when a measure becomes a target, it stops being a good measure.
Measure for understanding, not evaluation. Balance linked metrics, like speed against quality, so gaming one exposes distortion in the other. Thresholds and definitions are non-negotiable. Humans own interpretation.
You now have a method you can defend. Thank you for your attention, and keep measuring with intent.
 leed.dkpmexams.compump.academy+22 min
Take the deck with you
Download this course as a file — free, no sign-up needed.
- PDF handoutEvery slide page, ready to print or share.14 pages · 3.0 MBDownload
- Narrated PowerPointThe deck that presents itself — every slide carries the digital human's narration video.14 pages · 13.1 MBDownload
- PowerPoint slidesThe full deck as a .pptx — open it in PowerPoint, Keynote, or Google Slides.14 pages · 2.9 MBDownload
Free to use in your own training — please keep the PersonWise credit page at the end.
Have your own deck? Turn it into a course
Sources consulted
Web sources consulted while building this course.
- PMI Lexicon of Project Management Terms — pmi.org
- The Standard for Artificial Intelligence in Portfolio, Program and Project Management — pmi.org
- What’s new in the updated PMP® exam? — pmi.org
- PMP 2026 Measuring, Analyzing, and Updating Project Metrics to Guide Action | PM Exams — pmexams.com
- The State of Project Management 2026 — pmsolutions.com
- APM Project 2026 01 Spring — leed.dk
- How to Design Good KPIs - PuMP Academy — pump.academy
- Kpi Project Management – Project Management Formula — projectmanagementformula.com
- Project Controls KPIs Explained: The Metrics That Actually Matter — pmmilestone.org
- Beyond Performance Indicators: Better Interpreting CPI and SPI in Complex Infrastructure Projects | PMI Montréal — pmimontreal.org
- Analysis of the Limitations of the Earned Value Management Method and Evaluation of Modern Improvement Approaches in Project Management | Management Strategies and Engineering Sciences — msesj.com
- Why earned value alone is not predictive — and how leaders should use it better — apm.org.uk
- SPI and CPI Interpretation: Three Ways They Mislead You — onplana.com
- Traditional EV Performance Indices & Late-Pr | Free Guide 2026 | OpenExamPrep — open-exam-prep.com
- Reference class forecasting: promises, problems, and a ... — tandfonline.com
- From reference class forecasting to decomposed contingency in infrastructure projects — tandfonline.com
- Integrating Machine Learning and Reference Class Forecasting for Construction Risk Contingency Prediction | Proceedings | Vol , No — ascelibrary.com
- Reducing risks in megaprojects: The potential of reference ... — sciencedirect.com
- Practical Application and Empirical Evaluation of Reference Class Forecasting for Project Management — journals.sagepub.com
- Monte Carlo | TruePPM — docs.trueppm.com