Statistics Practice Problems
Begin
14 pages · ~28 min
Statistics Practice Problems
Practice statistics with interactive problems designed to build analytical skills for learners seeking hands-on experience in data interpretation and statistical reasoning.
What you’ll learn
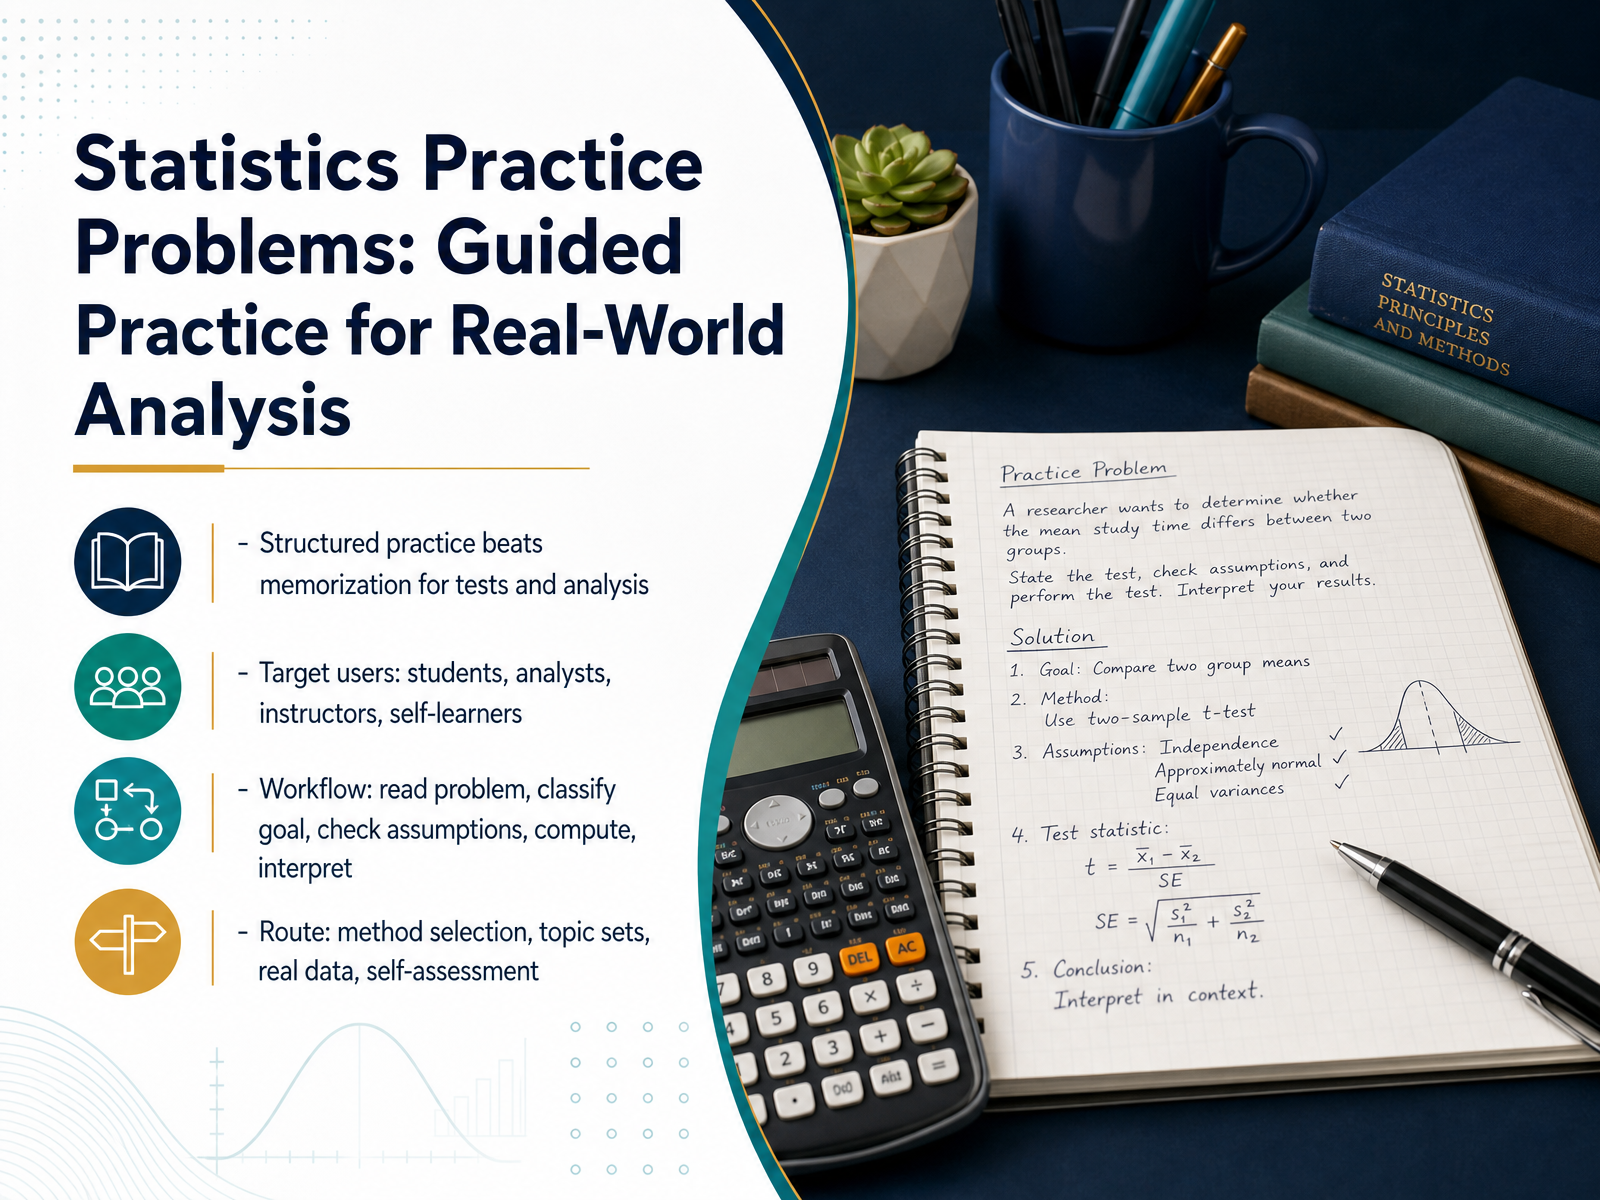
- 01Statistics Practice Problems: Guided Practice for Real-World AnalysisWelcome to Statistics Practice Problems. This course is built for students, analysts, instructors, and self-learners who want to move beyond memorizing formulas. The goal here is simple: to help you think like a statistician when you face a real problem. We'll follow a clear workflow every time. Read the problem carefully. Classify what it's asking. Check the assumptions. Compute the result. And then, most importantly, interpret what it means in context. Throughout this course, we'll use a method selection flowchart. That flowchart will guide you from the type of data you have to the right procedure. You'll also work with topic sets, real data, and self-assessments to build your confidence step by step. Let's start by understanding why structured practice changes results.afit.edumosqueras.comlivephysics.com+21 min
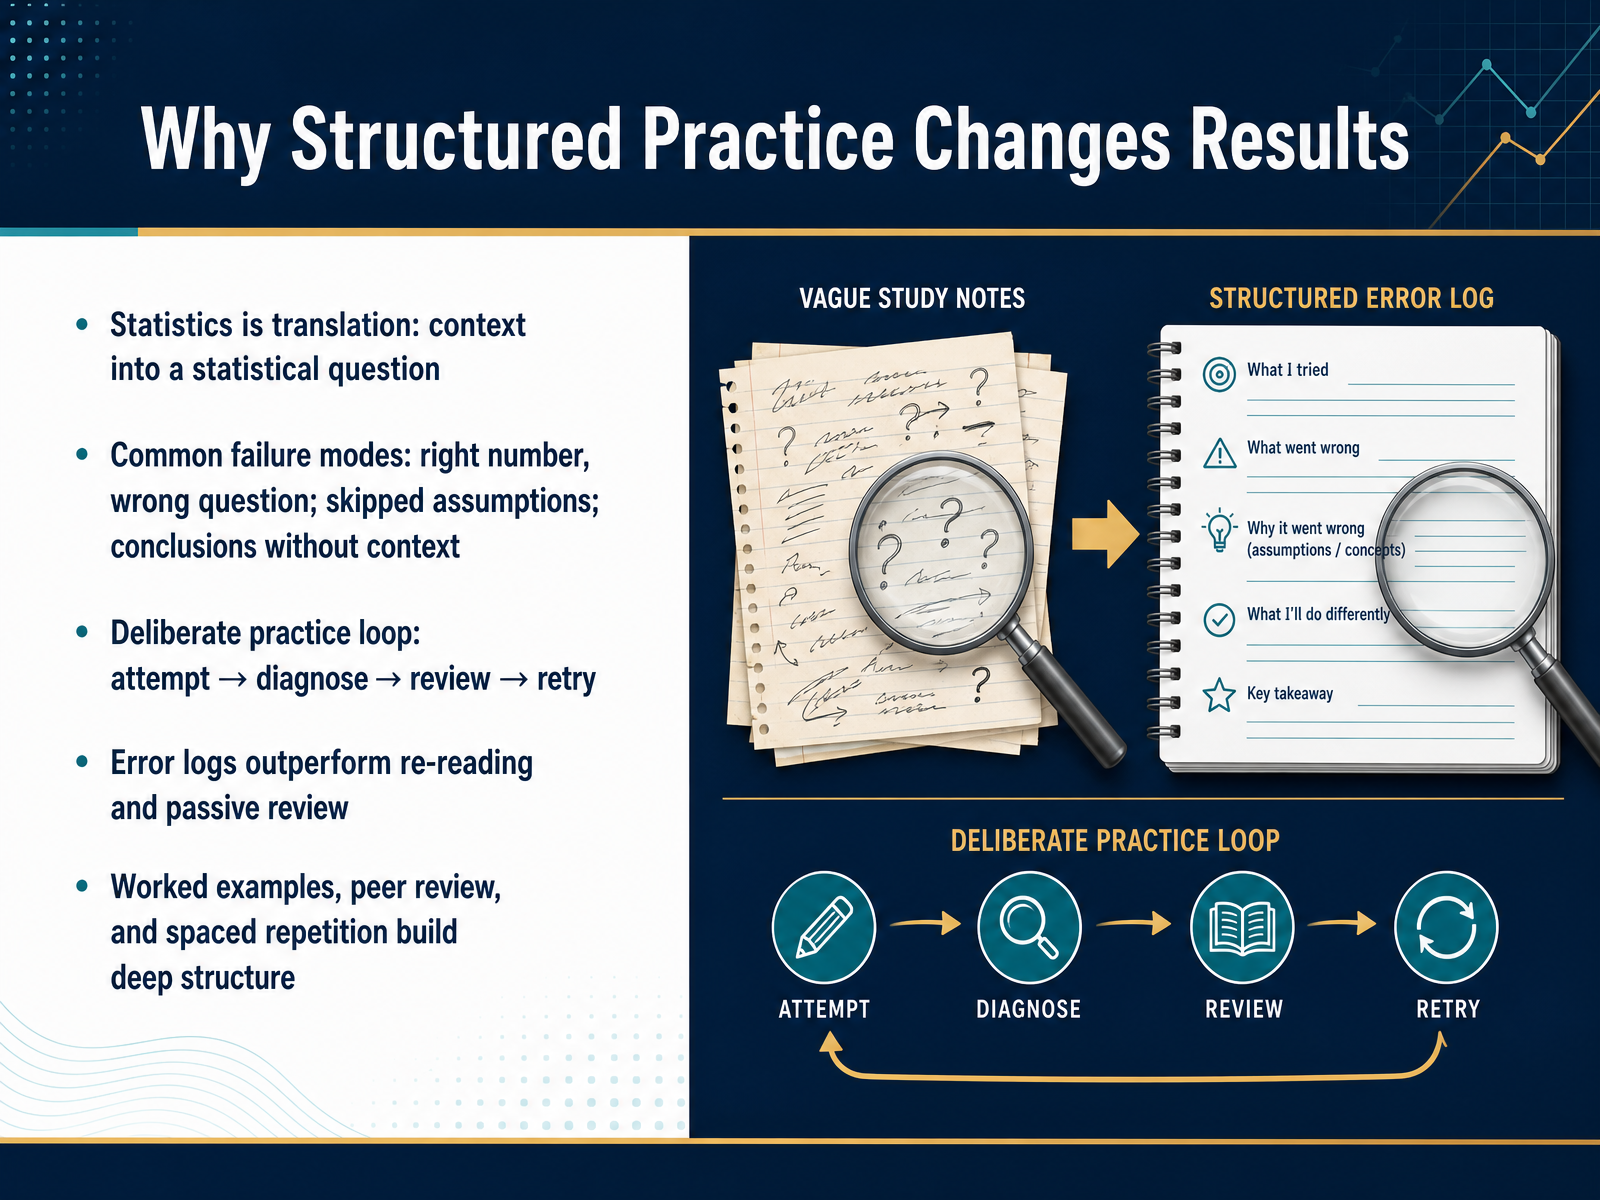
- 02Why Structured Practice Changes ResultsLet’s start with why this matters. Statistics is really the art of translation: you take a messy real-world context and turn it into a clear statistical question. The trouble is, many of us get the numbers right but answer the wrong question. We skip the assumptions. Or we produce a conclusion that has no context attached to it. So, let’s try a different approach today. Instead of just reading through problems, we’re going to work through them deliberately. Here’s the loop: attempt, diagnose, review, retry. Each step builds on the last. Research shows that keeping an error log—tracking every mistake—beats re-reading notes every time. It forces you to see your own patterns. And combine that with worked examples, peer review, and spaced repetition, and you start building real deep structure. Not surface familiarity. So here’s the mindset: every practice problem is a chance to catch one of these failure modes early. Now, let’s move on and look at how to read the problem you actually have.
 effortlessmath.comcollegeprep.uworld.comvibromedia.com+21 min
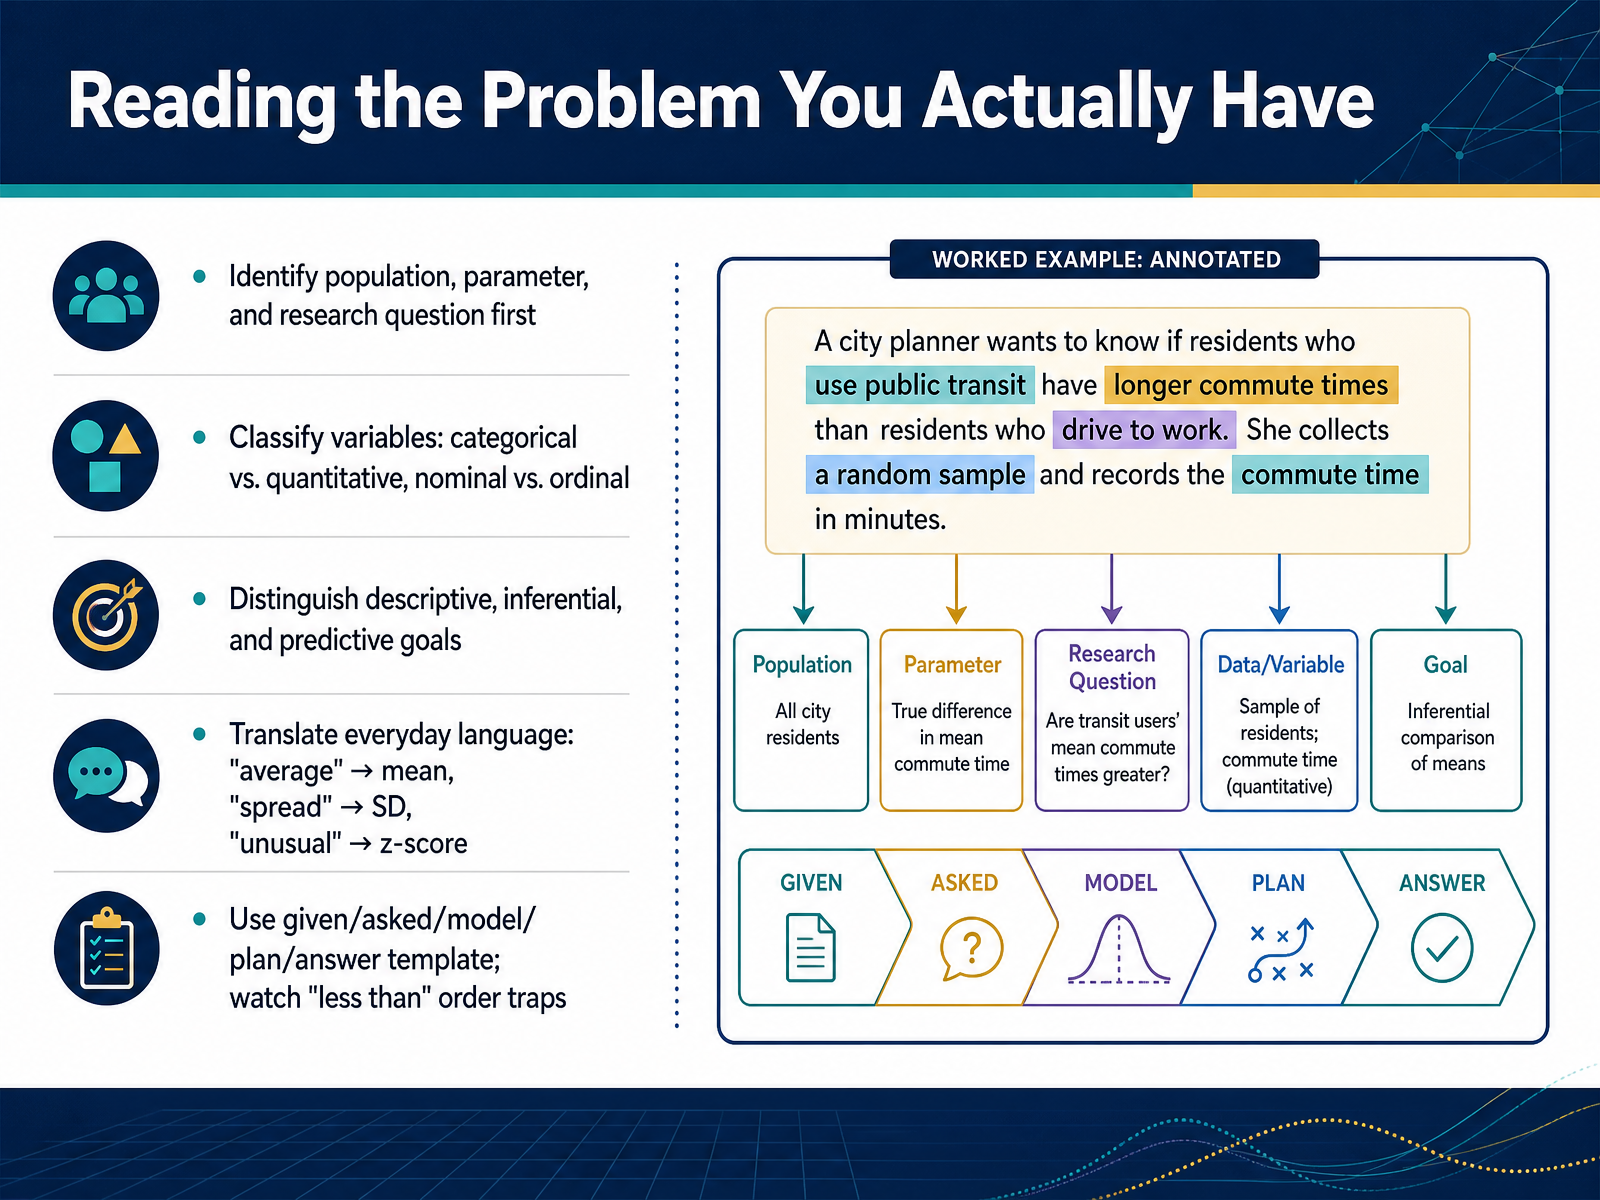
 - 03Reading the Problem You Actually HaveLet’s slow down and read the problem the way a statistician would. Before touching any formula, identify the population, the parameter, and the research question. Then classify your variables. Are they categorical or quantitative? Nominal or ordinal? Next, decide the goal. Are you describing a group, making an inference about a larger population, or predicting an outcome? Now translate everyday language. When you hear average, think mean. Spread means standard deviation. Unusual means z-score. A great way to stay organized is the given, asked, model, plan, answer template. Write down the numbers and conditions first. Then write exactly what the question wants. Pick a model, plan your steps, and finish with one clear answer sentence that includes units. Watch out for order traps, especially with phrases like less than. That usually means you subtract from whatever follows. Let’s try one together. A class average is 80 with a standard deviation of 5. A student scores 90. How unusual is that score? The word unusual hints at a z-score, not a percentile. Calculate 90 minus 80, divide by 5. That gives a z-score of 2. So the score is two standard deviations above the mean. Notice how the template keeps the goal clear. Now, once you can read the problem correctly, the next step is choosing the right method to solve it.
 mathaigpt.comblog.studywizardry.compurplemath.com+22 min
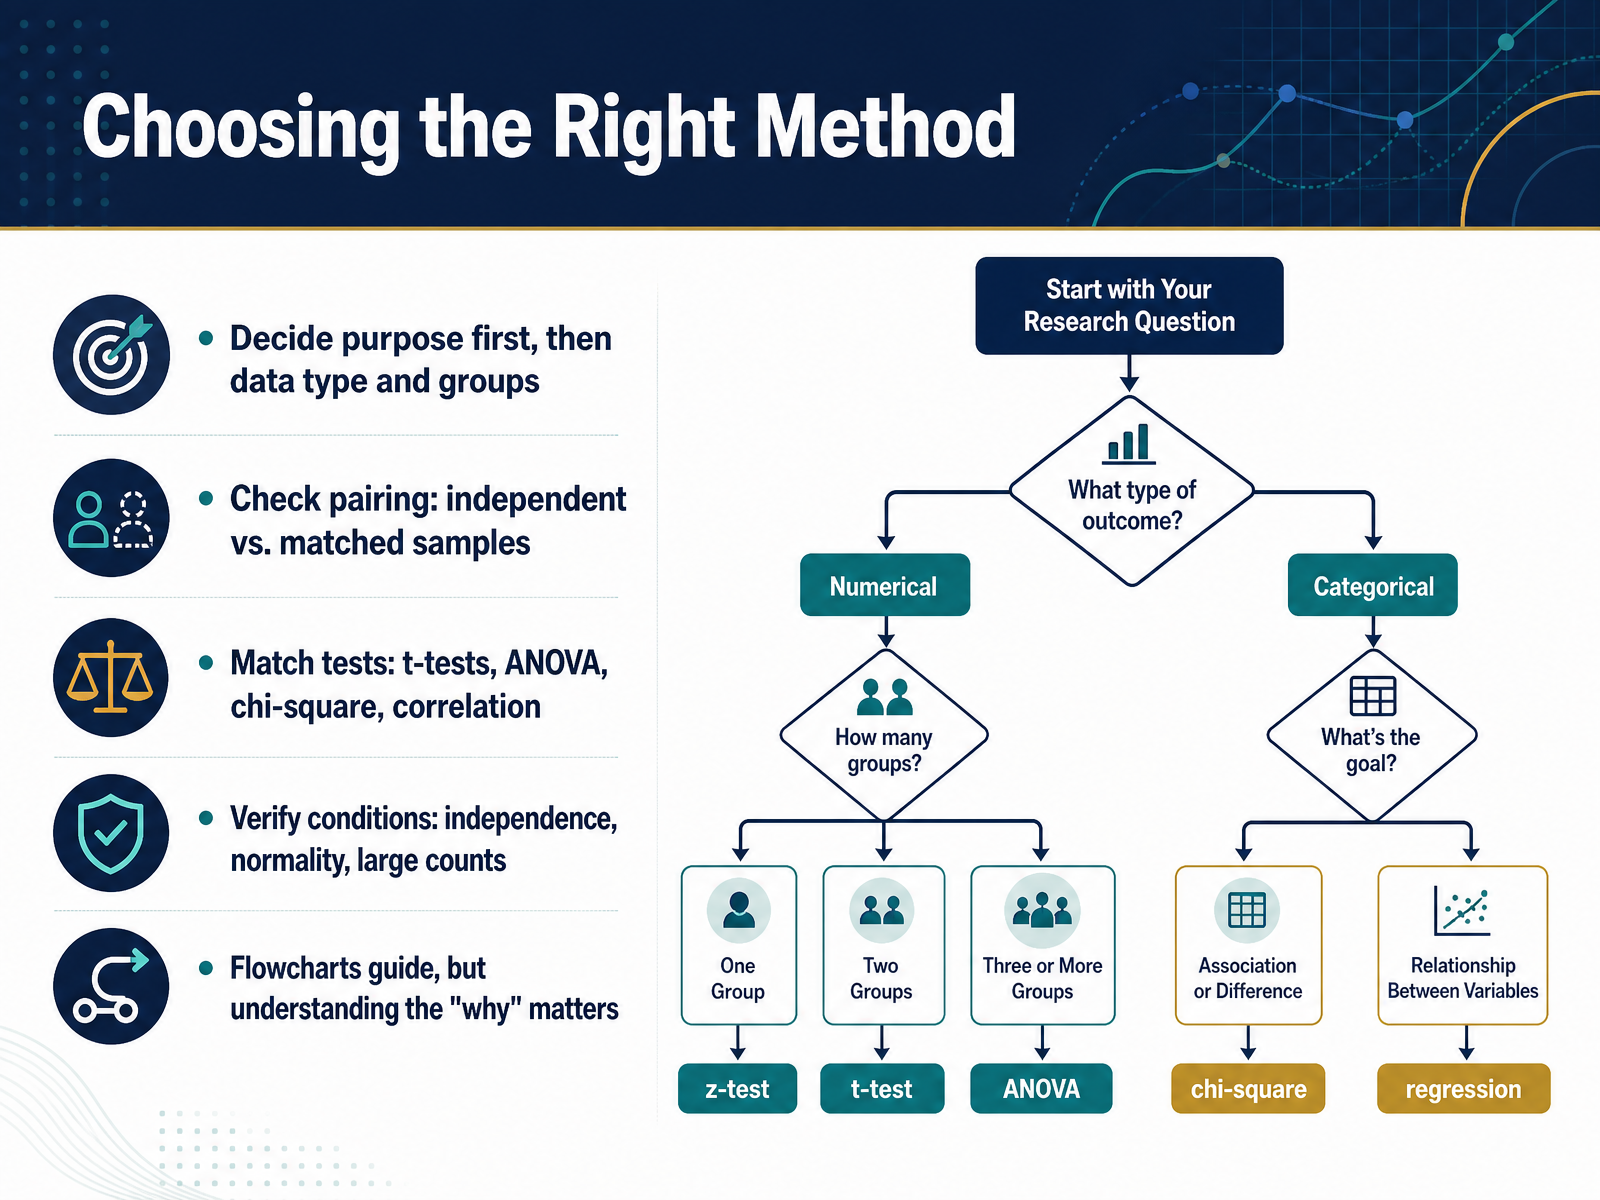
 - 04Choosing the Right MethodNow let’s focus on choosing the right method. Before you reach for any formula, stop and decide your purpose first. Are you estimating a value or testing a claim? That single choice will shape everything else. Next, look at your data type and how many groups you have. Then, check the pairing. Are your samples independent, like two separate classrooms? Or are they matched, like the same students before and after a lesson? This distinction matters more than people expect. Using a two-sample test on paired data is a classic mistake. After that, match the test to your situation. Comparing two means? Use a t-test. Three or more groups? ANOVA. Testing association between categorical variables? Chi-square. Looking for a linear relationship? Correlation. And before you run anything, verify the conditions: independence, normality, and large enough counts. Flowcharts can guide you, but understanding the why behind each choice is what makes you a confident analyst. Keep this logic in mind as we move to the conditions and assumptions that protect your conclusion.
 afit.edumosqueras.comlivephysics.com+22 min
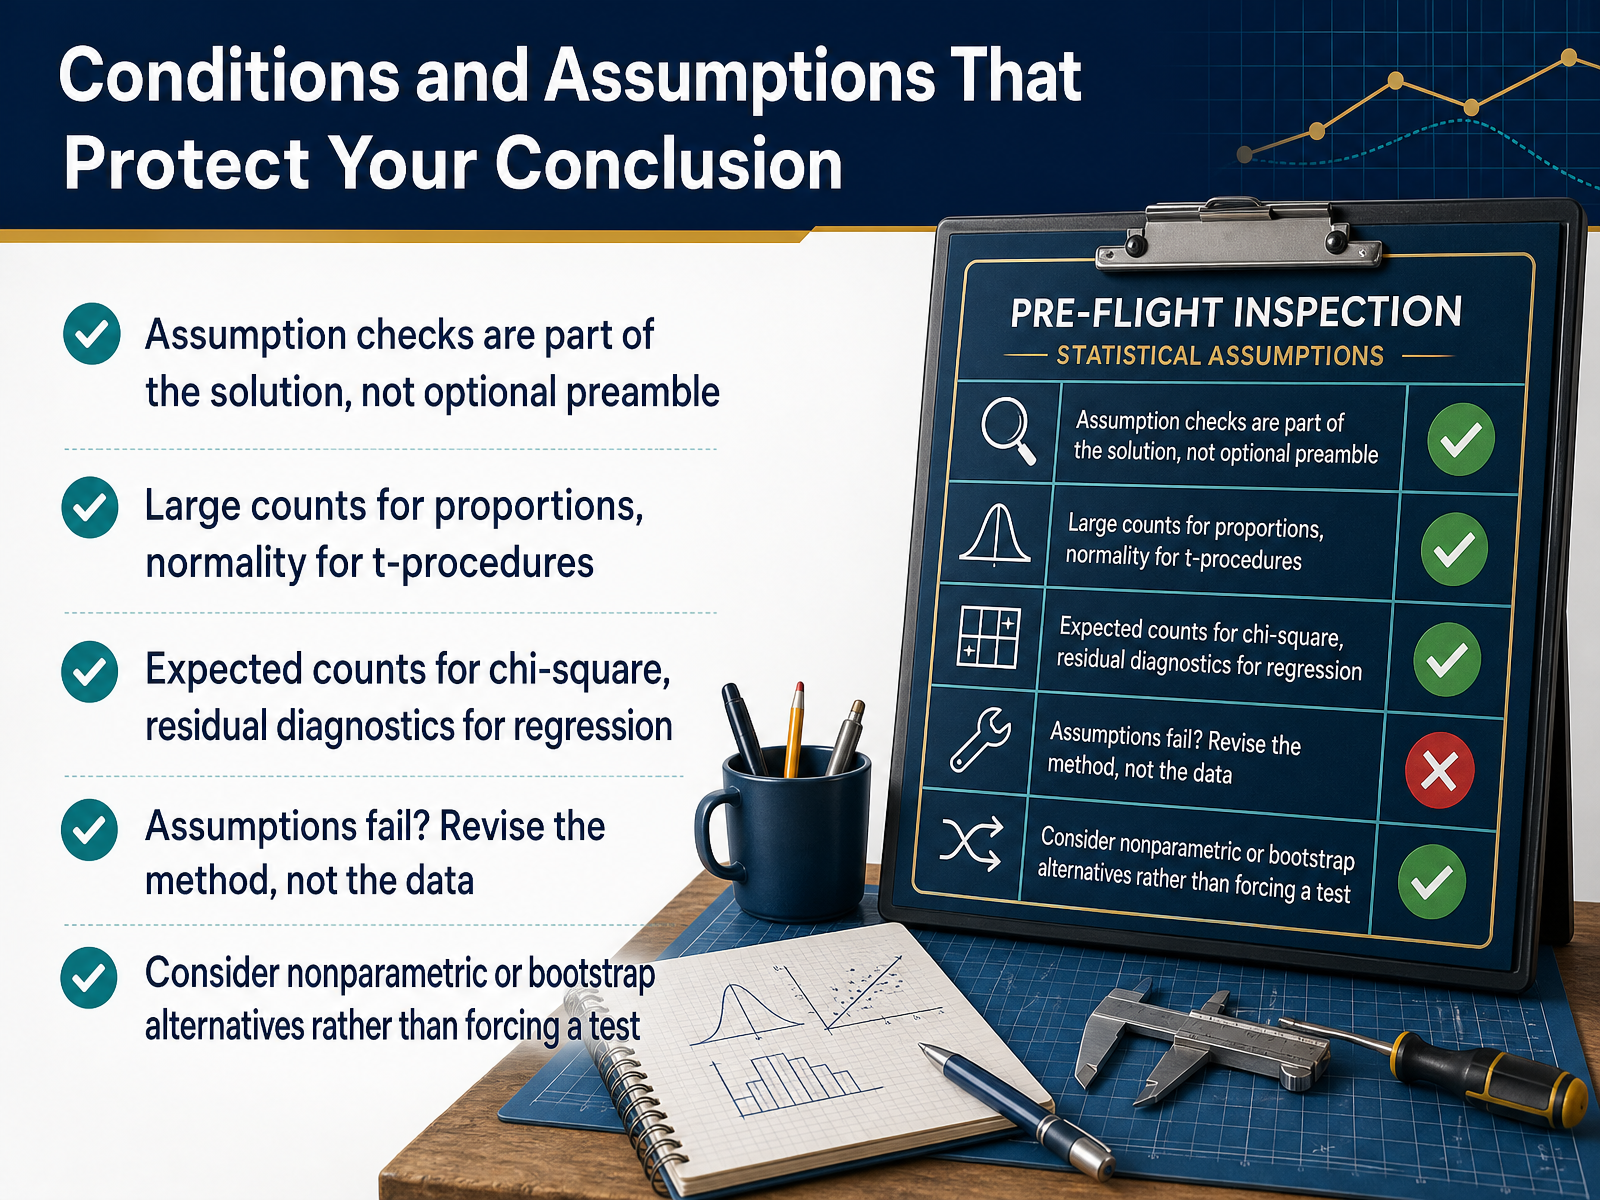
 - 05Conditions and Assumptions That Protect Your ConclusionLet’s pause here, because checking assumptions is part of the solution, not an optional preamble. Think of it as the gatekeeper for every conclusion you draw. For proportions, verify the large counts condition. For t procedures, check for approximate normality. For chi square tests, confirm expected counts are at least five. And in regression, always look at residual diagnostics. Notice how each method protects its own assumptions. If those assumptions fail, don’t force the test. Revise the method, not the data. That might mean switching to a nonparametric alternative or using a bootstrap approach. The goal is honest inference, not a convenient p value. Keep that mindset as we move into computing correctly and checking your work.
 afit.edumosqueras.comlivephysics.com+22 min
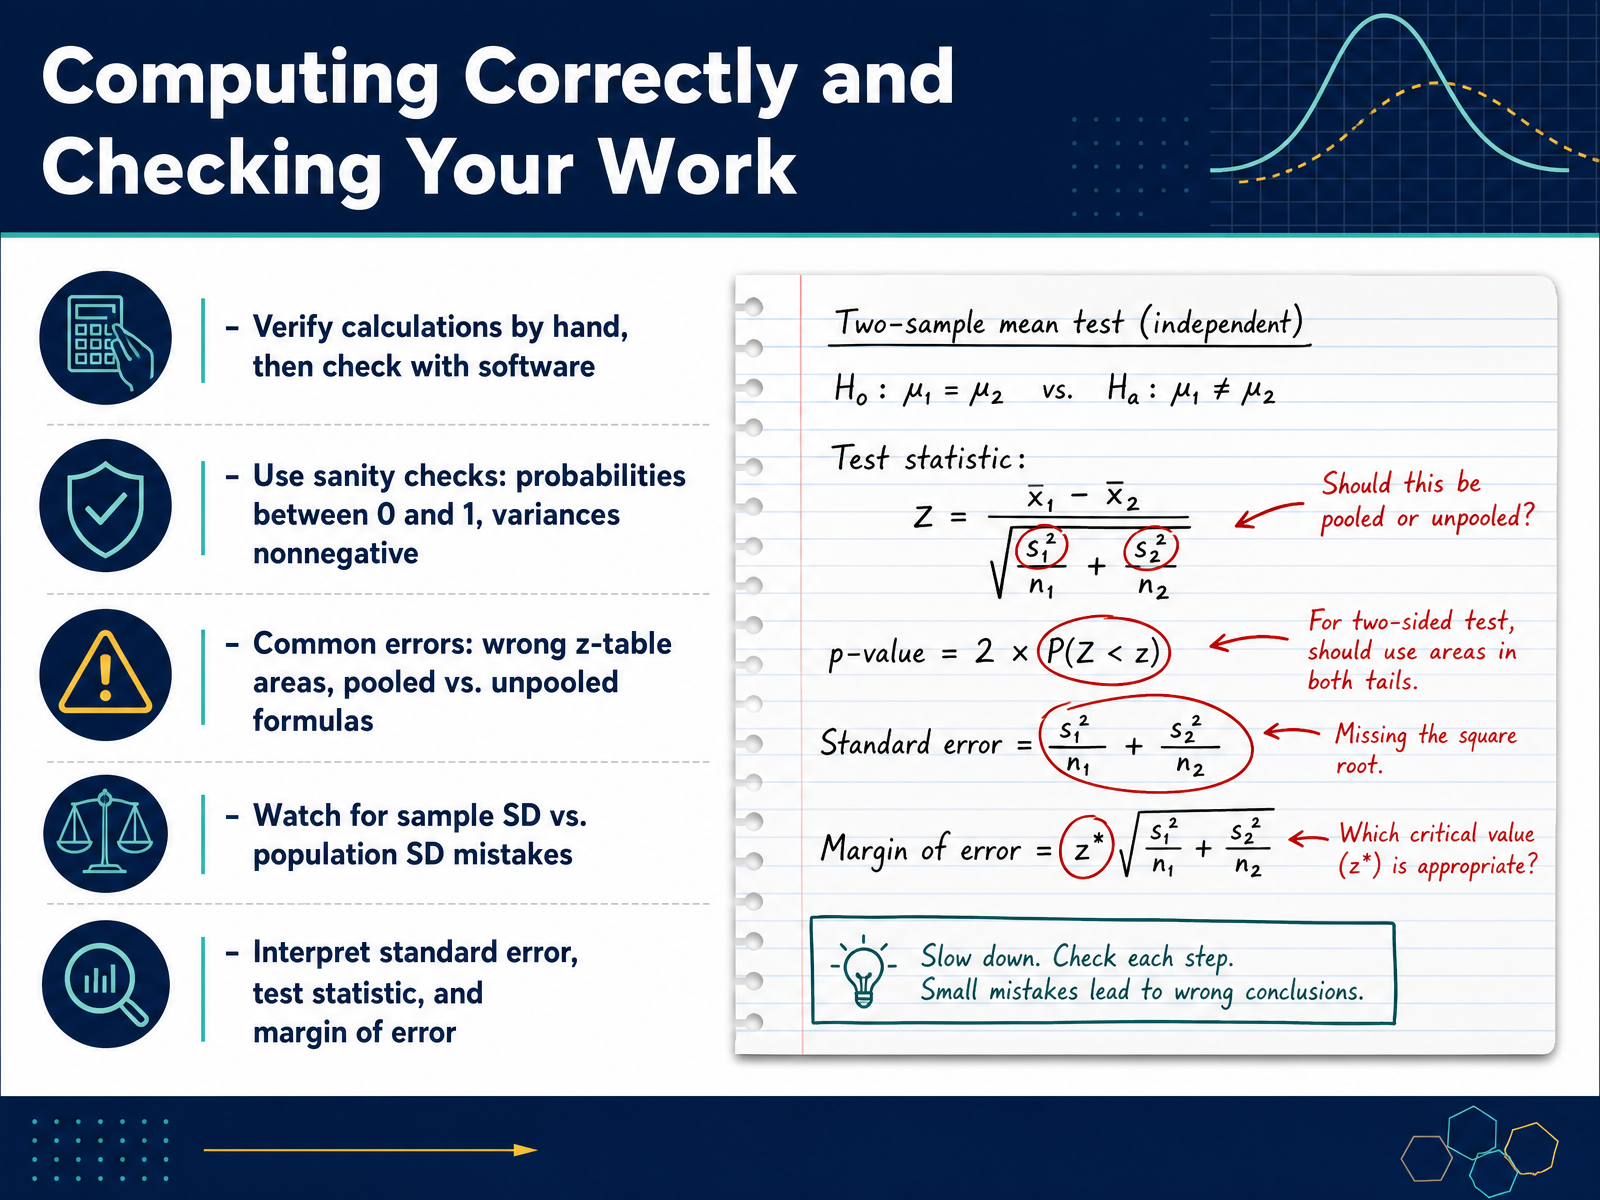
 - 06Computing Correctly and Checking Your WorkLet’s pause here and talk about computing correctly and checking your work. In practice, it’s easy to get caught up in the numbers and skip the final review, but a quick check can save you from a misleading conclusion. Start by verifying your calculations by hand, then confirm the result with software. That double pass catches typos and formula slips. Next, use simple sanity checks. Probabilities must fall between zero and one. Variances can never be negative. If you see something outside those bounds, stop and recheck your input. Notice how common errors often come from small choices. For example, wrong z-table areas happen when you look up the wrong tail or forget to subtract from one. Pooled versus unpooled formulas change your standard error entirely, so make sure you match the method to the problem. Also, watch for the sample standard deviation versus the population standard deviation. That lone n minus one in the denominator is easy to drop, but it changes your test statistic. Finally, take a moment to interpret the standard error, the test statistic, and the margin of error together. Do they tell a consistent story? If the margin of error is huge, your precision is low, no matter how strong the point estimate looks. Keep these checks in your routine, and your answers will stand on firmer ground. Coming up, we’ll look at interpreting results without overclaiming.
 pmc.ncbi.nlm.nih.govdocuments.uow.edu.audoi.org+22 min
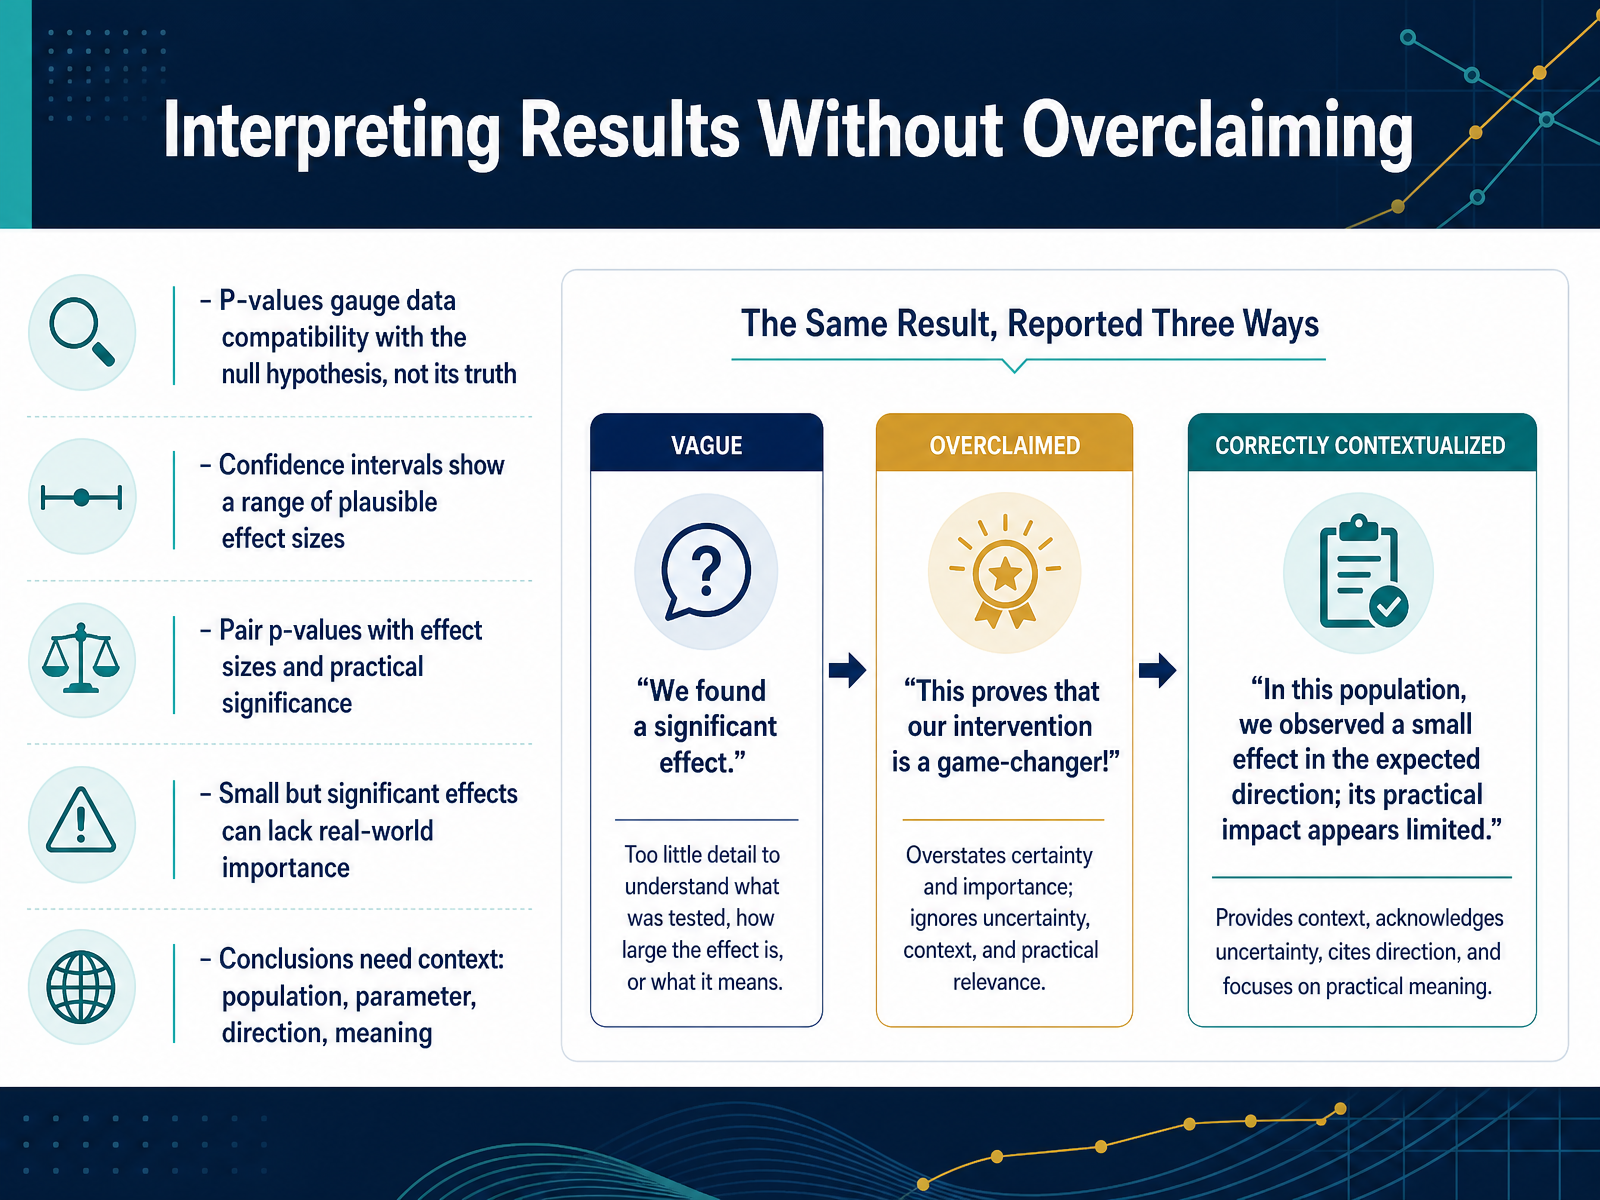
 - 07Interpreting Results Without OverclaimingNow let’s talk about a subtle but crucial skill: interpreting results without overclaiming. A p-value is not a verdict. Think of it as a gauge of compatibility between your data and the null hypothesis. A low p-value, say point zero two, tells you the data are less compatible with the idea of no effect. It does not prove the null is false, and it certainly doesn't tell you the effect is important. So, pair that p-value with a confidence interval. The interval gives you the range of plausible effect sizes. This is where practical significance comes in. Imagine you test a new training program. The p-value is tiny, and the confidence interval runs from zero point one to zero point five points on a hundred point exam. Statistically significant, yes. But is an improvement of less than one point on a hundred point exam actually meaningful? Probably not. Always ask: what does the effect size look like, and does the interval include values that matter in the real world? A small but significant effect can lack real-world importance. Conclusions need context. So, your final answer should state the population, the parameter, the direction, and the real-world meaning. Avoid saying the treatment works. Instead, say the data are most compatible with a small average improvement in reading scores for high school students. Keep that discipline, and you'll avoid overclaiming. Now, let's move into our first practice set on descriptive statistics and probability.
 2 min
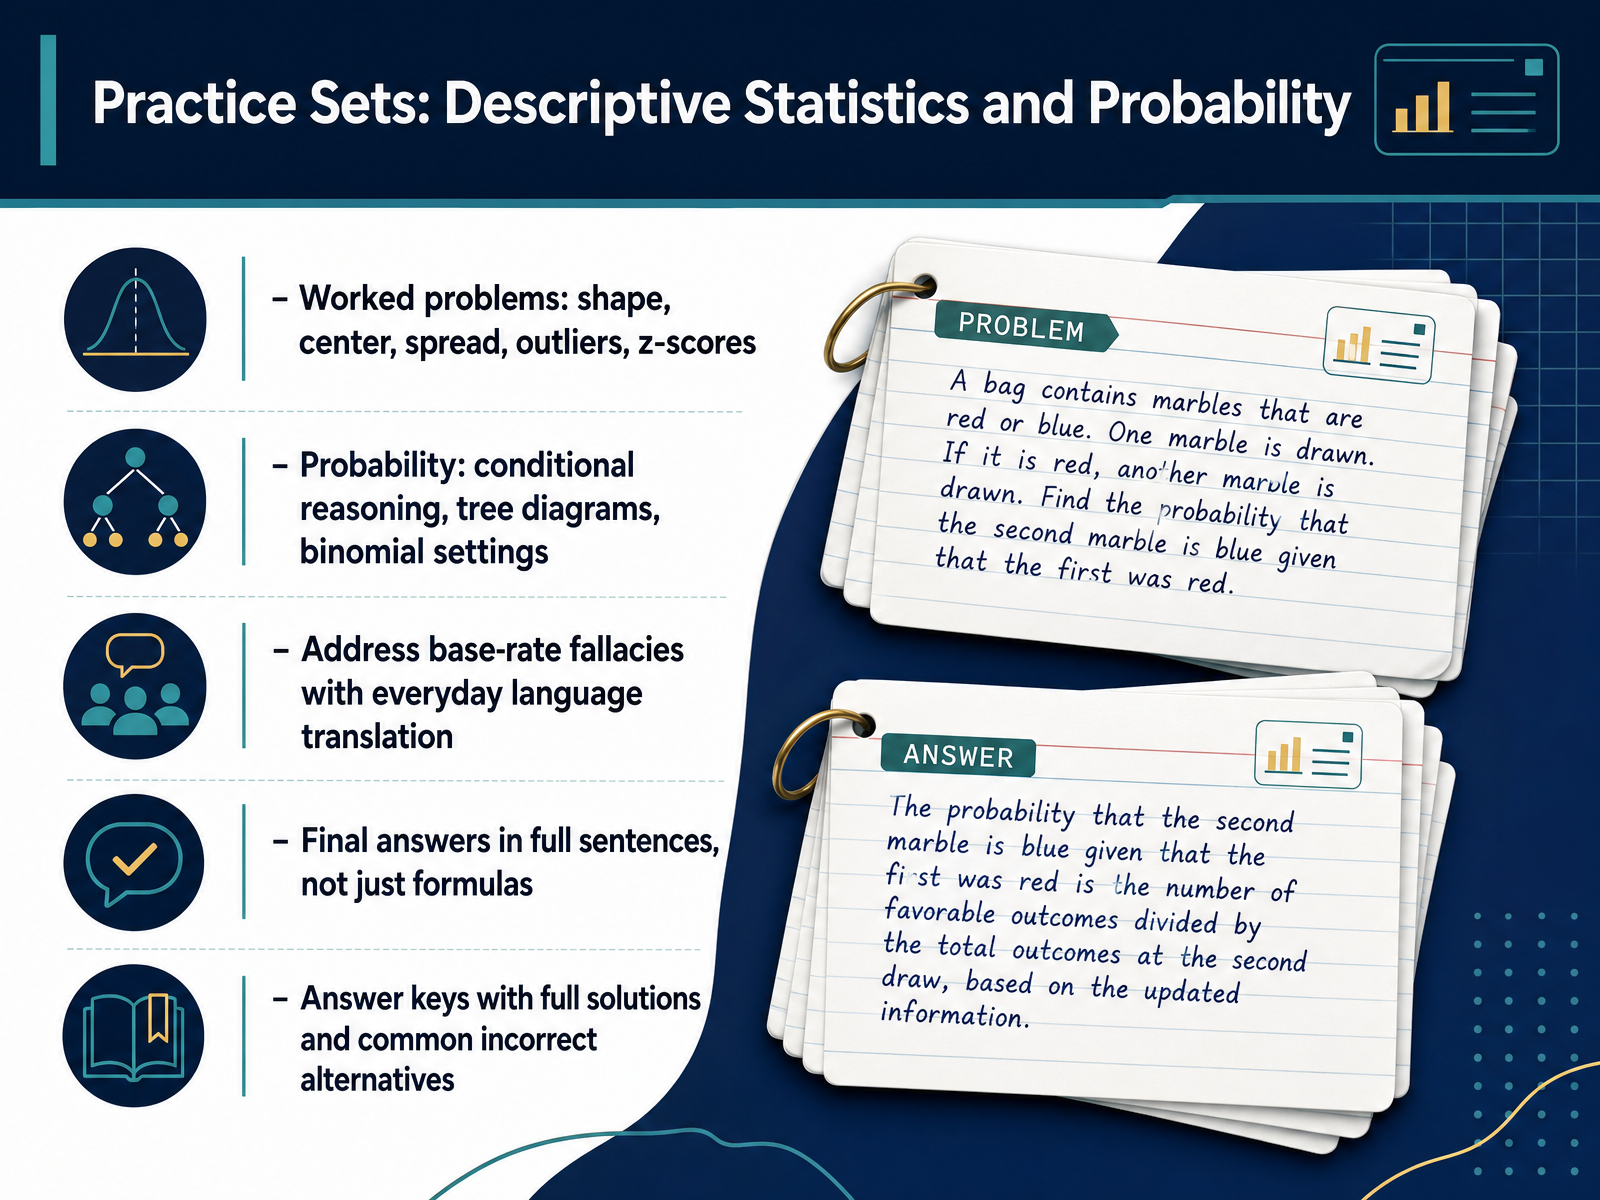
2 min - 08Practice Sets: Descriptive Statistics and ProbabilityNow let’s get into the practice sets. These focus on descriptive statistics and probability. For descriptive work, we’ll walk through shape, center, spread, outliers, and z-scores step by step. We’ll calculate each one together, and notice how the z-score tells us how unusual a value is. For probability, we’ll build conditional reasoning, use tree diagrams, and set up binomial situations. A key part is handling the base-rate fallacy. For example, if a test is 99 percent accurate for a disease that affects one percent of people, a positive result might still mean less than a fifty percent chance you have it. We’ll translate statements like that into everyday language, so the math makes sense. And remember, final answers should be given in full sentences, not just formulas. That helps you check that your conclusion matches the question. Each practice set includes an answer key with full worked solutions and common incorrect alternatives, so you can see where mistakes usually creep in. Use these to build your intuition and speed. Next, we’ll move into practice sets on estimation and hypothesis testing.
 2 min
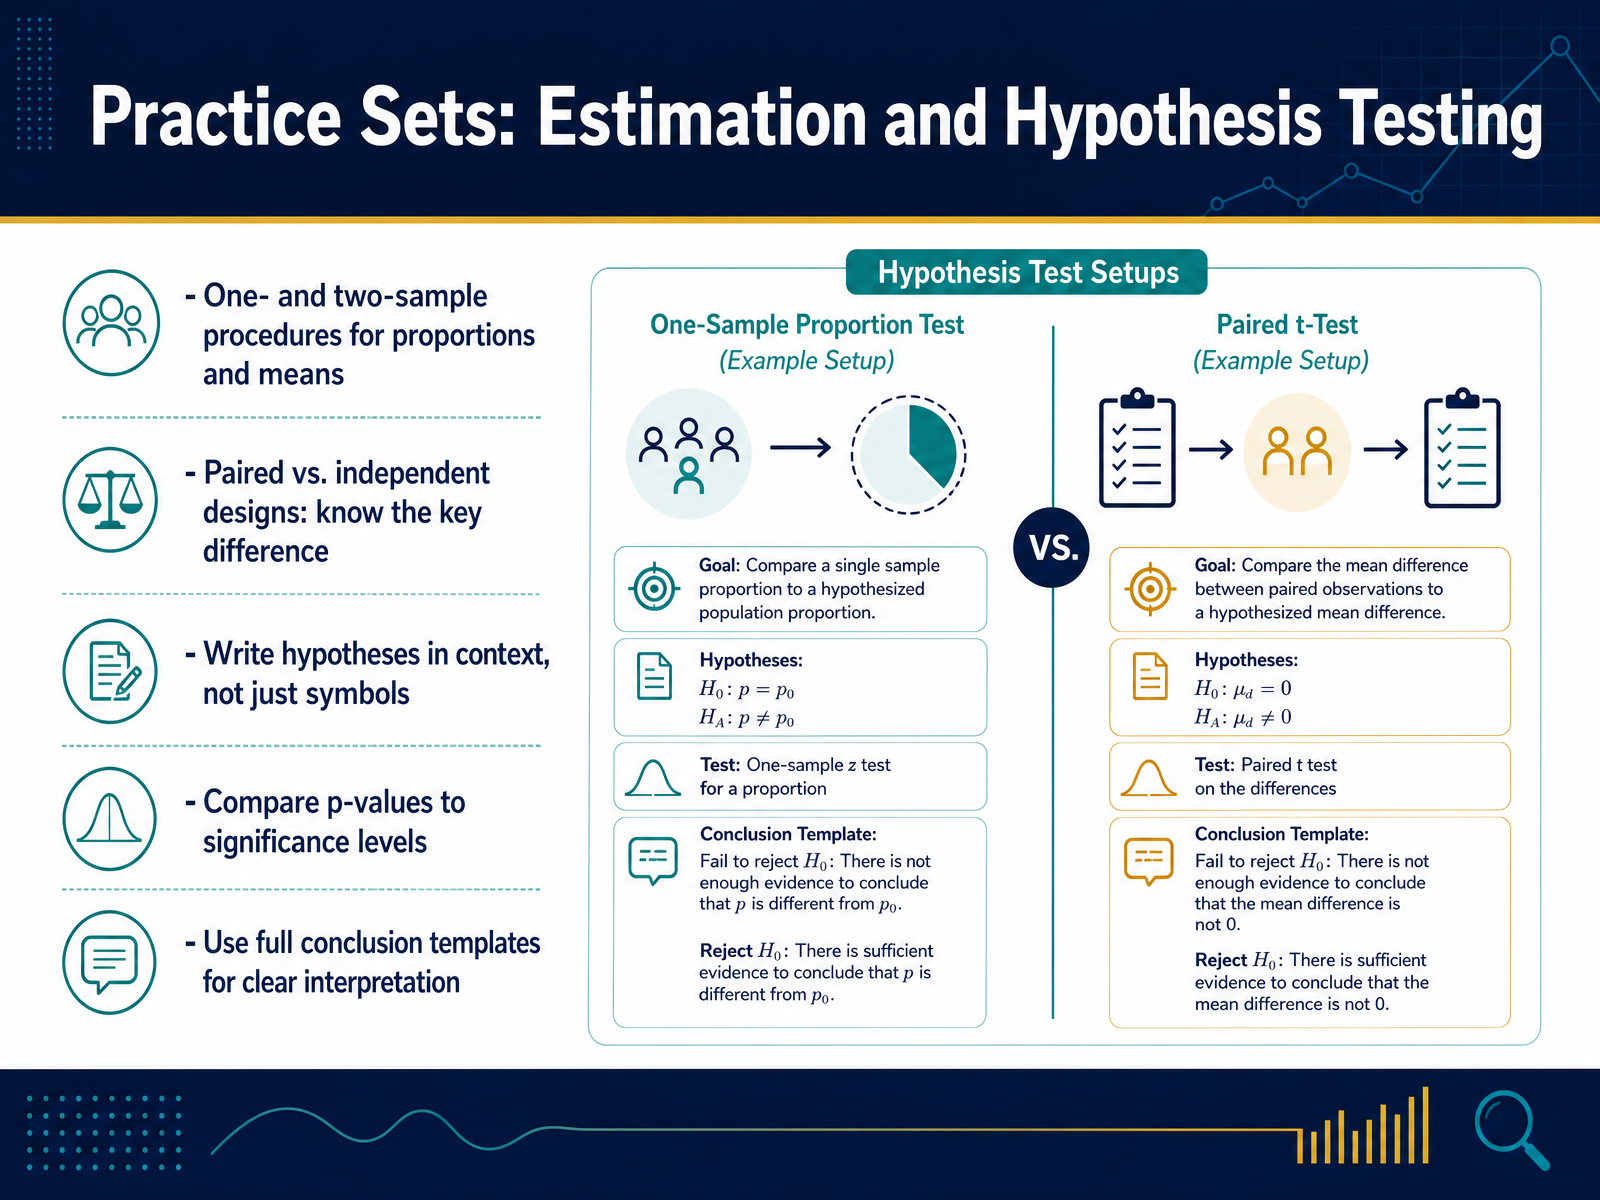
2 min - 09Practice Sets: Estimation and Hypothesis TestingLet’s turn our attention to estimation and hypothesis testing, where most practice mistakes happen. First, decide if you’re estimating or testing. A confidence interval gives a range of plausible values, while a hypothesis test answers a yes or no question about a claim. Then, match the procedure to your data type and design. Are you working with one sample or two? For two samples, are they paired or independent? That distinction is crucial. Paired means each subject is measured twice, like before and after, and you analyze the differences. Independent means you have two separate groups. Let’s try one: you compare two teaching methods using two different classes. Those are independent, so use a two-sample t-test. If you tested the same class before and after, you would pair the data. Next, write your hypotheses in context. Don’t just say mu one equals mu two; say, “The mean test score of method one is equal to the mean test score of method two.” Be specific about the parameter and the direction of the alternative. When you get your p-value, compare it to your significance level, usually zero point zero five. A p-value less than that means you reject the null. But remember, rejecting the null doesn’t prove the alternative is true; it just means the evidence is strong. Finally, always write a full conclusion in context. State the decision, tie it back to the original claim, and include the statistic and p-value. For example: “We reject the null and conclude that the new drug reduces blood pressure more than the placebo, t equals two point one, p equals zero point zero two.” This full template turns numbers into clear meaning. Now, let’s move on to practice sets for regression and ANOVA, where we explore relationships and compare several groups.
 afit.edumosqueras.comlivephysics.com+22 min
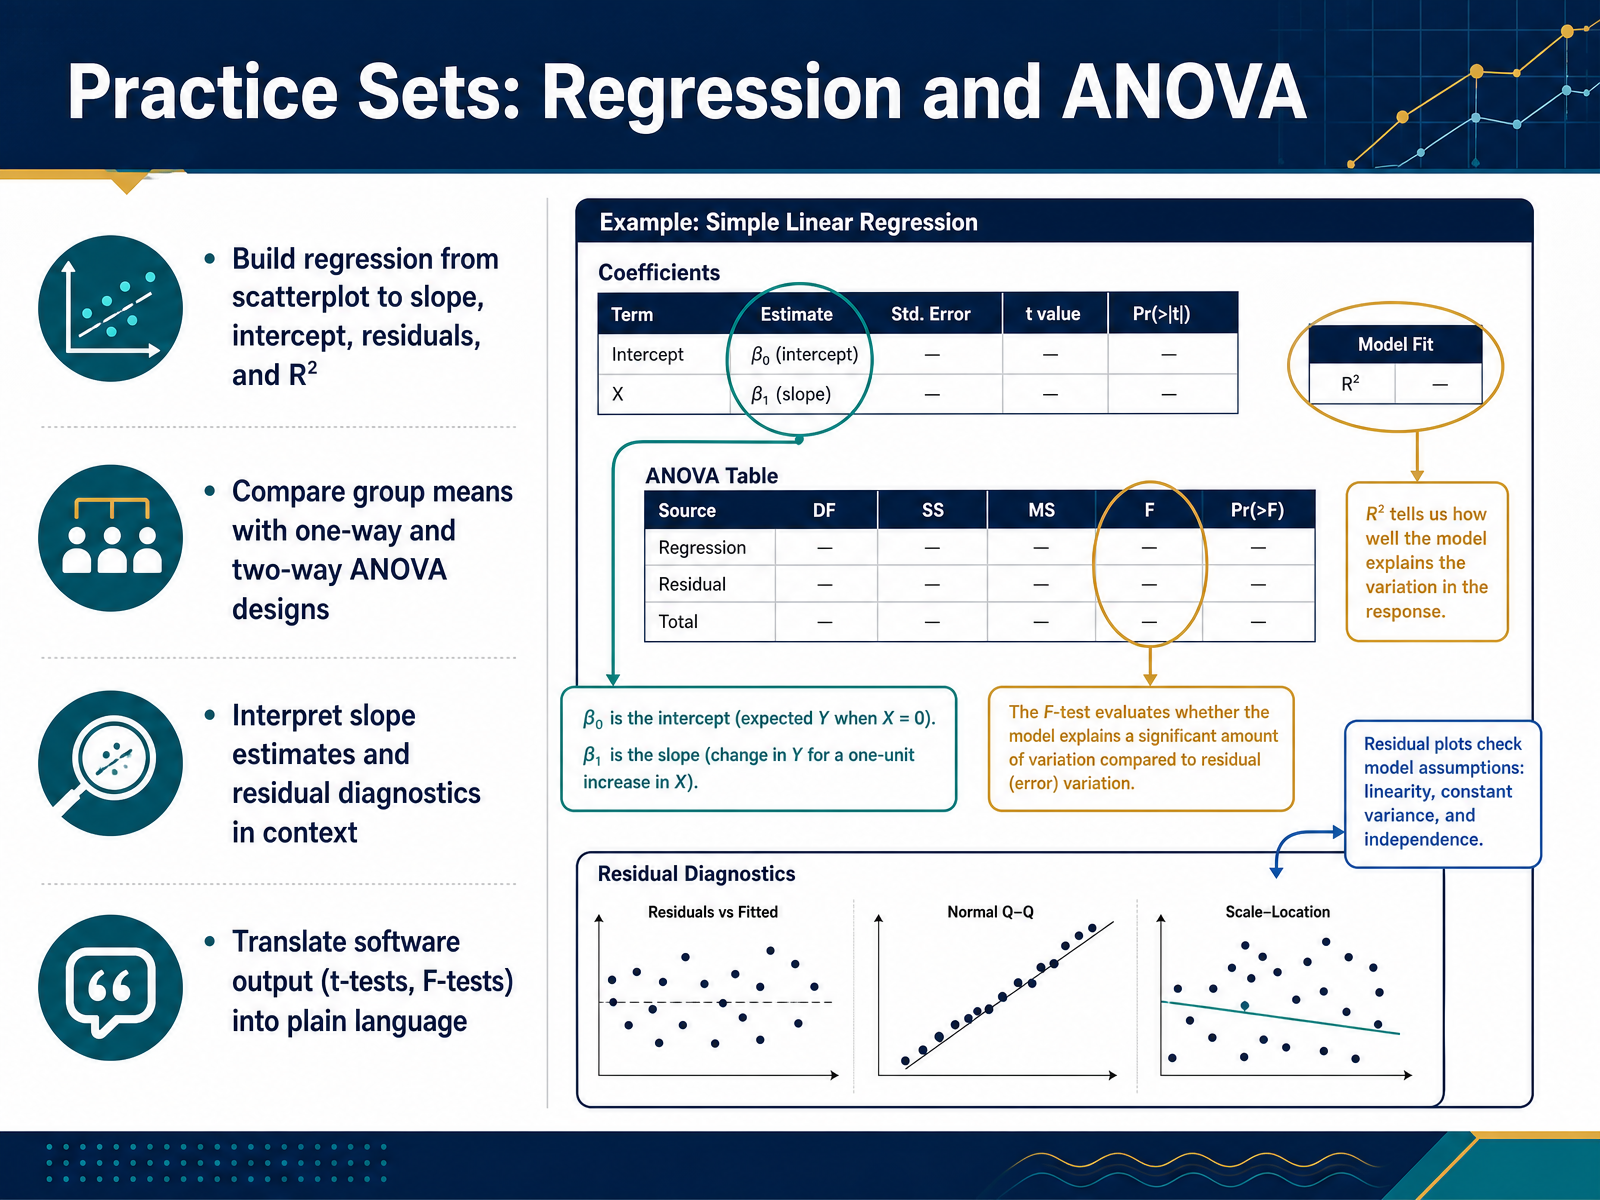
 - 10Practice Sets: Regression and ANOVANow let’s put regression and ANOVA into practice. Start with a scatterplot and build the full regression line. Calculate the slope, the intercept, the residuals, and R-squared. Notice how the residuals always sum to zero—that’s a quick check against arithmetic slips. Then compare group means with one-way and two-way ANOVA designs. Ask yourself: is there one factor or two? Are the groups independent? That choice determines your model. When you have software output, focus on interpreting the slope estimate in context. What does a one-unit increase in X mean for Y? And don’t skip the residual diagnostics—they tell you whether the model is trustworthy. Finally, translate the t-tests and F-tests into plain language. A significant F-test means at least one group differs, but it doesn’t tell you which one. For the t-test on the slope, a small p-value means the relationship is real, not just noise. Let’s work through a few examples and watch these steps come together. Next, we’ll look at diagnosing common errors.
 afit.edumosqueras.comlivephysics.com+21 min
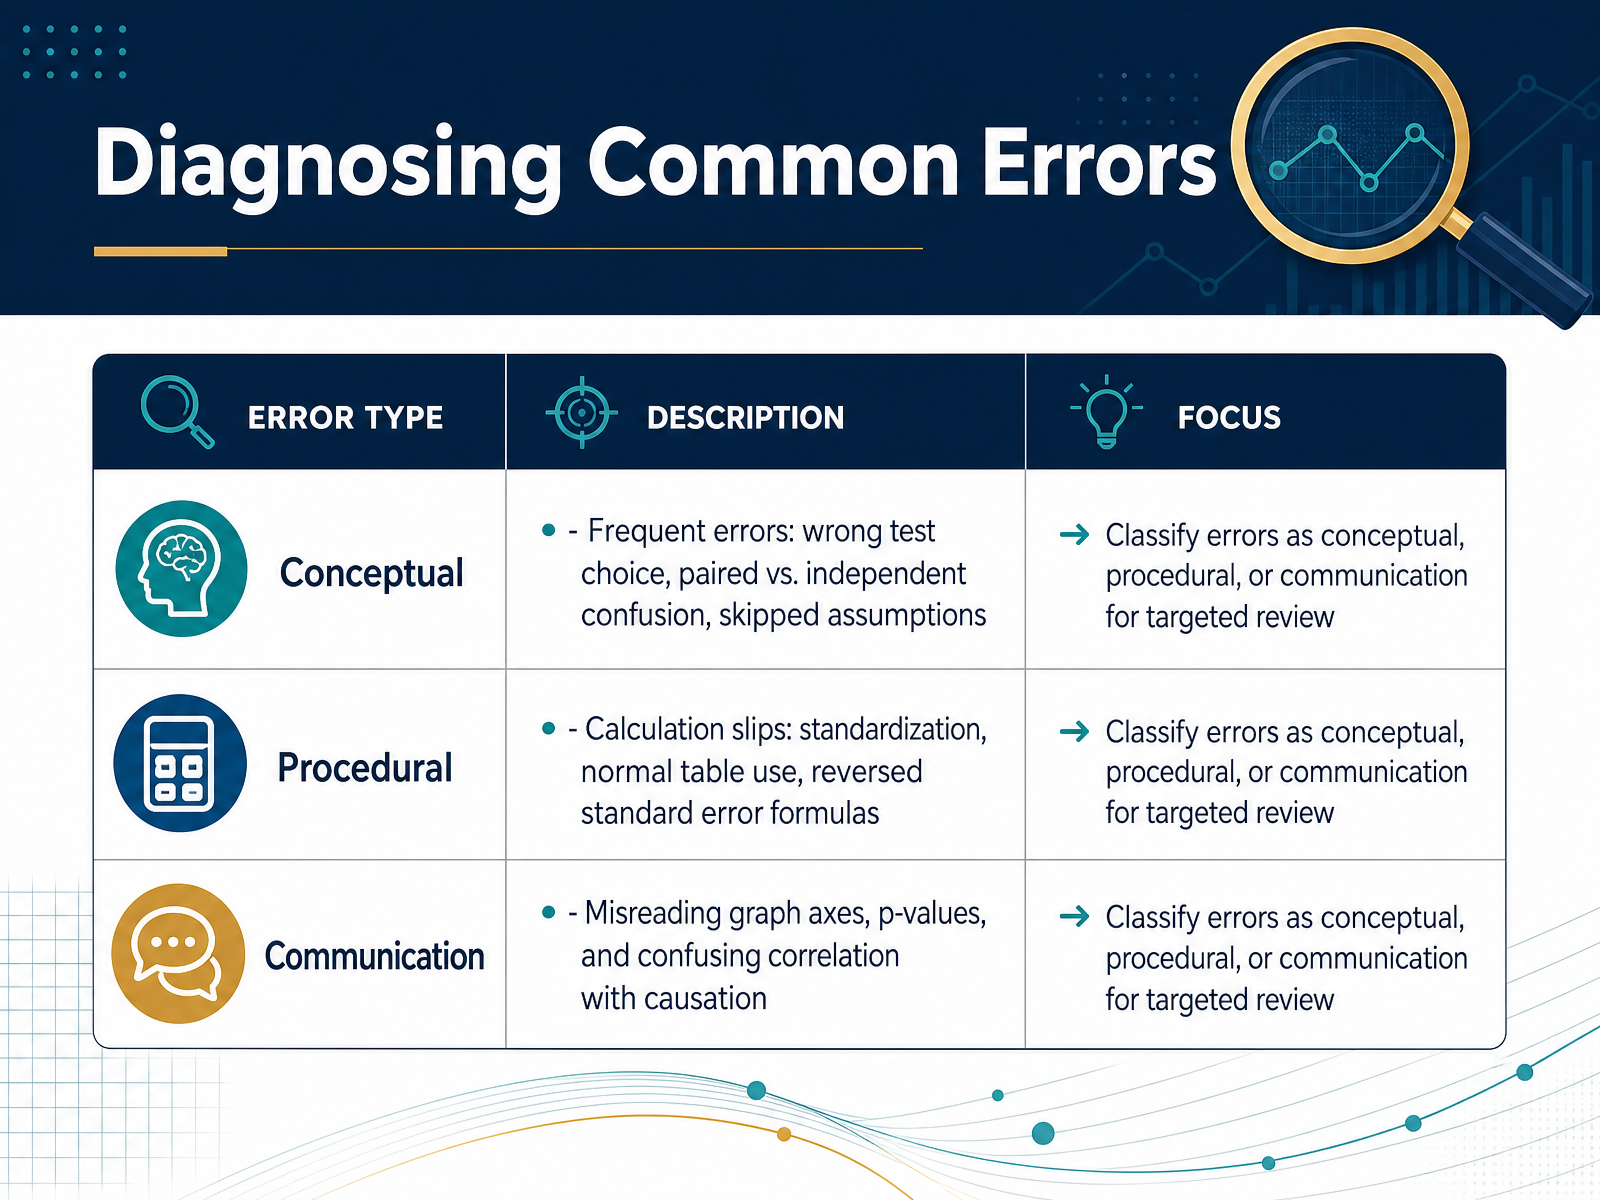
 - 11Diagnosing Common ErrorsNow let’s look at common errors you might encounter—and likely make yourself. Some are conceptual, like choosing the wrong test, confusing paired with independent samples, or skipping assumption checks. Others are procedural, like standardizing incorrectly, using the normal table in the wrong direction, or flipping standard error formulas. And many are communication issues, like misreading graph axes, misinterpreting p-values, or implying causation from correlation. Here’s the key: when you spot a mistake, don’t just fix it—classify it. Is it conceptual, procedural, or communication? That tells you where to focus your review. For example, if you mix up paired and independent, that’s conceptual, so revisit the study design. If you standardize using the sample standard deviation instead of the population, that’s procedural, so practice the formula. Quick tip: draw a shaded curve for normal problems to avoid direction errors, and always ask yourself, “Does this p-value tell me about the hypothesis or about the data?” It’s about the data, not the hypothesis. Next, we’ll apply this classification to real data. Let’s move on.
 pmc.ncbi.nlm.nih.govdocuments.uow.edu.audoi.org+21 min
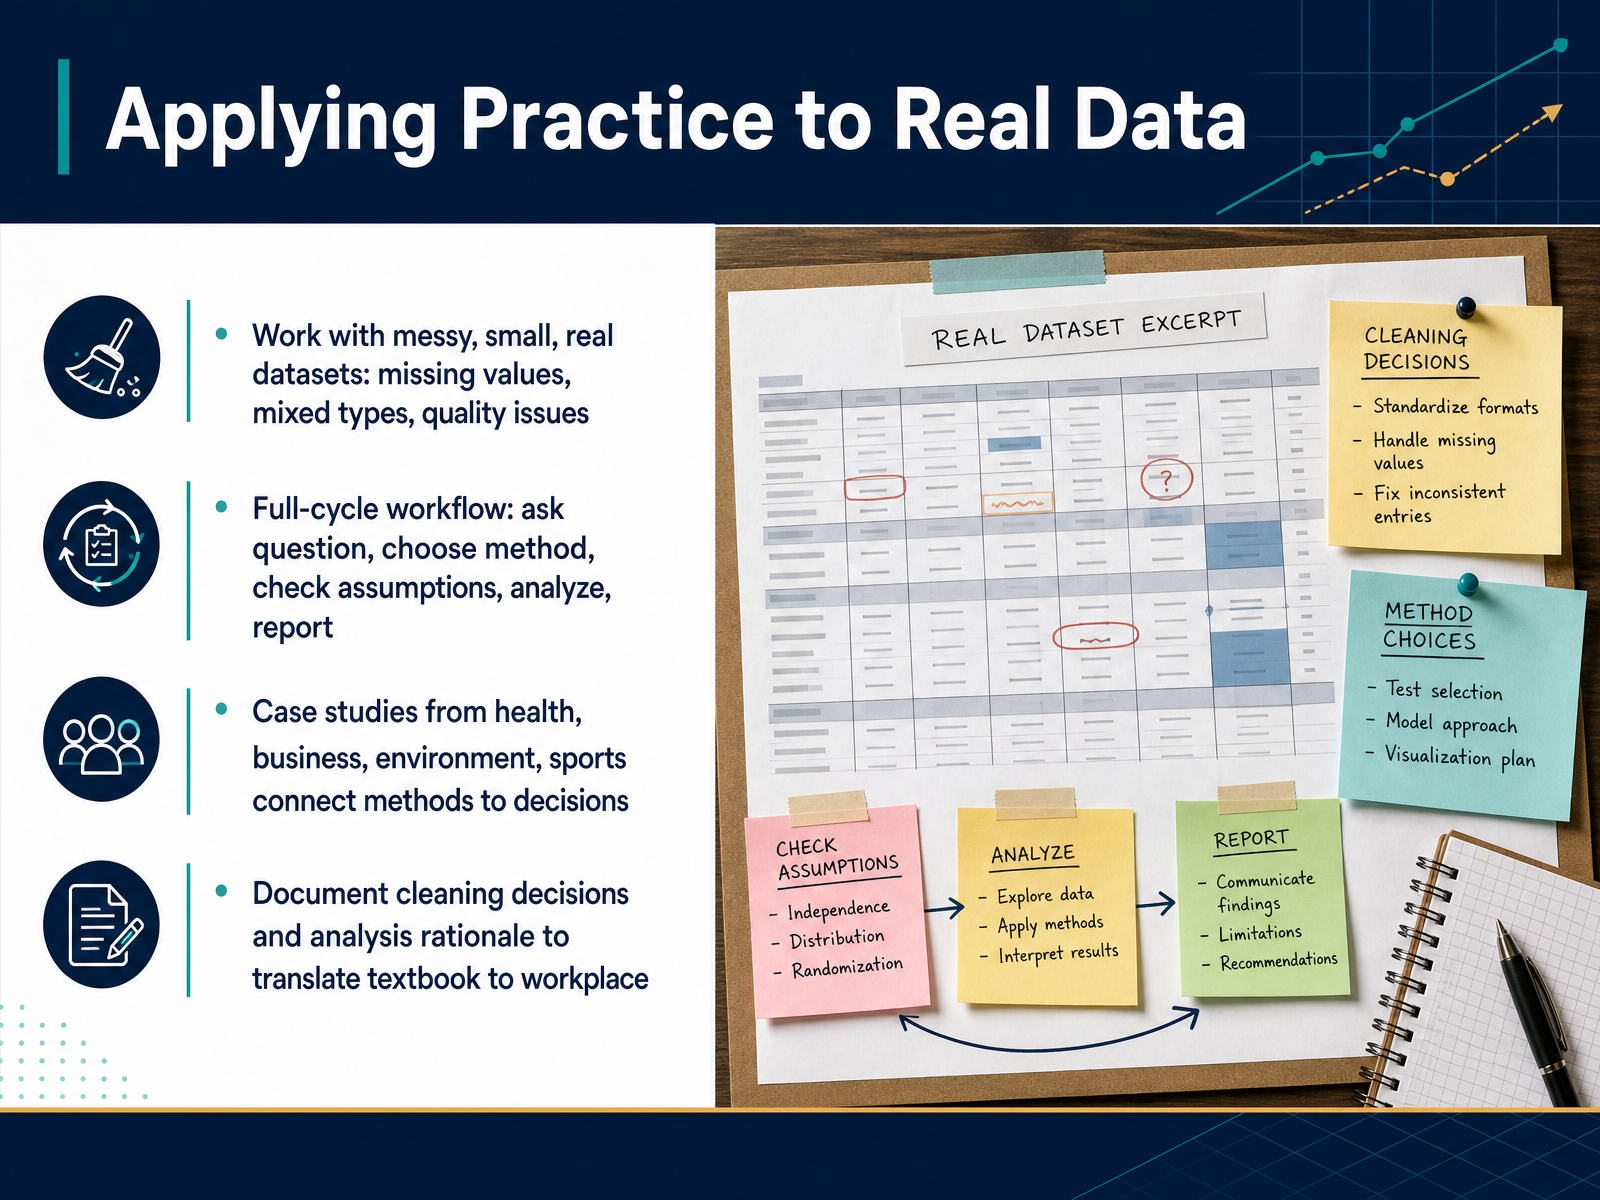
 - 12Applying Practice to Real DataSo far, we have practiced with clean, tidy datasets. Now, let’s try something closer to what you will see in the real world. Messy data. Small samples. Missing values. Mixed types. Quality issues. Real analysis means working through all of that. Let’s walk a full project cycle together: ask a clear question, choose the right method, check your assumptions, analyze, and report. We will use case studies from health, business, the environment, and even sports. Notice how each one connects a statistical method to a real decision. For example, when an analyst looks at hospital data with missing recovery times, they don’t just delete those rows. They ask why the data is missing and flag it in the report. That kind of thinking is what translates textbook skills into workplace value. As you practice, document every cleaning decision. Write down why you removed an outlier or why you treated a zip code as a category, not a number. That rationale is part of the analysis. It builds trust. It makes your work reproducible. And it turns a simple exercise into a portfolio piece. You are not just crunching numbers. You are building a decision trail. Keep that habit now, and it will carry you through every project ahead. Next, we will shift into self-assessment and long-term review.
 pmc.ncbi.nlm.nih.govdocuments.uow.edu.audoi.org+22 min
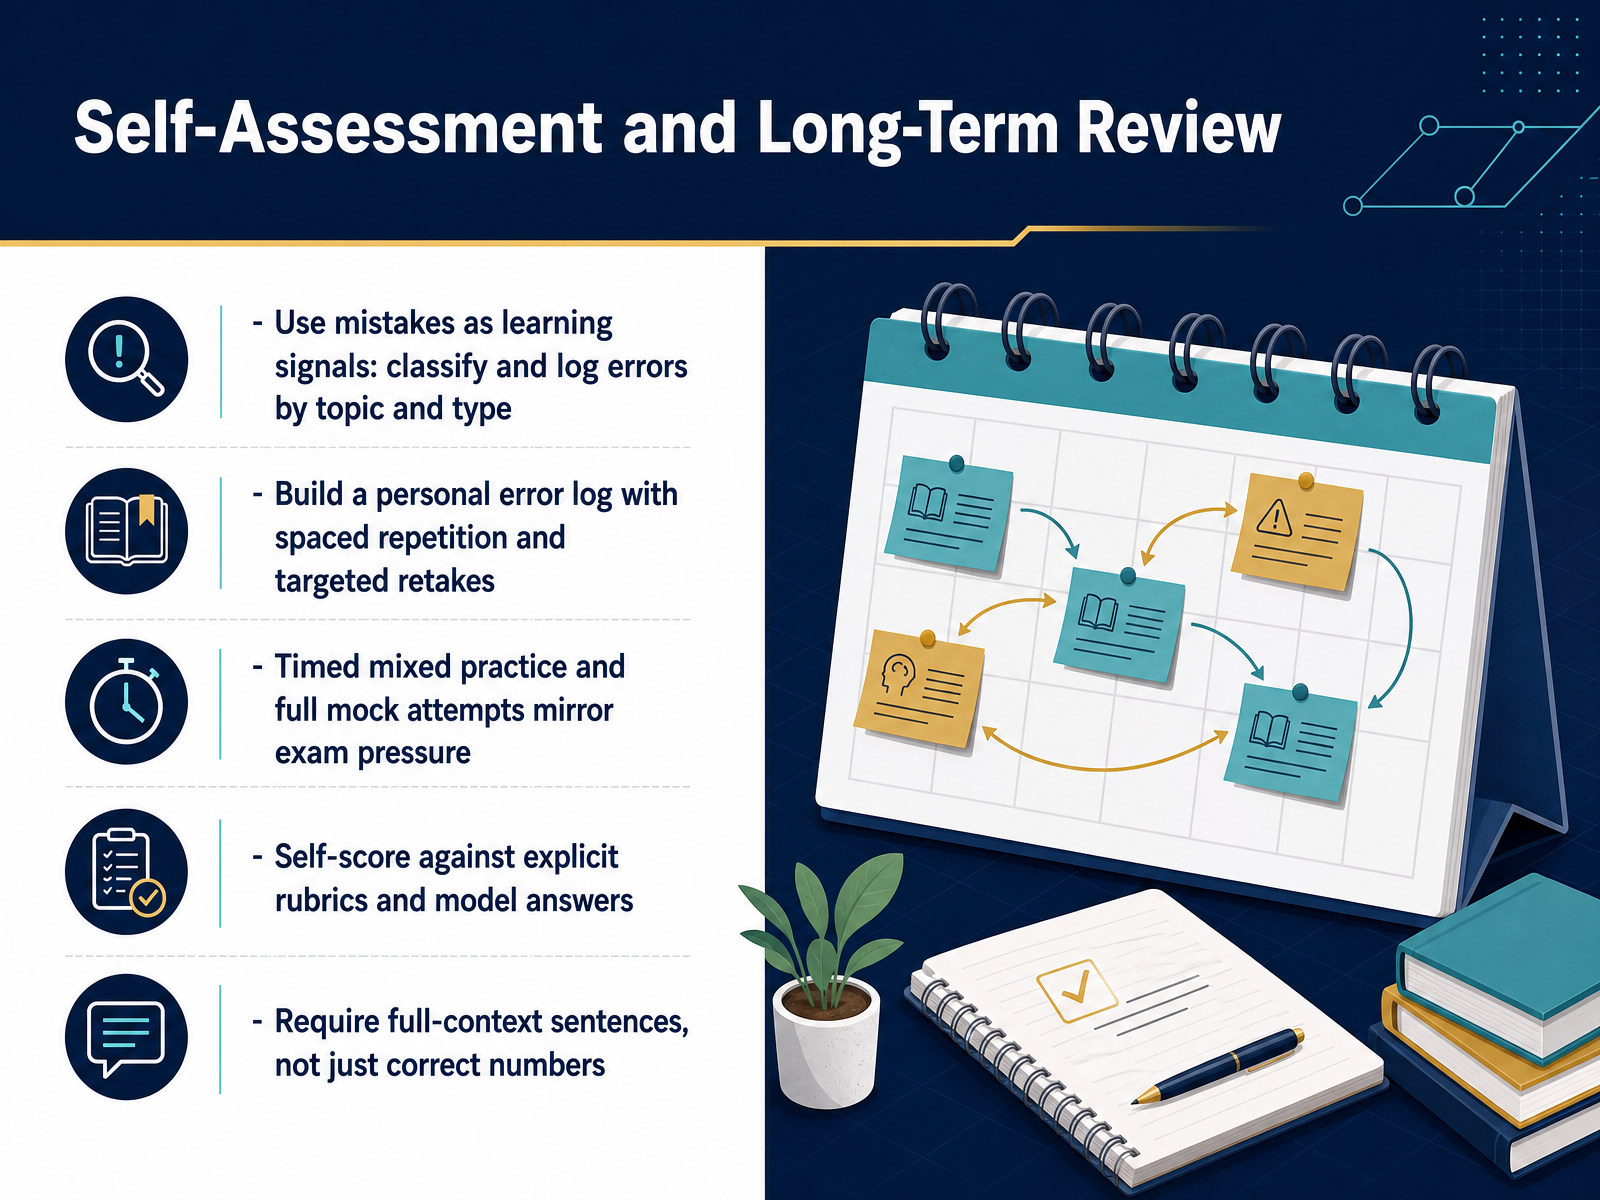
 - 13Self-Assessment and Long-Term ReviewNow let’s step back and make your practice work for the long run. Mistakes are not failures—they’re signals. Every time you miss a problem, classify the error. Was it a concept you didn’t know, a procedure you mixed up, or a communication issue in your written answer? Log it by topic and type. That error log becomes your personal study map. Build in spaced repetition, so you revisit each mistake after one day, then three, then a week. Target retakes on those exact problem types. As you improve, add timed mixed practice and full mock attempts to mirror exam pressure. When you self-score, use explicit rubrics and compare against model answers. And one more thing—always require full-context sentences, not just correct numbers. For example, don’t write “p is less than 0.05, reject the null.” Write “the data provide convincing evidence that the true mean weight exceeds 16 ounces.” That habit earns the points that separate good from great. Up next, we’ll walk through a practice problem clinic and curated resources to keep you moving.
 effortlessmath.comcollegeprep.uworld.comvibromedia.com+21 min
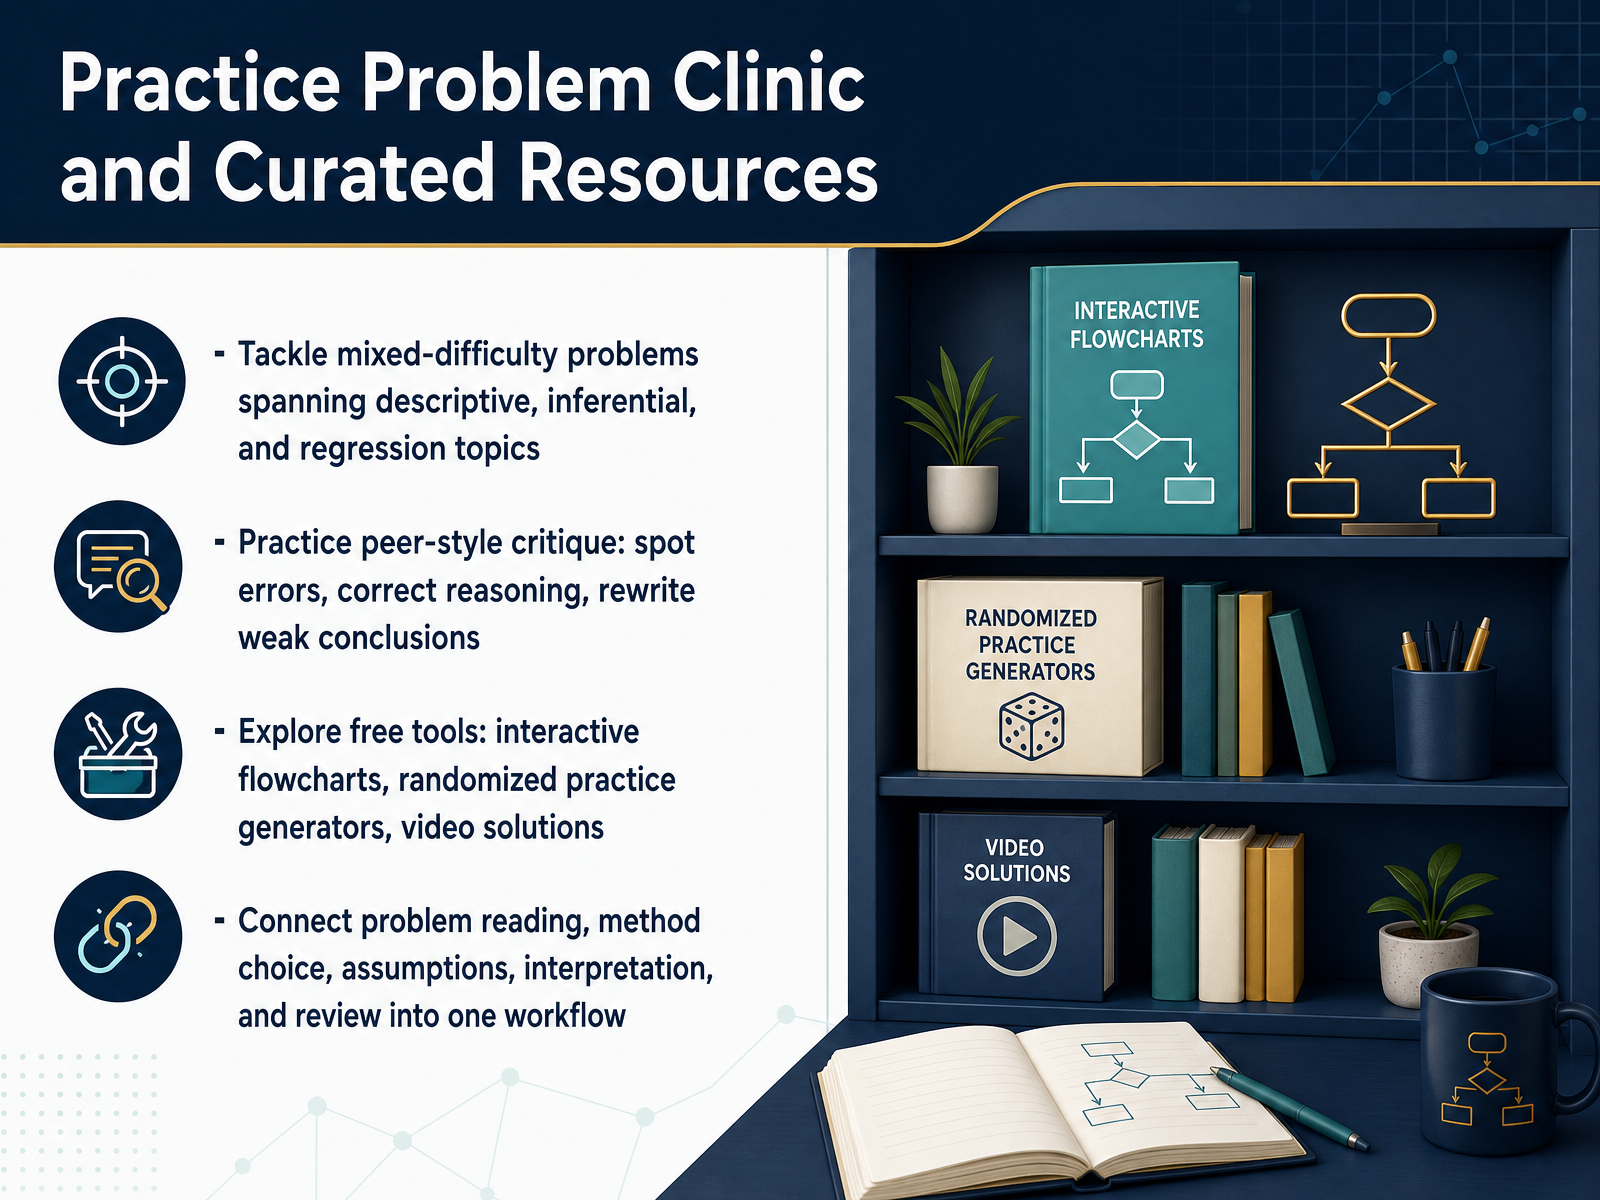
 - 14Practice Problem Clinic and Curated ResourcesLet’s pull all of this together with a final practice clinic. Try mixed-difficulty problems across descriptive statistics, inference, and regression. Don’t just solve them—critique them. Spot the error, correct the reasoning, and rewrite weak conclusions as if you were reviewing a peer’s work. It’s a powerful way to learn. If you want more guided practice, look for free tools with randomized generators and video solutions. These give you unlimited reps and show every step. And don’t forget the interactive flowcharts for choosing methods. Pair them with your practice so method choice becomes second nature. As you work, connect the whole workflow: read the problem carefully, pick the right method, check your assumptions, calculate, and then interpret in context. That loop is the real skill. Thank you for working through these problems. Keep practicing, stay curious, and trust the process. You’re building real expertise, one problem at a time.
 afit.edumosqueras.comlivephysics.com+21 min
Take the deck with you
Download this course as a file — free, no sign-up needed.
- PDF handoutEvery slide page, ready to print or share.15 pages · 4.2 MBDownload
- Narrated PowerPointThe deck that presents itself — every slide carries the digital human's narration video.15 pages · 15.7 MBDownload
- PowerPoint slidesThe full deck as a .pptx — open it in PowerPoint, Keynote, or Google Slides.15 pages · 4.1 MBDownload
Free to use in your own training — please keep the PersonWise credit page at the end.
Have your own deck? Turn it into a course
Sources consulted
Web sources consulted while building this course.
- Interactive Inferential Statistics Flowchart — afit.edu
- Hypothesis Testing Decision Chart – Mosquera — mosqueras.com
- AP Stats Inference Flowchart Cheat Sheet | LivePhysics™ — livephysics.com
- Appendix A — Method Selection Guide – Statistical Analysis for Small and Big Data — quarto.wessa.net
- Which Statistical Test Should I Use? — Free Decision Tree & Flowchart | StatMate — statmate.org
- How to Ace AP Statistics in 2026 (Without a Stats Background) | Effortless Math — effortlessmath.com
- How to Study for AP® Statistics Exam - Tips to Score a 5 — collegeprep.uworld.com
- AP Stats Review Guide: Units, Formulas & Practice 2026 - Vibro Media — vibromedia.com
- AP Statistics Study Guide: Complete Strategy for a 5 — gomdorieducation.com
- AP Statistics: The Complete 2026 Guide for Texas Students & Parents (New CED, Exam Format, Scores & Study Plan) — Texas CBE™ — texascbe.com
- How to Solve Statistics Word Problems | Step-by-Step Translation Guide — mathaigpt.com
- How to Decode Any Math Word Problem in 4 Steps - StudyWizardry Blog — blog.studywizardry.com
- How to turn word problems into math - Explained! | Purplemath — purplemath.com
- How to Solve Word Problems to Identify Independent and ... — effortlessmath.com
- Explanatory and Response Variables (2.4.2) | AP Statistics Notes | TutorChase — tutorchase.com
- Ten common statistical mistakes to watch out for when writing or reviewing a manuscript - PMC — pmc.ncbi.nlm.nih.gov
- Common mistakes in statistics and how to avoid them — documents.uow.edu.au
- Six textbook mistakes in data analysis — doi.org
- Ten Common Statistical Errors from All Phases of Research, and Their Fixes — doi.org
- 15 Common Statistics Mistakes (and How to Avoid Them) — statisticsfundamentals.com