Begin
14 pages · ~28 min
Business Analytics Examples: Patterns and Pitfalls
This training explores real-world business analytics examples, highlighting key patterns, strengths, and common pitfalls for analysts and decision-makers.
A digital instructor presents all 14 pages. Hold “Ask” at any point and ask out loud — the answer comes from this course. No sign-up needed.
What you’ll learn
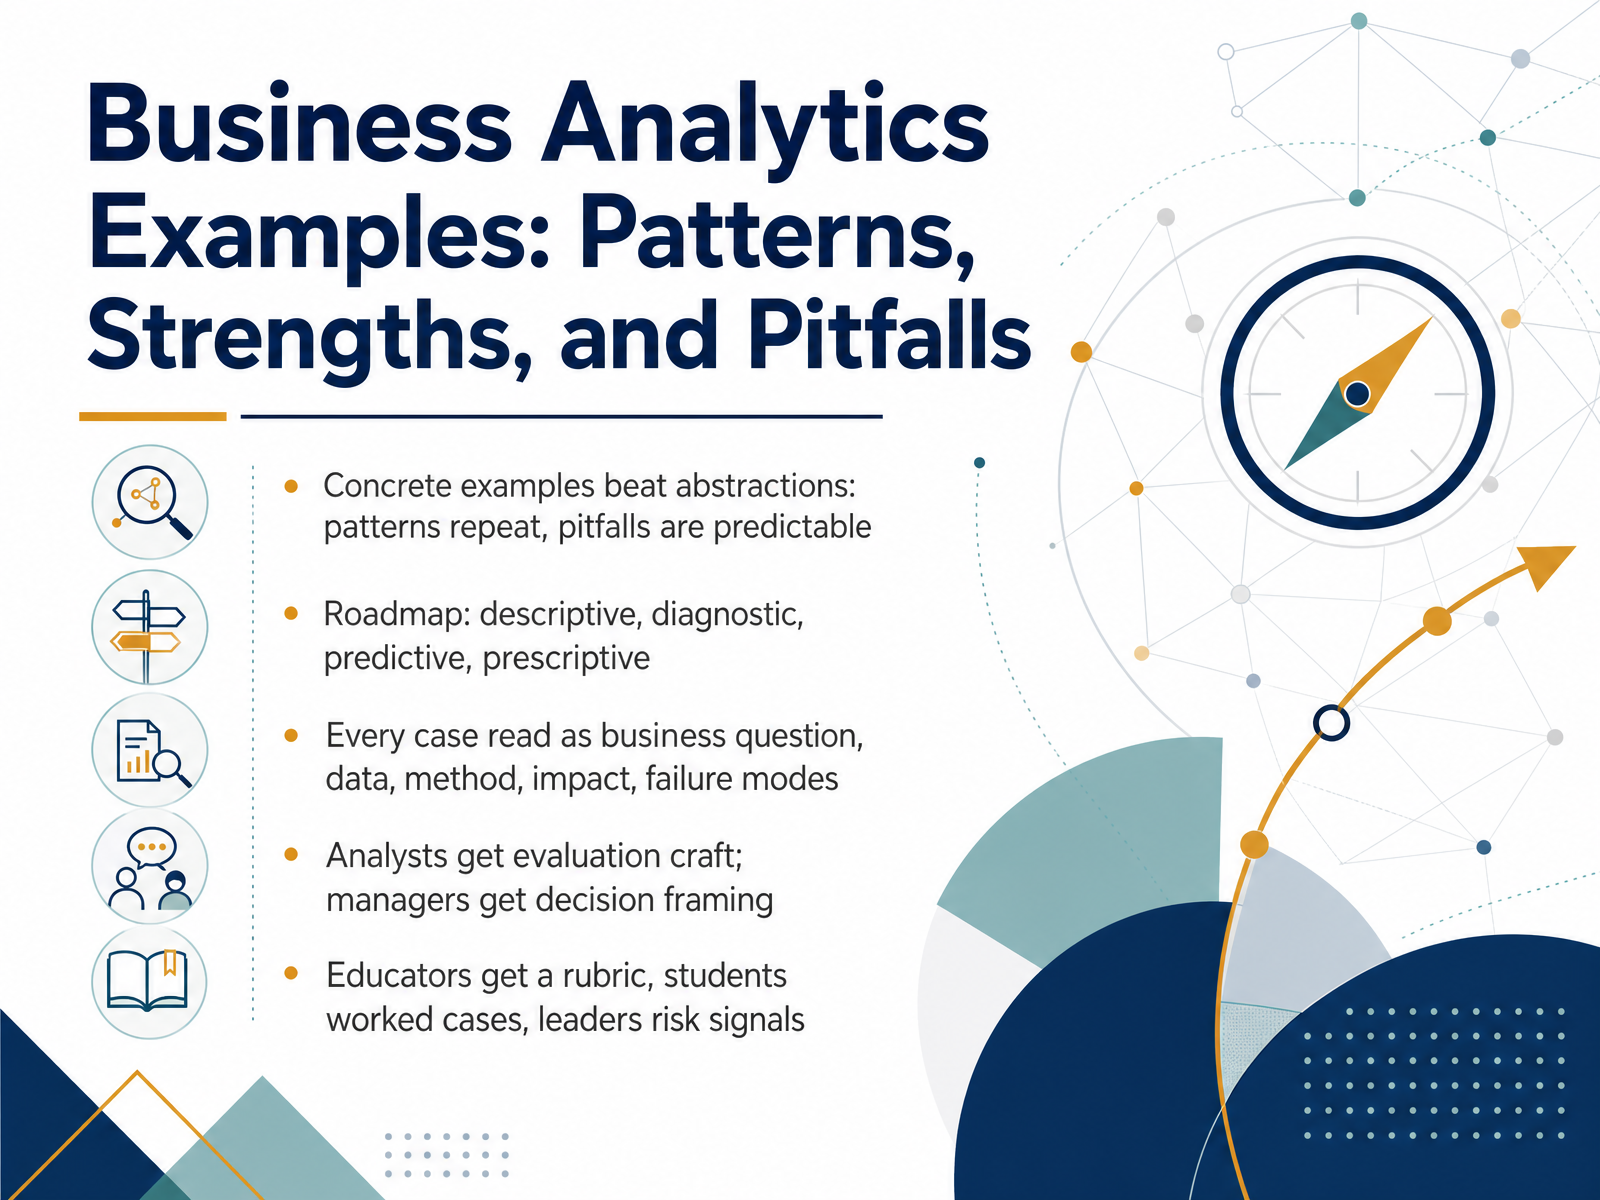
- 01Business Analytics Examples: Patterns, Strengths, and PitfallsWelcome. Over the next several slides, we'll look at business analytics through concrete examples, so the patterns are easier to recognize and the pitfalls are easier to avoid.
The roadmap is the four families you'll see named throughout: descriptive, diagnostic, predictive, and prescriptive analytics. Descriptive asks what happened. Diagnostic asks why. Predictive asks what is likely next. Prescriptive asks what to do about it.
For each case, we'll read it the same way: the business question, the data, the method, the impact, and the failure modes. That last point matters. A result without its limits is just a headline.
What you take away depends on your role. Analysts get evaluation craft. Managers get decision framing. Educators get a rubric, students get worked cases, and leaders get risk signals.
This works when we treat every example as a claim to be tested, not a success story to be repeated. Watch for cases that look impressive but rest on weak data or vague measures.
Next, we'll walk through the four analytics families and what each one answers.thoughtspot.comibm.comdomo.com+22 min
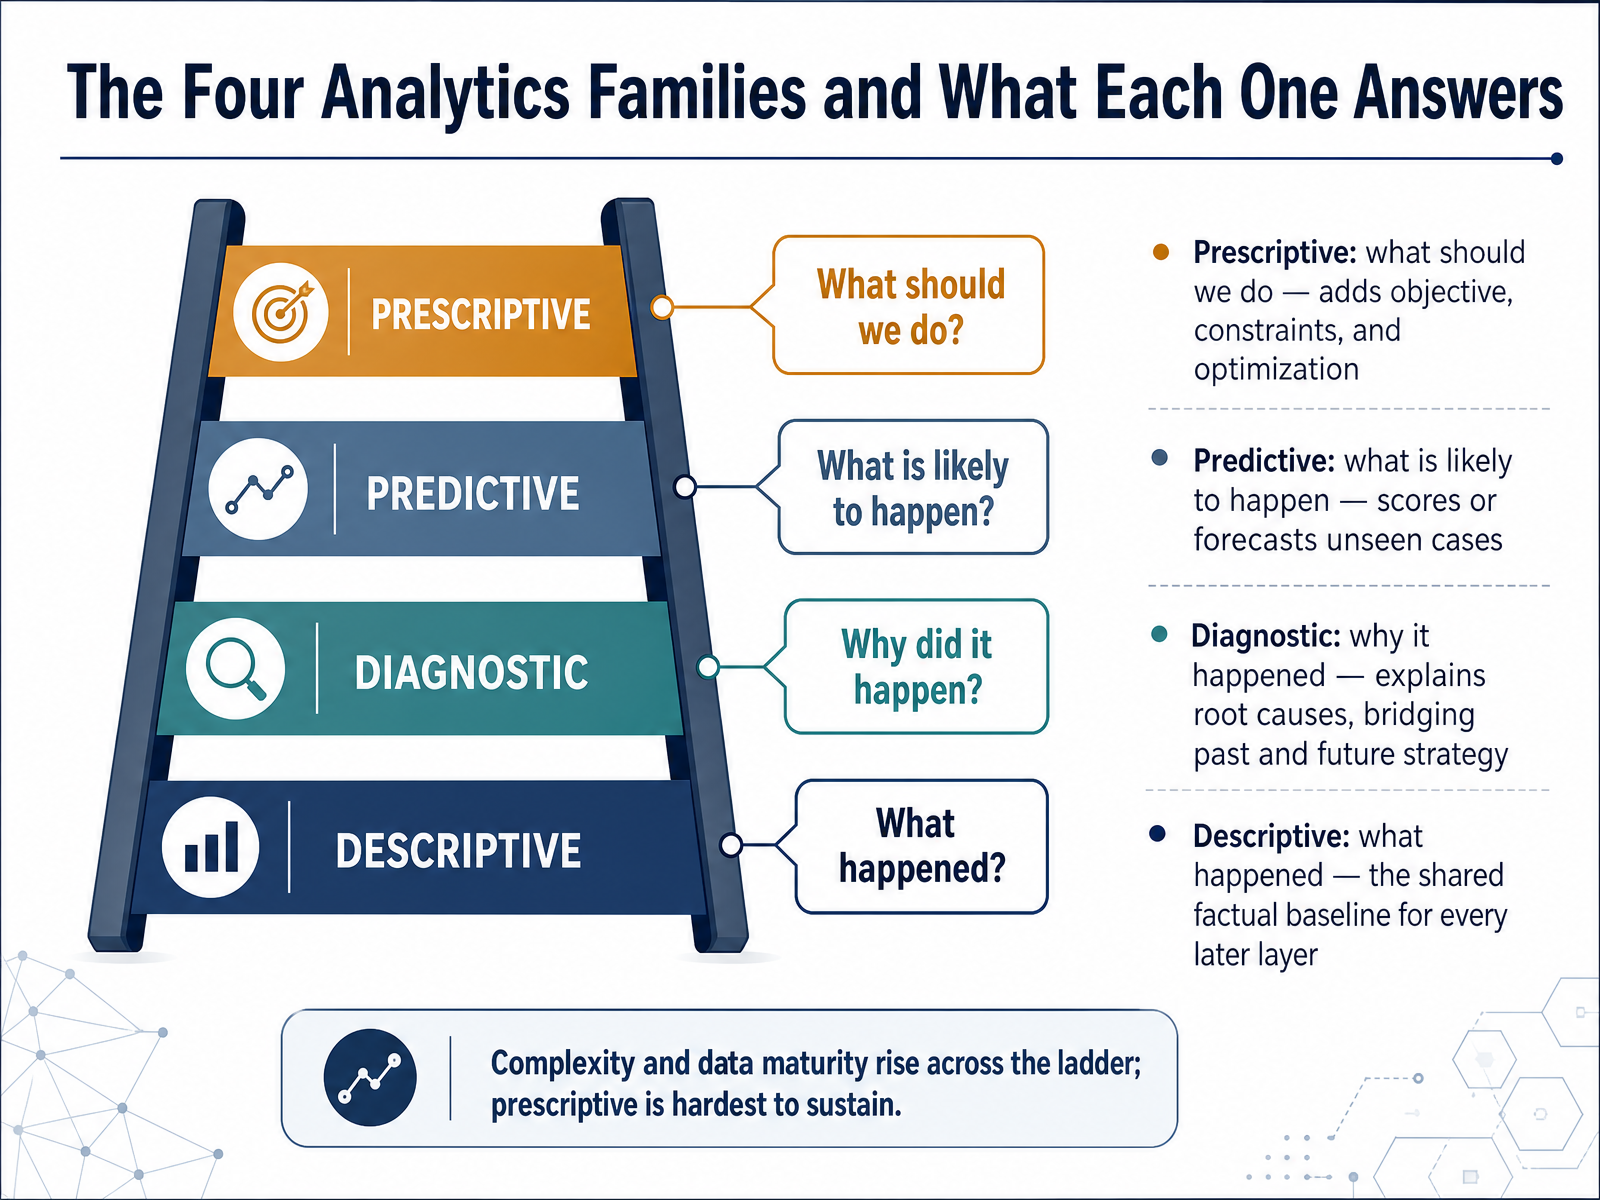
- 02The Four Analytics Families and What Each One AnswersLet's walk through the four analytics families, and the question each one answers. Descriptive analytics tells you what happened. It summarizes the past into dashboards, reports, and trends, and it gives every later layer a shared factual baseline. Diagnostic analytics asks why it happened. It looks for root causes, often through drill-downs and correlation, and it bridges the past with future strategy. Predictive analytics estimates what is likely to happen. It scores or forecasts unseen cases, like which leads will convert or how much demand to expect. Prescriptive analytics asks what we should do. It adds an objective, constraints, and optimization, so it recommends an action rather than just a forecast. These four sit on a ladder. Complexity and required data maturity rise as you climb, and prescriptive is the hardest to sustain. This works when your data foundations are solid. Watch for skipping straight to prediction without reliable descriptive data underneath. Next, we look at reading a case using the five-part evaluation template.
 thoughtspot.comibm.comdomo.com+21 min
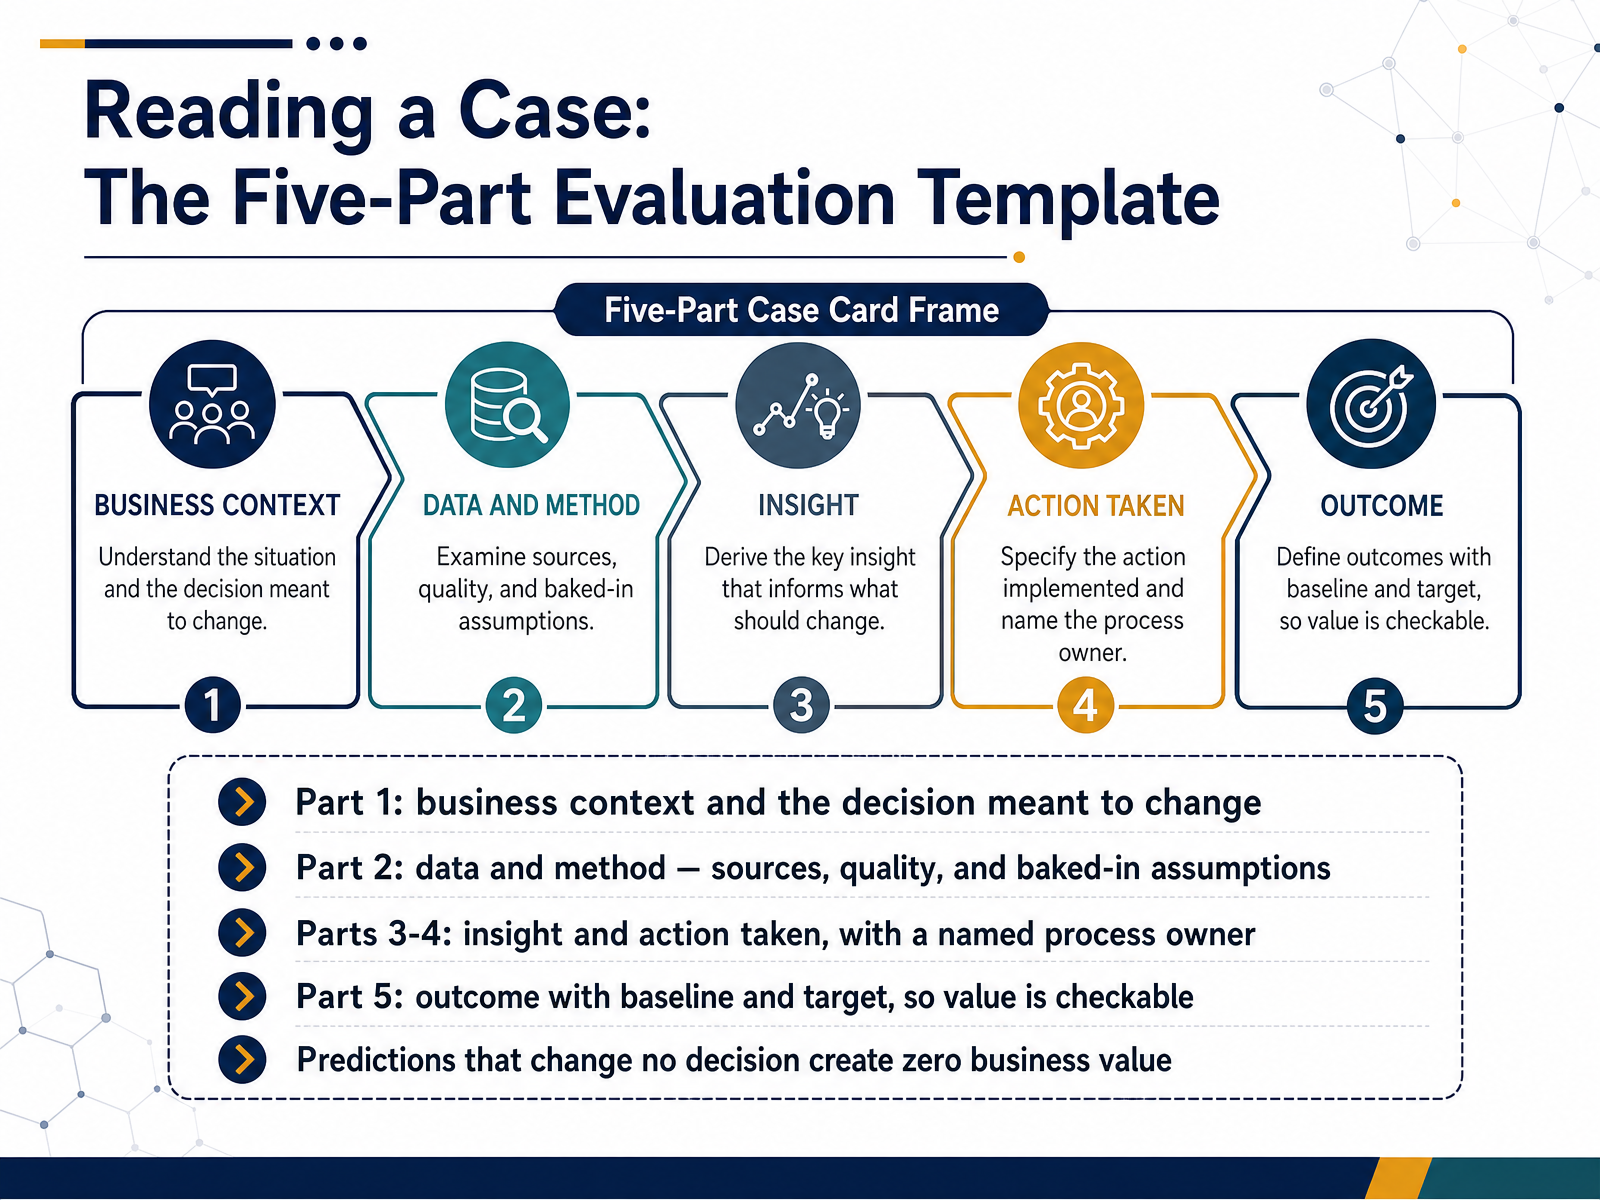
- 03Reading a Case: The Five-Part Evaluation TemplateLet's walk through a five-part template for reading any analytics case. Part one is business context, and specifically the decision the work was meant to change. If no decision changes, there is no value to create. Part two covers data and method: where the data came from, how good it was, and which assumptions were baked in. Those assumptions often matter more than the model itself. Parts three and four are the insight and the action taken, with a named process owner. A recommendation without an owner usually stays a recommendation. Part five is the outcome, stated against a baseline and a target, so the value is checkable rather than asserted. The central test is simple: predictions that change no decision create zero business value, however accurate they are. This template works when you apply it before you judge the analytics. Watch for cases that stop at insight and never name an owner or a baseline. Next, we will turn this into a reusable scoring rubric in Strength Lens and Pitfall Lens.
 informs.orgapni.rudoi.org+21 min
- 04Strength Lens and Pitfall Lens: A Reusable Scoring RubricLet's look at a reusable scoring rubric that combines two lenses: one for strengths, one for pitfalls. Think of it as a pre-build check rather than a post-mortem.
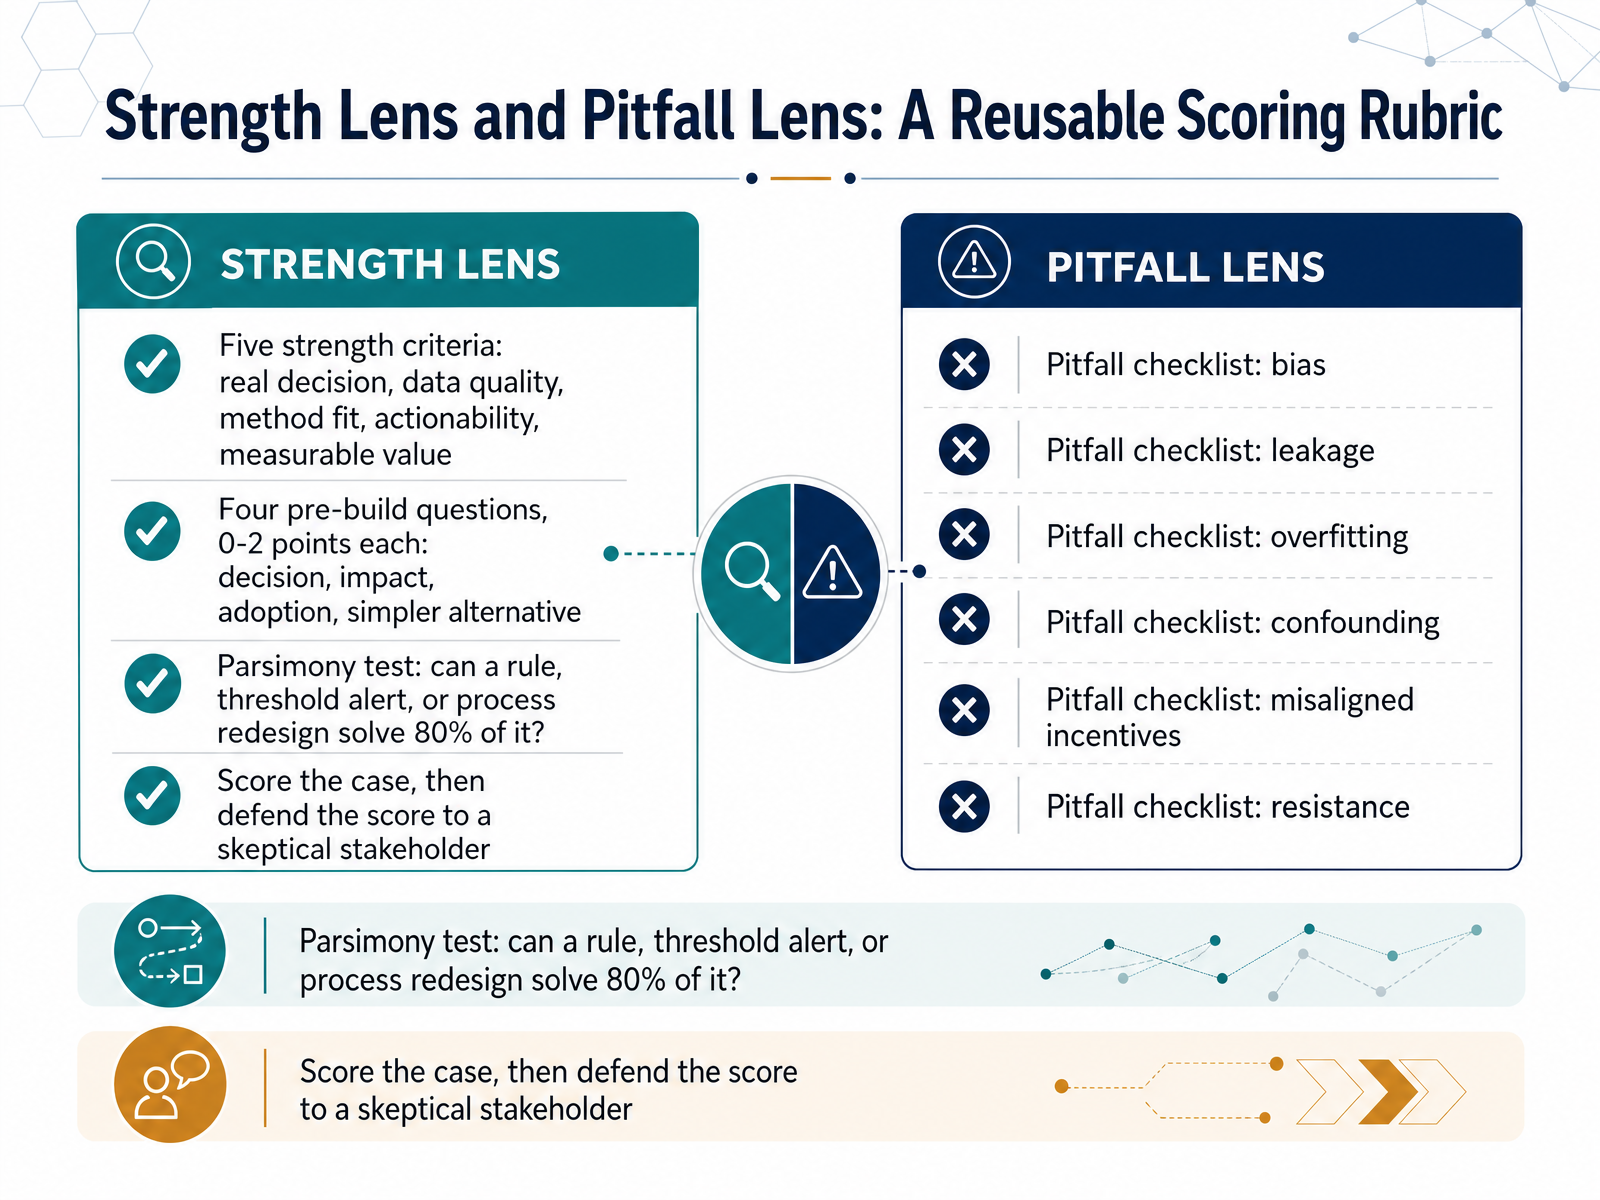
The strength lens uses five criteria. Is there a real decision the model will change? How good is the data? Does the method fit the problem? Can someone act on the output? And can we measure the value? A model that predicts accurately but changes no decision produces zero business value.
The pre-build questions score zero, one, or two points each, covering four things: the decision itself, the potential impact, the likelihood of adoption, and whether a simpler alternative exists. That last one matters. Ask explicitly: could a rule, a threshold alert, or a process redesign solve about eighty percent of this problem at a fraction of the cost?
The pitfall checklist names the common failure modes: bias, data leakage, overfitting, confounding, misaligned incentives, and user resistance. Naming them before you build is cheaper than discovering them after.
The parsimony test is a quick filter. If a simple rule handles most of the case, the more complex model must be justified, not assumed.
Finally, score the case, then defend the score to a skeptical stakeholder. The defense is the real test of whether the case is sound.
Next, we turn to descriptive analytics and how it helps us see the business clearly.
 informs.orgapni.rudoi.org+22 min
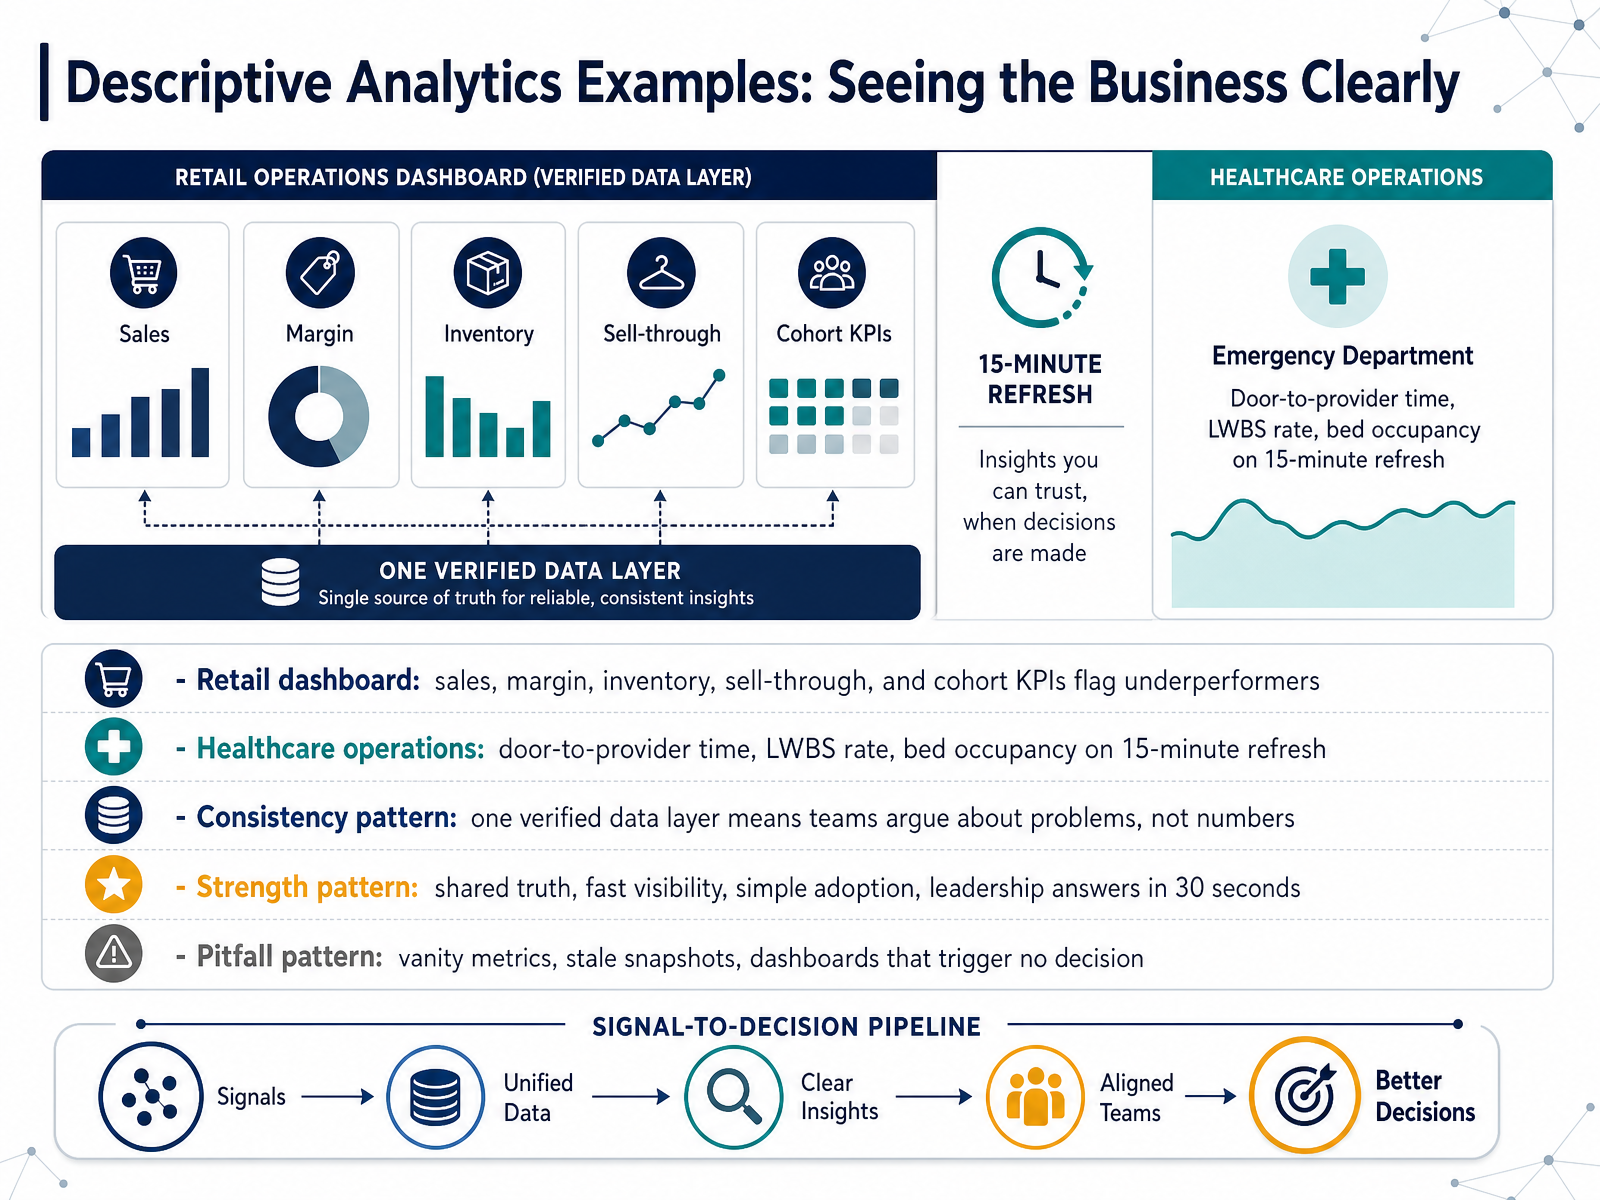
- 05Descriptive Analytics Examples: Seeing the Business ClearlyLet's look at descriptive analytics in practice, starting with two common settings. In retail, a dashboard brings sales, margin, inventory, sell-through, and cohort metrics into one view, flagging underperforming stores or products early. In healthcare operations, measures like door-to-provider time, the left-without-being-seen rate, and bed occupancy refresh every fifteen minutes to support throughput decisions. Across both, one pattern holds. When everyone pulls from a single verified data layer, teams argue about problems, not numbers. That is the core strength here: a shared truth, fast visibility, and simple adoption, so leadership can get an answer in about thirty seconds. But watch for the pitfalls. Vanity metrics look good and change nothing. Stale snapshots mislead. And a dashboard that triggers no decision is just decoration. So ask of any descriptive view: which decision does this actually drive? Next, we move to diagnostic analytics, and explaining why something happened.
 doi.orgknowi.comlets-viz.com+21 min
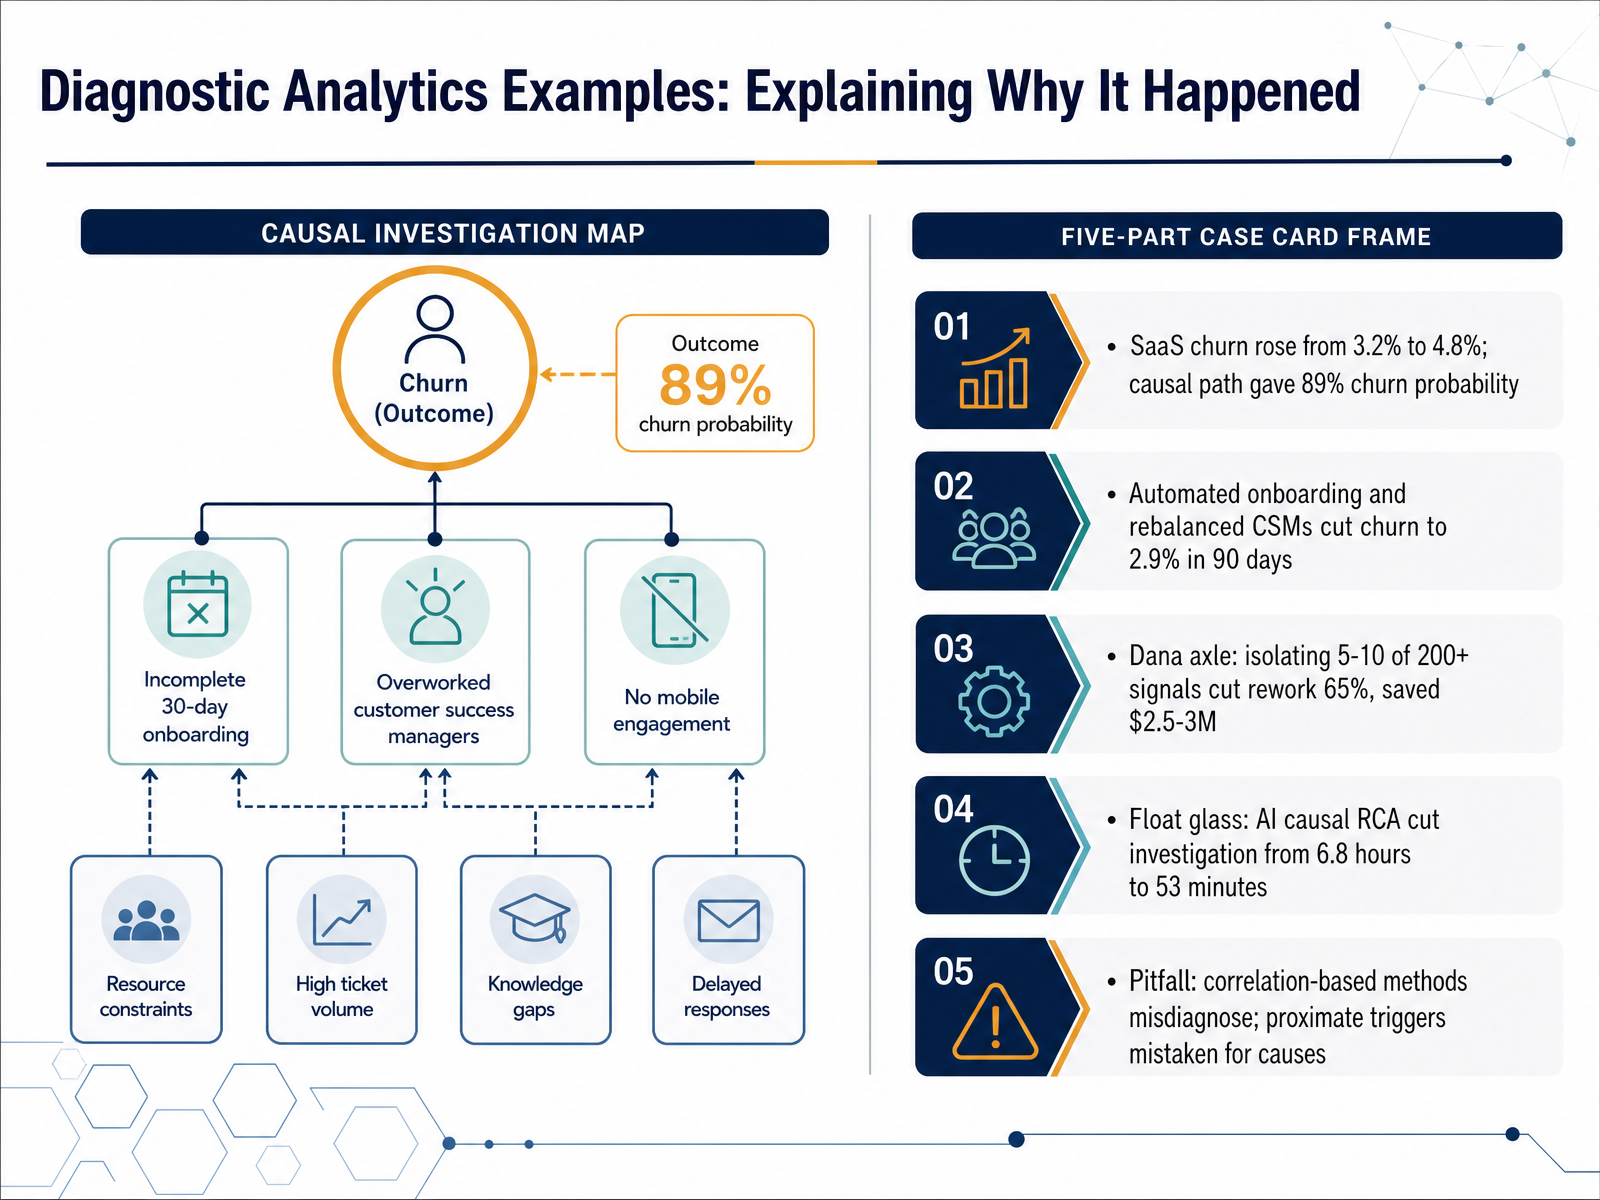
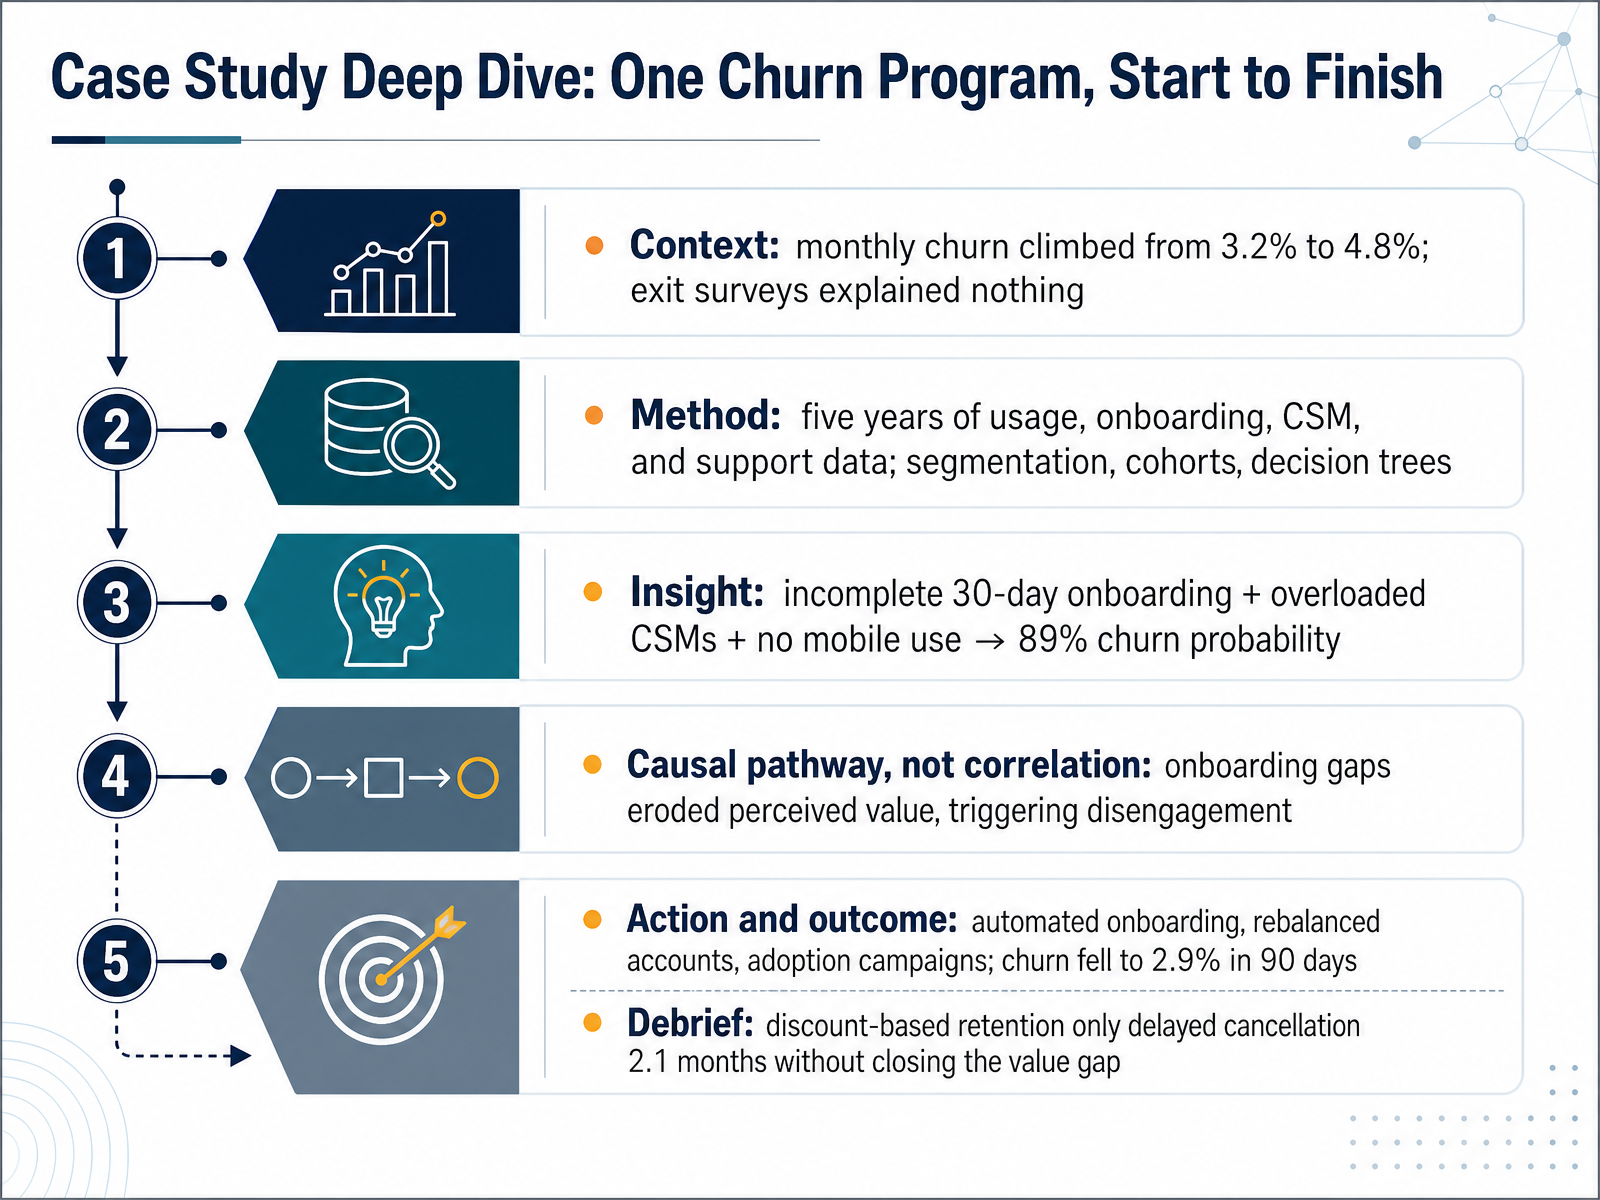
- 06Diagnostic Analytics Examples: Explaining Why It HappenedLet's move on to diagnostic analytics, the work of explaining why something happened. Here the question shifts from what changed to what caused it. Consider a SaaS company whose monthly churn rose from three point two percent to four point eight percent. A decision-tree analysis traced a causal path: incomplete onboarding led to lower perceived value, which reduced engagement, which raised churn probability to eighty nine percent. The fix followed the cause. Automated onboarding and rebalanced customer success accounts cut churn to two point nine percent within ninety days. In manufacturing, Dana isolated five to ten signals out of more than two hundred, which cut axle rework by sixty five percent and saved two point five to three million dollars. A float glass producer used AI-driven root cause analysis to cut investigation time from six point eight hours to fifty three minutes. The pitfall is real: correlation-based methods misdiagnose, mistaking a proximate trigger for the underlying cause. This works when you can test multiple hypotheses against real process data, so watch for confident answers built only on correlation. Next, we turn to forecasting what comes next.
 scoopanalytics.comthoughtspot.comaiformanufacturing.org+22 min
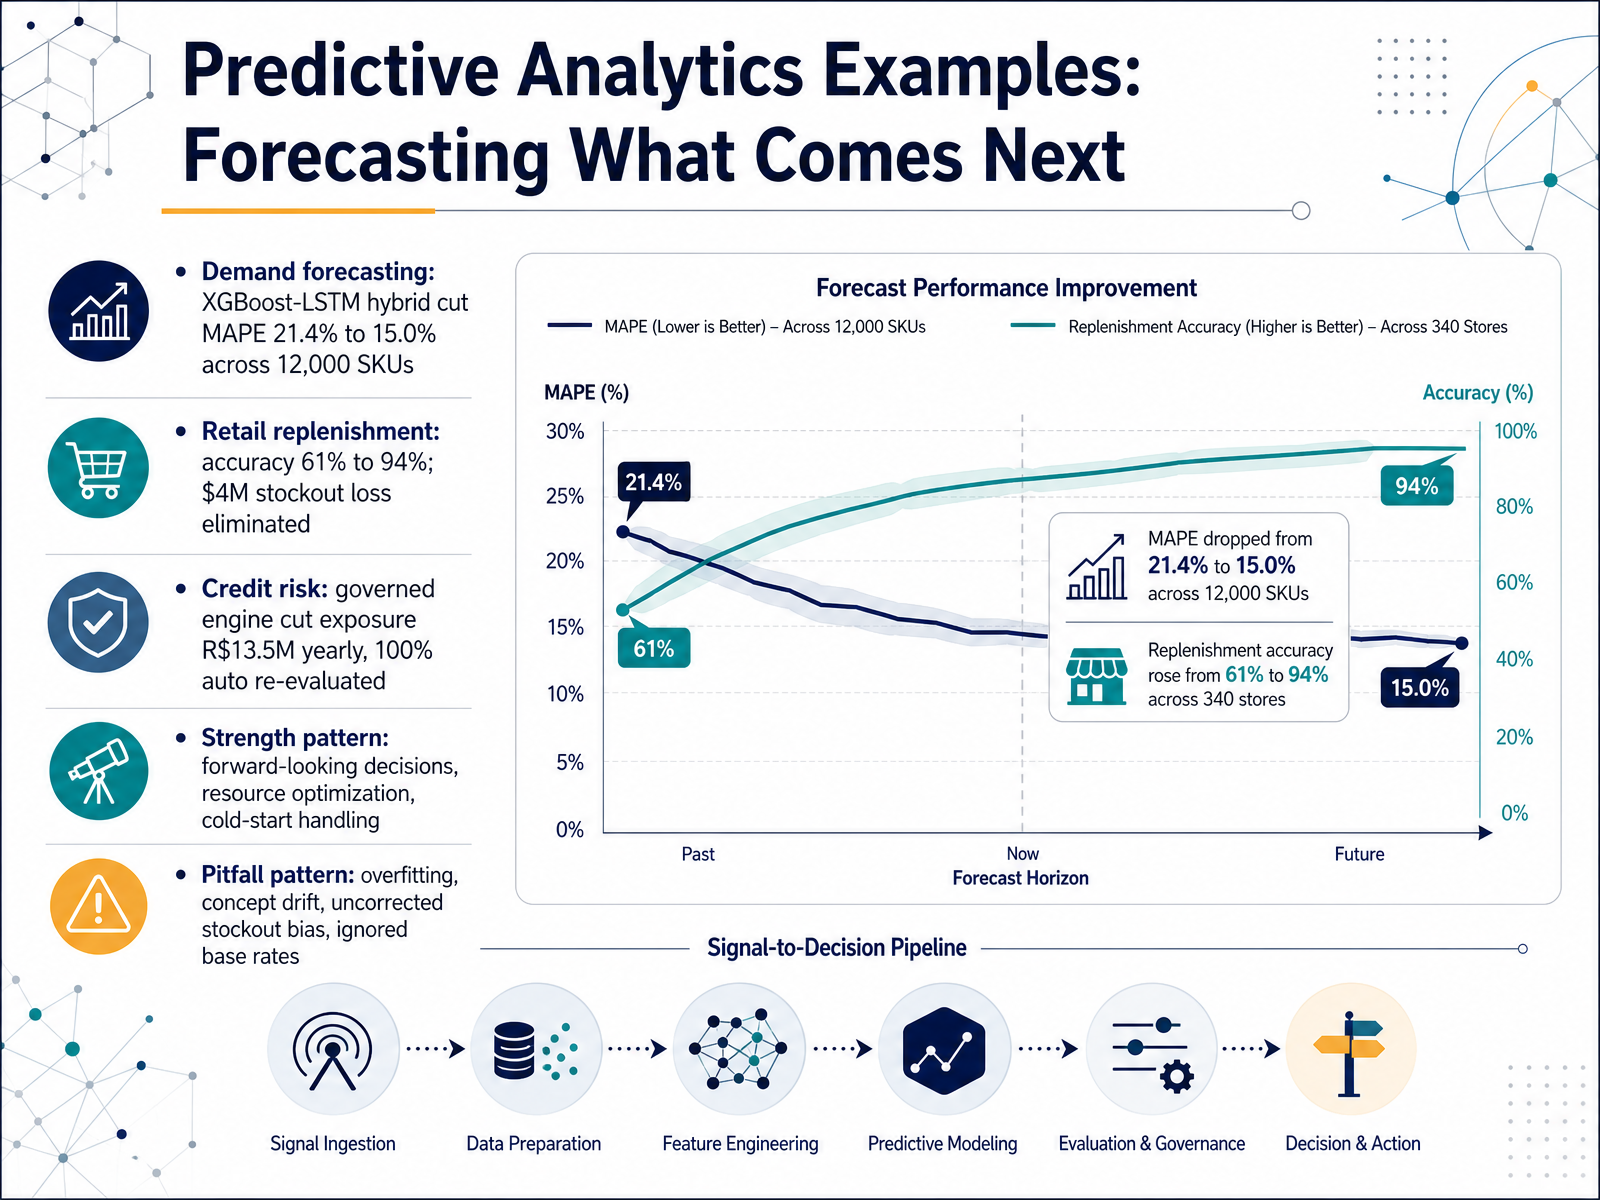
- 07Predictive Analytics Examples: Forecasting What Comes NextNow let's look at predictive analytics in practice, where the goal is forecasting what comes next. Three examples show the pattern. First, demand forecasting. In one distribution operation covering twelve thousand SKUs, an XGBoost-LSTM hybrid cut mean absolute percentage error from twenty-one point four percent to fifteen percent. Second, retail replenishment. A national retailer lifted forecast accuracy from sixty-one percent to ninety-four percent, eliminating four million dollars in annual stockout loss. Third, credit risk. A governed engine reduced yearly exposure by thirteen point five million reais and now automatically re-evaluates every customer each month. Notice the shared strengths. These systems support forward-looking decisions, optimize resources, and handle cold-start items with limited history. But watch for the pitfalls. Overfitting, concept drift, uncorrected stockout bias, and ignored base rates can quietly undermine results. This works when data quality is addressed first. Coming up next, prescriptive analytics examples, choosing the best action.
 2 min
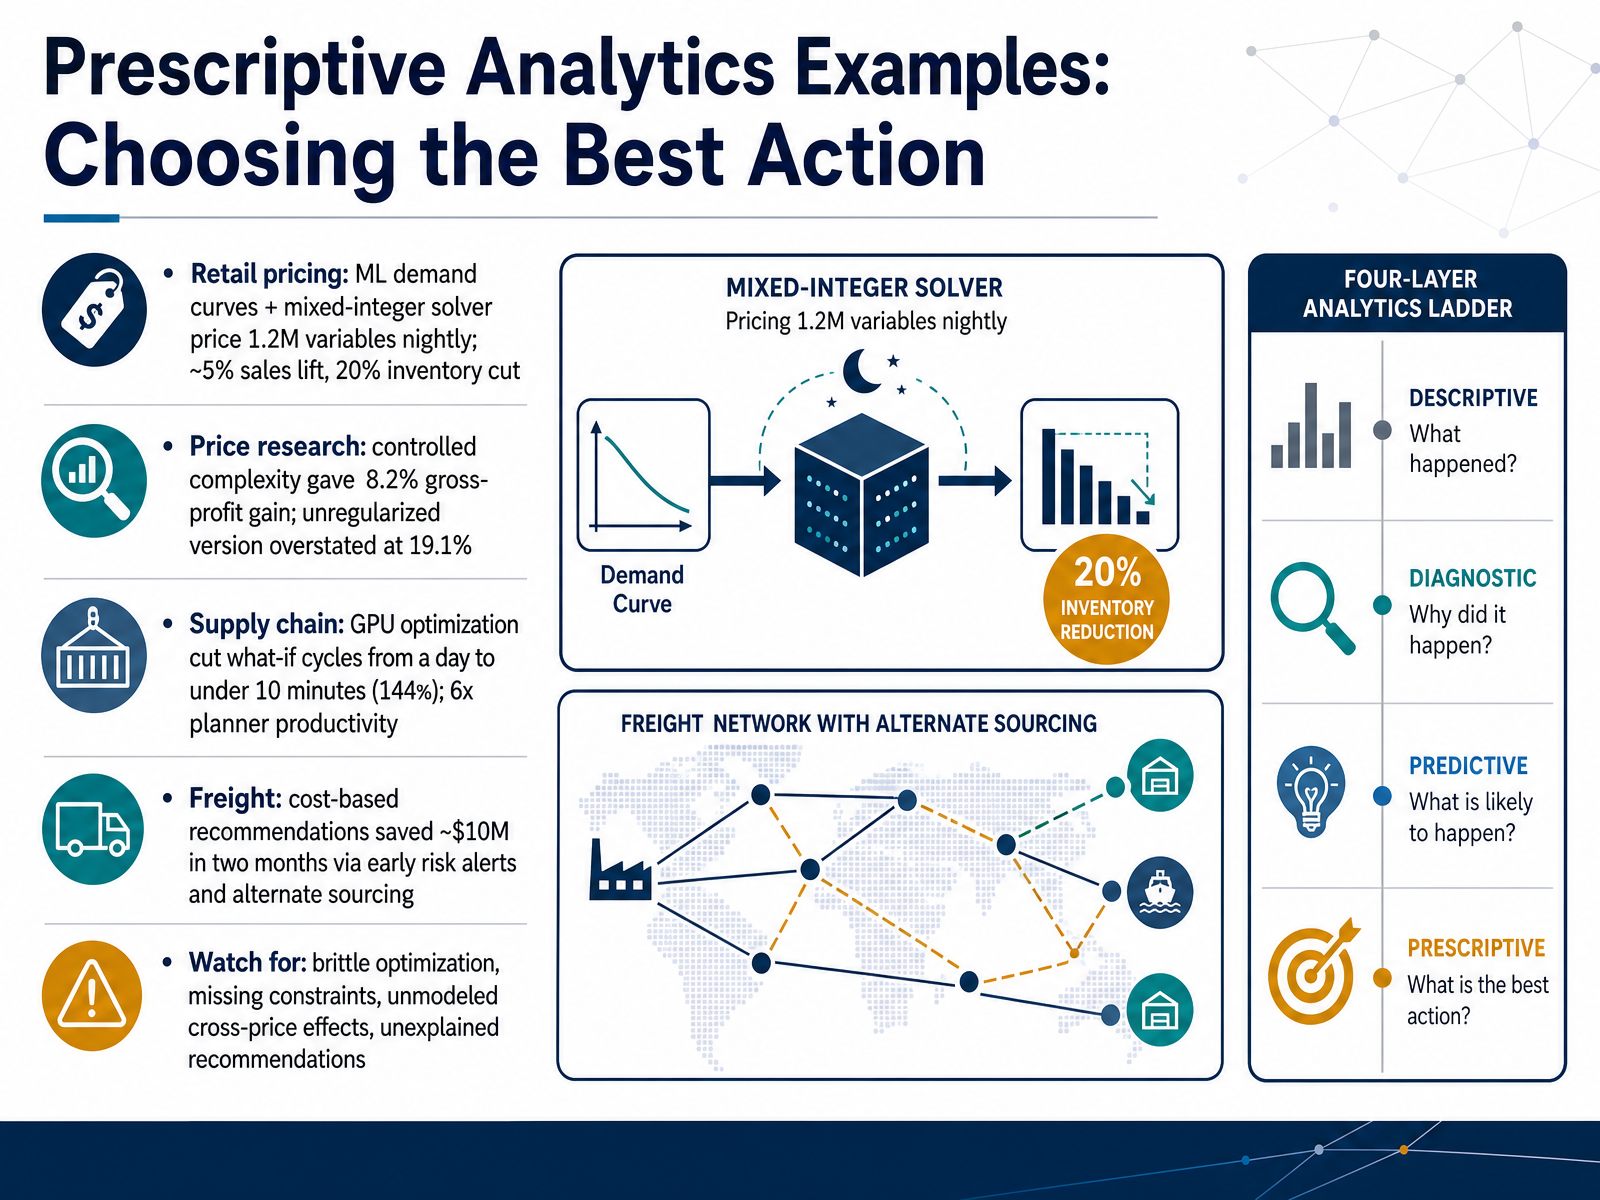
- 08Prescriptive Analytics Examples: Choosing the Best ActionNow let's look at prescriptive analytics in action, where the model doesn't just predict, it recommends a specific action. Start with retail pricing. Machine learning estimates demand curves, then a mixed-integer solver prices roughly one point two million variables overnight. One retailer reported about a five percent sales lift and a twenty percent inventory cut. Next, price research. Here the controlled, regularized model delivered an eight point two percent gross-profit gain, while the unregularized version overstated results at nineteen point one percent. That gap is the lesson. Now supply chain. A GPU-accelerated optimizer cut what-if planning cycles from a full day to under ten minutes, about one hundred forty-four times faster, with six times planner productivity. And freight. Cost-based recommendations saved roughly ten million dollars in two months through early risk alerts and alternate sourcing. But watch for the pitfalls. Brittle optimization, missing constraints, unmodeled cross-price effects, and recommendations nobody can explain. This works when constraints are complete and models stay honest. Next, cross-cutting pattern: data quality sets the ceiling.
 2 min
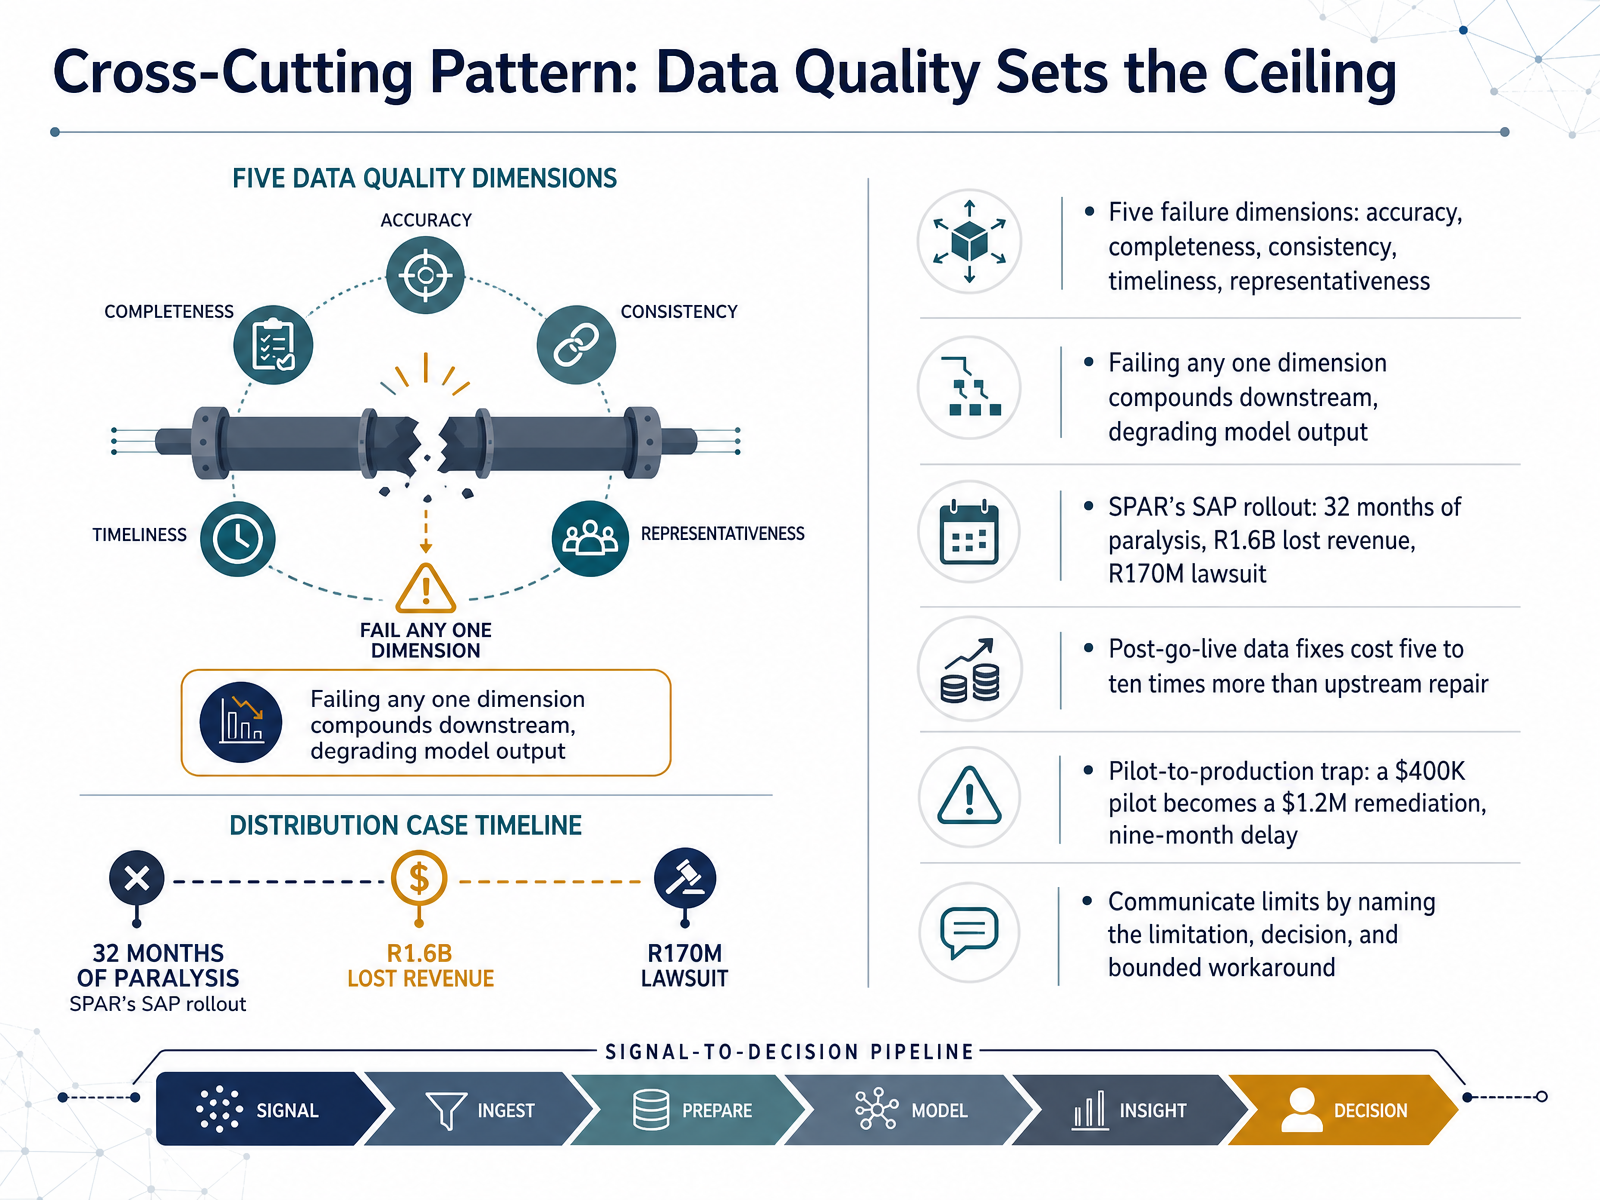
- 09Cross-Cutting Pattern: Data Quality Sets the CeilingLet's look at the cross-cutting pattern: data quality sets the ceiling. There are five failure dimensions to check. Accuracy, completeness, consistency, timeliness, and representativeness. Fail any one, and the damage compounds downstream, degrading your model output. Take SPAR's SAP rollout. Data quality failures contributed to 32 months of operational paralysis, about R1.6 billion in lost revenue, and a R170 million lawsuit. That's the ceiling in practice. Here's the harder economics. Post go-live data fixes cost five to ten times more than repairing the same issues upstream. And watch for the pilot-to-production trap. A 400 thousand dollar pilot can become a 1.2 million dollar remediation with a nine-month delay, because the curated pilot data never matched production. When you communicate limits, name the limitation, name the decision it affects, and offer a bounded workaround. This works when leadership treats data readiness as a go-live gate, not a cleanup task. Next, we turn to a cross-cutting pitfall: bias, privacy, and governance.
 1 min
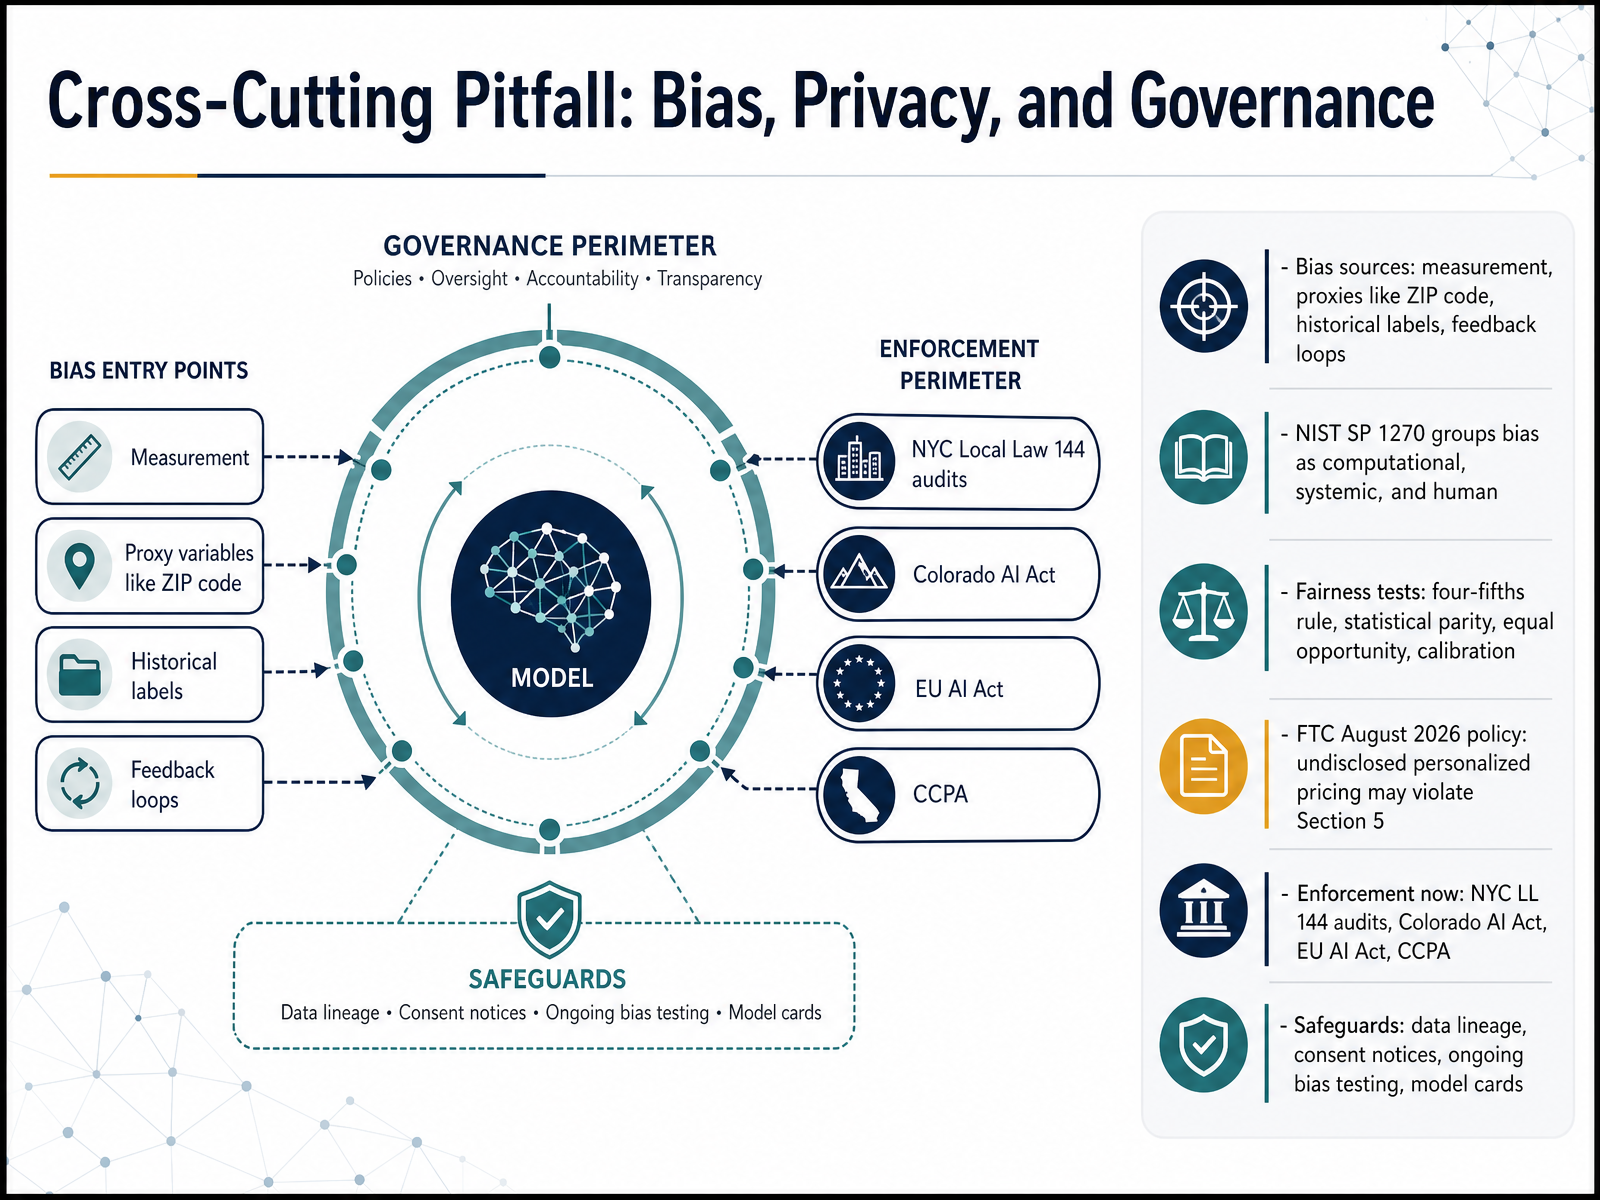
- 10Cross-Cutting Pitfall: Bias, Privacy, and GovernanceLet's bring the cross-cutting risks together. Bias enters analytics in predictable places: measurement, where features are recorded differently across groups, proxies like ZIP code that stand in for race or income, historical labels that encode past discrimination, and feedback loops, where a model's own decisions shape the data it later learns from. NIST Special Publication 1270 groups these as computational, systemic, and human bias. Testing matters because no single metric covers everything. The four-fifths rule flags adverse impact below zero point eight. Statistical parity checks whether outcomes depend on group membership. Equal opportunity compares true positive rates. Calibration checks whether a score means the same thing for everyone. Privacy and governance now carry real enforcement weight. The FTC's proposed August 2026 policy says undisclosed personalized pricing may violate Section 5. New York City Local Law 144 requires hiring audits, Colorado's AI Act starts enforcement in 2026, and the EU AI Act and CCPA add their own duties. Practical safeguards include data lineage, clear consent notices, ongoing bias testing, and model cards. This works when testing is continuous, not a one-time launch check. Watch for privacy theater, superficial compliance that regulators now actively scrutinize. From Example to Action: Assessing Your Own Analytics Case.
 2 min
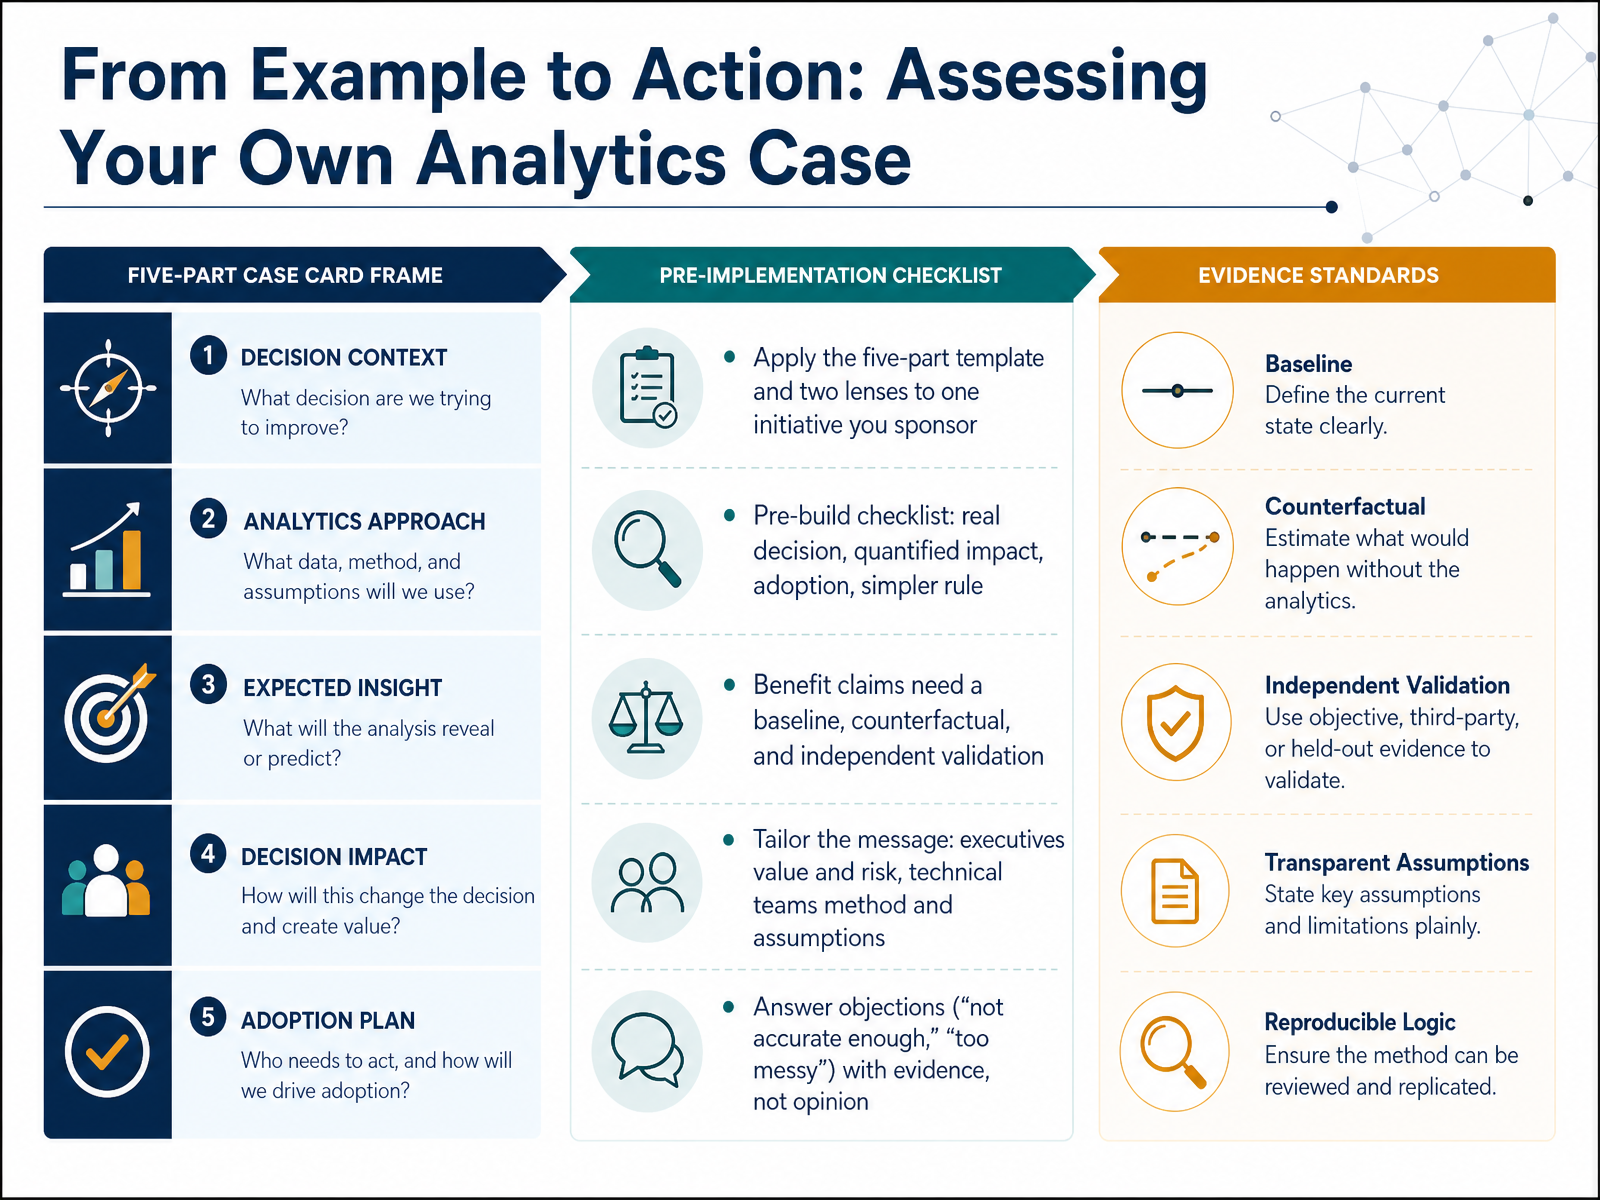
- 11From Example to Action: Assessing Your Own Analytics CaseLet's turn the framework into something you can act on. Pick one initiative you sponsor, and run it through the five-part template and the two lenses. Before you build, run a short checklist. Is there a real decision behind this? Is the impact quantified? Will people actually adopt it? And could a simpler rule do most of the job? For any benefit claim, insist on three things: a baseline, a counterfactual, and independent validation. Then tailor the message. Executives care about value and risk. Technical teams care about method and assumptions. When someone objects that a model is not accurate enough, or that the data is too messy, respond with evidence, not opinion. Show the error tolerance the decision can absorb, and the lift over the current process. Watch for the temptation to defend the model instead of the decision. Now, let's see this in practice. Case Study Deep Dive: One Churn Program, Start to Finish.
 informs.orgapni.rudoi.org+22 min
- 12Case Study Deep Dive: One Churn Program, Start to FinishLet's walk through one churn program from start to finish. Monthly churn had climbed from three point two percent to four point eight percent, and exit surveys explained almost nothing. The team pulled five years of usage, onboarding, customer success, and support data, then applied segmentation, cohorts, and decision trees. The finding: customers with incomplete thirty-day onboarding, an overloaded customer success manager, and no mobile use carried an eighty-nine percent churn probability. Critically, the decision tree traced a causal pathway, not just a correlation. Onboarding gaps eroded perceived value, which triggered disengagement. The response was automated onboarding, rebalanced accounts, and adoption campaigns. Churn fell to two point nine percent within ninety days. One caveat worth noting: discount-based retention only delayed cancellation by two point one months without closing the value gap. Now, a credit engine that had to be explainable.
 scoopanalytics.comthoughtspot.comaiformanufacturing.org+21 min
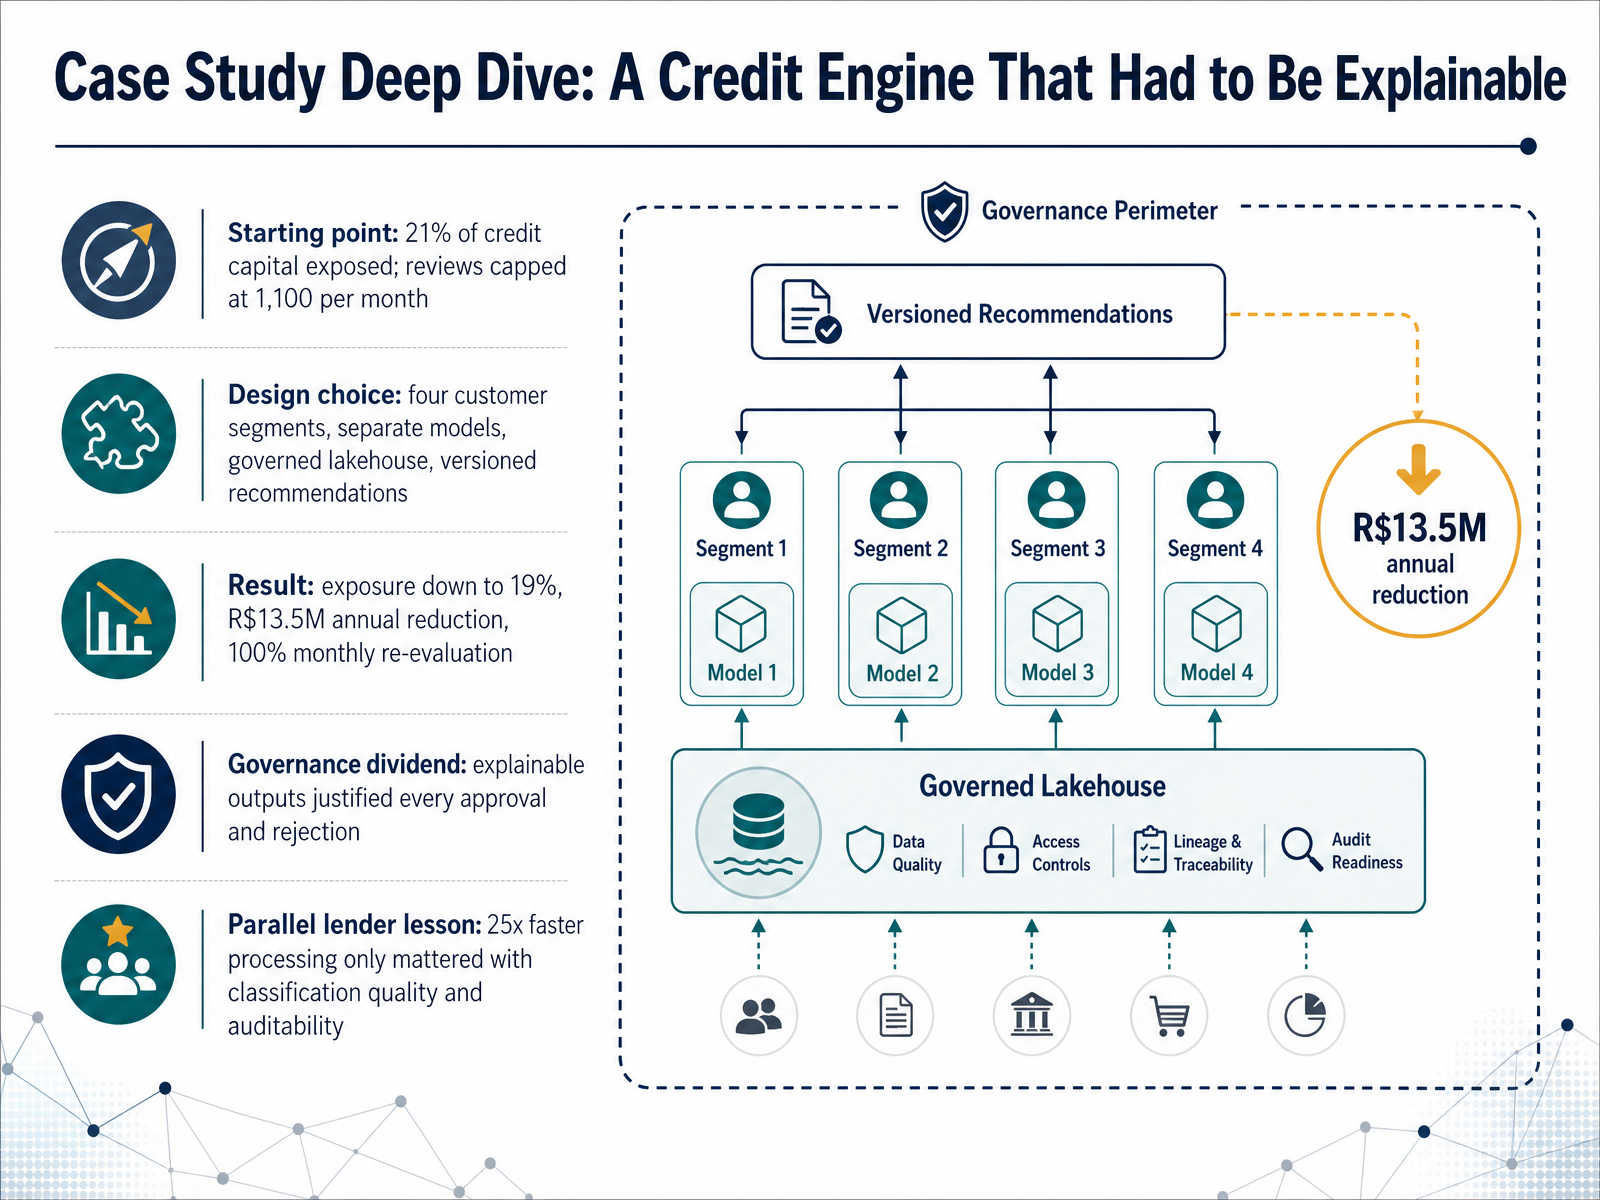
- 13Case Study Deep Dive: A Credit Engine That Had to Be ExplainableLet's walk through a concrete case: a credit engine that had to be explainable. This is Copa Energia, a large gas company in Latin America, working with Databricks and Mosaic AI. The starting point was tight. Twenty-one percent of credit capital was exposed, and reviews were capped at eleven hundred per month, with over two hundred seventy hours going to manual work. The design choice was segmentation. Four customer groups, each with its own model, sitting on a governed lakehouse, so every recommendation was versioned and traceable. The results followed. Exposure fell from twenty-one percent to nineteen percent, a reduction of thirteen point five million reais per year. And one hundred percent of customers are now re-evaluated monthly, with analysts handling only exceptions. Here is the governance dividend. Explainable outputs let the team justify every approval and rejection, using clear influencing variables. A parallel lender, Sicredi, shows the same logic. Their model processing ran twenty-five times faster, but that speed only mattered because classification quality and auditability held up. So this works when speed, quality, and governance move together. Watch for treating faster processing as the goal by itself. Next, we put these ideas to work in a workshop: Compare, Critique, and Decide.
 2 min
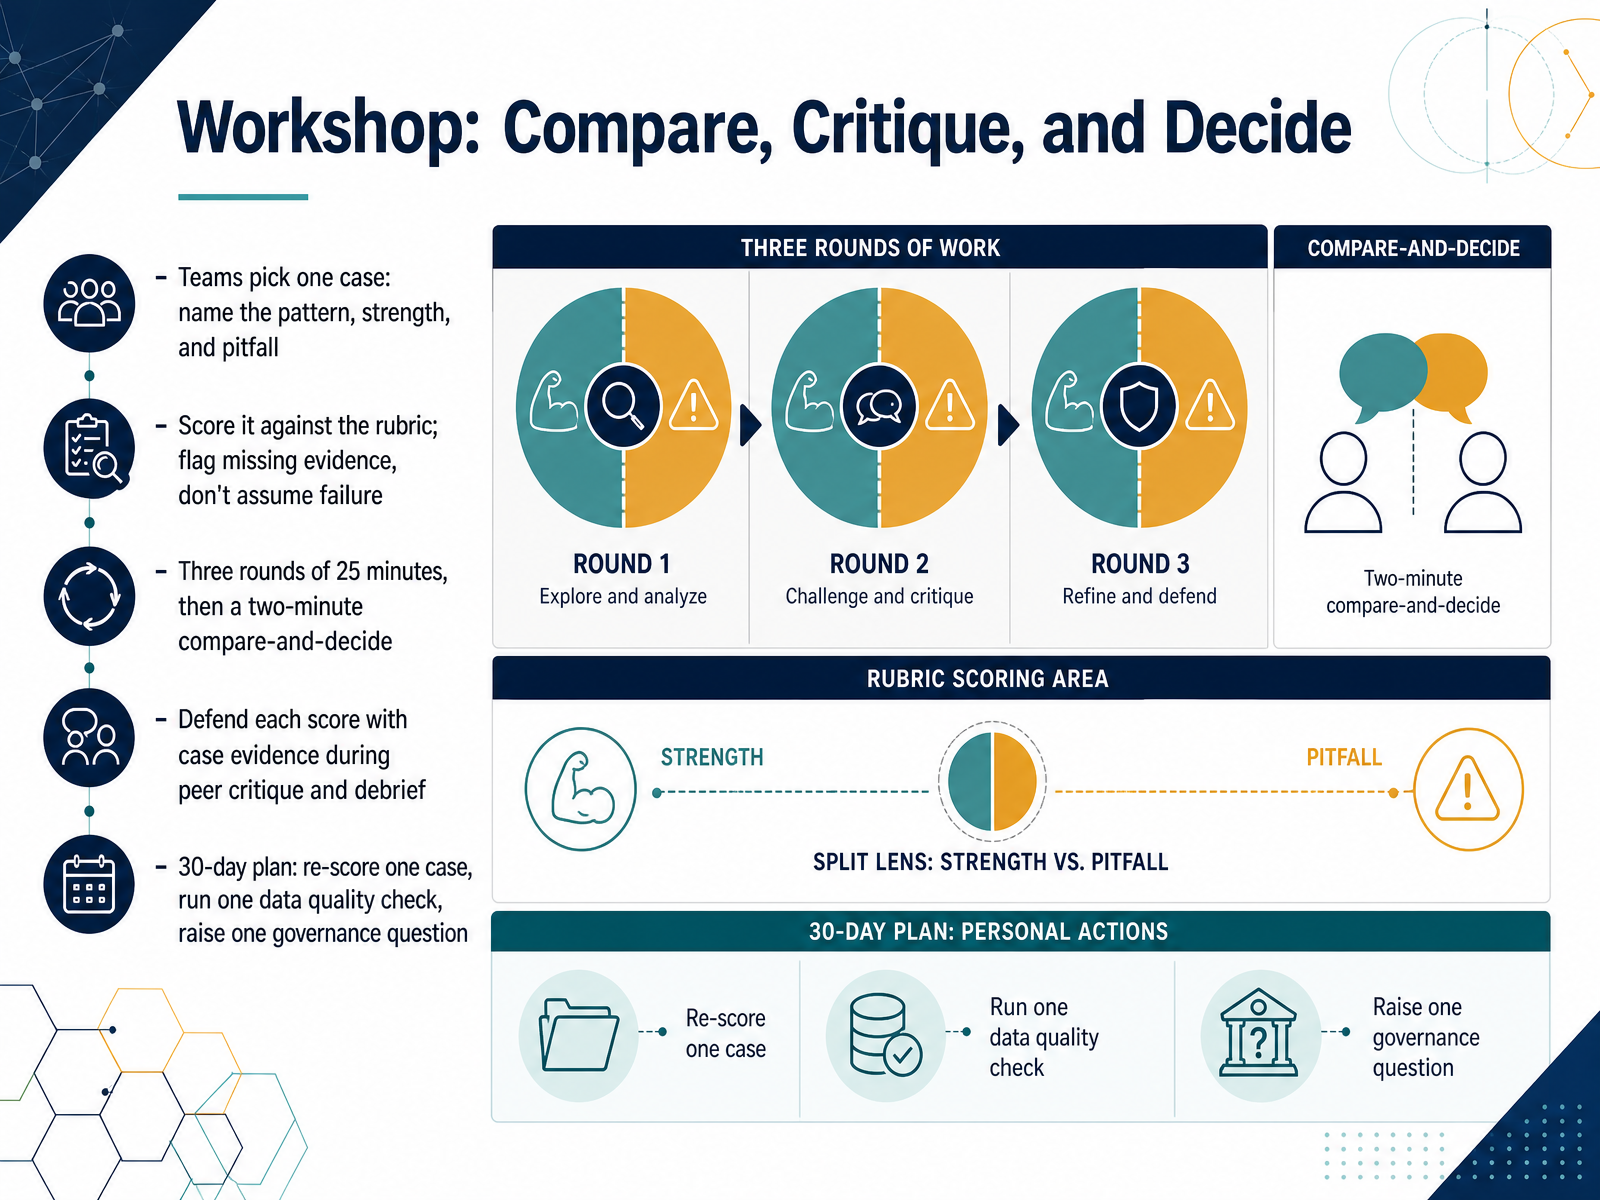
- 14Workshop: Compare, Critique, and DecideLet's bring everything together in the workshop. In teams, pick one case and name three things out loud: the pattern you see, one genuine strength, and one pitfall. Then score it against the rubric. This works when you flag missing evidence instead of assuming failure, because a gap in the case is not the same as a flaw in the solution. You'll run three rounds of twenty-five minutes, then a two-minute compare-and-decide. During peer critique and debrief, defend each score with evidence from the case itself. Watch for disagreement without a reason, that's where the real learning hides. Finally, commit to a thirty-day plan: re-score one case, run one data quality check, and raise one governance question. Decision quality improves when evaluation becomes a habit, not a one-time event. Thank you for working through this with me. You now have a repeatable way to compare, critique, and decide. Keep applying it.
 informs.orgapni.rudoi.org+21 min
Take the deck with you
Download this course as a file — free, no sign-up needed.
- PDF handoutEvery slide page, ready to print or share.15 pages · 4.1 MBDownload
- Narrated PowerPointThe deck that presents itself — every slide carries the digital human's narration video.15 pages · 16.7 MBDownload
- PowerPoint slidesThe full deck as a .pptx — open it in PowerPoint, Keynote, or Google Slides.15 pages · 3.9 MBDownload
Free to use in your own training — please keep the PersonWise credit page at the end.
Have your own deck? Turn it into a course
Sources consulted
Web sources consulted while building this course.
- The 4 Types of Data Analytics: Uses & Examples — thoughtspot.com
- What Is Business Analytics? | IBM — ibm.com
- Types of Data Analytics: 4 Categories + When to Use Them — domo.com
- 4 Types of Data Analytics to Improve Decision-Making — online.hbs.edu
- https://www.datacamp.com/blog/data-demystified-the-four-types-of-analytics — datacamp.com
- INFORMS Analytics Framework - INFORMS — informs.org
- A pre-implementation framework for evaluating analytics use-case viability — apni.ru
- DAPS diagrams for defining Data Science projects — doi.org
- DAPS diagrams for defining Data Science projects | Journal of Big Data | Springer Nature Link — link.springer.com
- Explore - INFORMS — informs.org
- Dynamic Retail Performance Dashboard (DRPD): An Enterprise-Grade Business Intelligence Platform for Data-Driven Decision Support — doi.org
- Healthcare Analytics Dashboard Examples (2026) - knowi.com — knowi.com
- Healthcare KPI Dashboard Examples by Department (2026) — lets-viz.com
- 5 Retail Dashboard Examples to Make Faster Data Decisions — thoughtspot.com
- Ankan2508/pharmacy-analytics-powerbi — github.com
- Which Type of Question Does Diagnostic Analytics Address? | Scoop Analytics — scoopanalytics.com
- Diagnostic Analytics? Benefits, Techniques, and Examples — thoughtspot.com
- Dana reduces axle rework by 65% with ML-driven root cause… — aiformanufacturing.org
- How Apollo Tyres is unlocking machine insights using agentic AI-powered Manufacturing Reasoner | Artificial Intelligence — aws.amazon.com
- Customer Case Study: Manufacturing Root Cause Analysis - causaLens — causalens.com