Begin
14 pages · ~28 min
Light, Spectra, and What They Reveal
This training explores how light and spectra reveal the composition, motion, and properties of celestial objects, equipping learners to interpret astronomical data through spectral analysis.
A digital instructor presents all 14 pages. Hold “Ask” at any point and ask out loud — the answer comes from this course. No sign-up needed.
What you’ll learn
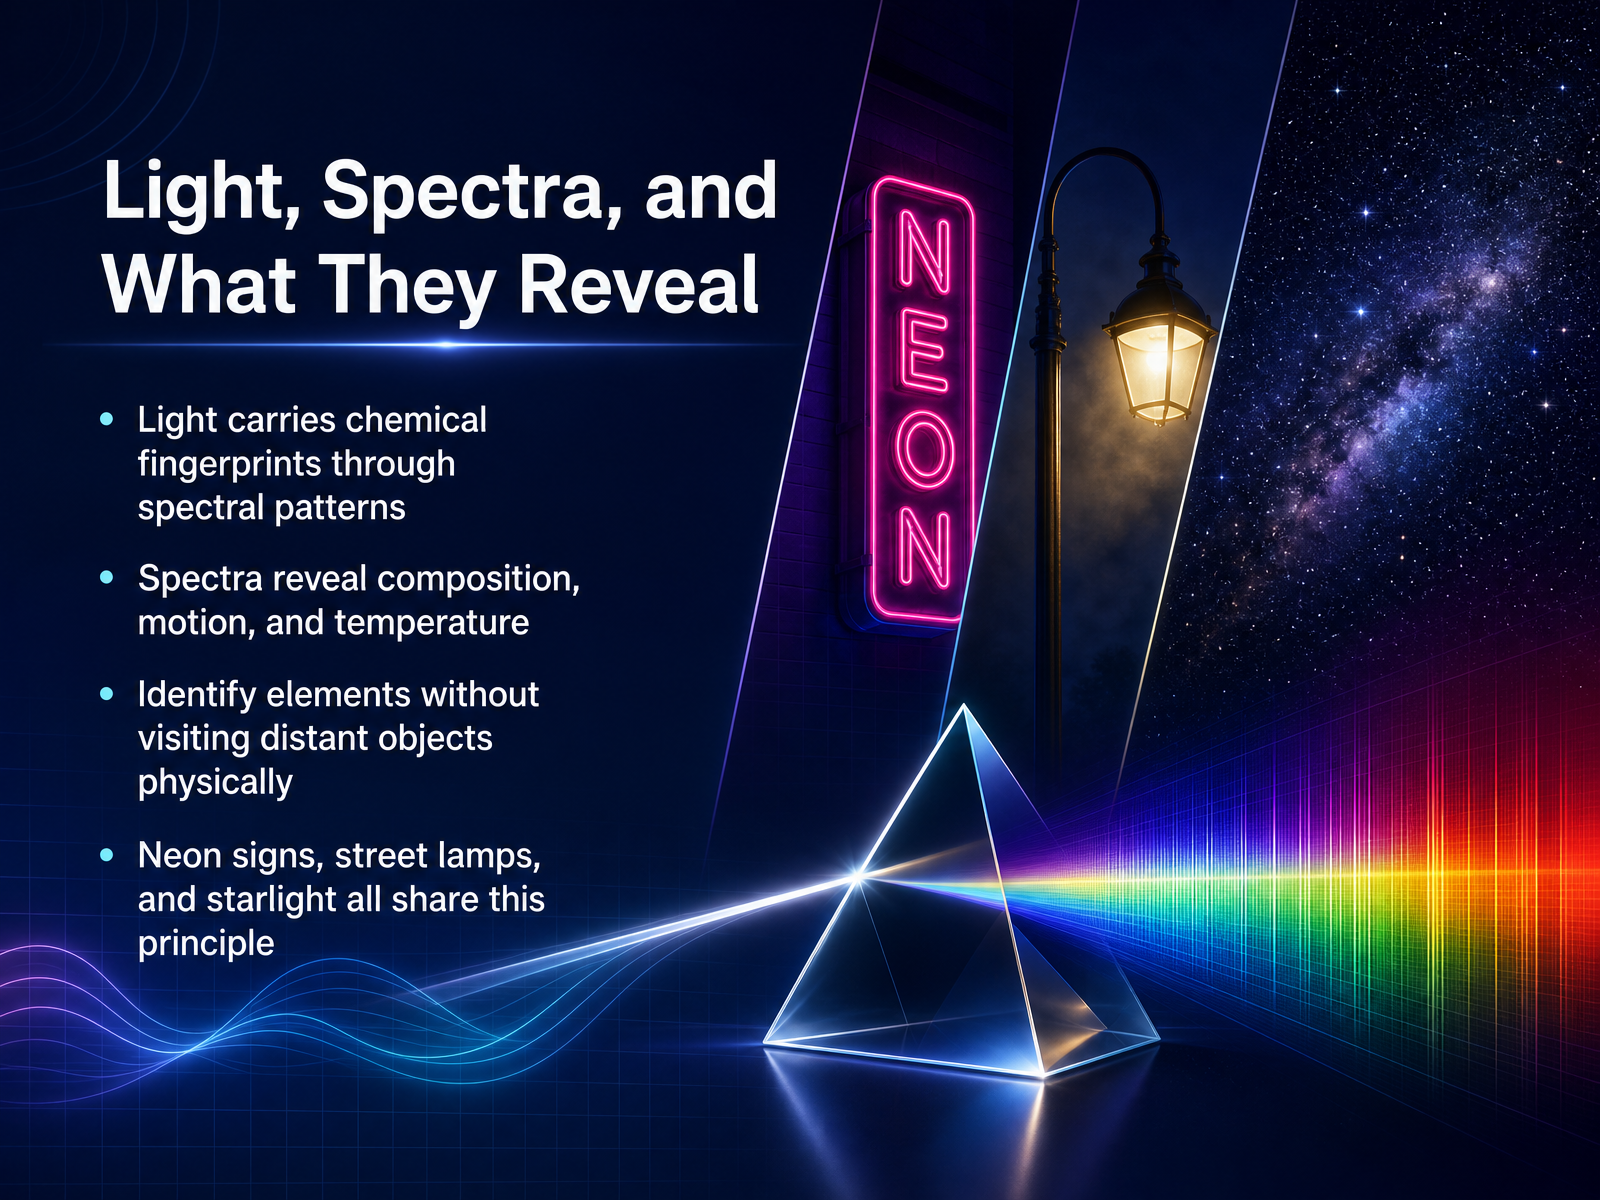
- 01Light, Spectra, and What They RevealWelcome. Imagine you are looking through a telescope at a distant star, and yet somehow you can know exactly what it is made of. That is the remarkable power of light. In this course, we are going to explore how light carries chemical fingerprints across the vast distances of space. When we spread starlight out into a spectrum, we see a pattern of lines. Think of these patterns as unique fingerprints, because each chemical element leaves its own distinct mark. By reading these patterns, we can decipher the composition, temperature, and even the motion of objects we could never hope to visit. We do not need to travel to a star to know it contains hydrogen or iron. We can tell all of that from its light. The beautiful part is, this principle is already all around you. The warm glow of a neon sign, the orange haze of a street lamp, and the light of the sun itself all follow the same fundamental rules. So let's begin our journey by understanding the very nature of this light, and the spectrum it creates.imagine.gsfc.nasa.govimagine.gsfc.nasa.govbritannica.com+22 min
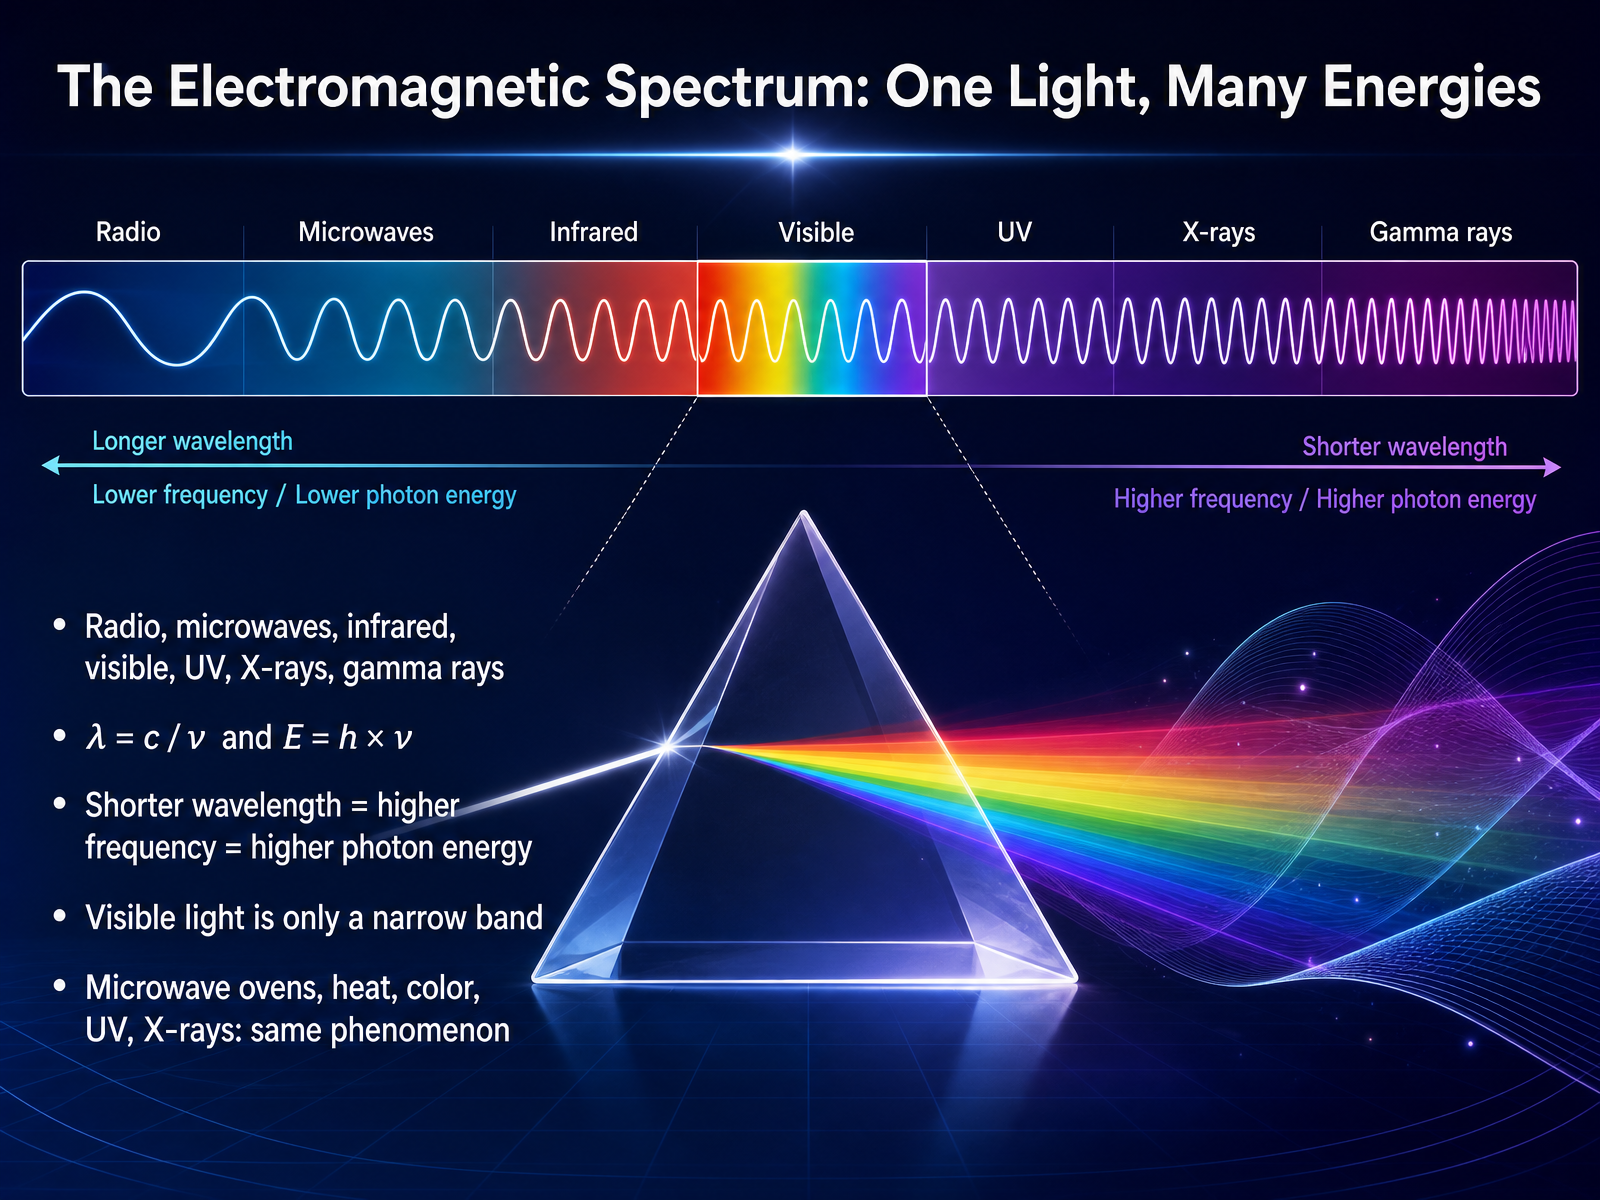
- 02The Electromagnetic Spectrum: One Light, Many EnergiesNow let's look at the whole family of light, what scientists call the electromagnetic spectrum. From radio waves to gamma rays, it's all the same fundamental phenomenon. The only real difference is the energy each photon carries. We describe this with two simple equations. Wavelength, written as lambda, equals the speed of light divided by frequency. And energy equals Planck's constant times frequency. The practical takeaway is this: shorter wavelength means higher frequency, and higher frequency means higher photon energy. So gamma rays are high energy, while radio waves are very low energy. Visible light, the colors our eyes can see, is just a narrow band in the middle of this vast spectrum. So the heat you feel from sunlight, the colors of a sunset, the microwaves that warm your food, and the X-rays a doctor uses are all the same phenomenon, just at different energies. Next, we will explore how this relates to waves, photons, and the dual nature of light.
 imagine.gsfc.nasa.govimagine.gsfc.nasa.govbritannica.com+21 min
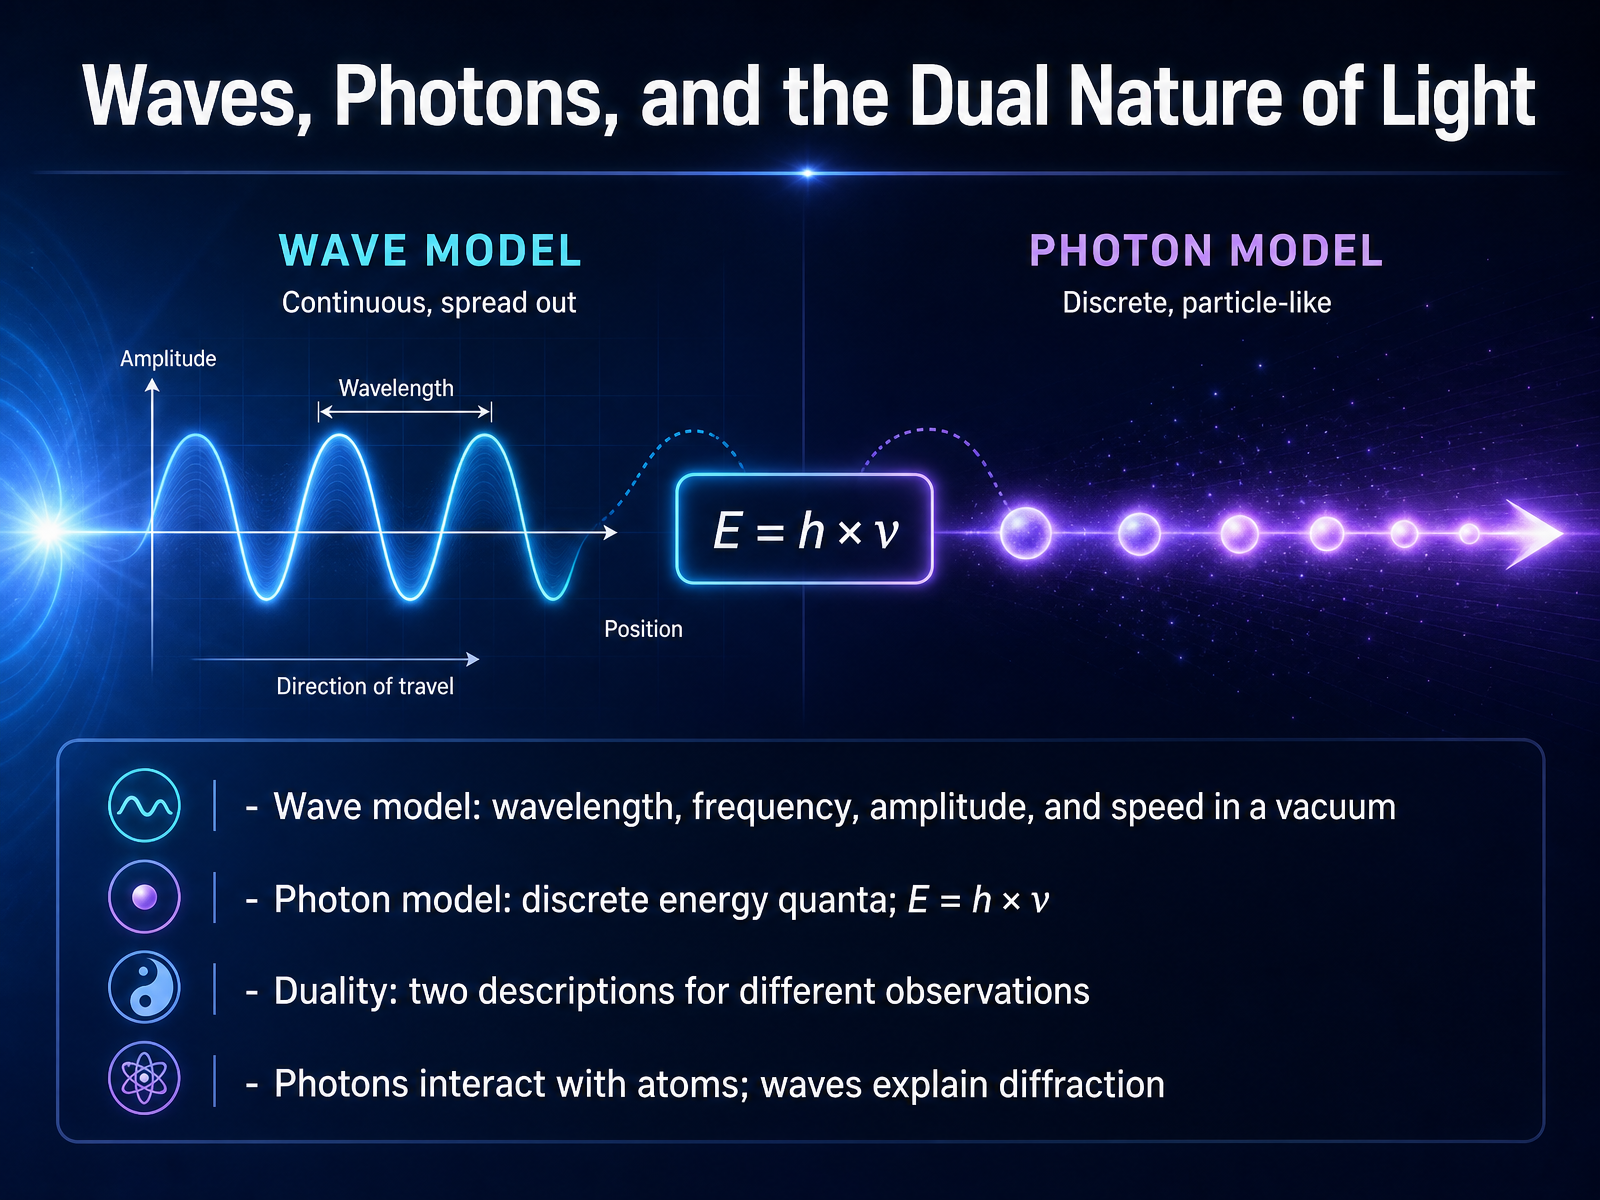
 - 03Waves, Photons, and the Dual Nature of LightNow that we have seen how light carries information, let us step back and ask what light actually is. In some experiments, it behaves like a wave. We describe that wave by its wavelength, which is the distance between two crests, and its frequency, which is how many crests pass by each second. We also talk about its amplitude, which tells us how strong the wave is. In a vacuum, all of these light waves travel at the same remarkable speed, about three hundred thousand kilometers per second. In other experiments, light behaves like a stream of tiny packets of energy. We call those packets photons. The energy of one photon depends on its frequency, and that relationship is written as E equals h times nu. Here, h is Planck's constant, and nu is the frequency. These two pictures sound very different, but they are both needed. When light spreads out and bends around an obstacle, the wave model gives us the explanation. When a single photon is absorbed by a single atom, we need the particle model. Neither description alone is complete, and that is part of the deep mystery of light. Next, we will see how atoms absorb and emit light, and how that produces the fingerprints we call spectra.
 imagine.gsfc.nasa.govimagine.gsfc.nasa.govbritannica.com+22 min
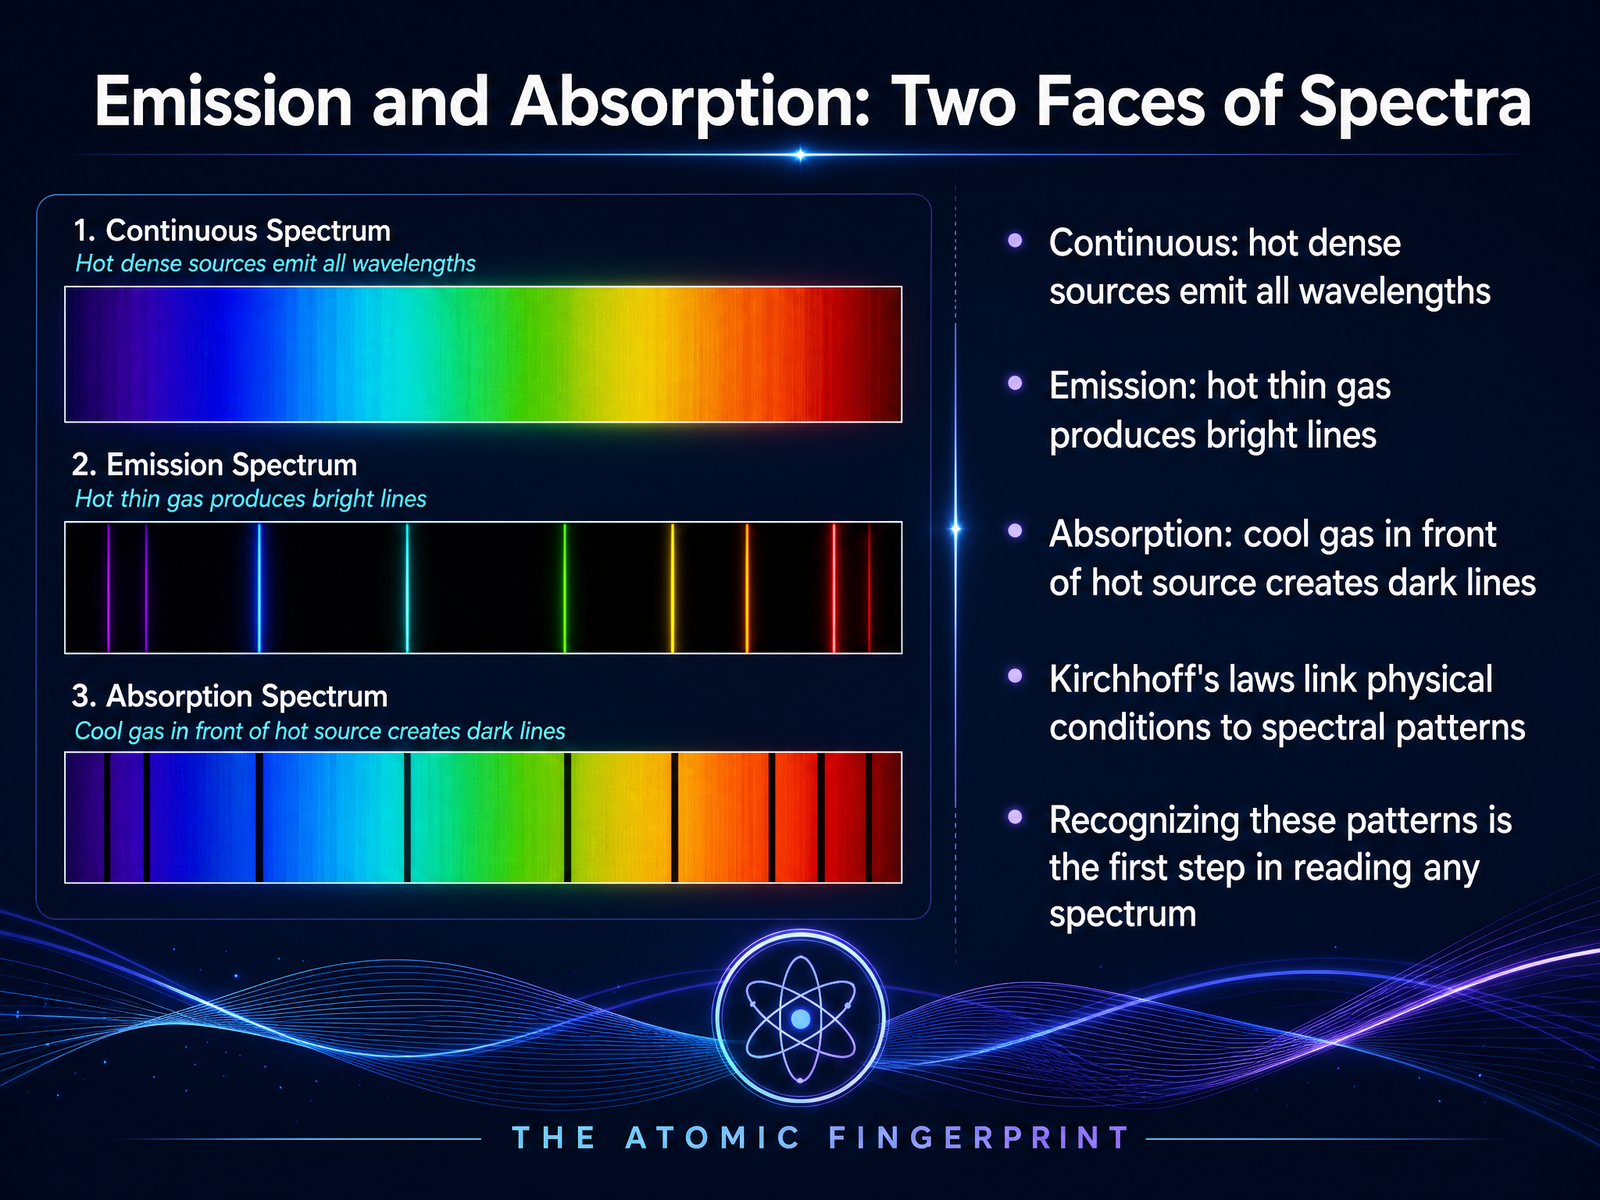
 - 04Emission and Absorption: Two Faces of SpectraNow, let's explore the two faces of spectra. Imagine a hot, dense object like a glowing wire filament. It gives off a continuous spectrum, a smooth rainbow of all wavelengths. But if we heat a thin cloud of gas instead, something different happens. We see bright lines. These emission lines are like a unique fingerprint, telling us exactly which elements are in that gas. Now picture a continuous source shining through a cooler, thinner gas. The gas absorbs specific wavelengths, carving dark lines out of the rainbow. These are absorption lines, and remarkably, they appear at the very same wavelengths where that element would emit light. This is the heart of Kirchhoff's laws. They link the physical conditions, whether something is hot and dense, or hot and thin, or cool and in front of a source, to the pattern of light we see. Recognizing these patterns is the first step in reading any spectrum, because it lets us turn a simple band of light into a chemical map of the universe. Next, we'll uncover how atoms themselves craft these spectral signatures.
 phys.libretexts.orgburro.case.educourses.ems.psu.edu+22 min
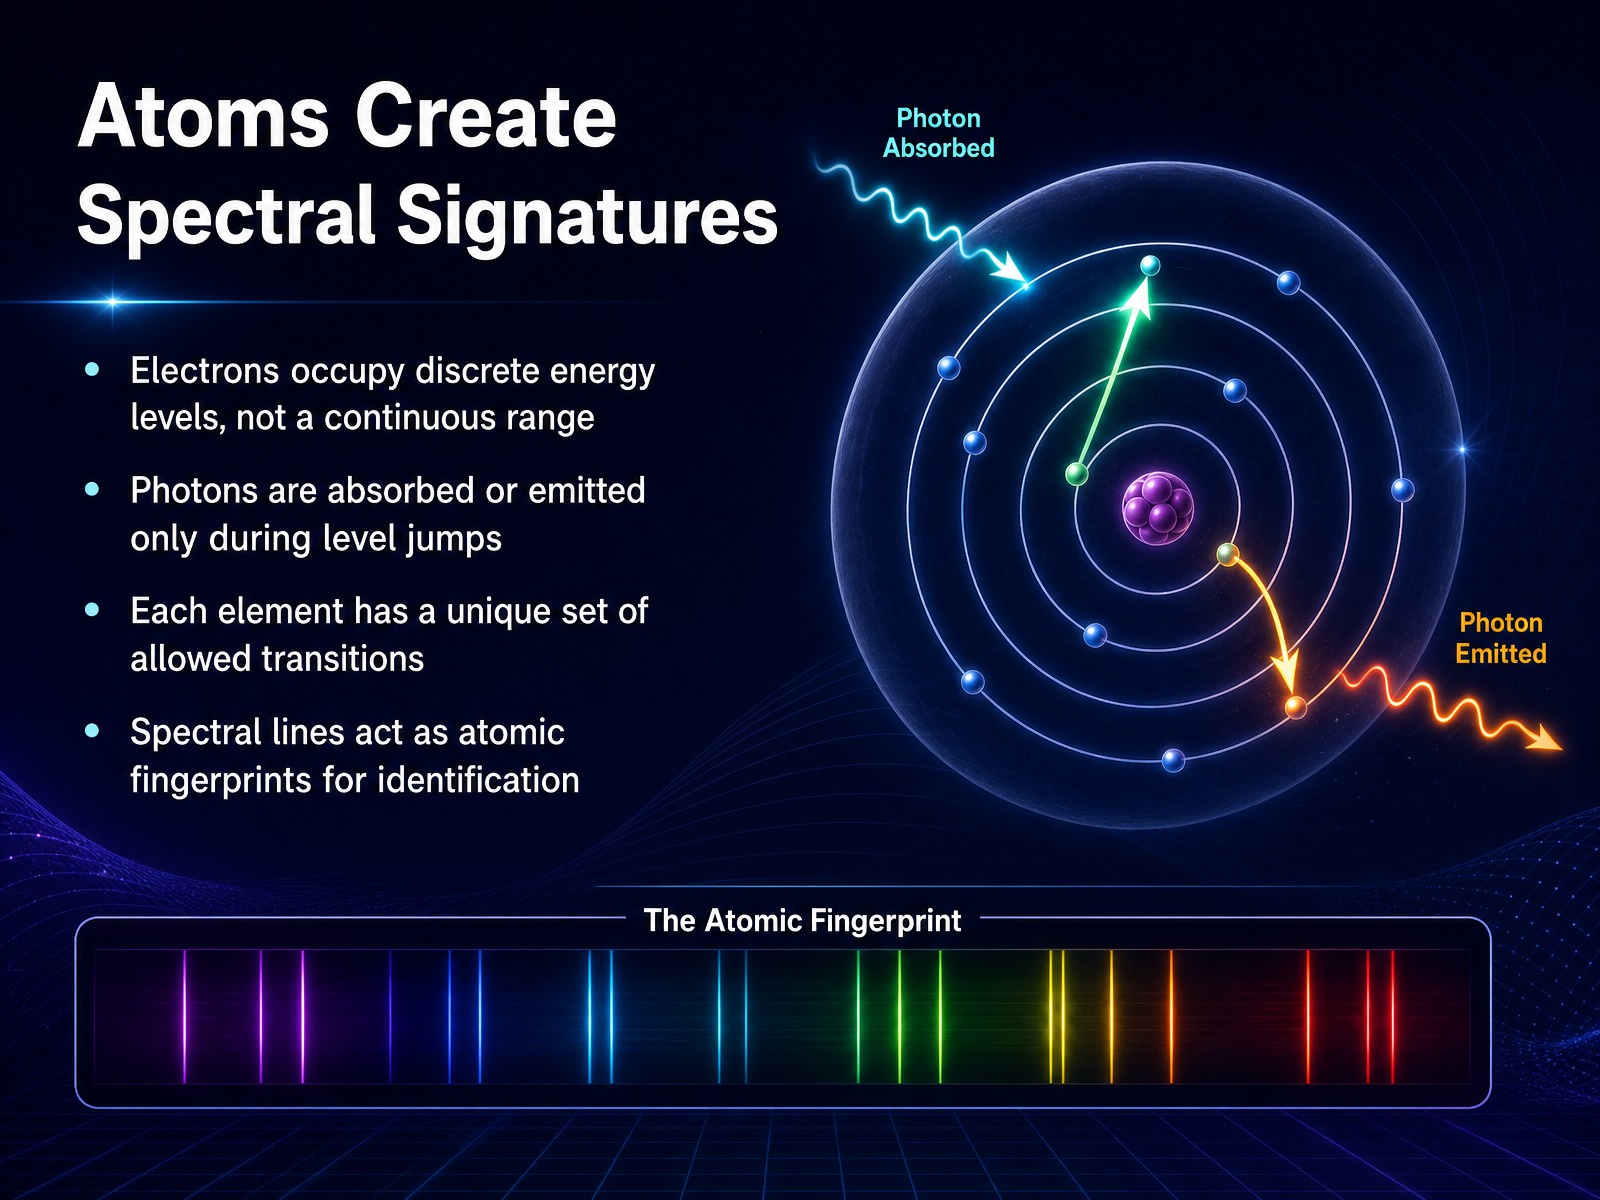
 - 05Atoms Create Spectral SignaturesNow, let's look at why each atom has its own unique voice. Imagine a staircase inside every atom. But this is a strange staircase. Electrons can only stand on specific steps, never in between. These steps are what we call discrete energy levels. When an electron jumps from a higher step to a lower one, it releases a tiny packet of light, a photon. And it will only absorb a photon if that light has exactly the right energy to boost it up to a higher step. The crucial part is that the distance between steps is not the same for every element. Hydrogen has its own unique arrangement, helium has a different one, and so on. Because of this, the colors of light an atom emits or absorbs act like a fingerprint. A specific set of spectral lines tells us exactly which element we are looking at, even across the vastness of space. Next, we'll see how astronomers read those very fingerprints.
 nist.govnist.govnist.gov+21 min
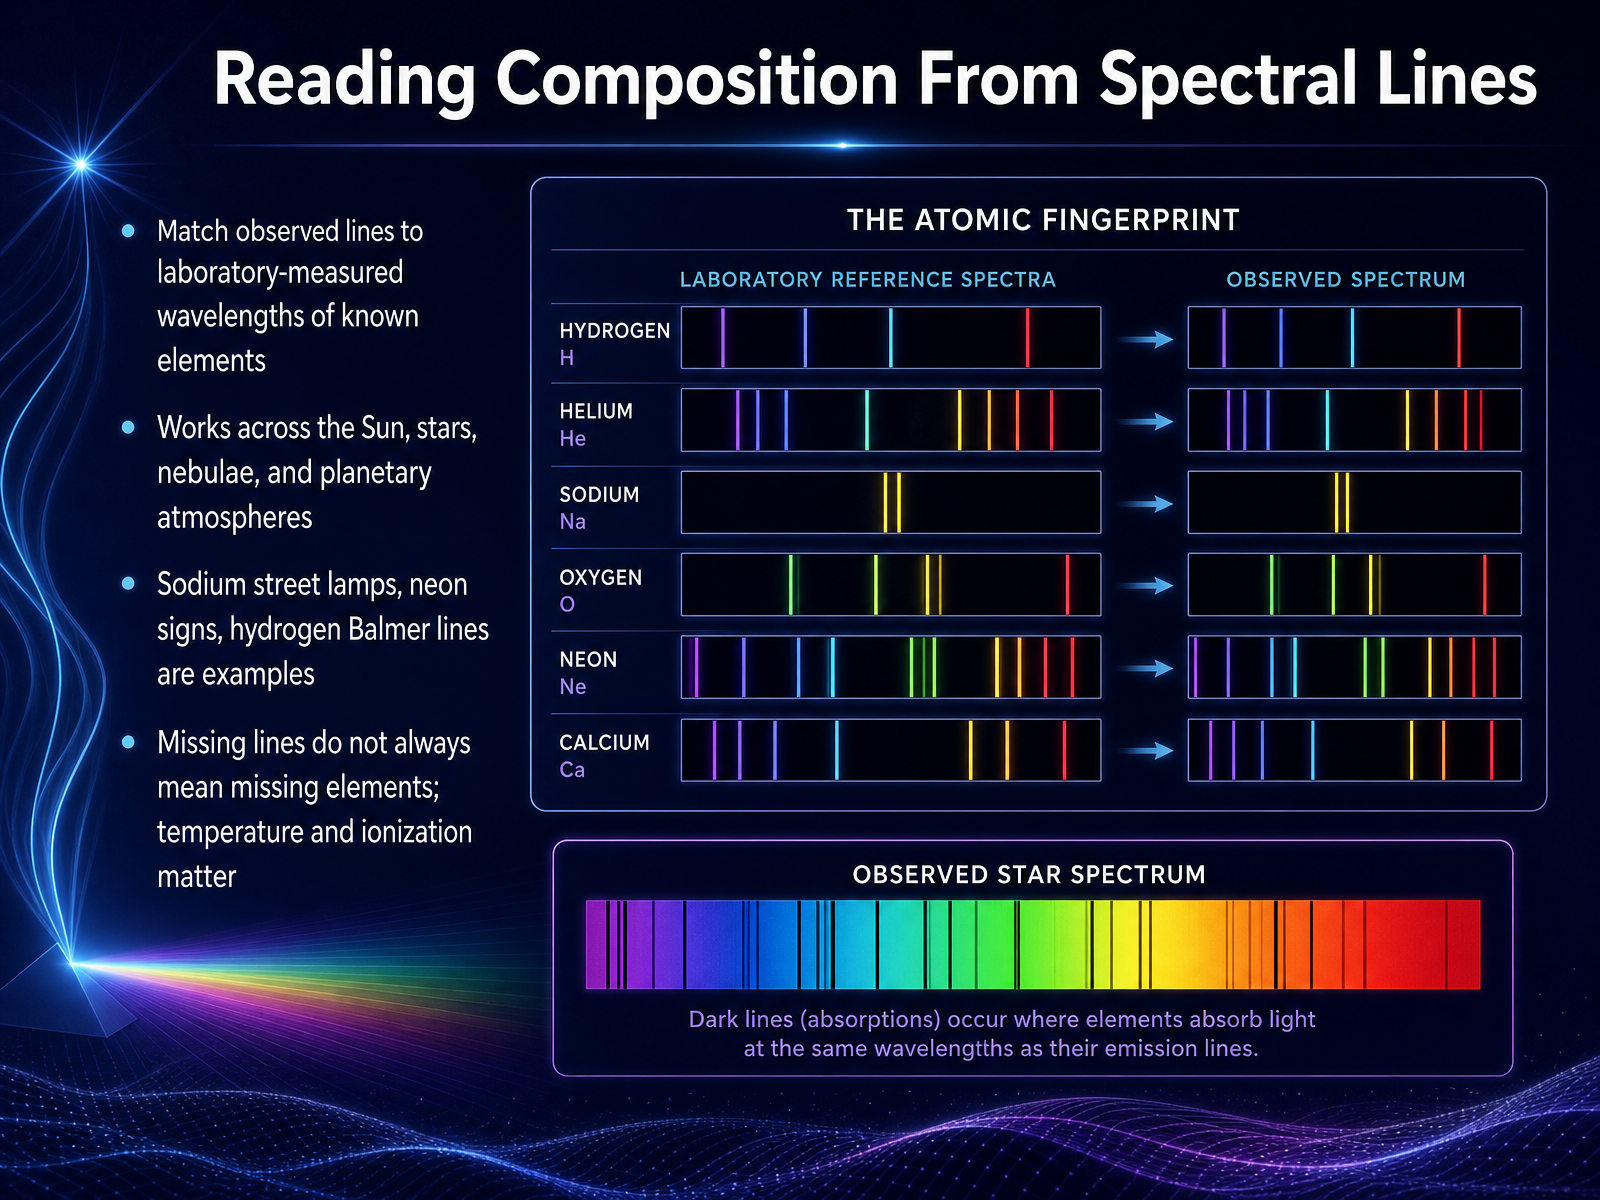
 - 06Reading Composition From Spectral LinesNow we can put that fingerprint idea to work. To read a star's composition, we match the dark lines we observe against the precise wavelengths of elements measured right here in laboratories on Earth. It is like comparing an unknown fingerprint against a vast database of known suspects. The same method applies everywhere, from our own Sun to distant stars, glowing nebulae, and even the atmospheres of planets. You have actually seen this in everyday life. The warm yellow glow of a sodium street lamp, the vivid red of a neon sign, and the familiar hydrogen Balmer lines in the Sun's spectrum are all examples of these identifying signatures. But here is a crucial subtlety. A missing line does not always mean a missing element. The temperature and ionization state of the gas govern which electrons can absorb light. In very hot stars, hydrogen can be fully ionized, leaving no electron to produce visible lines, even though hydrogen is the most abundant element there. So the absence of a line is itself a meaningful clue about the star's physical conditions. Reading spectra is a conversation between composition and temperature. Next, we will explore motion and the Doppler effect.
 imagine.gsfc.nasa.govspectra.freeshell.orgstars.astro.illinois.edu+22 min
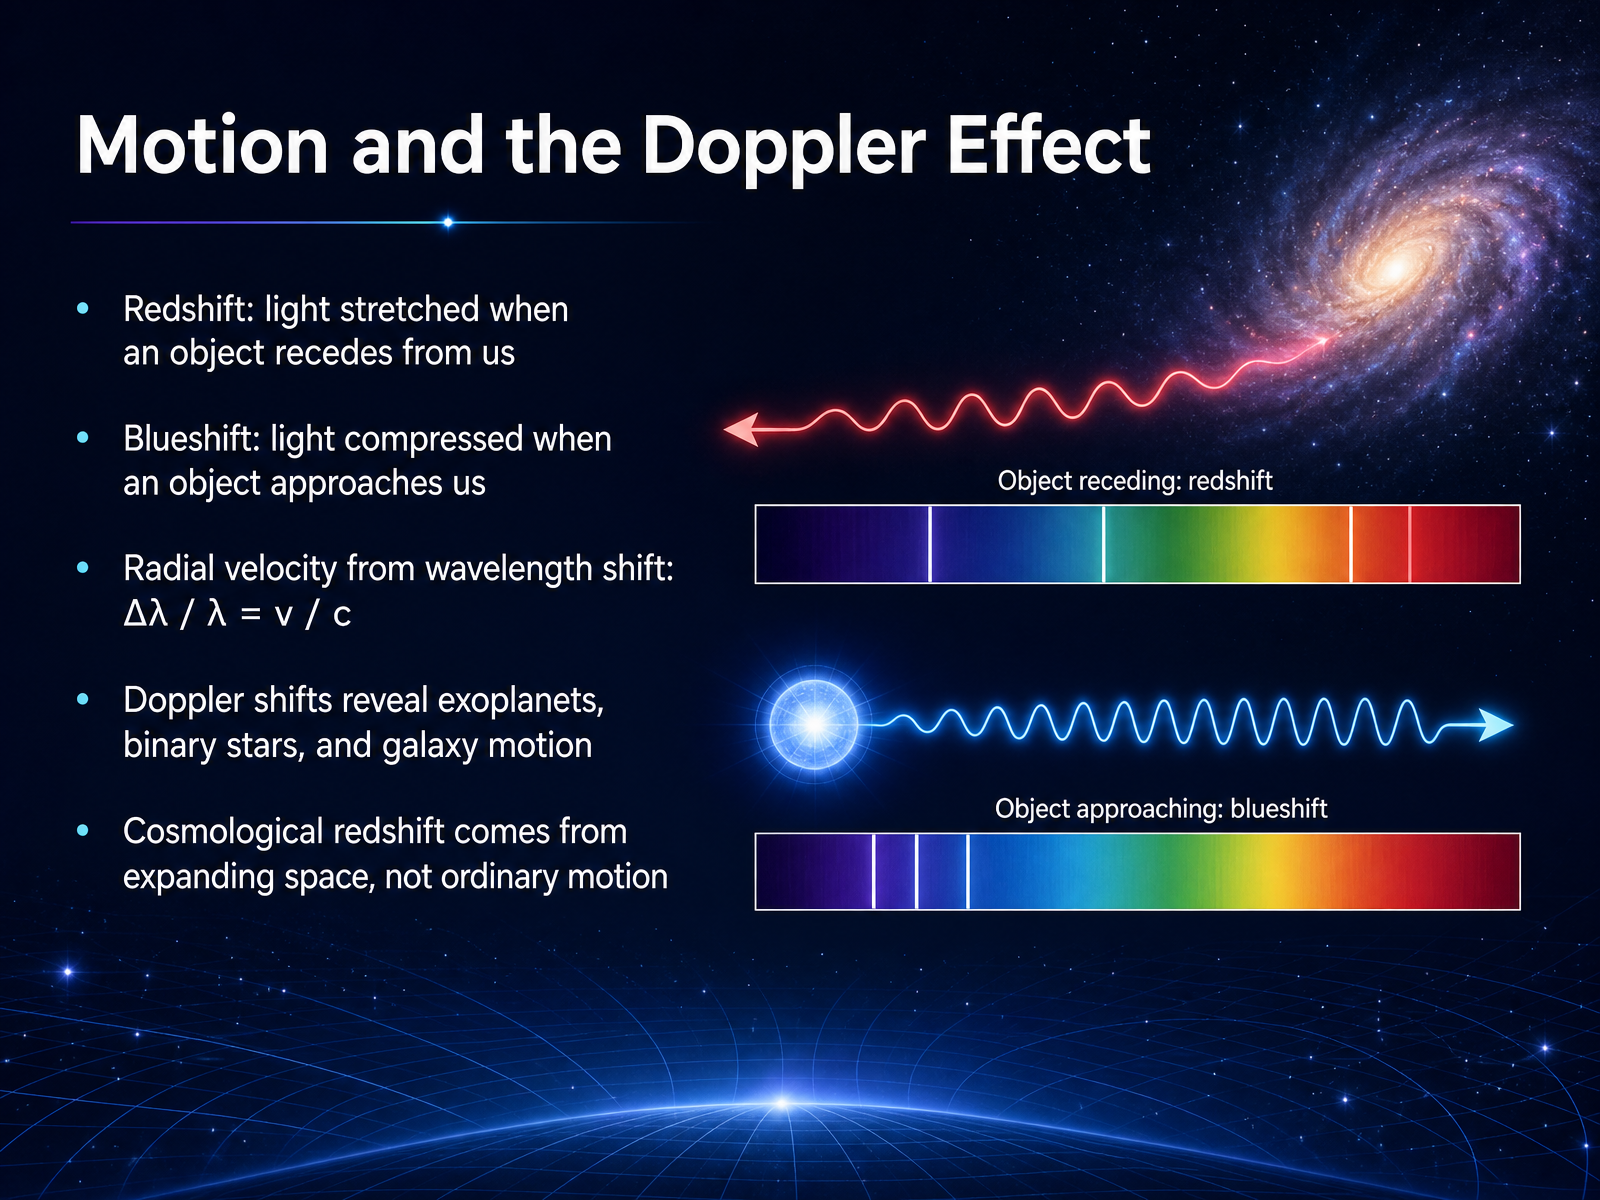
 - 07Motion and the Doppler EffectNow, let’s think about something you have almost certainly heard before: a passing siren. As it approaches, the pitch sounds higher, and as it races away, the pitch drops. That is the Doppler effect, and light does the same thing. When a star moves toward us, its light waves get squeezed. We call that a blueshift. When the star moves away, the light gets stretched. We call that a redshift. Astronomers measure this shift in the fingerprint-like spectral lines we discussed earlier. The amount of shift depends on the object’s speed along our line of sight, using a simple relationship: the change in wavelength divided by the original wavelength equals the object’s velocity divided by the speed of light. This one idea has enormous reach. It reveals planets around other stars by catching the tiny wobble they cause. It exposes binary stars locked in orbit. And it shows us how entire galaxies move. Just remember: the redshift we see in very distant galaxies comes not from ordinary motion, but from the expansion of space itself. Next, we will connect these motions to something even more fundamental: temperature, color, and the spectral sequence.
 1 min
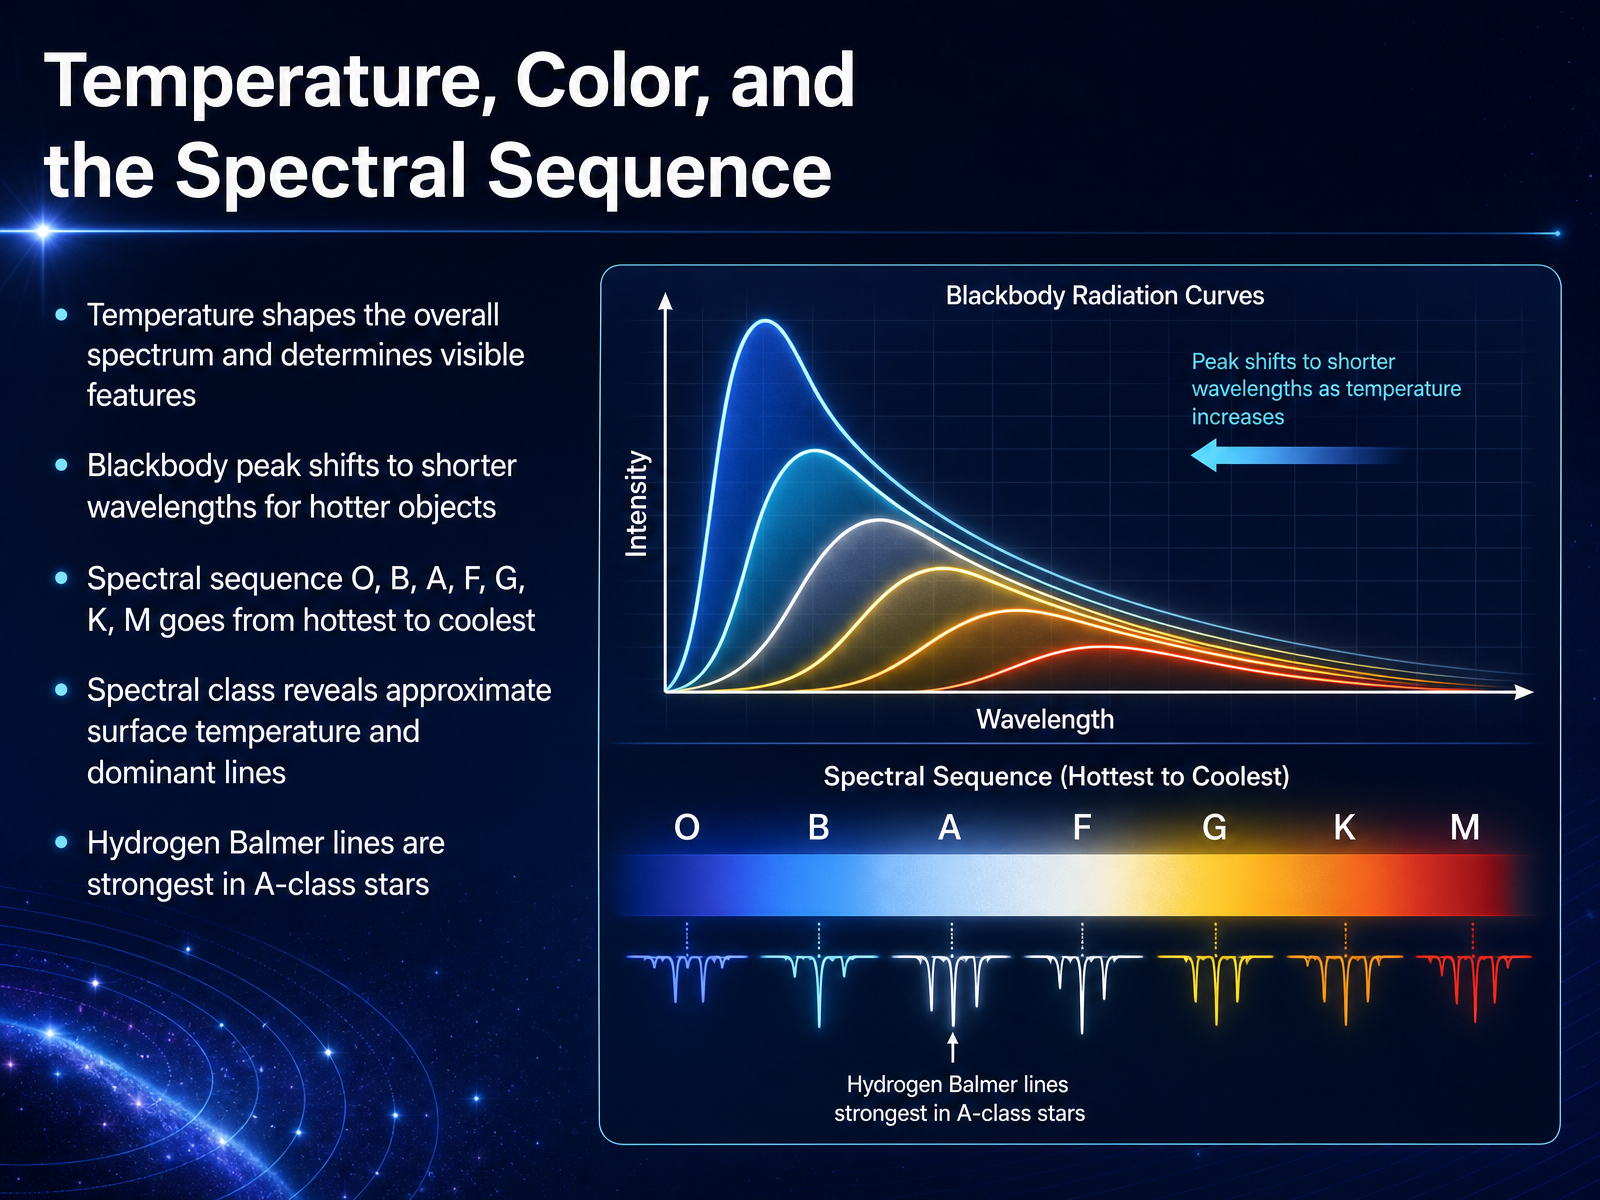
1 min - 08Temperature, Color, and the Spectral SequenceSo now we pull those threads together. Temperature is the hidden hand shaping every stellar spectrum. As a star gets hotter, the peak of its light shifts toward shorter wavelengths, toward the blue and ultraviolet. That is why a searing O-type star looks blue, while a cooler M-type star glows deep red. Astronomers organize this as a sequence, O, B, A, F, G, K, M, from the hottest to the coolest. Those letters can feel out of order at first, but they map directly onto temperature, and therefore color, and therefore which lines dominate the spectrum. You can even spot a striking detail in the data. Hydrogen lines are strongest not in the hottest stars, but in A-class stars. Too hot, and the hydrogen is ionized. Too cool, and the electrons sit in lower energy states. In the mid-range, the conditions are just right. A spectrum is not only a temperature label. It is a record of the physics happening in the star's atmosphere. Next, we step beyond stellar astronomy to see how spectra open windows across the sciences.
 imagine.gsfc.nasa.govimagine.gsfc.nasa.govbritannica.com+22 min
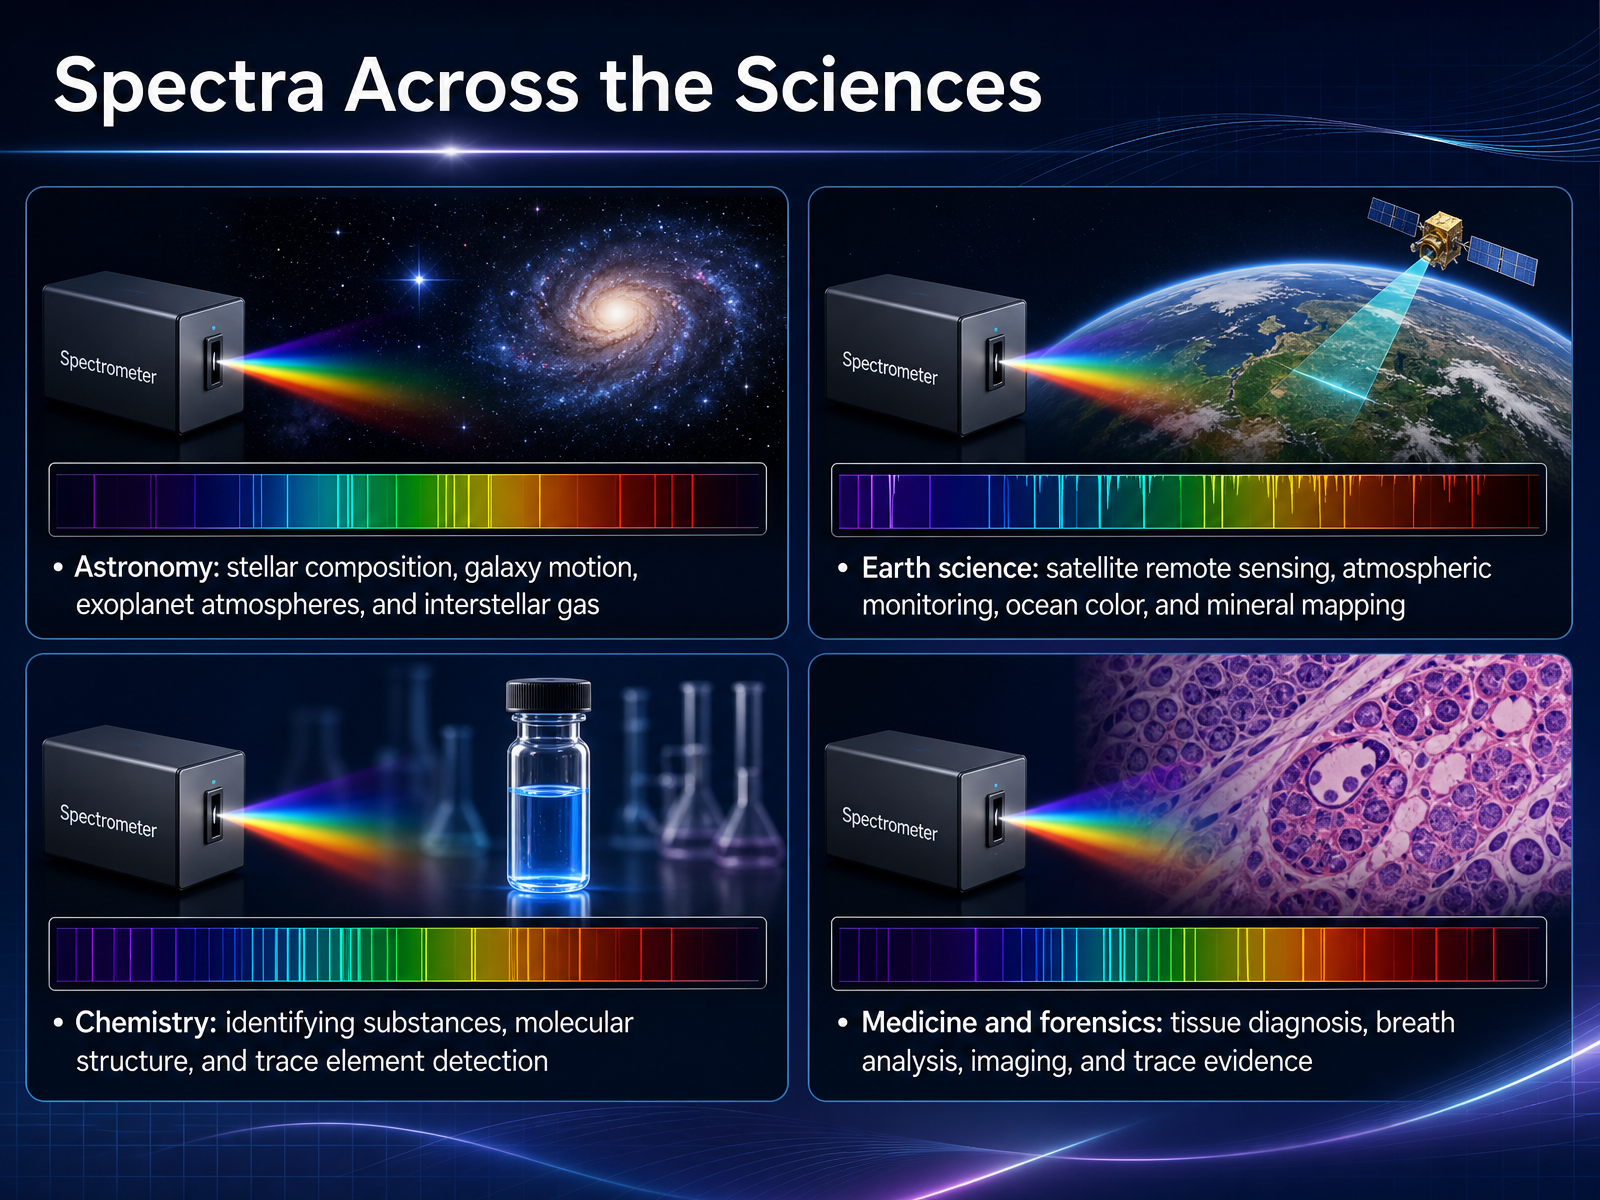
 - 09Spectra Across the SciencesOnce you start looking, you will find spectra everywhere, quietly doing essential work across the sciences. In astronomy, the same fingerprints we see in starlight reveal what distant galaxies are made of, how fast they are moving, and what fills the atmospheres of planets around other stars. Closer to home, Earth scientists use spectra from satellites to monitor air quality, track ocean color, and map minerals across entire continents from orbit. In chemistry, a spectrum is a fast, precise way to identify an unknown substance or detect a trace element at just a few parts per million. And in medicine and forensics, light interacts with tissue or trace evidence to help diagnose disease and examine what is left behind at a scene. Think of spectra as a shared scientific language, a way of reading the material world wherever we point our instruments. And to use that language well, we need to know exactly how to read what a spectrum is telling us. That is exactly where we are heading next, to the practical work of reading a spectrum.
 imagine.gsfc.nasa.govspectra.freeshell.orgstars.astro.illinois.edu+22 min
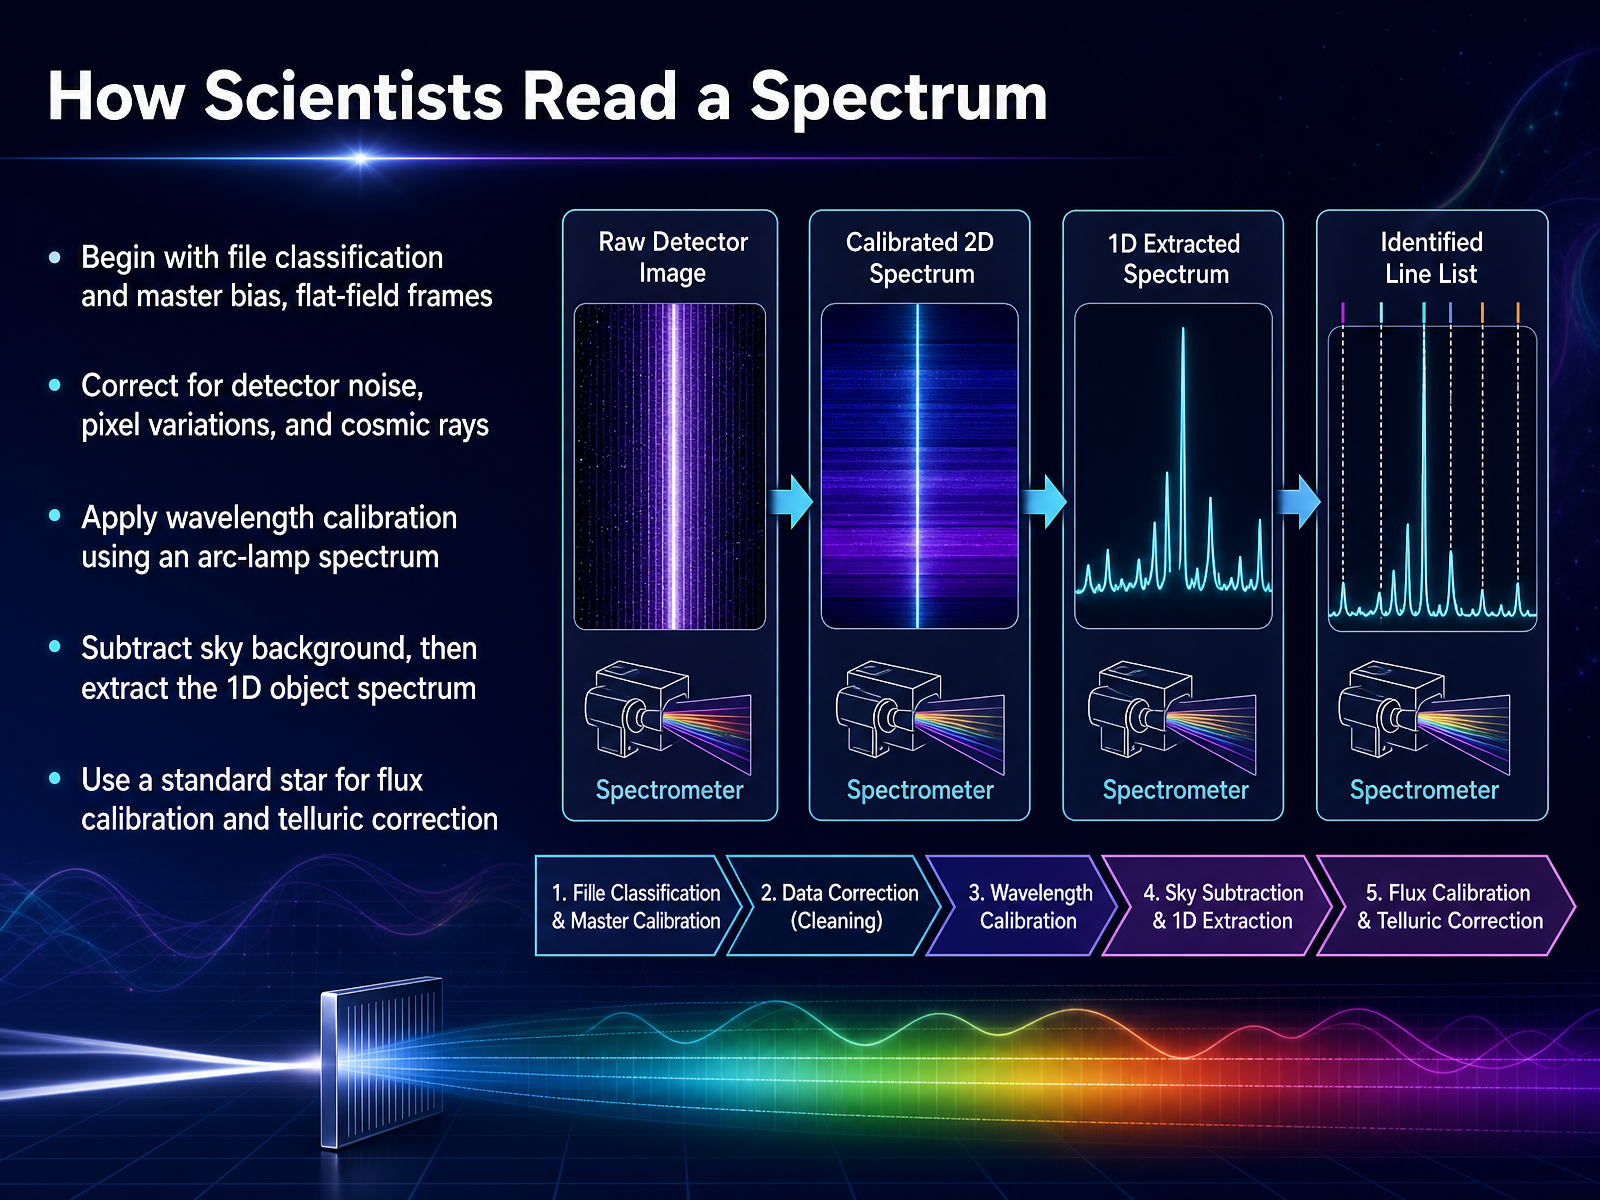
 - 10How Scientists Read a SpectrumNow we come to the part that transforms a raw image into a scientific measurement. Reading a spectrum is a careful, multi-step process. It begins with file classification, where we sort every exposure into its role, science, calibration, or flat field. Then we build what are called master bias and flat-field frames. These correct for the electronic noise of the detector and for tiny pixel-to-pixel sensitivity differences, so our counts reflect true light, not the quirks of the camera. Cosmic rays, those bright streaks from high-energy particles, are identified and removed. Next, an arc-lamp spectrum provides reference emission lines of known wavelength. This lets us convert pixel positions into precise wavelengths. Once we know the sky background, we subtract it, leaving only the light from our object. Then we extract that light into a one-dimensional spectrum. Finally, a standard star with a well-known brightness gives us the flux calibration, and we correct for the absorption caused by Earth's own atmosphere. Each step removes an artifact and reveals a cleaner view of the star. With this cleaned spectrum in hand, we can now move from technique to discovery. Next, we will walk through a simple case study, from spectrum to insight.
 imagine.gsfc.nasa.govspectra.freeshell.orgstars.astro.illinois.edu+21 min
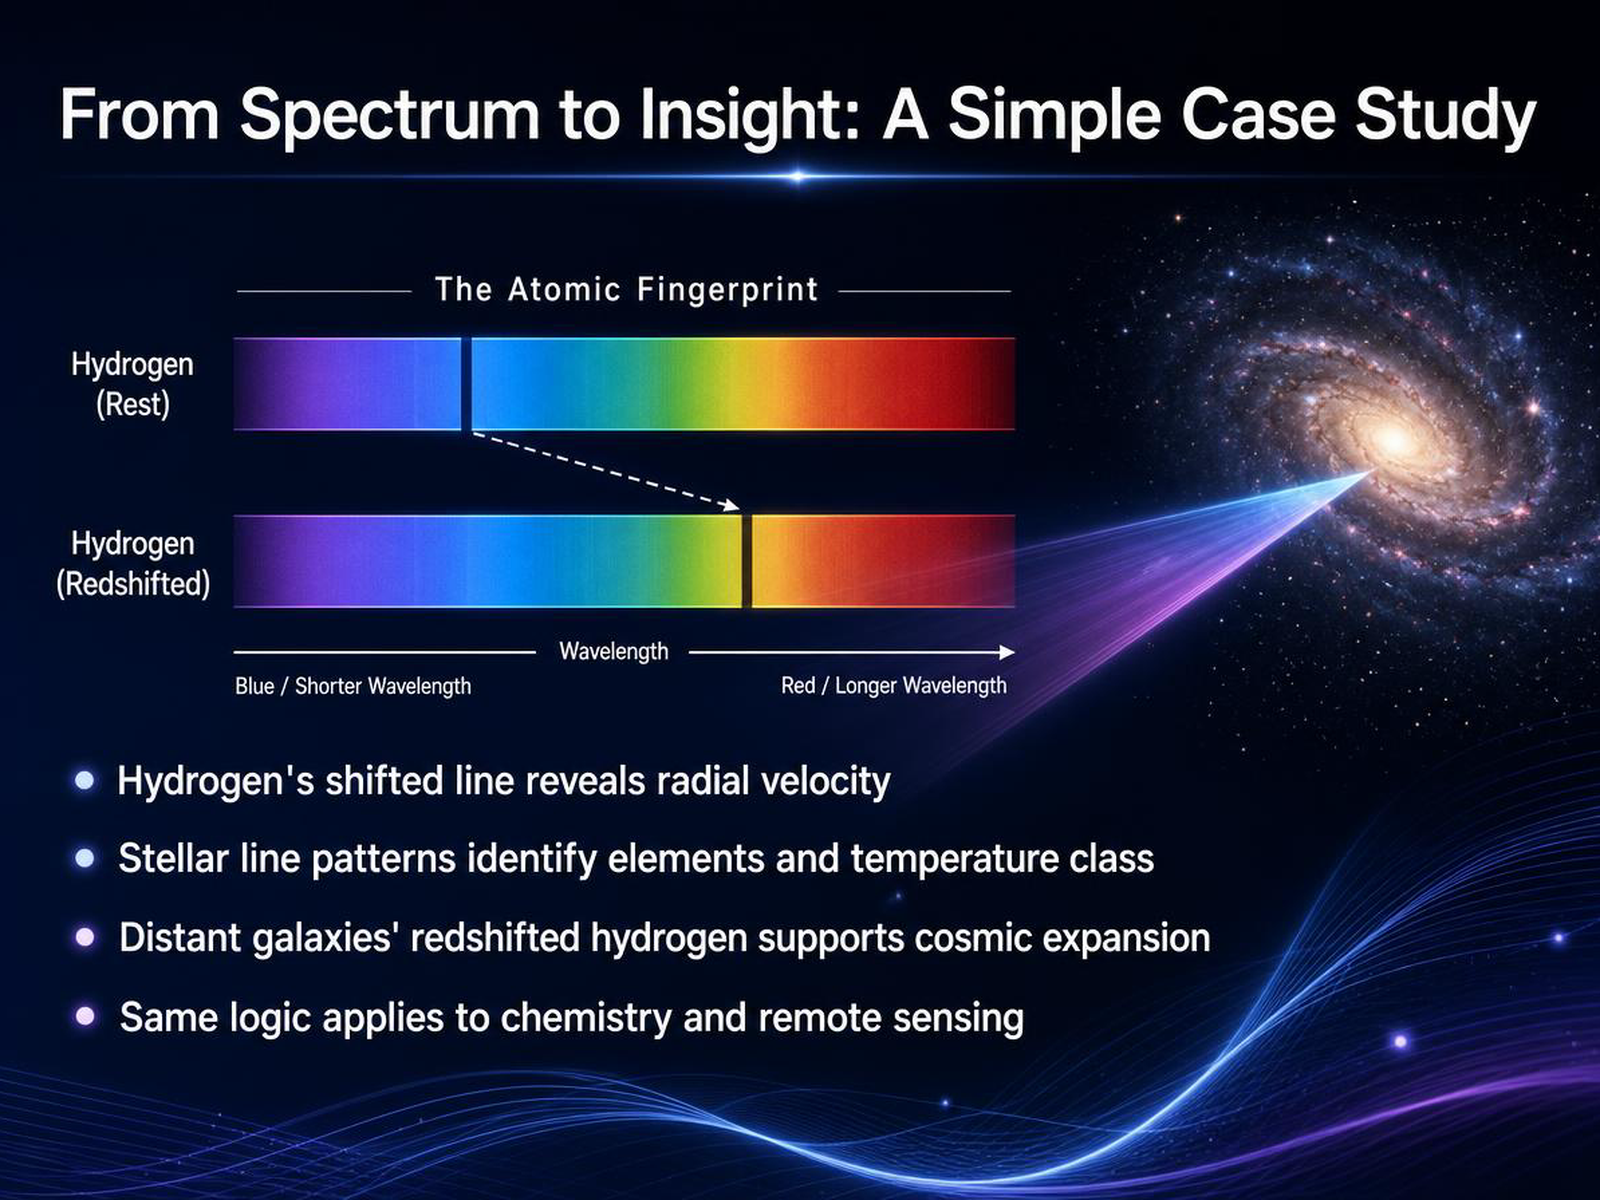
 - 11From Spectrum to Insight: A Simple Case StudyNow, let's put all of this together and see how a spectrum becomes a story. Picture a single hydrogen line from a star. If that line appears shifted from its normal position, the star is in motion. A shift toward the red tells us it is moving away from us. A shift toward the blue, it is approaching. This is how we measure what astronomers call radial velocity, the speed along our line of sight. The pattern of many lines in a star's spectrum is like a cosmic fingerprint. It reveals which elements are present and, by the strengths of those lines, the star's temperature class, from hot O stars to cool M stars. This same logic has opened the universe to us. When we see hydrogen lines redshifted in distant galaxies, we are witnessing cosmic expansion itself. And here is something wonderful. The tools we use to read starlight are the same ones chemists use in the lab and satellites use for remote sensing of Earth. We will tackle some common misunderstandings about all this next.
 imagine.gsfc.nasa.govspectra.freeshell.orgstars.astro.illinois.edu+22 min
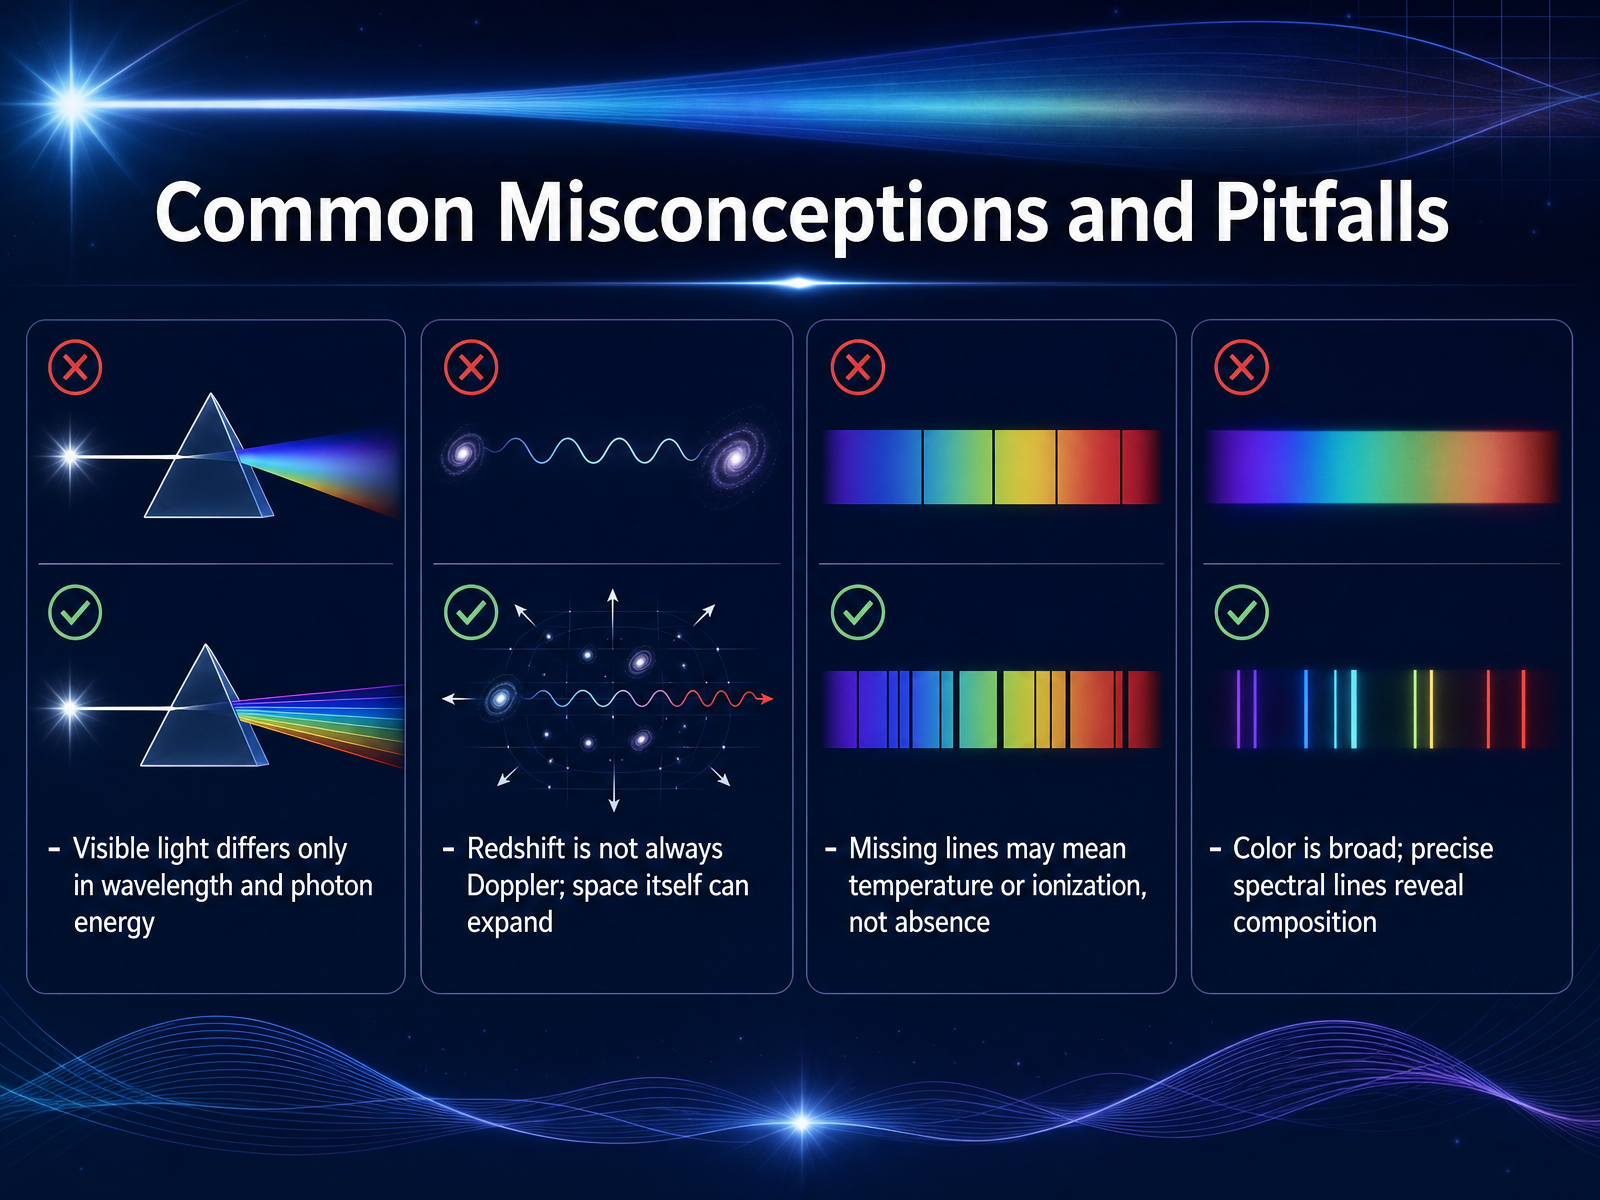
 - 12Common Misconceptions and PitfallsNow, let's clear up a few common misconceptions, because these small points can really sharpen how we read the light. First, that rainbow we see is only one kind of light. Radio waves, X-rays, and visible light differ only in their wavelength and the energy of their photons. Second, redshift does not always mean an object is flying away from us through space. Sometimes space itself expands, stretching the light as it travels. Third, if we don't see lines from a certain element, that doesn't mean the element is absent. The temperature or ionization state of the gas may simply prevent those lines from forming. And finally, while a star's color gives us a rough idea of its temperature, the precise pattern of spectral lines is what truly reveals its chemical composition. So, when you read a spectrum, look for the fingerprints, not just the hue. Up next, we'll bring all of this together in our review and key takeaways.
 imagine.gsfc.nasa.govspectra.freeshell.orgstars.astro.illinois.edu+22 min
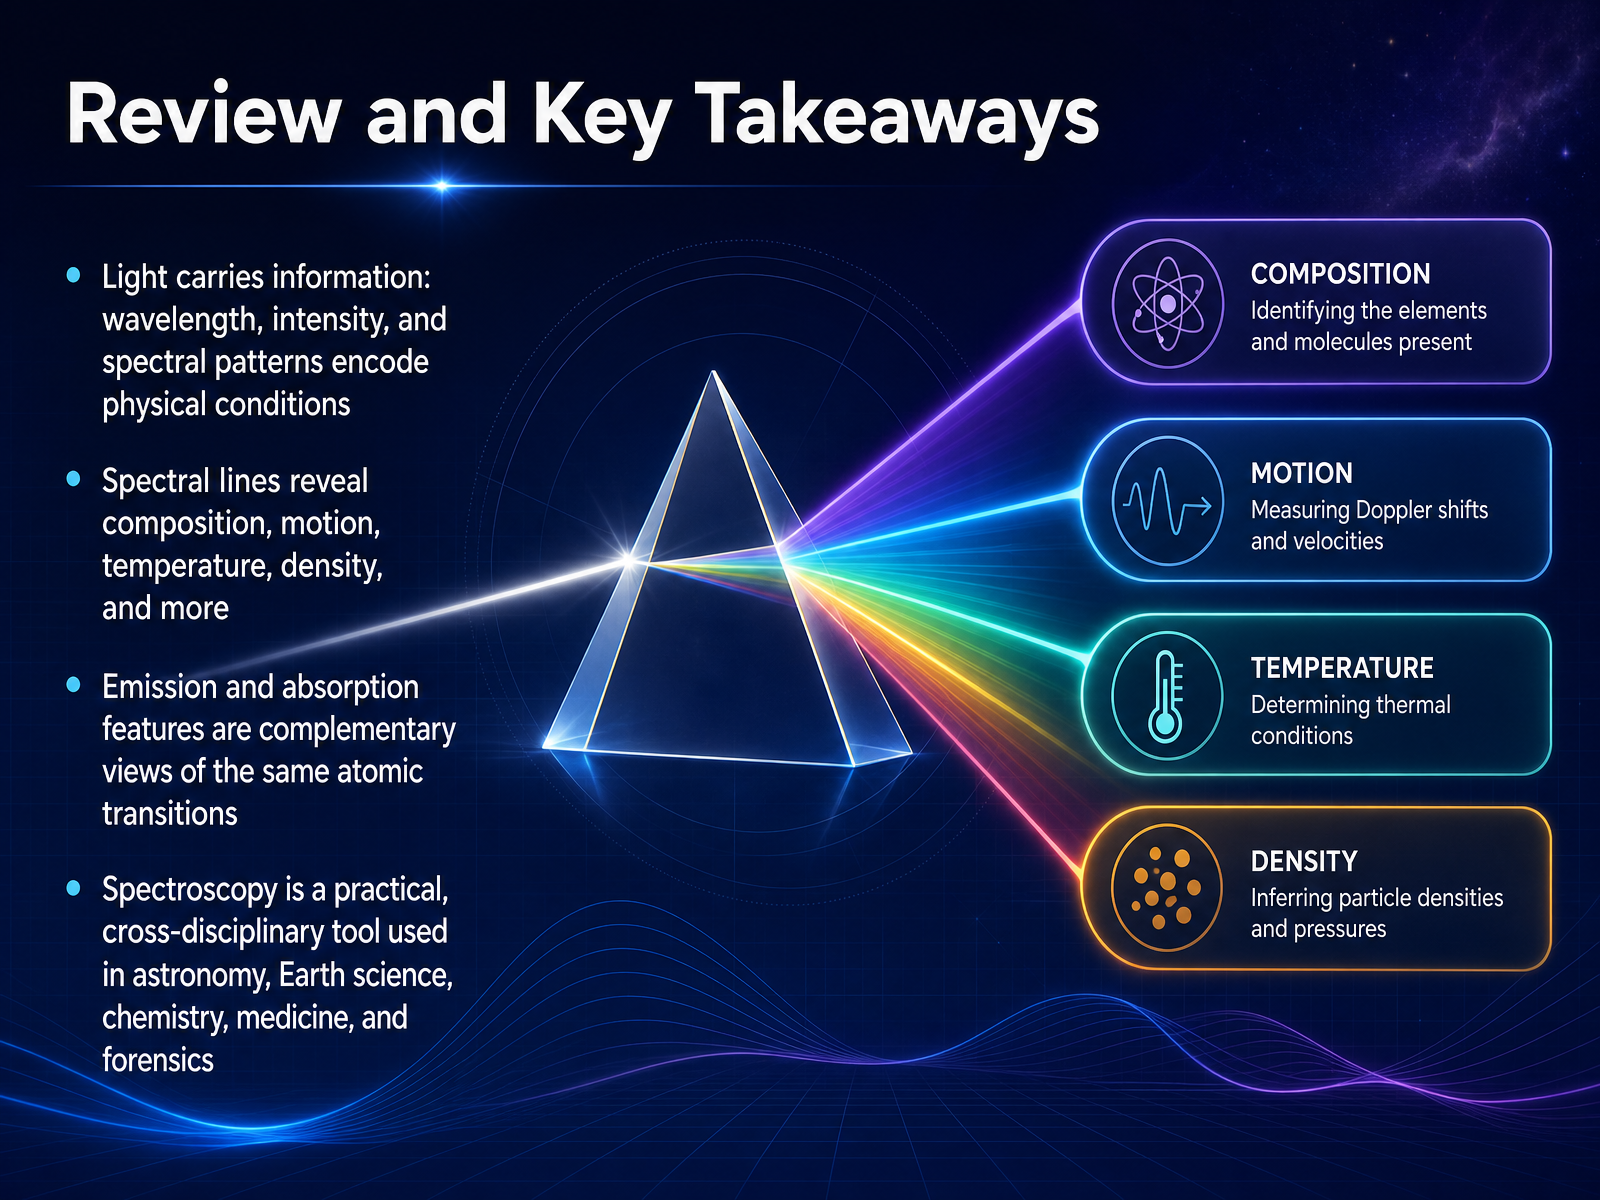
 - 13Review and Key TakeawaysLet's take a moment to bring everything together. Light is never just light. Wavelength, intensity, and the patterns of spectral lines all encode physical conditions. A star's spectrum is like a fingerprint that tells us what it is made of, how hot it is, how fast it moves, and even how dense its atmosphere is. Emission lines and absorption lines may look like opposites, but they are really complementary views of the same atomic transitions. The dark lines we see in stellar spectra and the bright lines we see in glowing gas both spring from electrons moving between energy levels. What makes spectroscopy so powerful is that this same tool reaches far beyond astronomy. Earth scientists use it to study air and minerals. Chemists identify unknown substances. Doctors use it to analyze blood and tissue. Forensic scientists use it to match evidence. One technique, one idea, and it works across the universe. Up next, we will look at practical ways for you to explore and apply spectroscopy yourself.
 imagine.gsfc.nasa.govspectra.freeshell.orgstars.astro.illinois.edu+21 min
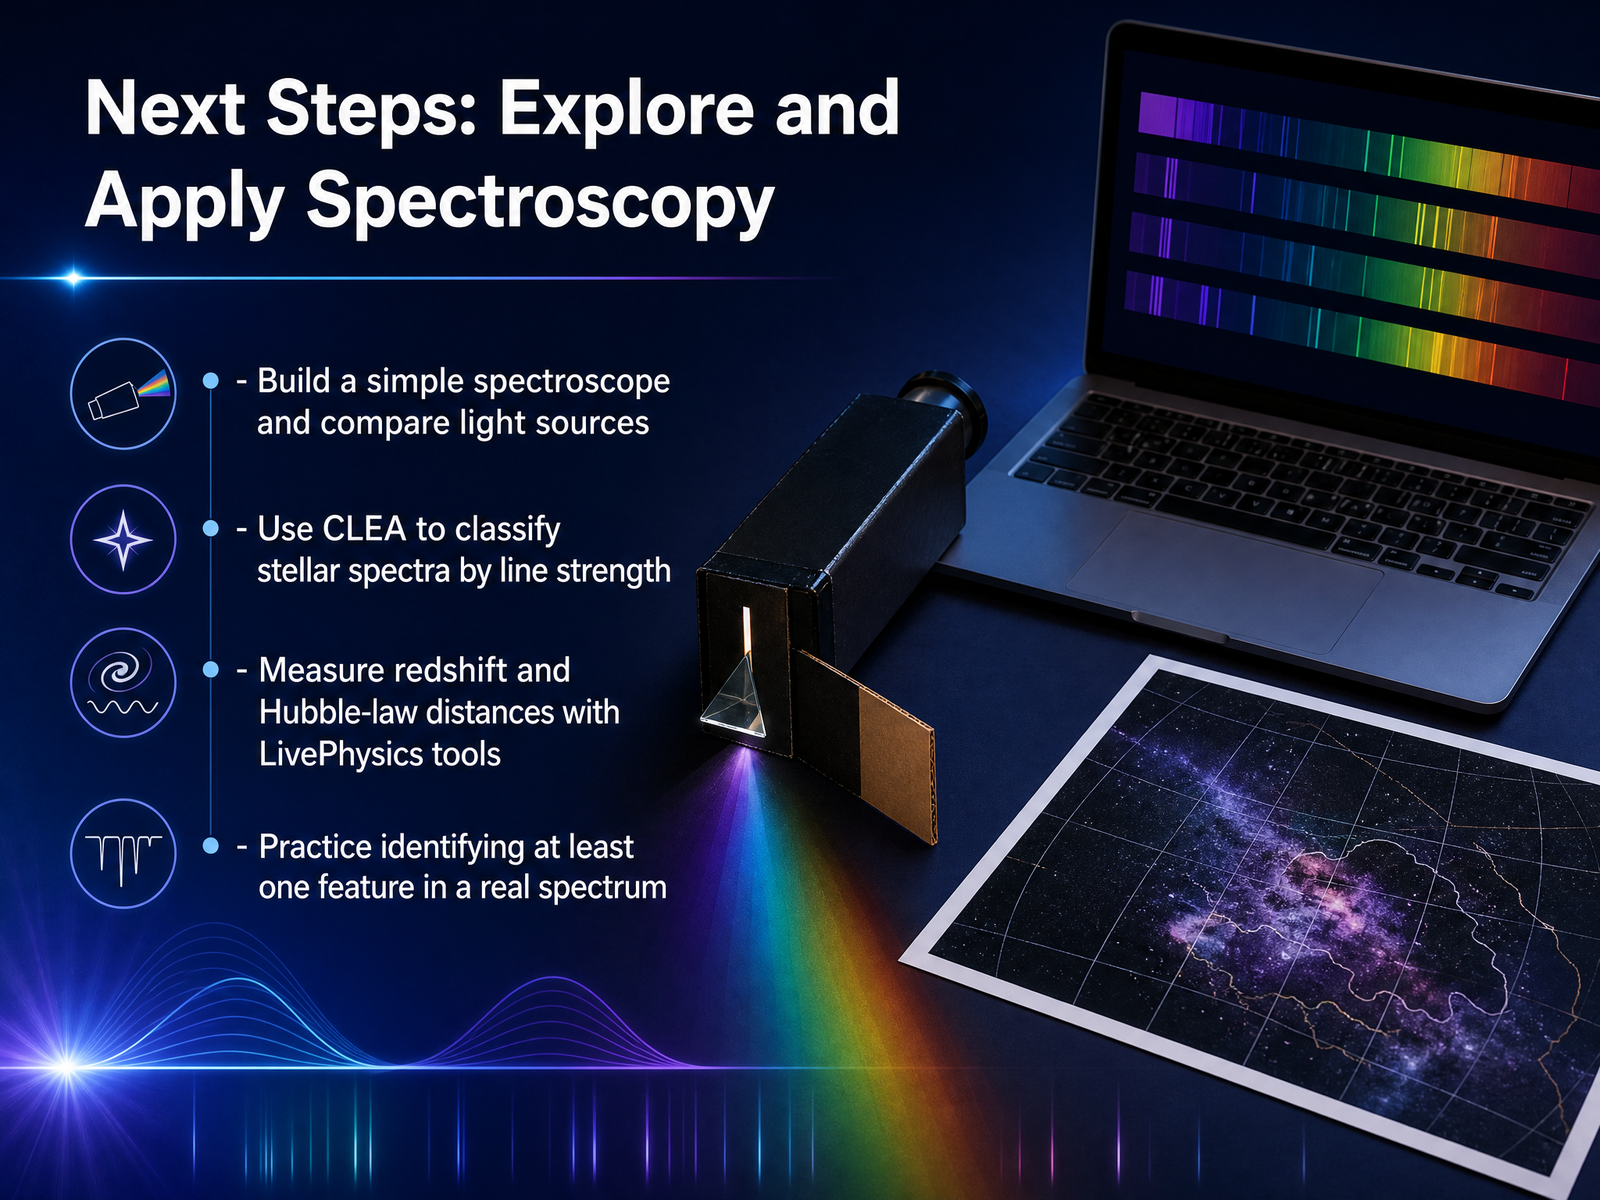
 - 14Next Steps: Explore and Apply SpectroscopyWe have covered a lot of ground, from the first rainbow of visible light to the fingerprints that atoms leave behind in a spectrum. Now, the real adventure is yours. Start small and hands-on. Build a simple spectroscope and point it at different lights around you. A streetlamp, a phone screen, and the sun will look surprisingly different. Then, step into the role of an astronomer. Use the CLIA software to classify stellar spectra by the strength of their absorption lines. You will be sorting stars by temperature, just like professionals do. When you are ready, push further. Measure redshift and calculate distances using Hubble's Law with the LivePhysics tools. It is a powerful feeling to watch a galaxy's motion reveal itself in a tiny shift of light. Finally, take one real spectrum, any spectrum, and find at least one feature you can name. That single act connects you directly to the starlight itself. Thank you for exploring with me. Keep looking closely, and keep asking what the light has to say.
 1 min
1 min
Take the deck with you
Download this course as a file — free, no sign-up needed.
- PDF handoutEvery slide page, ready to print or share.15 pages · 4.0 MBDownload
- Narrated PowerPointThe deck that presents itself — every slide carries the digital human's narration video.15 pages · 15.4 MBDownload
- PowerPoint slidesThe full deck as a .pptx — open it in PowerPoint, Keynote, or Google Slides.15 pages · 3.9 MBDownload
Free to use in your own training — please keep the PersonWise credit page at the end.
Have your own deck? Turn it into a course
Sources consulted
Web sources consulted while building this course.
- Electromagnetic Spectrum — imagine.gsfc.nasa.gov
- Wavelength, Frequency, and Energy - Imagine the Universe! - NASA — imagine.gsfc.nasa.gov
- Electromagnetic radiation - Spectrum, Wavelengths, Properties | Britannica — britannica.com
- 29.3 Photon Energies and the Electromagnetic Spectrum - College Physics for AP® Courses | OpenStax — openstax.org
- Electromagnetic spectrum - Wikipedia — en.wikipedia.org
- 4.4: Kirchhoff's Laws — phys.libretexts.org
- Kirchhoff's Laws and Spectral Analysis — burro.case.edu
- Kirchoff's Laws and Spectroscopy | ASTRO 801 — courses.ems.psu.edu
- Atomic Absorption and Emission Spectra — pas.rochester.edu
- Kirchhoff's laws — astro.vaporia.com
- Atomic Spectra Database | NIST — nist.gov
- Atomic Spectroscopy - Spectral Lines | NIST — nist.gov
- Atomic Spectroscopy - A Compendium of Basic Ideas, Notation, Data, and Formulas | NIST — nist.gov
- NIST: Atomic Spectra Database Lines Form — physics.nist.gov
- NIST: Atomic Spectra Database - Spectral Lines Help File — physics.nist.gov
- Spectra and What They Can Tell Us — imagine.gsfc.nasa.gov
- SpectroWeb - Interactive Digital Spectral Atlases of The Sun, Procyon, Arcturus, Betelgeuse and Other Bright Stars with Detailed Spectral Line Identifications — spectra.freeshell.org
- Spectra - JIM KALER - University of Illinois — stars.astro.illinois.edu
- 17.3 The Spectra of Stars (and Brown Dwarfs) - Astronomy 2e | OpenStax — openstax.org
- 17.3 The Spectra of Stars (and Brown Dwarfs) - Astronomy | OpenStax — openstax.org