Begin
14 pages · ~28 min
Customer Service Metrics That Matter
Learn to identify and track key customer service metrics that drive real business results, improving team performance and customer satisfaction.
A digital instructor presents all 14 pages. Hold “Ask” at any point and ask out loud — the answer comes from this course. No sign-up needed.
What you’ll learn
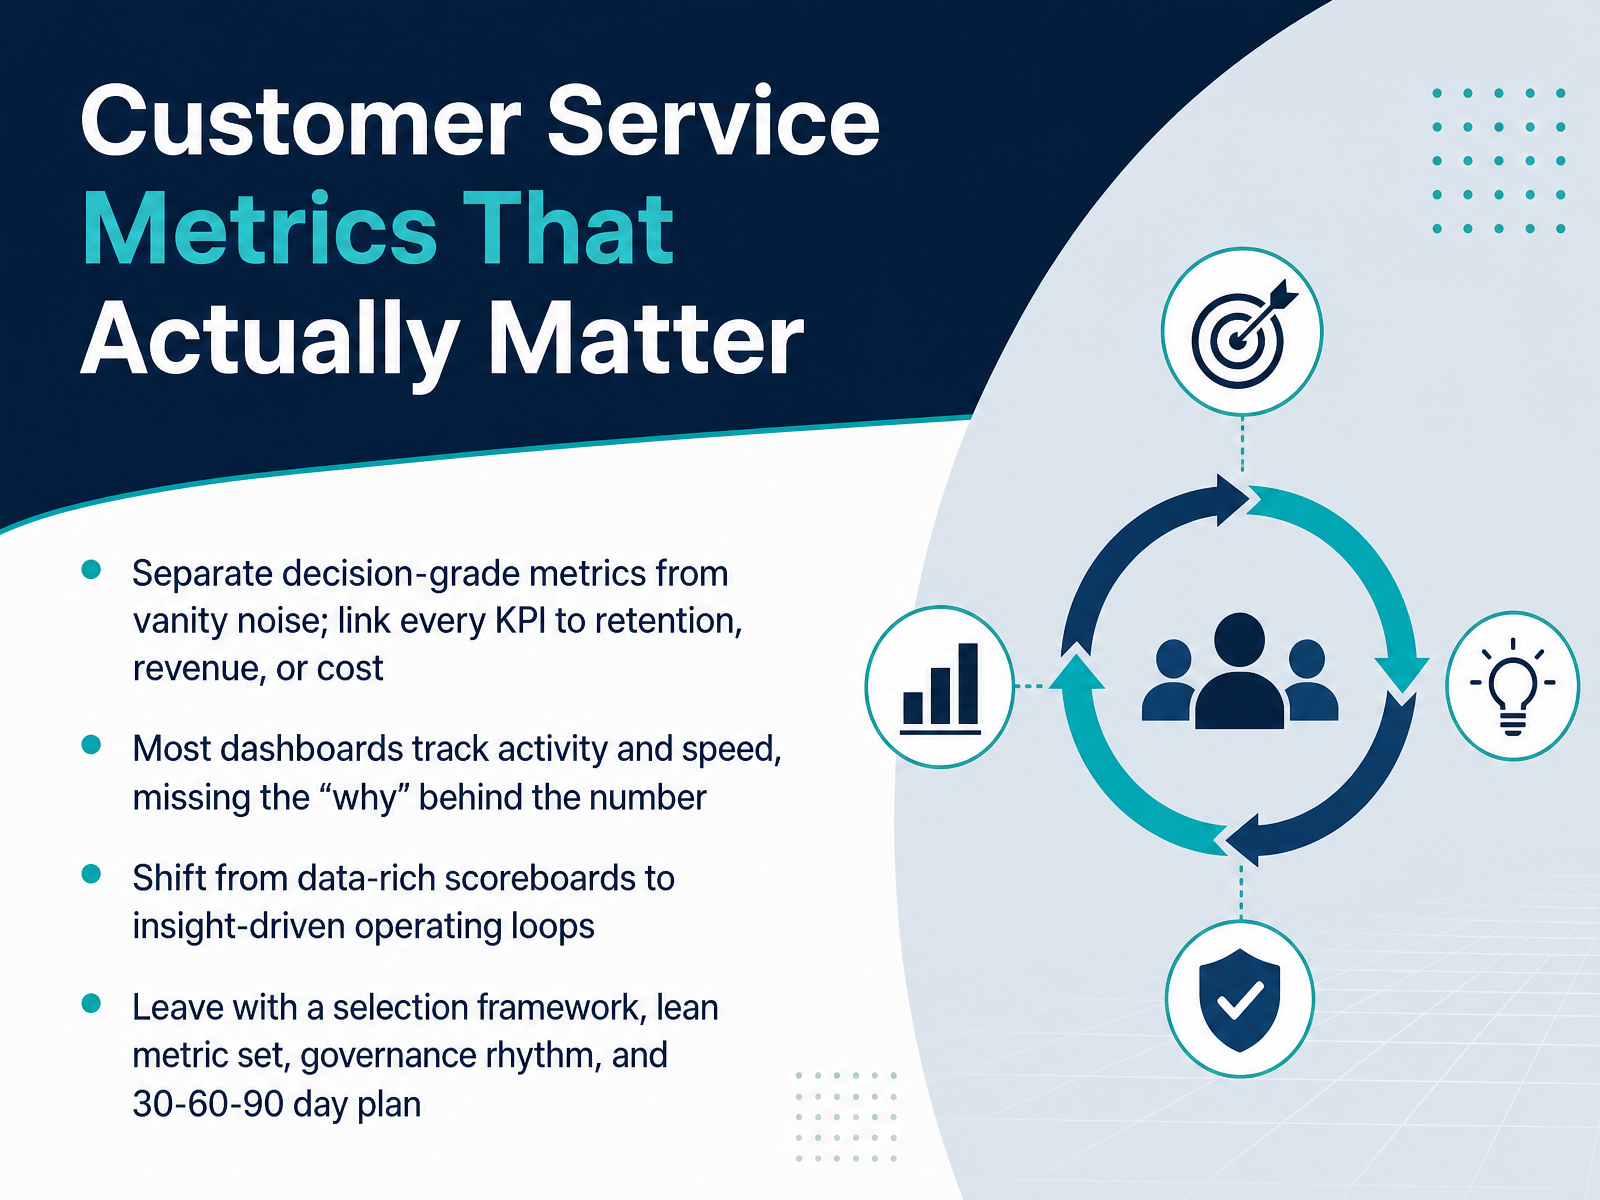
- 01Customer Service Metrics That Actually MatterWelcome. If you work in customer service, customer success, or service operations, you already know the pressure. High call volumes, tight response times, difficult conversations. And on top of all that, you're expected to keep an eye on the dashboard. But here's the thing. Most dashboards are full of numbers that tell you what happened, not why it happened or what to do about it. Today, we're going to change that. We'll separate decision-grade metrics from vanity noise. We'll link every KPI to what actually matters: retention, revenue, and cost. And we'll shift from a data-rich scoreboard to an insight-driven operating loop. You'll leave with a framework to select the right metrics, a lean set to track, a governance rhythm to keep it alive, and a practical 30-60-90 day plan. Let's get to work. Next, we'll look at the most common failure mode behind metric programs.groovehq.comagentstack.buildgetperspective.ai+21 min
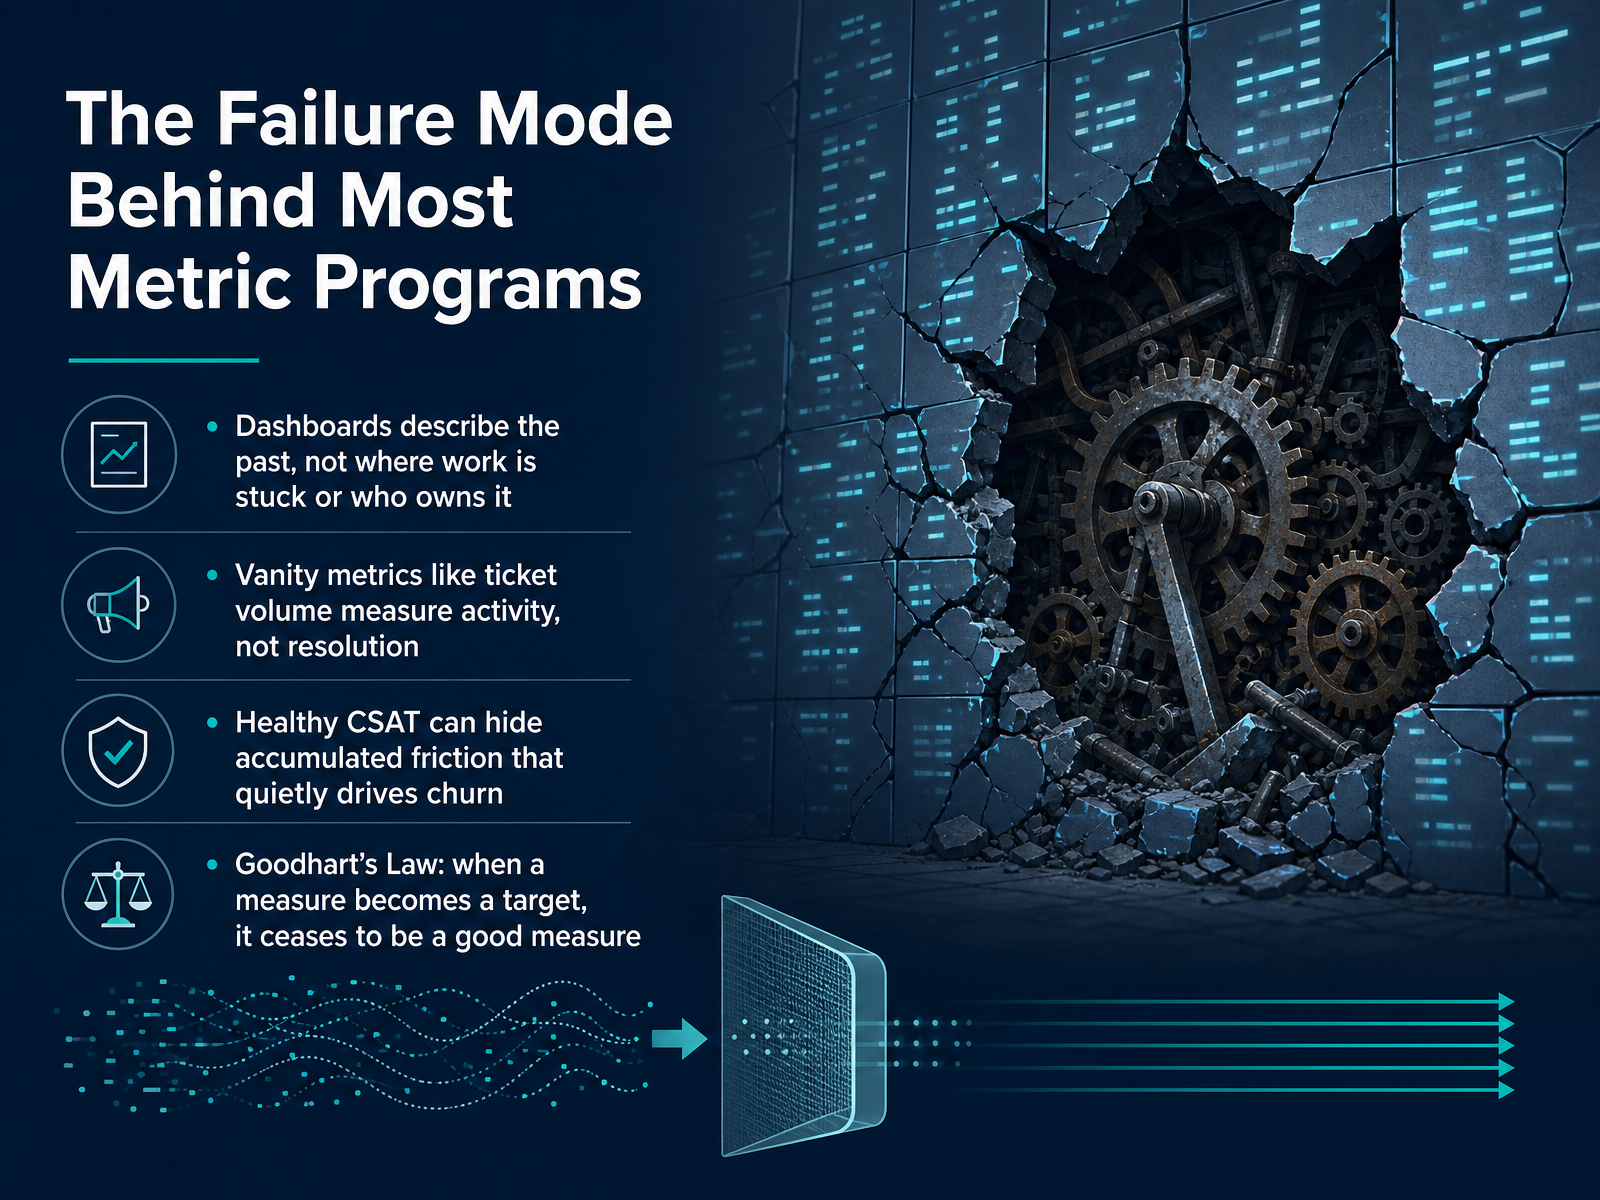
- 02The Failure Mode Behind Most Metric ProgramsLet's take a hard look at why so many metric programs fail. It's not because the numbers are wrong. It's because they describe the past, not where work is stuck. A dashboard might tell you ticket volume dropped last week. But it won't tell you that a handoff between billing and support is silently failing, and no one owns it. Those are vanity metrics. Volume measures activity, not resolution. You can process a thousand tickets and still leave customers with unsolved problems. Here's where it gets dangerous. A healthy CSAT score can hide accumulated friction. Customers quietly do more work, repeat themselves, wait for callbacks. The score looks fine. The effort is quietly driving them away. Which leads to Goodhart's law. When a measure becomes a target, it stops being a good measure. If you reward agents for fast call times, they'll end calls faster. Whether the issue is resolved becomes a secondary concern. So before we chase new metrics, let's understand which ones actually predict what matters. What leading metrics actually predict is our next topic.
 tdcx.comgamedeveloper.comfreevirtualsolutions.com+22 min
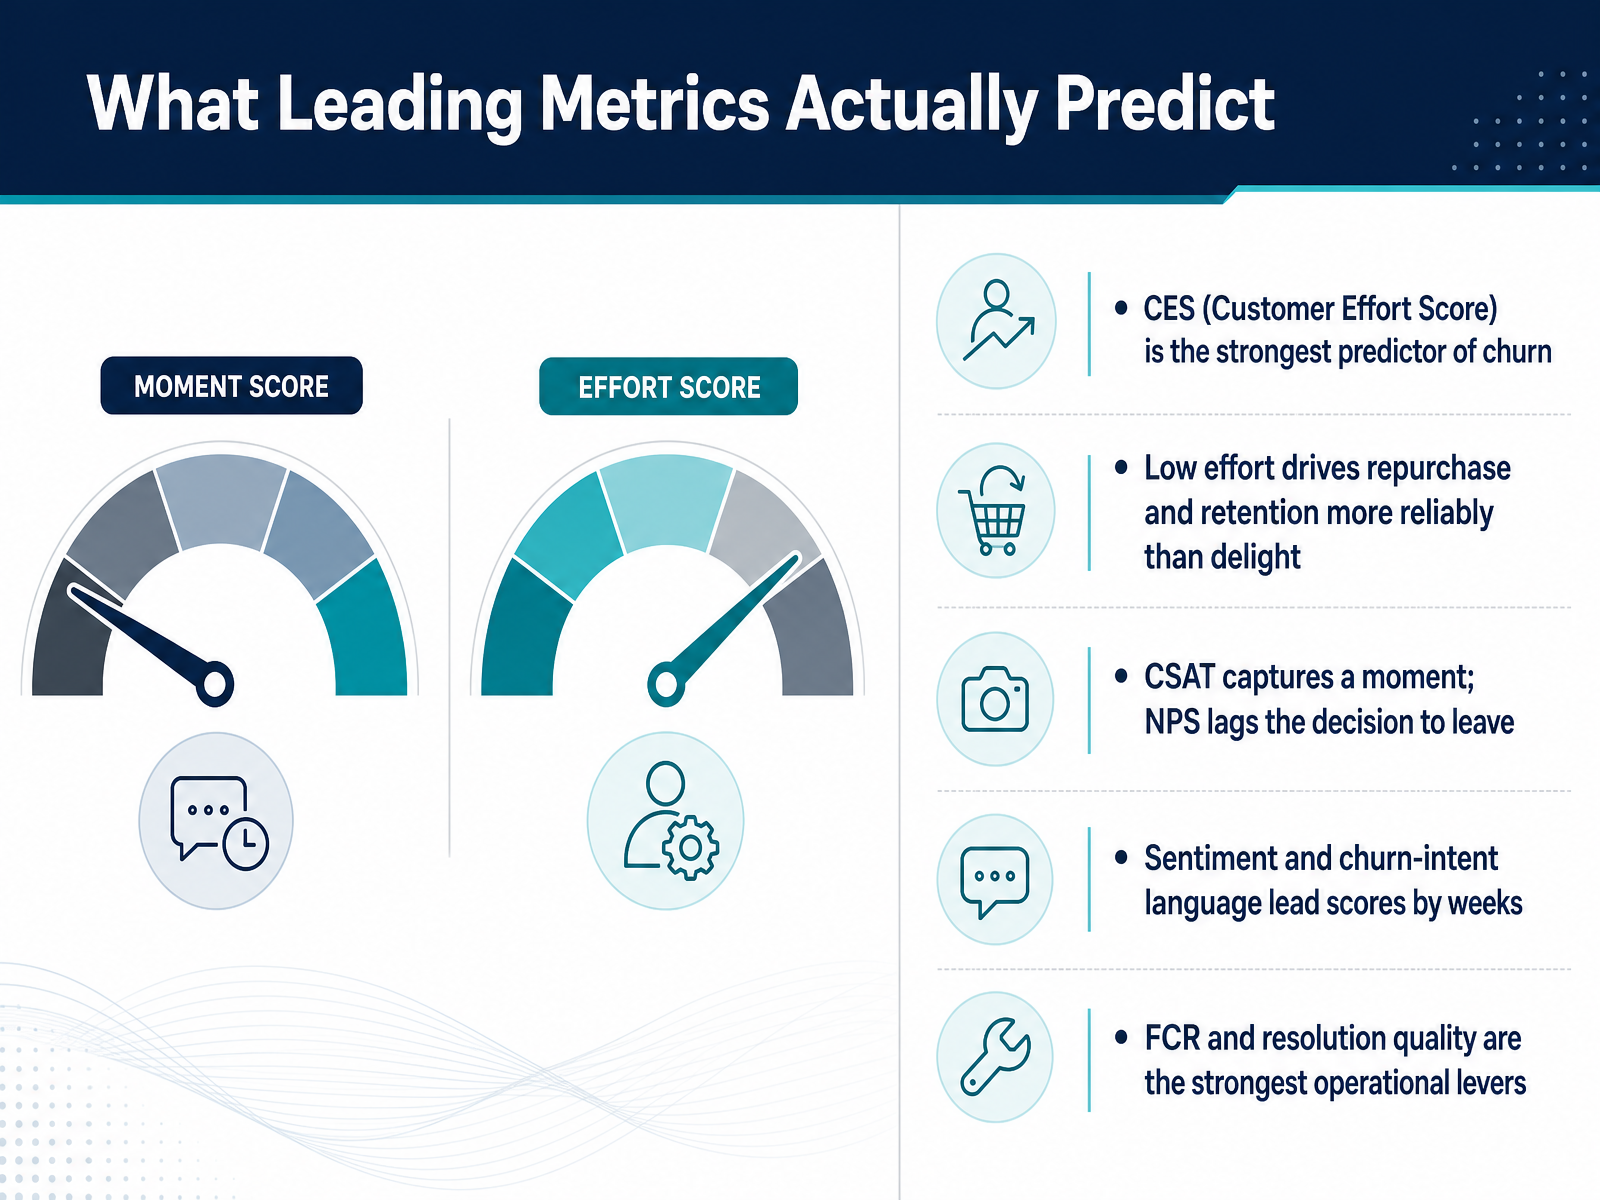
 - 03What Leading Metrics Actually PredictLet's talk about which metrics actually predict customer behavior, because that's the difference between a busy dashboard and a useful one. The strongest predictor of churn isn't satisfaction, it's effort. The Customer Effort Score asks a simple question: was this easy? And research shows that low effort drives repurchase and retention far more reliably than delight does. Customers don't leave because they aren't wowed. They leave because staying feels like too much work. Now, CSAT captures a single moment in time. It tells you if a customer was happy with one interaction, not if they'll renew. And NPS is a lagging indicator; a customer who has already decided to leave will often still give you a polite seven or eight. What leads the scores by weeks are the softer signals: sentiment in their language, and churn-intent phrases like we're evaluating other options. That's your early warning system. On the operational side, first contact resolution and resolution quality are your strongest levers. Improve those, and effort drops, which protects retention. So remember: effort predicts churn, sentiment leads the scores, and resolution quality is your lever. Next, we'll look at a framework for choosing which metrics deserve your attention.
 getperspective.aihappysupport.aiqiscus.com+22 min
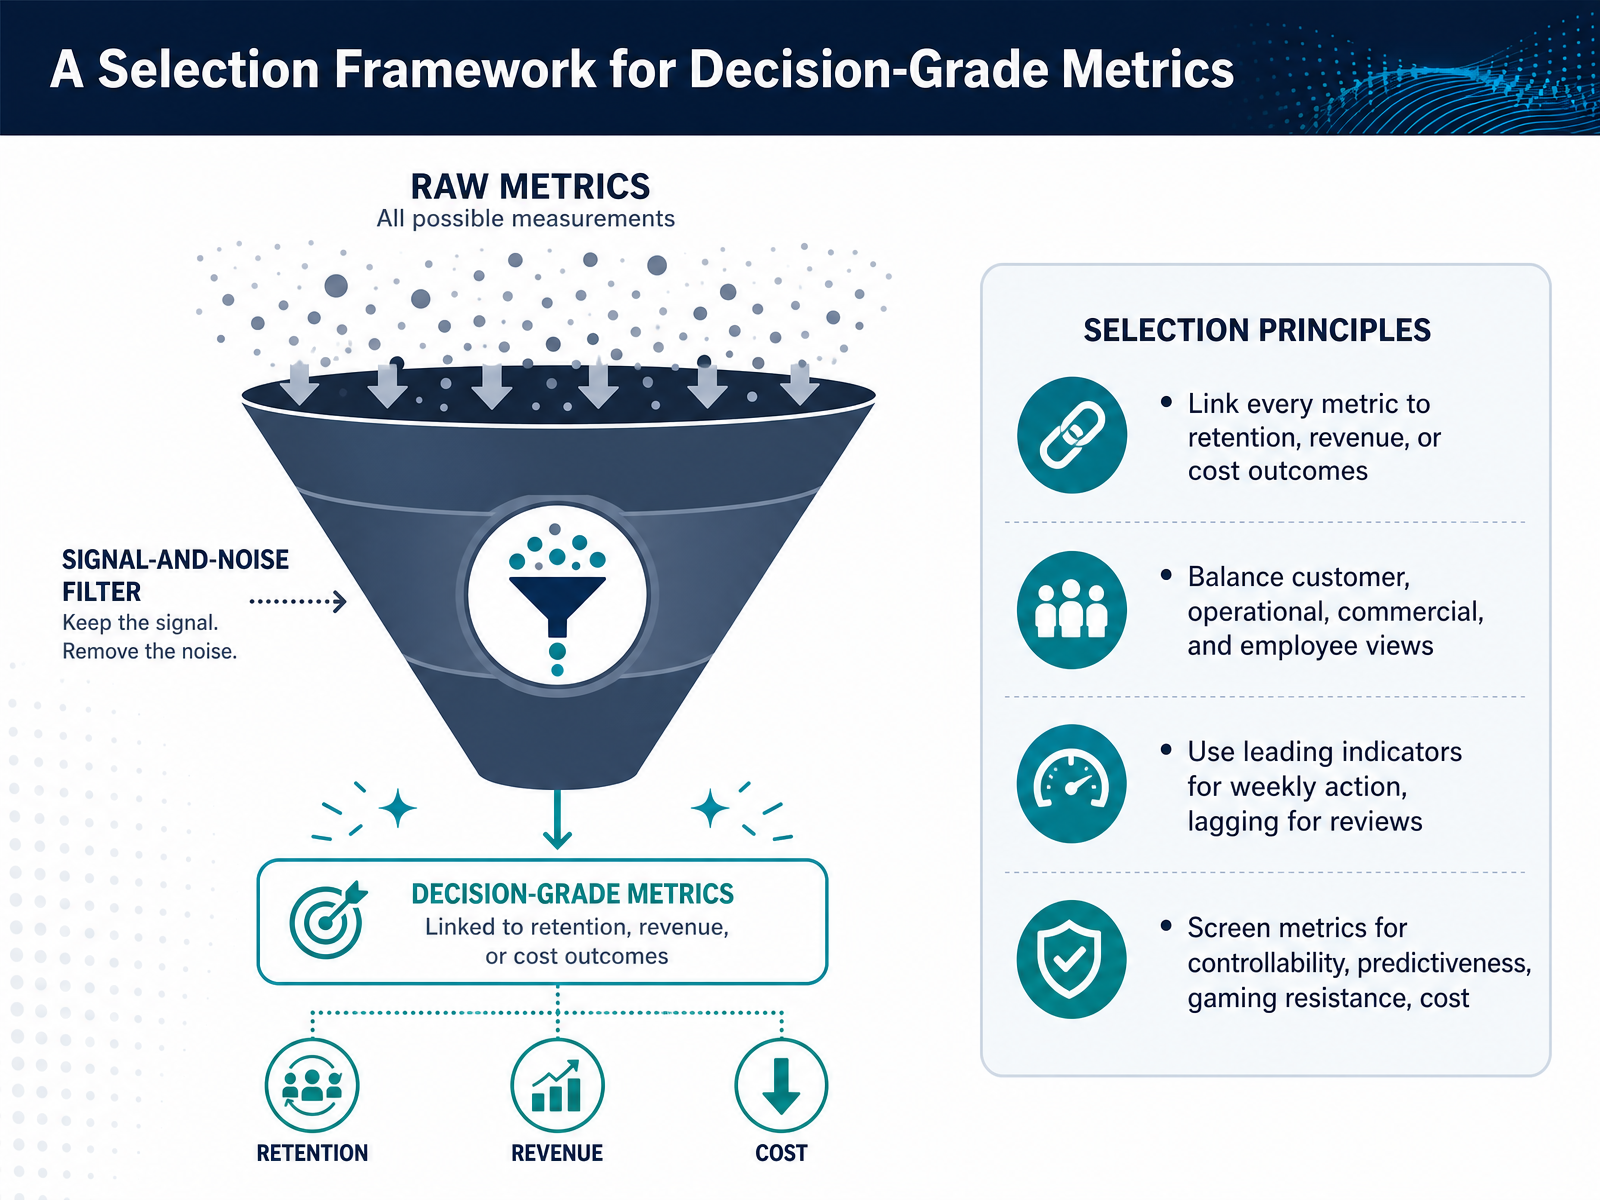
 - 04A Selection Framework for Decision-Grade MetricsSo how do we choose which metrics actually earn a place on our dashboard? Start with the outcome. Every metric should connect to retention, revenue, or cost. If it doesn't, challenge why it's there. Next, balance your view. You need customer, operational, commercial, and employee perspectives, because a metric that looks great in one area can hide damage in another. Then, think in pairs. Use leading indicators for weekly action, things like first contact resolution or knowledge base usage. Use lagging indicators for reviews, like satisfaction scores or cost per contact. Finally, screen every candidate through four tests. Can your team influence it this sprint? Does it reliably predict an outcome? Can it resist gaming? And is it cheap to capture and explain? If a metric fails these tests, it's not decision-grade. Keep that bar high, and your scorecard stays lean and truthful.
 bscdesigner.comasean-ssa.orgcallcentrehelper.com+21 min
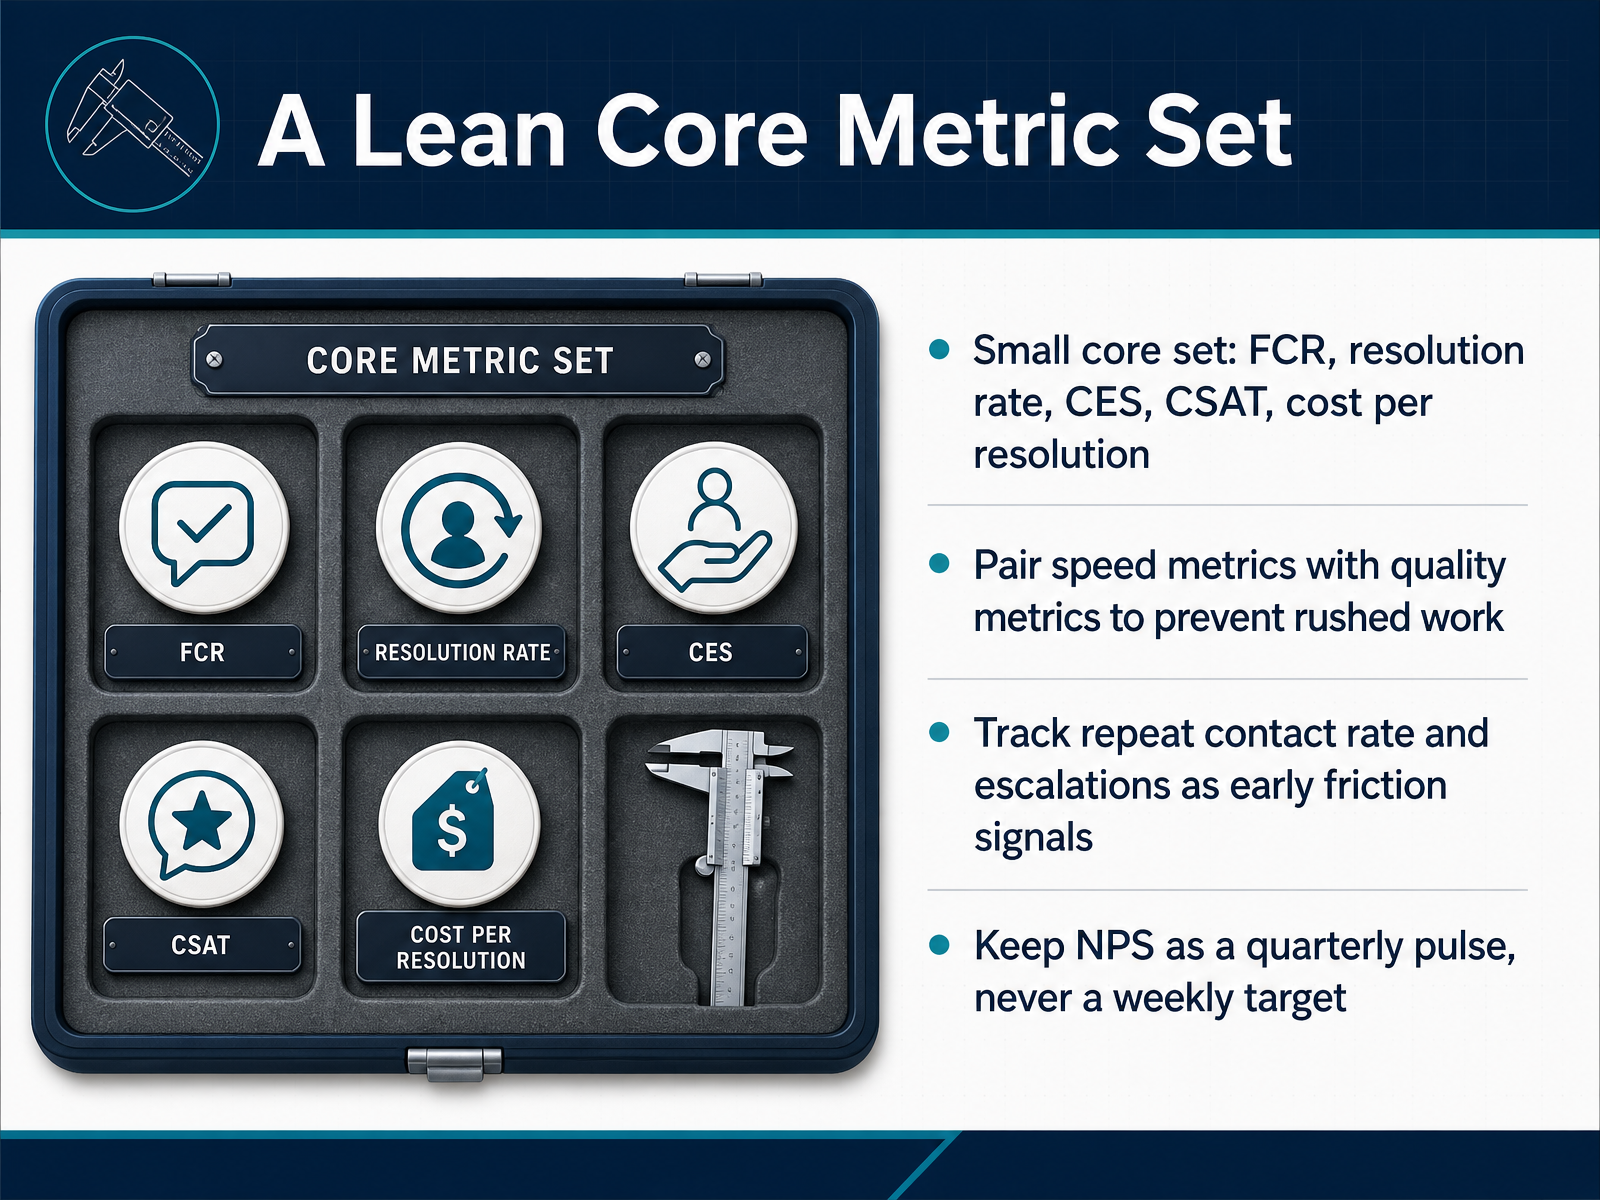
 - 05A Lean Core Metric SetNow, let's talk about building a lean core metric set. The goal here is focus, not volume. Start with five essential metrics: first contact resolution, resolution rate, customer effort score, CSAT, and cost per resolution. These five tell you most of what you need to know about your service quality and its cost. When you use them together, they are far more powerful than a one hundred item dashboard. And here is the critical part: always pair speed metrics with quality metrics. If you focus on speed alone, you will get rushed work, unresolved tickets, and customers who call back angrier. Instead, watch repeat contact rate and escalations. These are early warning signals. When they rise, friction is building before your satisfaction scores even move. As for NPS, keep it as a quarterly pulse, not a weekly target. NPS tells you about long-term loyalty, not today's performance. So build your dashboard around problem-solving, not busyness. Every metric should help you make a decision, not just fill a graph. Next, let's look at how support metrics compare with customer success metrics.
 groovehq.comagentstack.buildgetperspective.ai+21 min
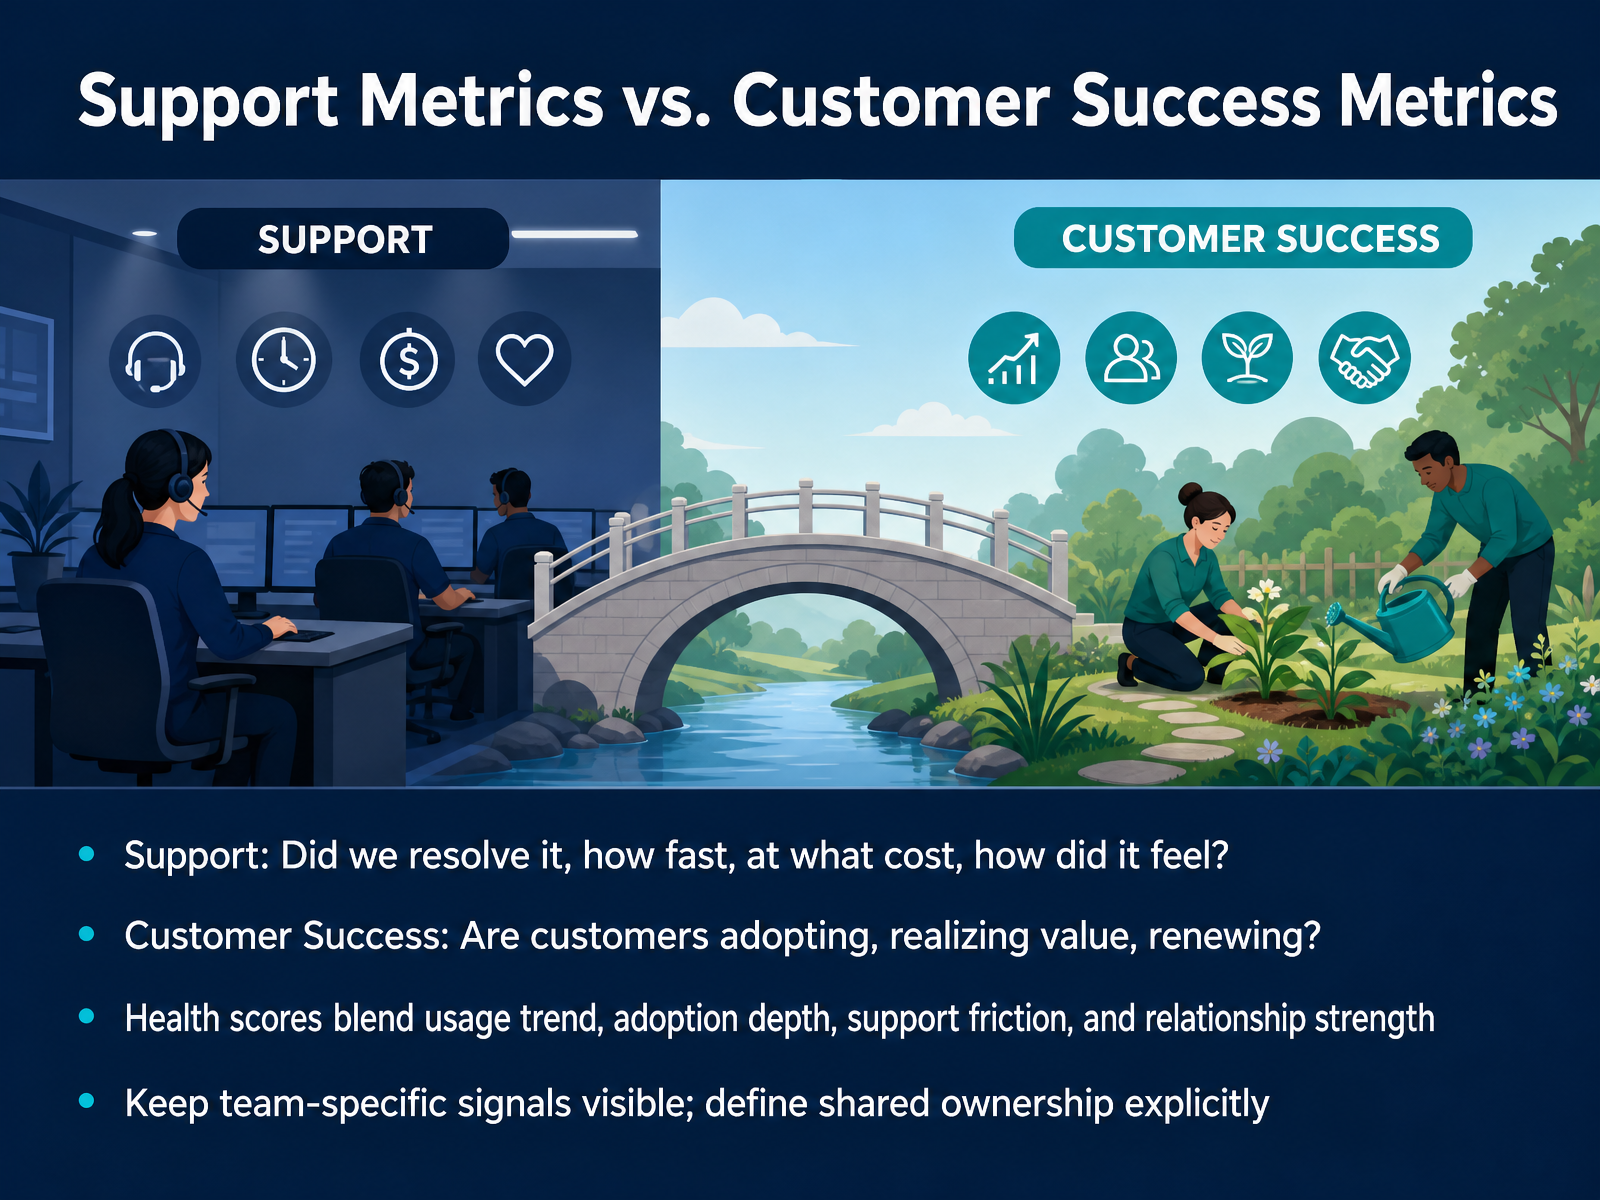
 - 06Support Metrics vs. Customer Success MetricsLet’s now separate support metrics from customer success metrics. Support answers four questions: did we resolve the issue, how fast, at what cost, and how did the customer feel about the interaction? Those are your operational anchors. Customer success looks further ahead. Are customers adopting the product? Are they getting real value? Will they renew? That’s where health scores come in. A health score blends usage trends, adoption depth, support friction, and relationship strength into one number that predicts renewal risk. But here’s the key, don’t merge everything into one giant score that no one owns. Keep support signals visible to support, keep adoption signals visible to success, and then explicitly define who owns the shared ones. For example, support owns ticket volume and resolution time. Success owns adoption and renewal risk. Both share the health score. That clarity prevents the blame game and keeps everyone acting on the right data. Next, we’ll look at how to build health scores that actually predict outcomes.
 getperspective.aihappysupport.aiqiscus.com+21 min
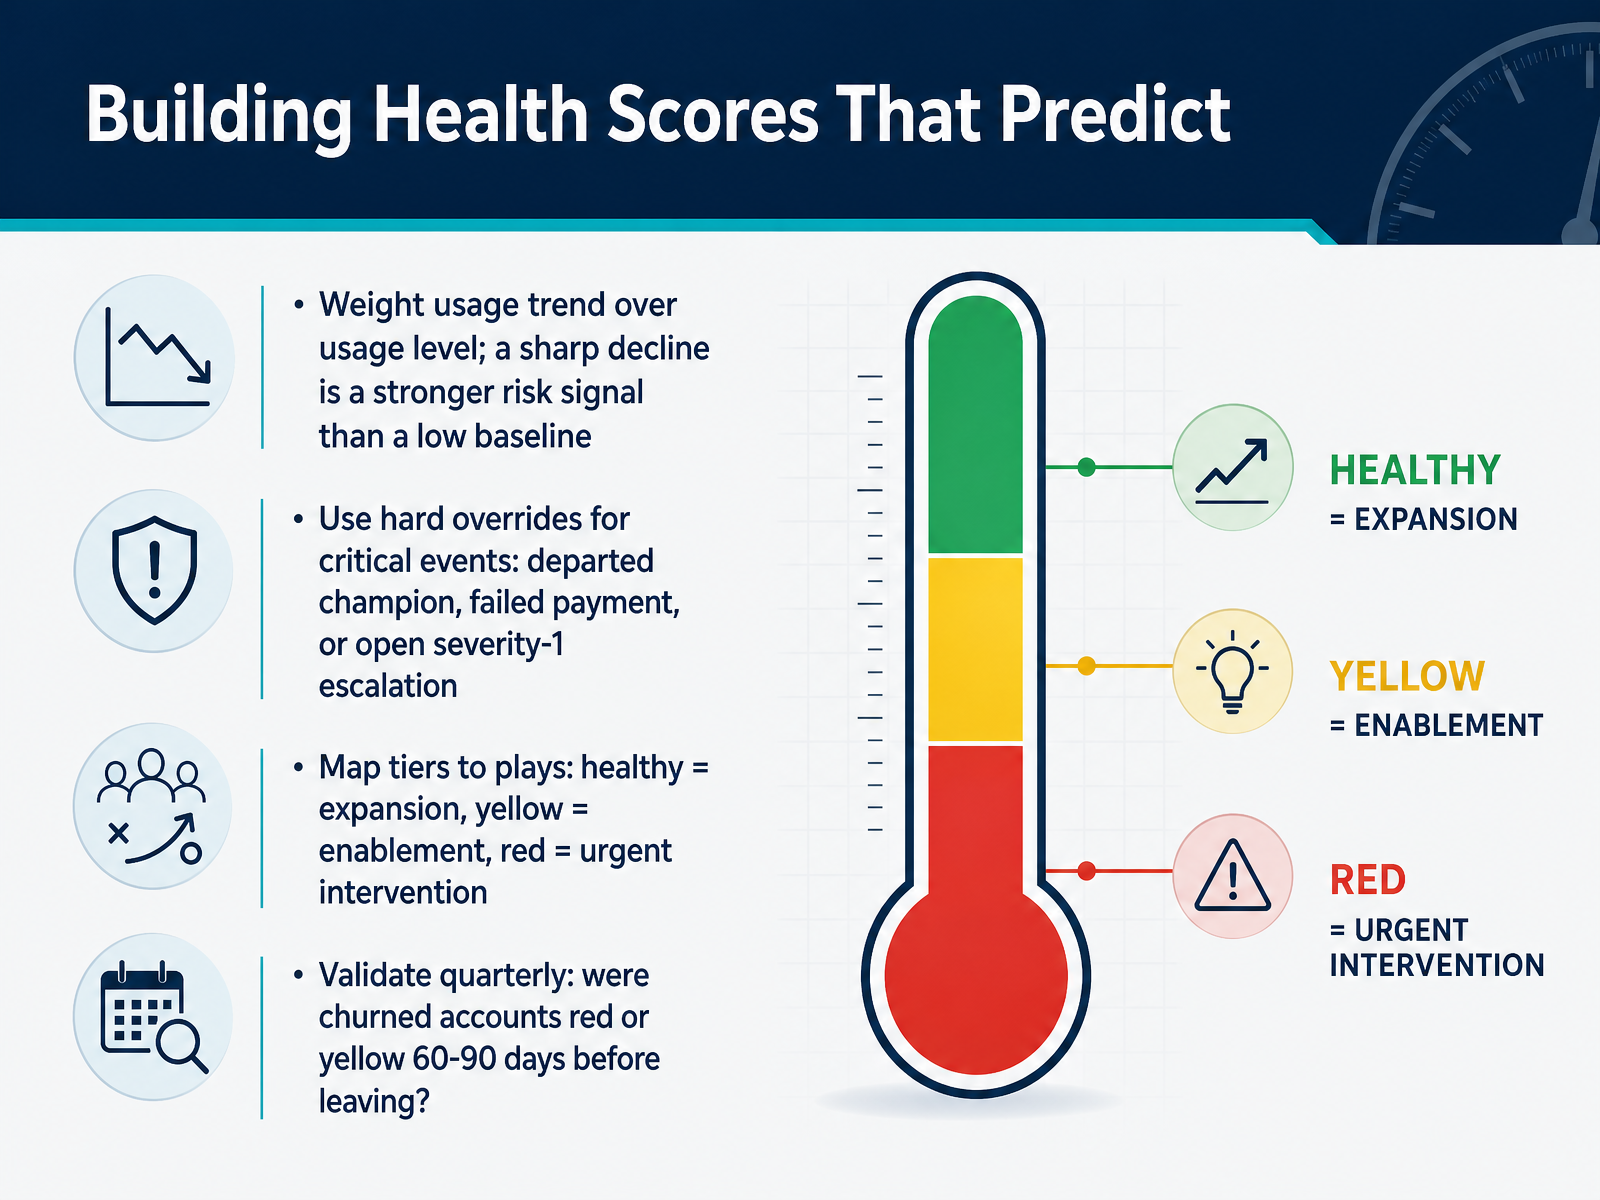
 - 07Building Health Scores That PredictLet’s build a health score that actually predicts risk. The first rule: watch the trend, not just the level. A customer whose usage drops sharply this month is a bigger warning sign than one who’s been steady at a low level for months. That decline tells you something changed. Next, add hard overrides for critical events. If a champion leaves, a payment fails, or a severity-one escalation is open, that account goes red immediately — no matter what the score says. Then, map each tier to a play. Healthy accounts get expansion conversations. Yellow accounts get enablement and training. Red accounts get urgent intervention with your leadership involved. Finally, validate the model quarterly. Look back at accounts that churned. Were they yellow or red sixty to ninety days before they left? If they were green, your model is wrong — reweight and recalibrate. A score you trust is one you’ve tested against real outcomes. Next, let’s talk about targets, incentives, and the gaming trap.
 getperspective.aihappysupport.aiqiscus.com+22 min
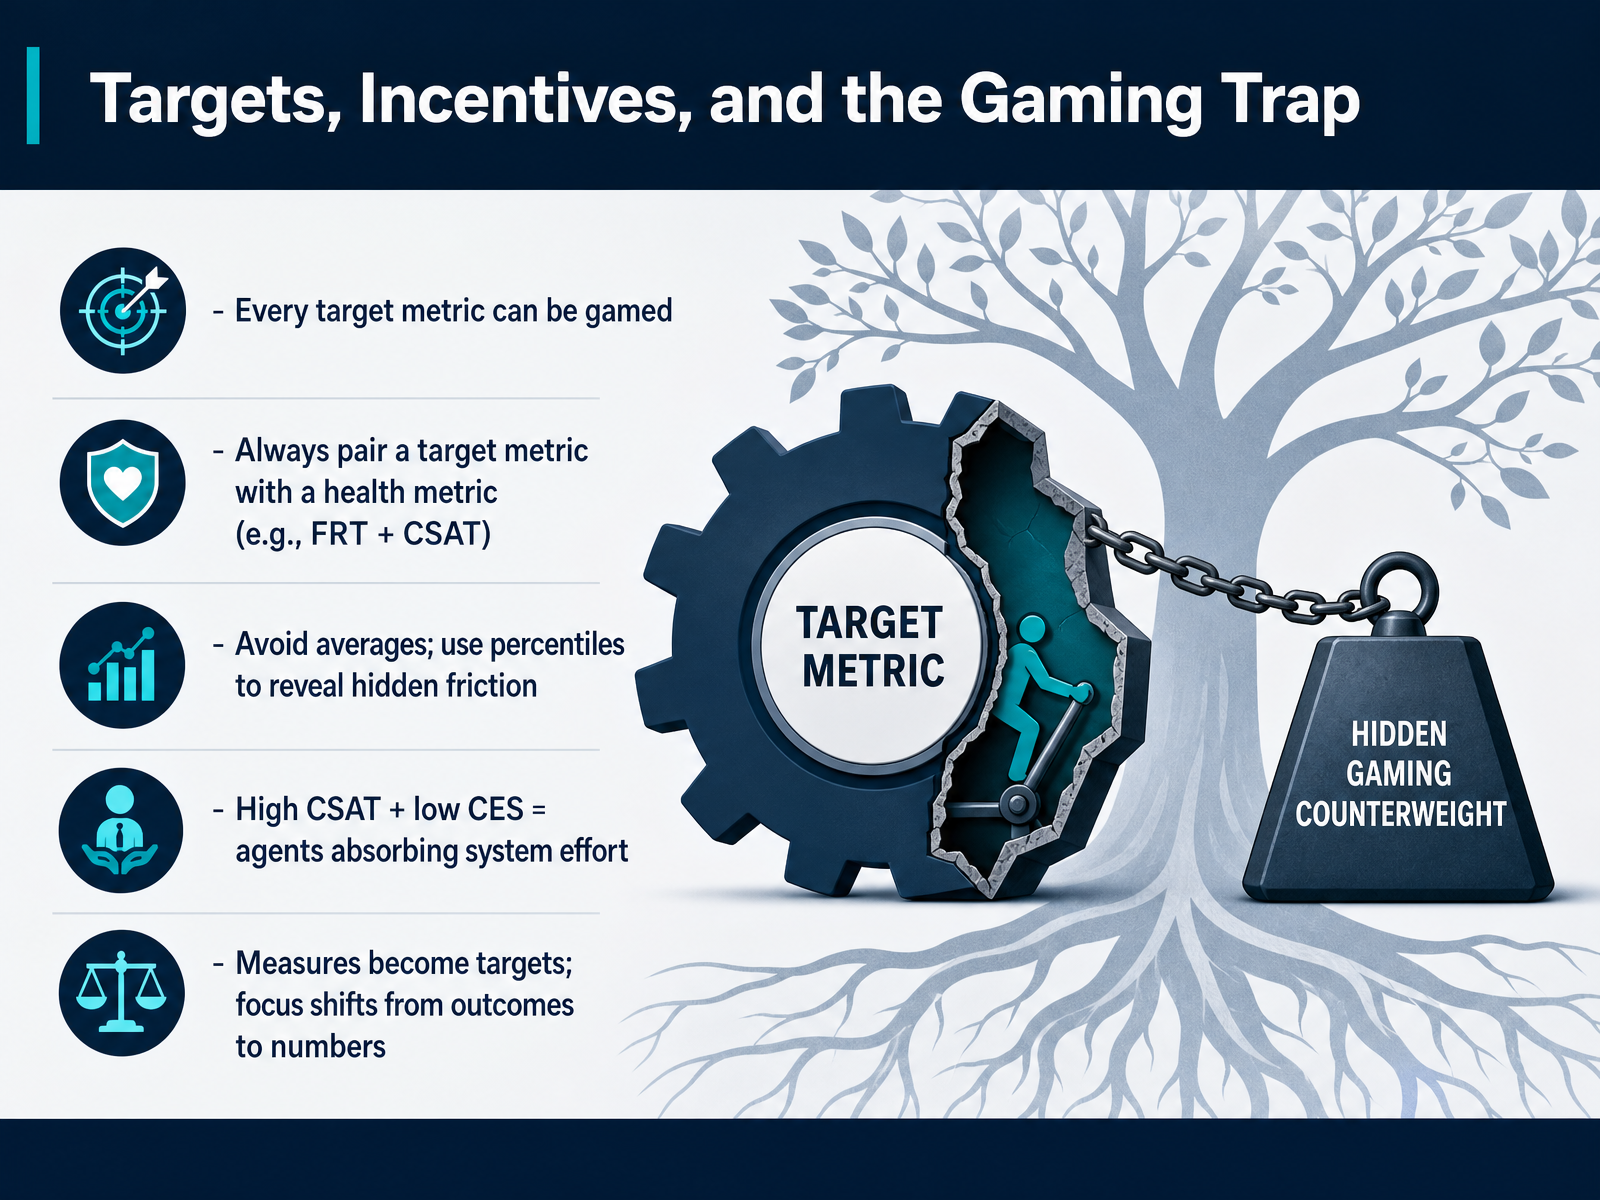
 - 08Targets, Incentives, and the Gaming TrapLet's talk about the trap hidden inside every metric. Any target you set can be gamed, and it will be, often without anyone intending to. That's why a target metric always needs a health metric beside it. Speed only matters if satisfaction survives, so pair first response time with CSAT. Watch out for averages, too. They hide the friction your slowest cases create. Use percentiles to see the whole picture. And when CSAT is high but customer effort is low, that's a warning sign. It means your agents are absorbing effort the system should absorb, and that churn risk hides underneath. The real principle is simple: measures become targets, so guard against the focus shifting from outcomes to numbers. Every metric you choose is a decision-making tool, not a scorecard for the sake of one. Keep that in mind as we move to building a governance rhythm that keeps all these metrics honest.
 tdcx.comgamedeveloper.comfreevirtualsolutions.com+21 min
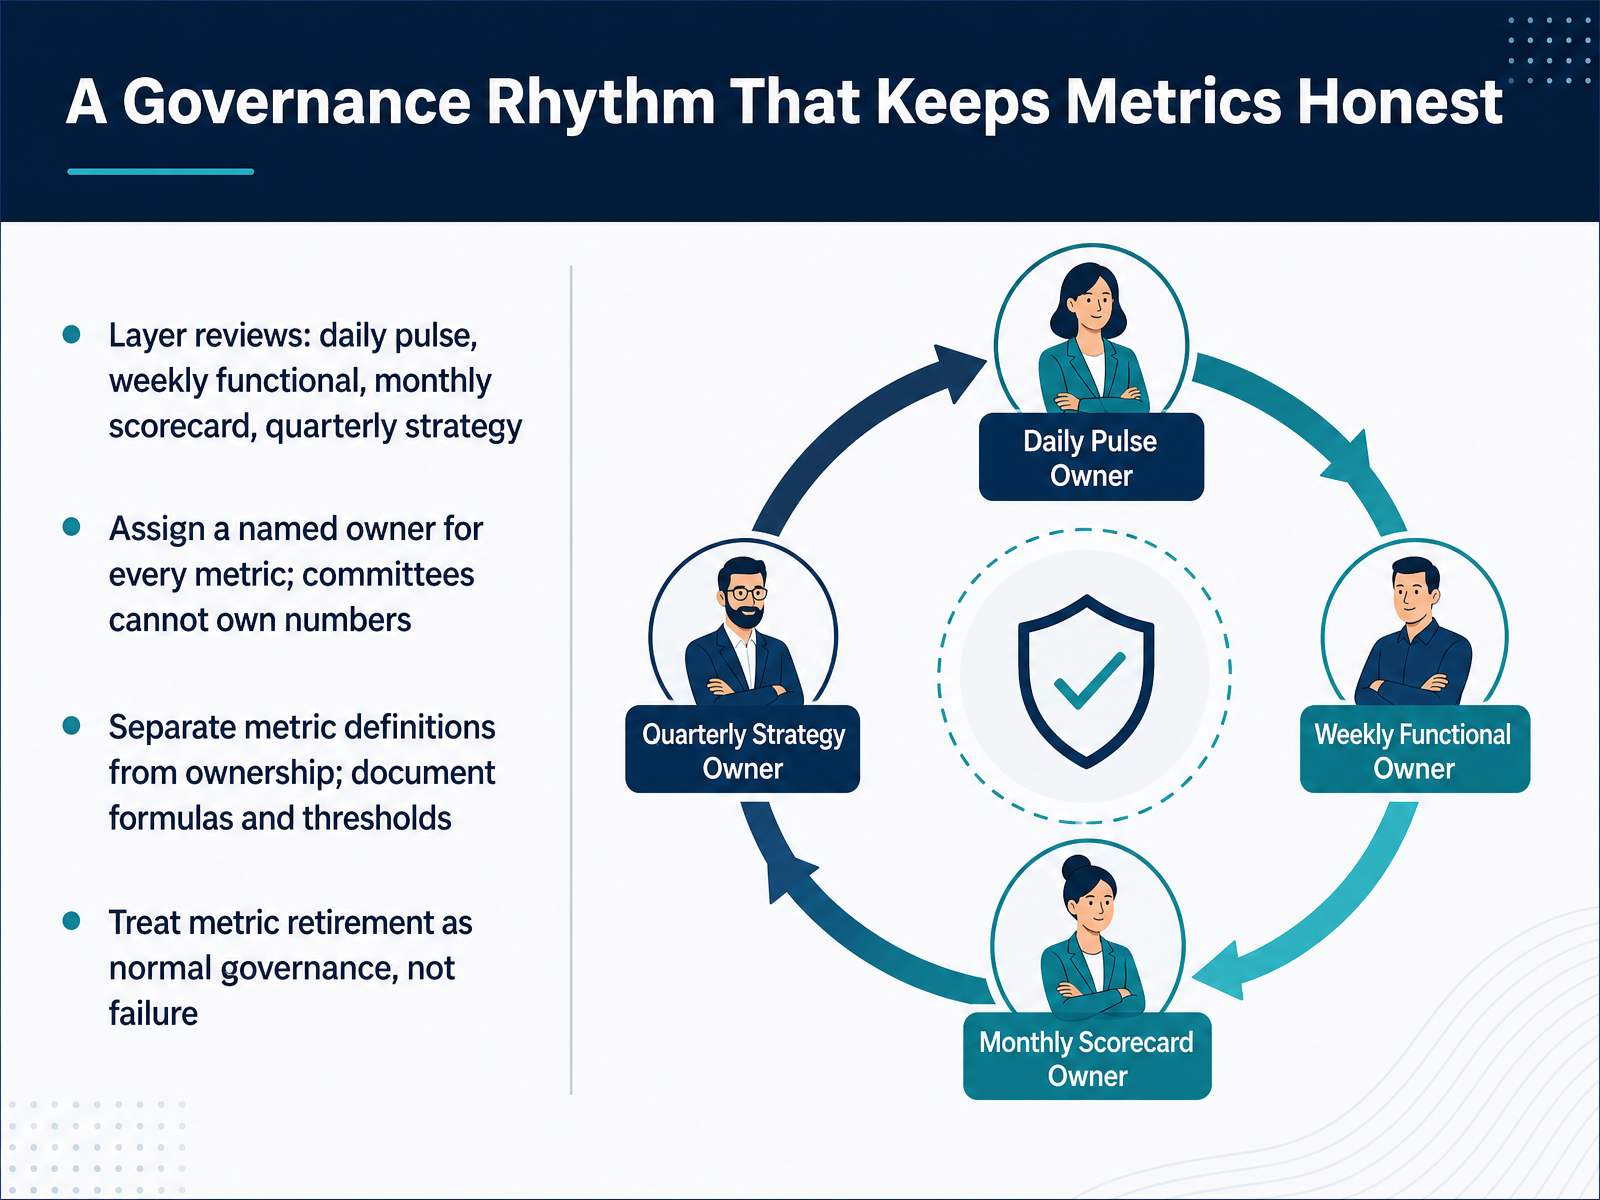
 - 09A Governance Rhythm That Keeps Metrics HonestGood metrics need a steady governance rhythm, or they start to drift. Think of it as layers of review. A daily pulse for quick checks on queues and SLA risks. A weekly functional review where each team digs into their own numbers. A monthly scorecard that balances outcomes like CSAT with operational metrics. And a quarterly strategy session to step back and adjust direction. Now, here's the key: every single metric must have a named owner. A committee can't own a number, because when everyone is responsible, no one actually is. So assign one person who's accountable for explaining the trend and driving improvements. Also, keep the definition of a metric separate from who owns it. Document the formula and the threshold clearly. That way, when someone leaves or a team changes, the metric doesn't become ambiguous. Finally, know that retiring a metric is a normal part of governance, not a failure. Metrics should serve the current reality, not become permanent fixtures. So build this rhythm into your operation, and your metrics will stay honest, actionable, and aligned with what your customers actually experience. Next, let's look at how to turn these insights into action and close the loop.
 bscdesigner.comasean-ssa.orgcallcentrehelper.com+21 min
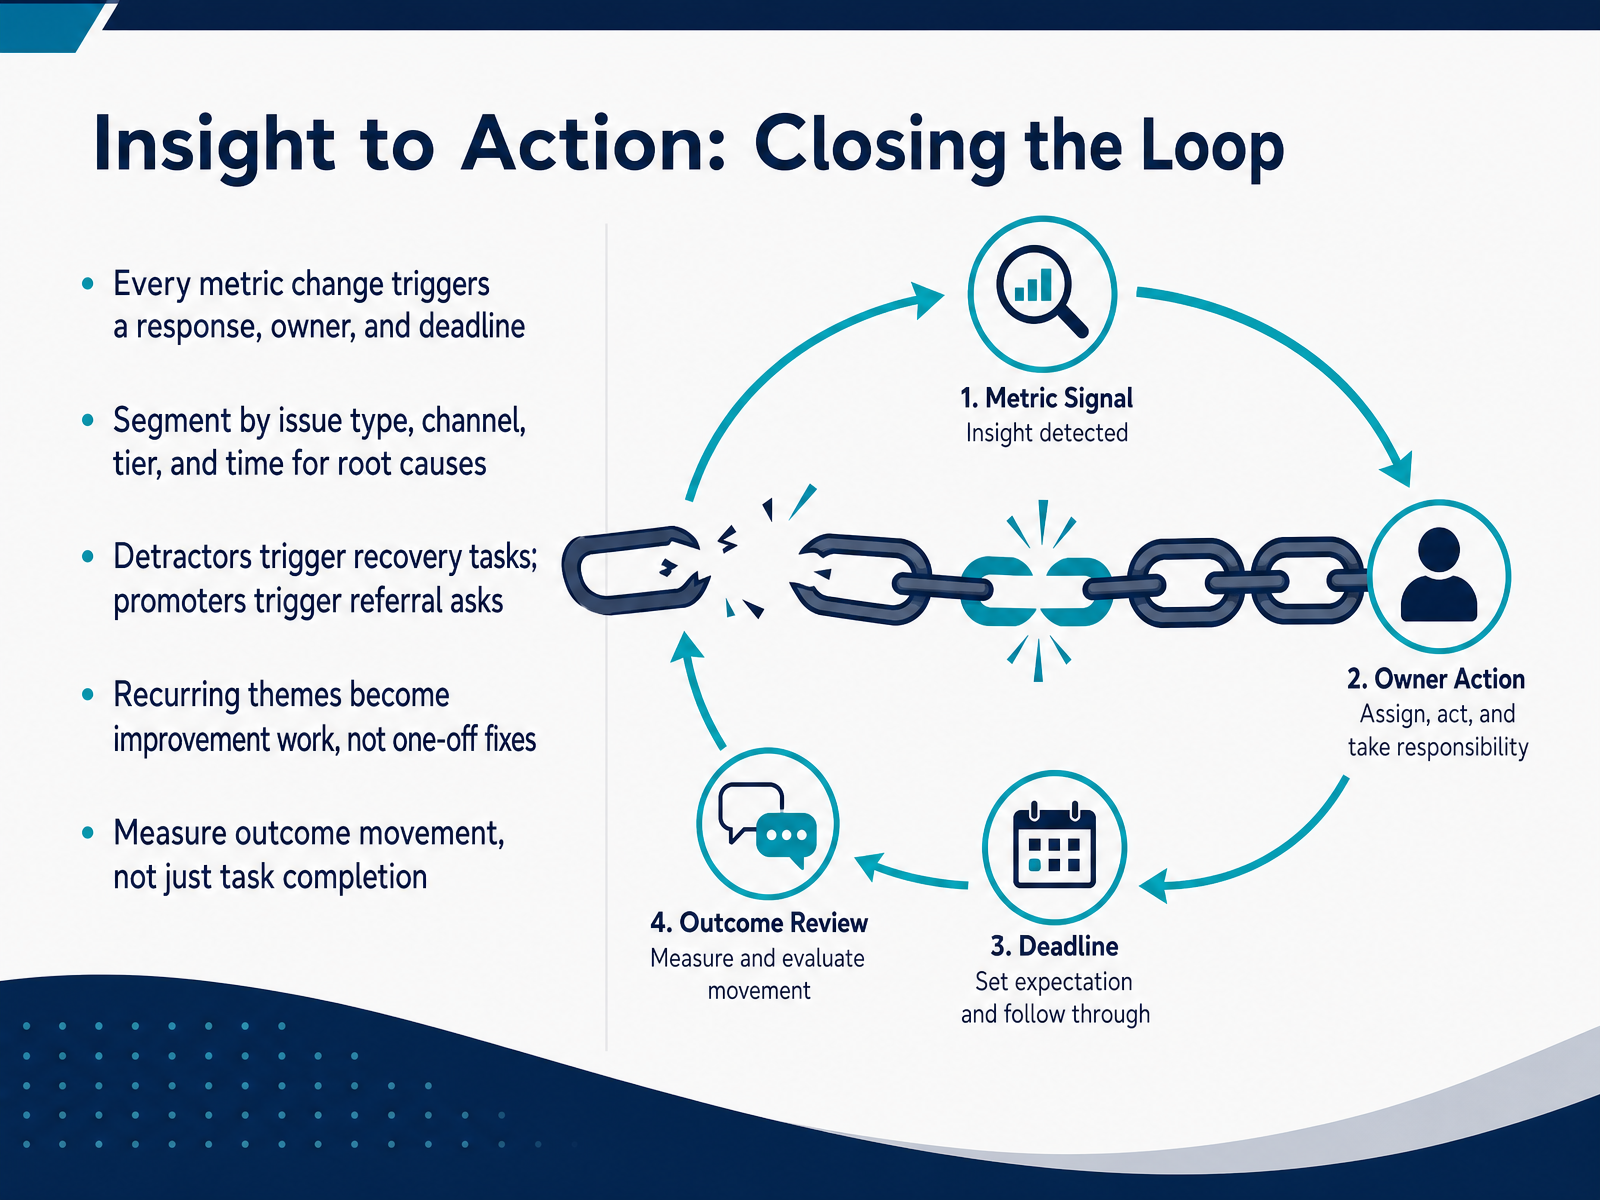
 - 10Insight to Action: Closing the LoopNow, let's talk about closing the loop. Every metric change should trigger a response, an owner, and a deadline. If a number moves and nobody acts, it's just noise. Start by segmenting issues by type, channel, tier, and time to find root causes. A billing issue on email is not the same as a product bug on chat. When detractors score you low, they trigger recovery tasks—reach out fast, with a clear plan. When promoters score you high, trigger a referral ask while they're still engaged. Recurring themes should become improvement projects, not one-off fixes. And most importantly, measure outcome movement, not just task completion. Did the follow-up actually change the customer's experience? That's the difference between doing the work and doing what matters.
 tdcx.comgamedeveloper.comfreevirtualsolutions.com+21 min
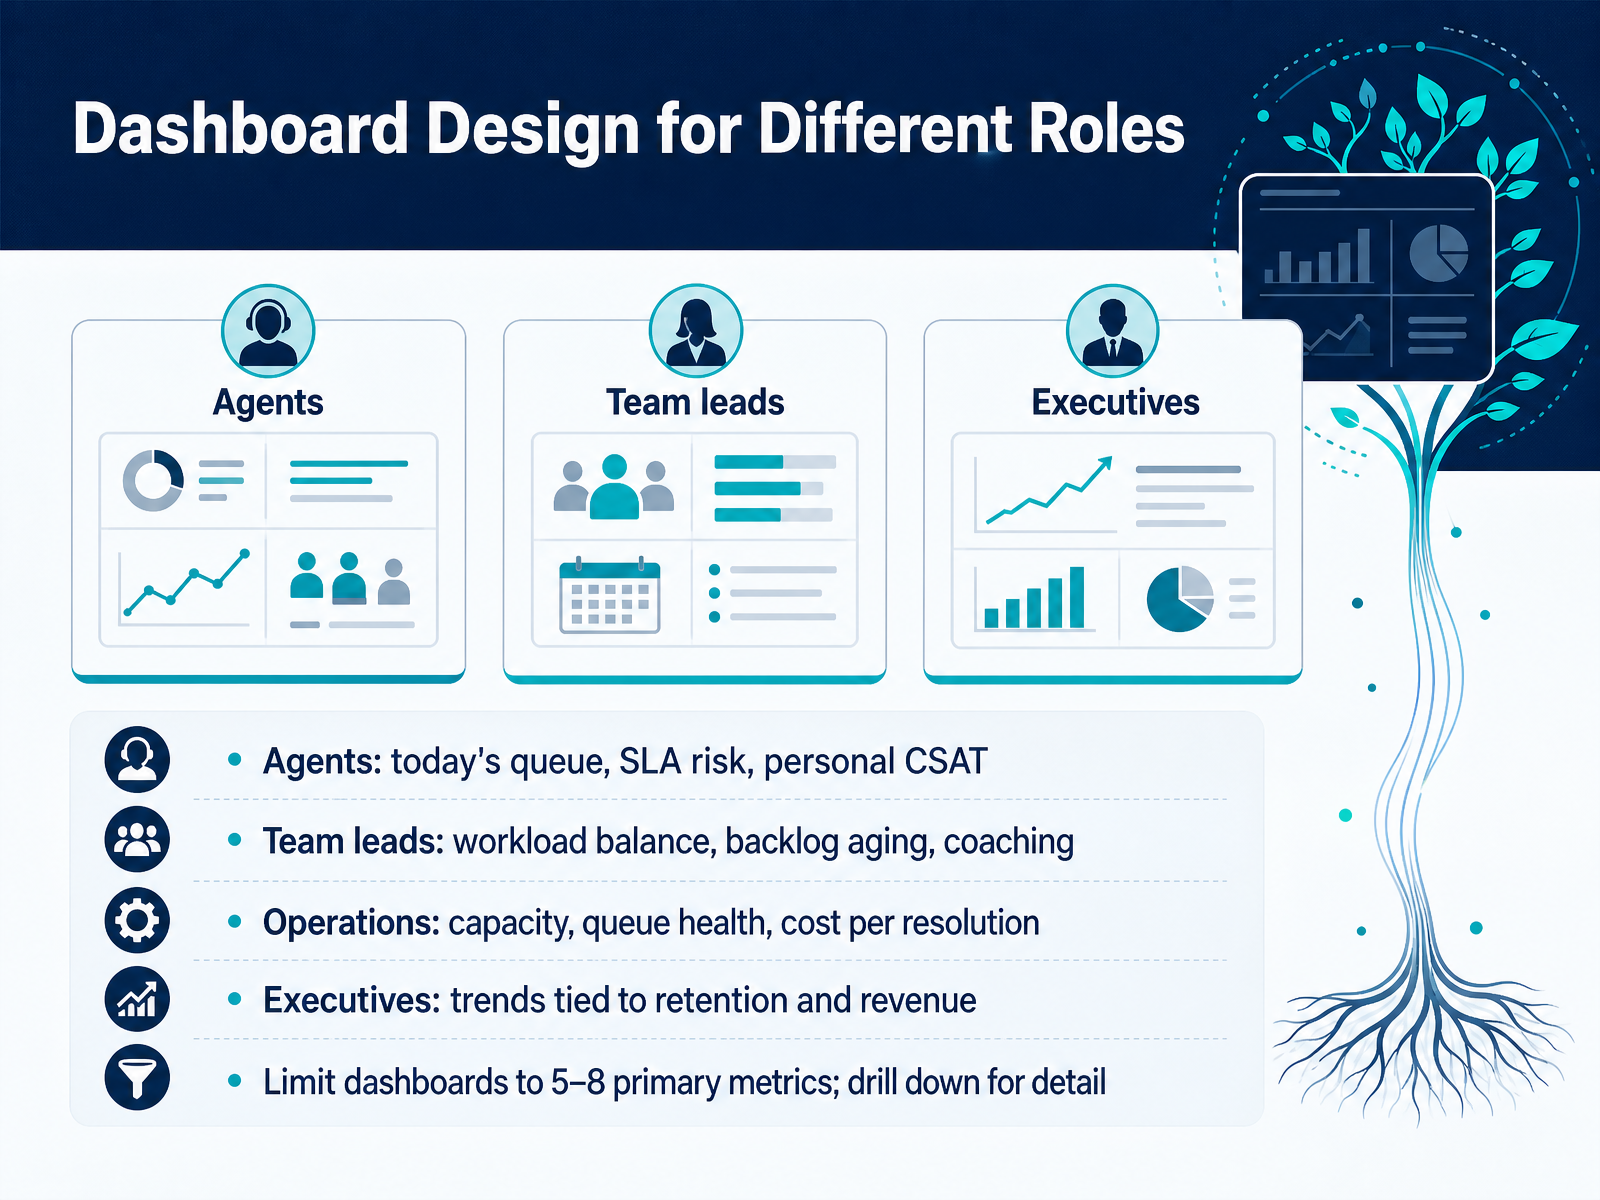
 - 11Dashboard Design for Different RolesSo we've talked about which metrics matter. Now let's talk about how to present them, because a dashboard isn't just a screen full of numbers. It's a decision-making tool, and it only works if it's built for the person looking at it. An agent on the front line needs a real-time view. Today's queue, which tickets are at SLA risk, and their personal CSAT scores. That's what tells them where to focus right now. A team lead needs a different lens. Workload balance across the team, how old the backlog is getting, and which agents need coaching today. Operations leaders look at capacity, queue health, and cost per resolution. And executives don't need that operational detail at all. They need trends tied to retention and revenue. The key principle? Limit every dashboard to five to eight primary metrics. Put the detail behind a drill-down. If every metric is equally prominent, nothing is. A focused dashboard gives each role a clear answer, and a clear next action. Next, we'll look at how leading and lagging indicators fit into this picture.
 2 min
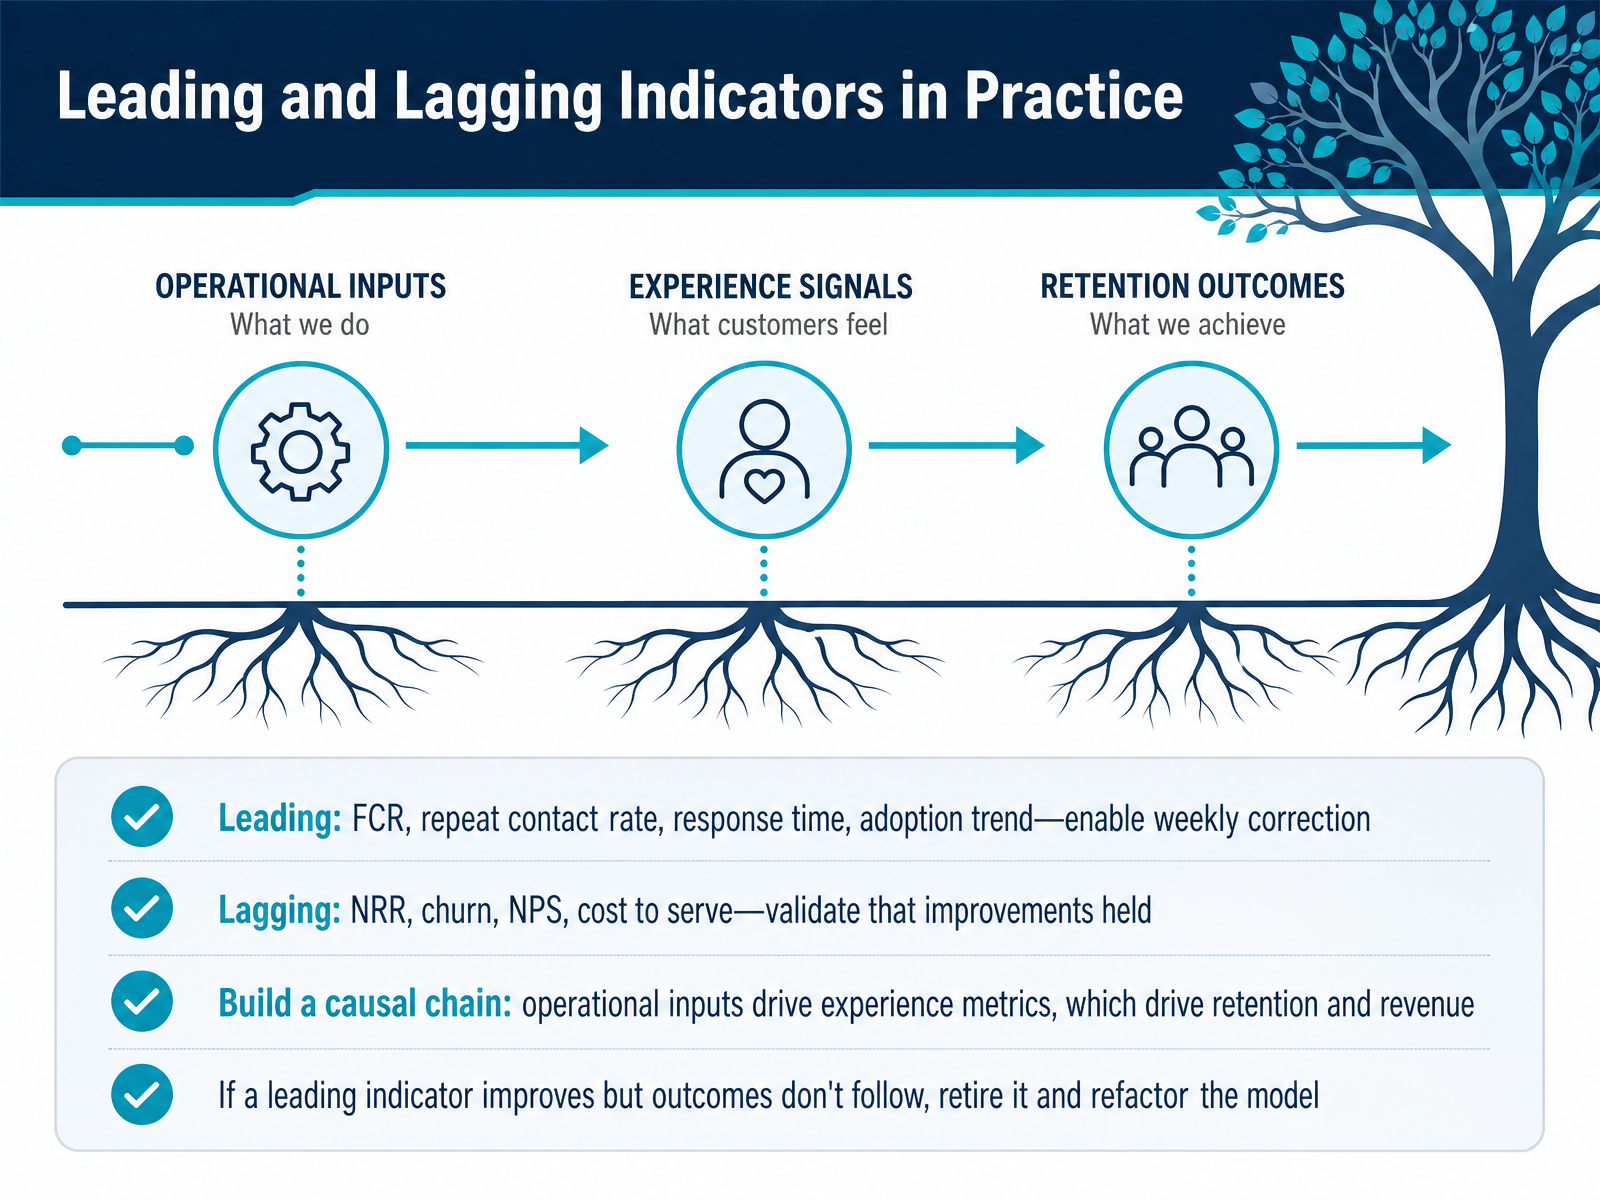
2 min - 12Leading and Lagging Indicators in PracticeLet's talk about how leading and lagging indicators work together in practice. Think of leading indicators like first contact resolution, repeat contact rate, response time, and adoption trends as your early warning system. They let you correct course on a weekly basis. Lagging indicators, like net revenue retention, churn, net promoter score, and cost to serve, are your proof. They confirm whether those improvements actually held up over time. The goal is to build a causal chain. Operational inputs drive experience metrics, which then drive retention and revenue. Here's the key discipline. If a leading indicator improves but the outcomes don't follow, something is wrong. Don't keep chasing it. Retire that metric and refactor your model. Find the driver that actually moves the needle for your customers. Now, let's look at common pitfalls and how to avoid them.
 bscdesigner.comasean-ssa.orgcallcentrehelper.com+21 min
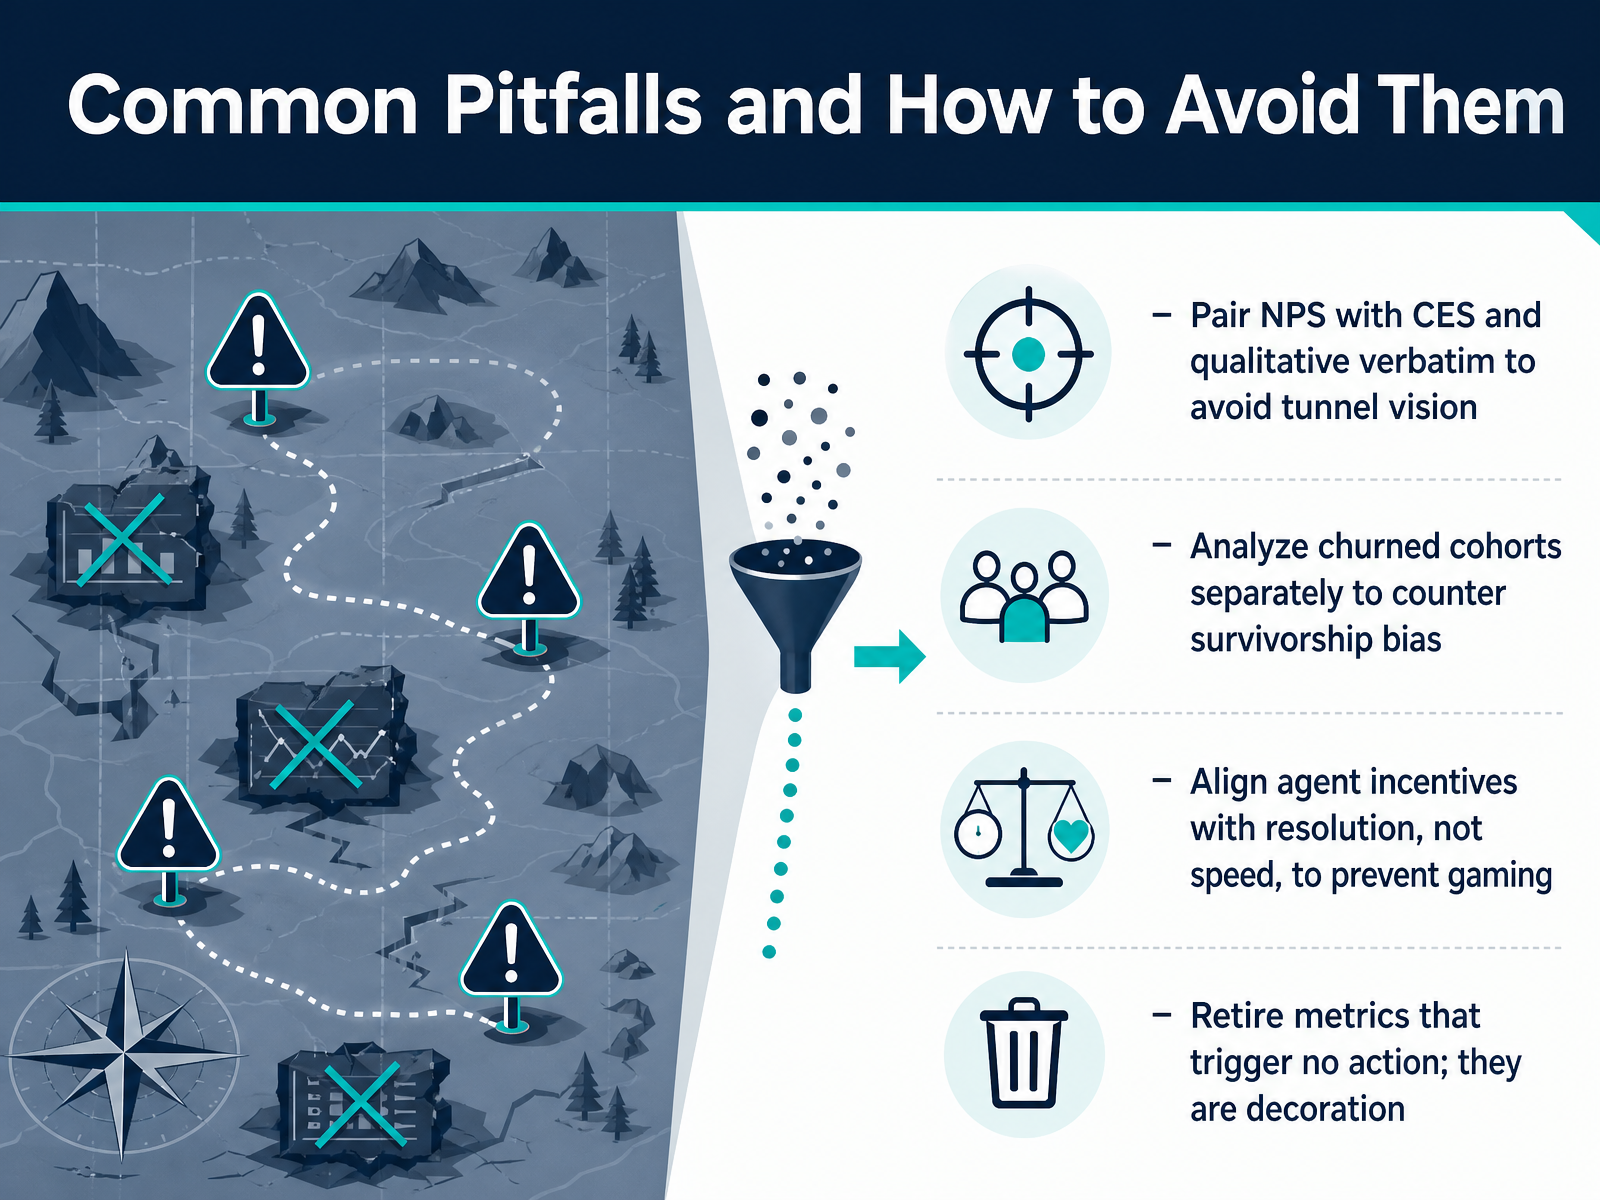
 - 13Common Pitfalls and How to Avoid ThemThe best metrics still fail when we misuse them. Let's walk through the four most common pitfalls and how to sidestep them. First, tunnel vision. If you track Net Promoter Score alone, you are reading a lagging indicator. A customer who has quietly decided to leave will still give you a polite seven or eight. Pair NPS with Customer Effort Score and read the open-text comments. That combination tells you not just that something is wrong, but exactly where the friction hides. Second, survivorship bias. If you only analyze active customers, you learn nothing from the ones who left. Pull your churned accounts into a separate cohort and study what broke before they exited. That review is your early warning system. Third, gaming. If you reward agents purely on speed, they will rush calls and leave customers dissatisfied. Tie incentives to resolution and quality. A solved problem on the first contact matters more than a fast, unresolved one. Finally, retire any metric that does not trigger an action. If a number sits on a dashboard with no owner and no decision attached, it is decoration. Cut it. Keep only what helps you decide. Let's move into structuring these into a practical action plan. We'll walk through your first ninety days next.
 tdcx.comgamedeveloper.comfreevirtualsolutions.com+22 min
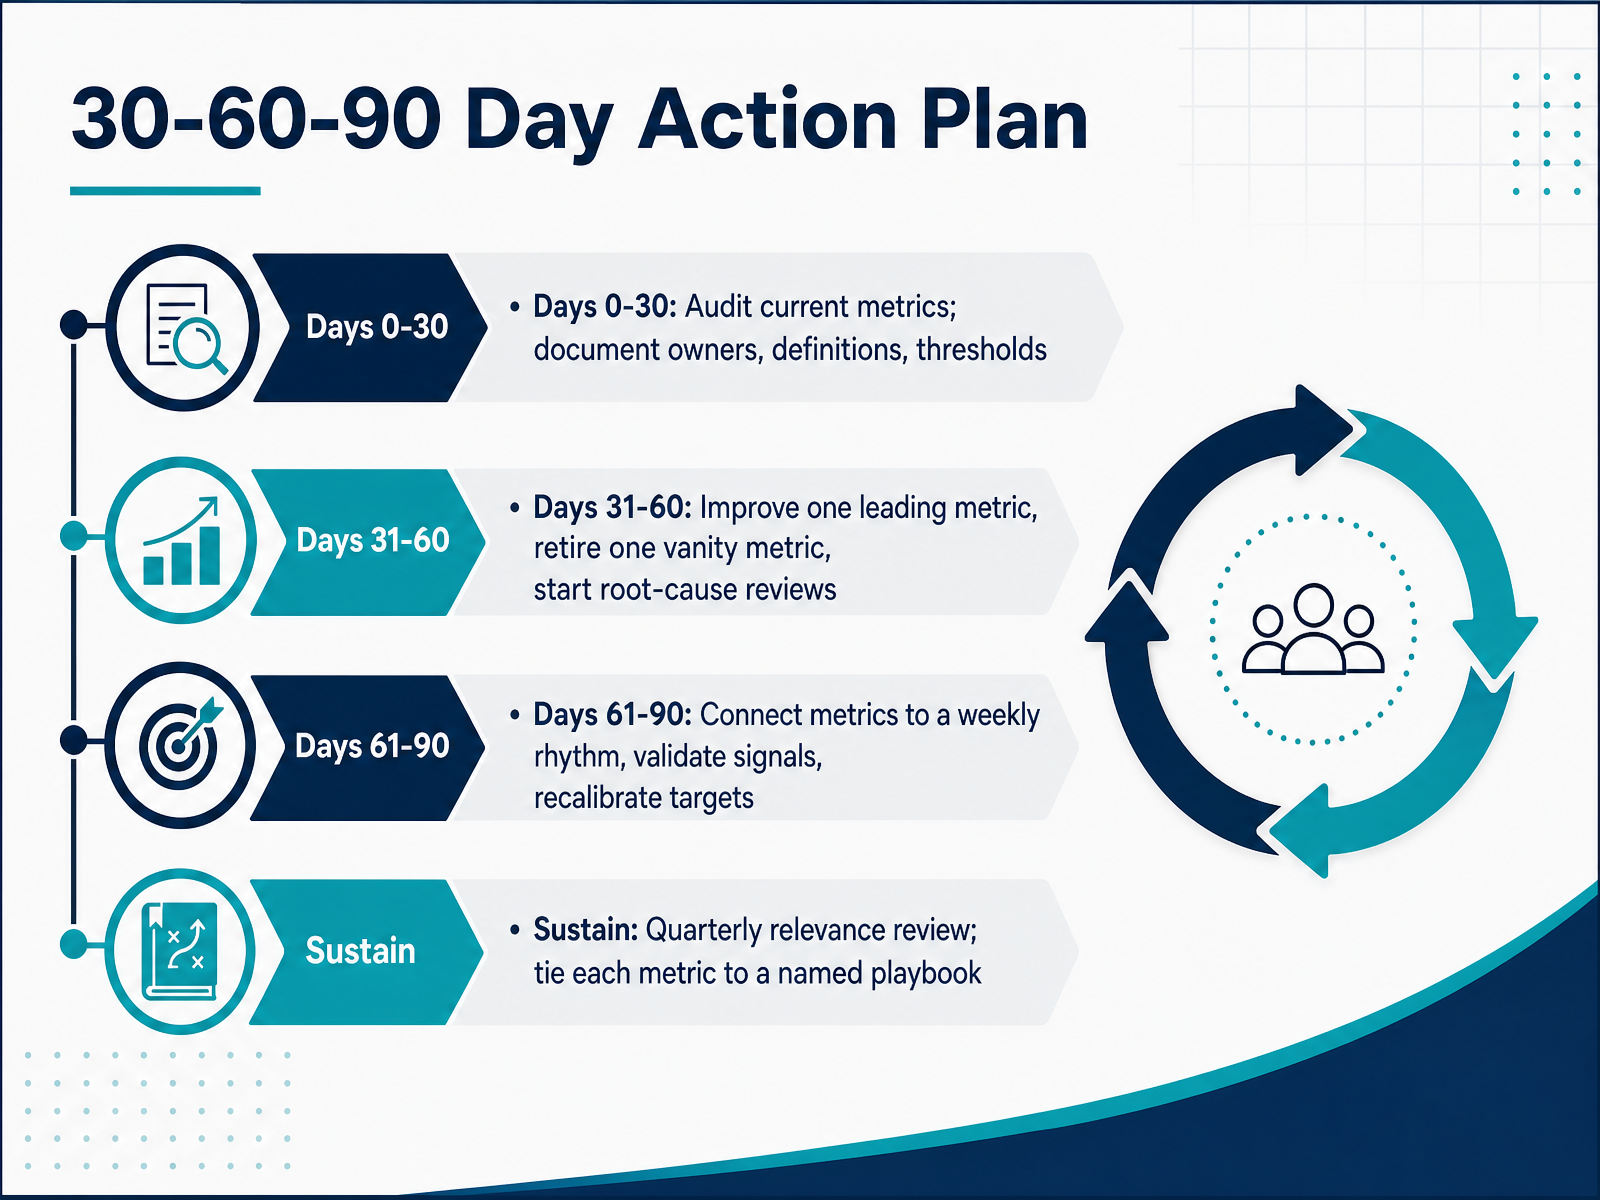
 - 1430-60-90 Day Action PlanSo here's how you turn everything we've covered into a practical plan. The first thirty days are about clarity. Audit every metric you currently track. Write down who owns it, how it's defined, and what number counts as good, warning, or unacceptable. No action yet. Just know what you're working with. In days thirty-one to sixty, make two changes. Improve one leading indicator, like first contact resolution, and retire one vanity metric that doesn't connect to a decision. This is also when you start root cause reviews, so you're asking why a number moved, not just tracking it. By days sixty-one to ninety, build the rhythm. Review a small set of metrics weekly, validate that the signals actually predict outcomes, and recalibrate targets based on what you've learned. Then, to sustain it all, review the whole set quarterly. Tie each metric to a named playbook, so when a number dips, you don't ask who's responsible, you ask which playbook we're running. That's how metrics become something you act on, not something you report on. Thank you for your attention, and remember, the goal isn't perfect numbers. It's a team that knows what to do next.
 bscdesigner.comasean-ssa.orgcallcentrehelper.com+22 min
Take the deck with you
Download this course as a file — free, no sign-up needed.
- PDF handoutEvery slide page, ready to print or share.15 pages · 3.7 MBDownload
- Narrated PowerPointThe deck that presents itself — every slide carries the digital human's narration video.15 pages · 14.5 MBDownload
- PowerPoint slidesThe full deck as a .pptx — open it in PowerPoint, Keynote, or Google Slides.15 pages · 3.6 MBDownload
Free to use in your own training — please keep the PersonWise credit page at the end.
Have your own deck? Turn it into a course
Sources consulted
Web sources consulted while building this course.
- Customer Service Metrics: 15 Key KPIs to Track in 2026 — groovehq.com
- KPIs in Customer Service: The Complete Guide for 2026 | AgentStack | Agent Stack — agentstack.build
- Customer Service Metrics: 12 KPIs That Matter and What They Miss | Blog | Perspective AI — getperspective.ai
- Customer Service Metrics That Actually Matter in 2026 (and the Vanity Ones to Drop) | CorePiper — corepiper.com
- Customer Service Metrics That Actually Matter in 2026 - Lorikeet — lorikeetcx.ai
- AI-Ready Data Intelligence Levels Up a Gaming Company’s Global Player Support — tdcx.com
- Here's what happened when Rovio integrated AI into its customer service pipeline — gamedeveloper.com
- Why Player Support Decides Who Wins – freevirtualsolutions.com — freevirtualsolutions.com
- The Hidden Cost Of Poor Player Support In Gaming — helpshift.com
- Activision leveled up its customer service to reduce related expenses by 25% a year. - Salesforce.com — salesforce.com
- Voice of Customer Metrics in 2026: The Numbers That Actually Predict Retention | Blog | Perspective AI — getperspective.ai
- CSAT NPS CES Benchmarks for SaaS Support 2026 | HappySupport — happysupport.ai
- Customer Effort Score (CES): Why It Predicts Churn Better Than CSAT — qiscus.com
- What Is Customer Effort Score? The Complete 2026 Guide | Resonate CX — resonate.cx
- Combine CX metrics to prove impact and build a business case - SmartSurvey — smartsurvey.com
- Example of Customer Service Balanced Scorecard with KPIs — bscdesigner.com
- Strategic Delivery of Service Excellence: The Balanced Scorecard Approach — asean-ssa.org
- How to Create a Customer Balanced Scorecard – with Template and Examples — callcentrehelper.com
- Customer Support Strategy Map | KPI Depot — kpidepot.com
- Tailoring a Balanced Scorecard for your Customer Service ... - Kana — yumpu.com