Ecommerce Conversion Rate Optimization Strategies
Begin
14 pages · ~28 min
Ecommerce Conversion Rate Optimization Strategies
Learn to plan and execute effective ecommerce conversion rate optimization strategies to boost sales and improve customer experience.
What you’ll learn
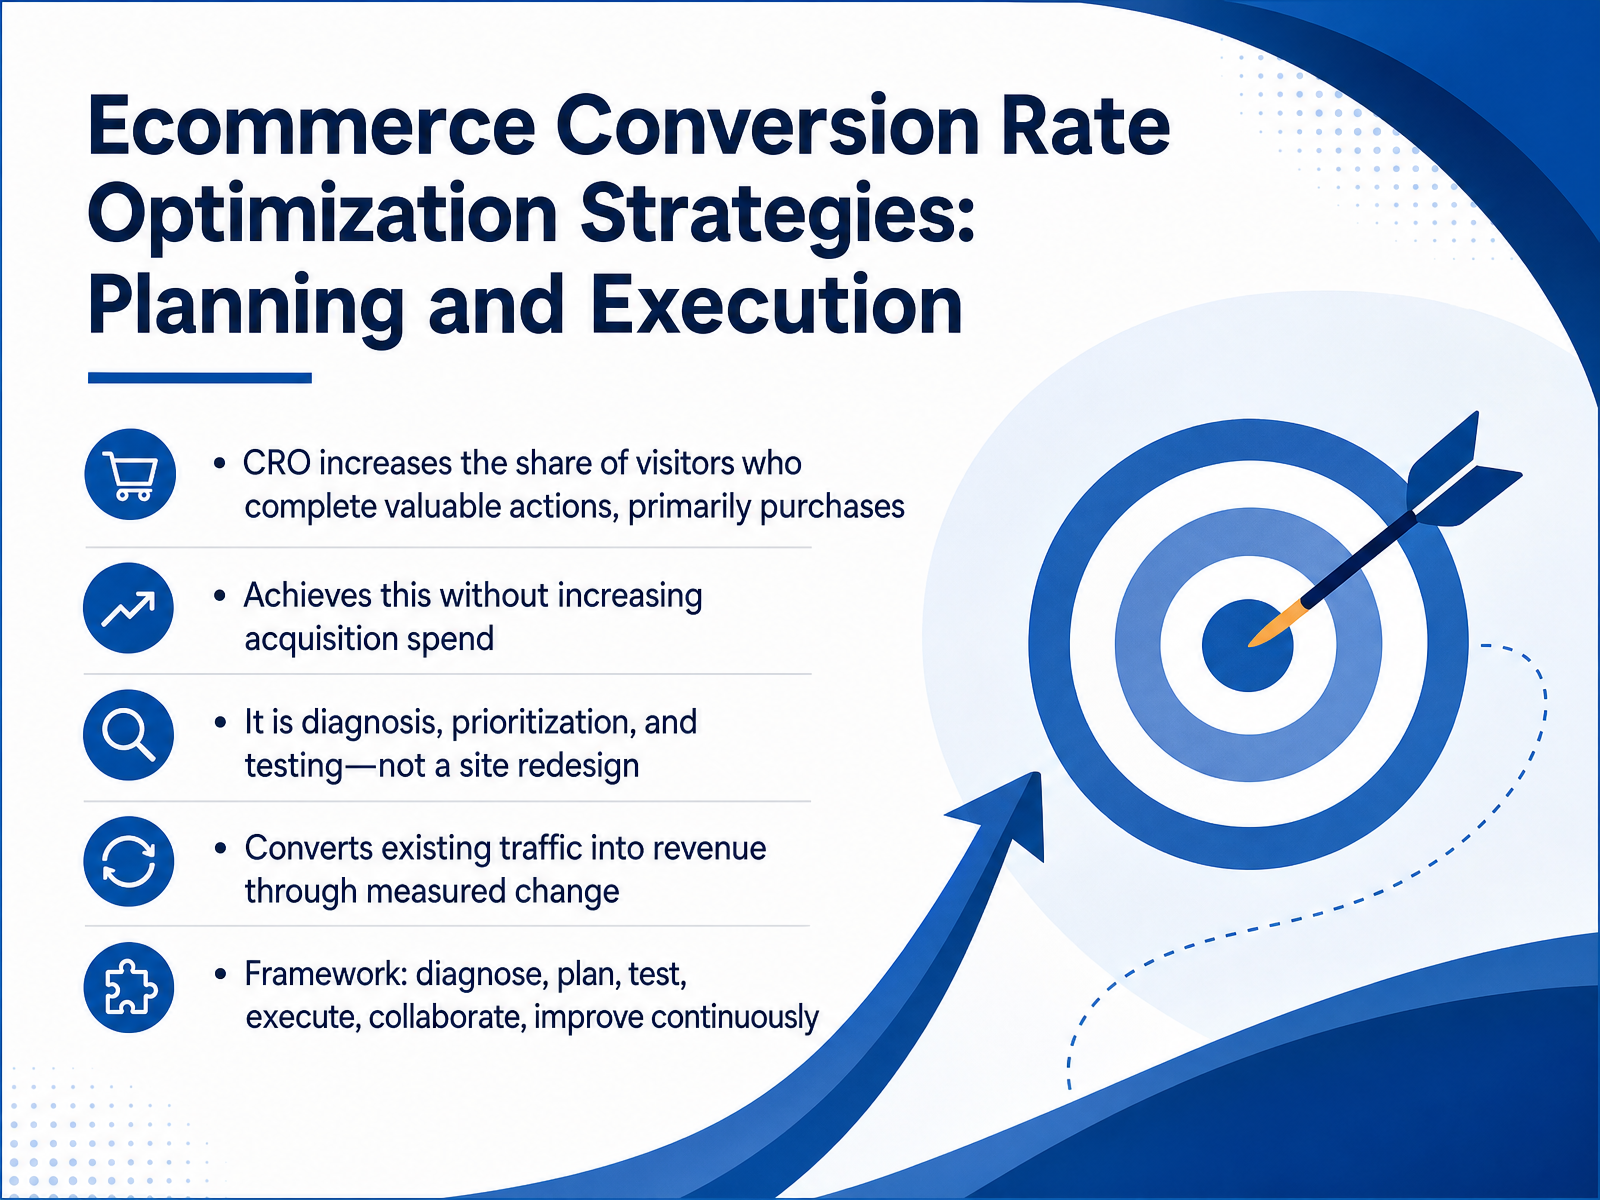
- 01Ecommerce Conversion Rate Optimization Strategies: Planning and ExecutionWelcome. In this course, we are going to work through a practical system for ecommerce conversion rate optimization. The goal is not to add more traffic or spend more on acquisition. The goal is to turn a higher share of the visitors you already have into customers. Every step we cover will tie back to measurable revenue impact. We will treat CRO as a disciplined process of diagnosis, prioritization, and testing. This is not a site redesign project. It is a method for finding where your funnel is leaking revenue and then fixing those leaks with evidence. The framework we will use is straightforward: diagnose your current performance, plan the highest-value tests, run them with proper controls, execute the winners, and collaborate across your team to keep improving. Once this loop is running, conversion optimization becomes a repeatable engine for growth, not a one-off project. By the end of this course, you and your team will have a clear operational plan for running CRO as a continuous system. We will start by defining the core metrics that tell you where the money is going.business.adobe.comeseospace.comshopify.com+21 min
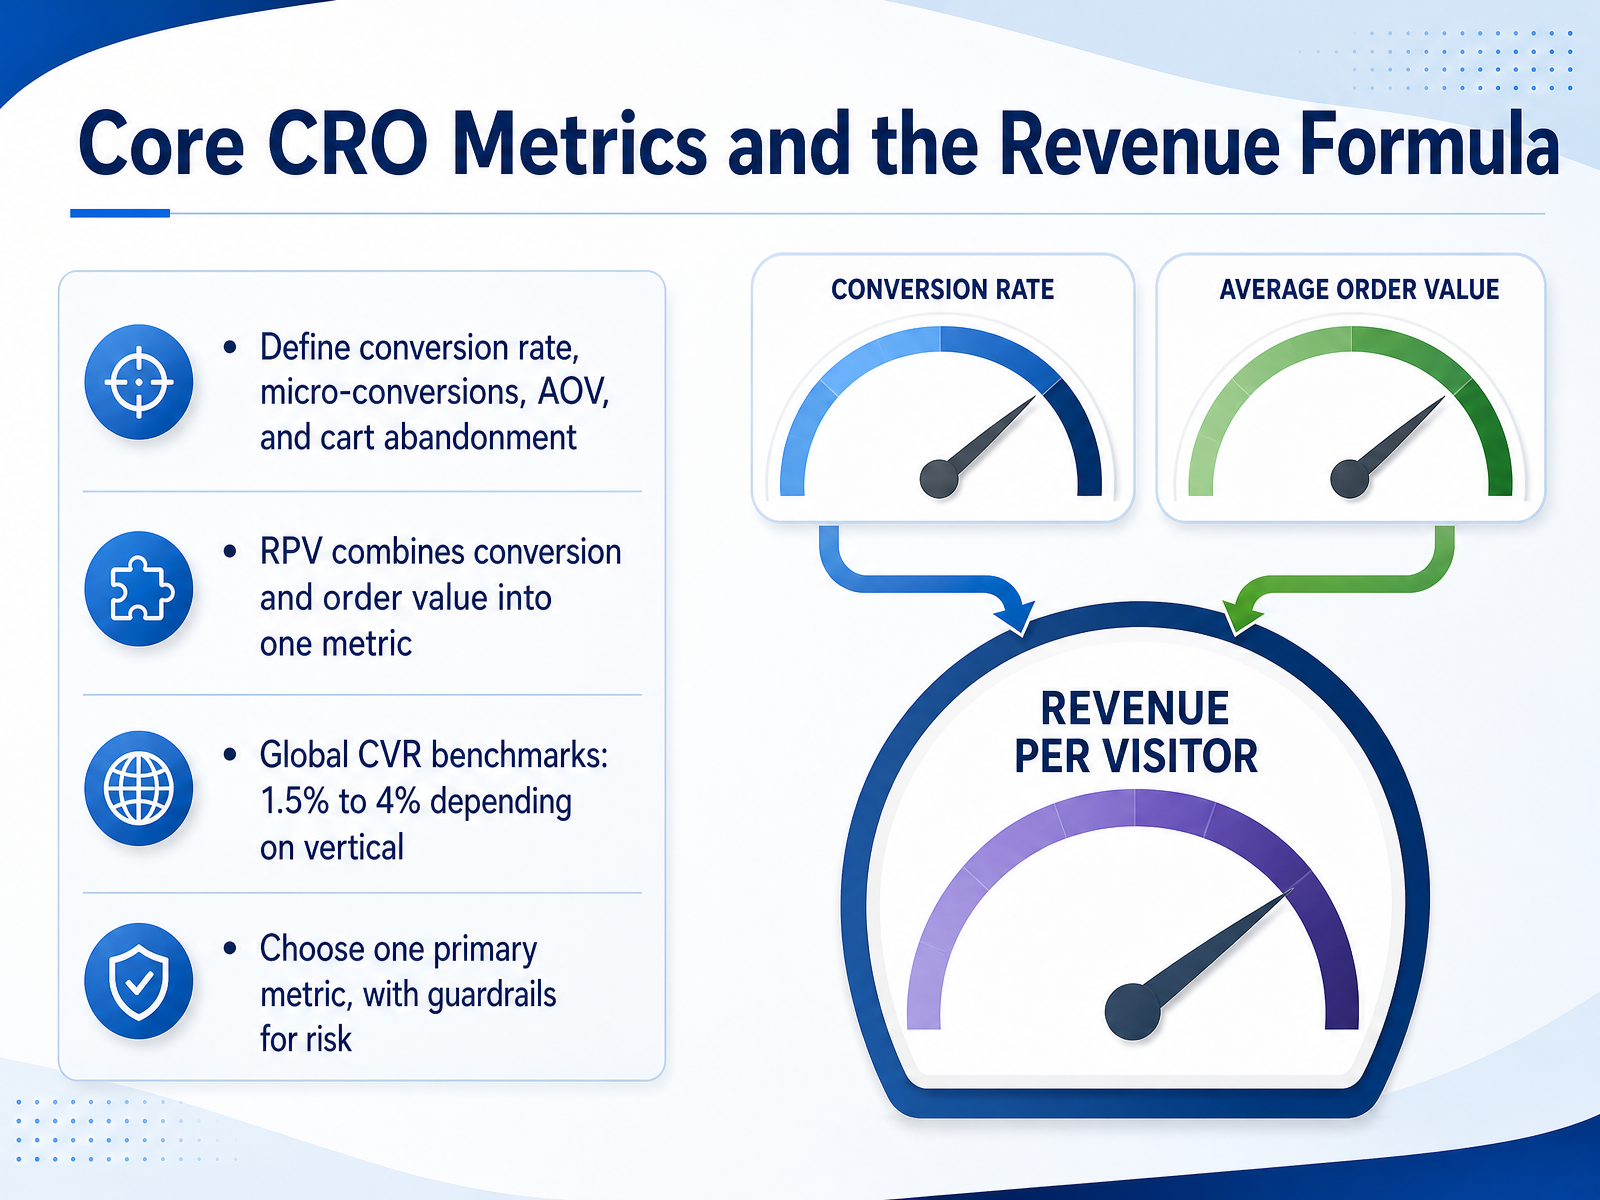
- 02Core CRO Metrics and the Revenue FormulaBefore you touch a single page, your team needs to agree on how you measure success. Start with the core metrics. Conversion rate is your baseline, but it is not the whole story. Micro-conversions, like add-to-carts or email signups, tell you where users are getting stuck before the final purchase. Average order value shows how much revenue each transaction brings, and cart abandonment is often the biggest leak in your funnel. The real number to focus on is Revenue Per Visitor. It multiplies conversion rate by average order value, so you see the actual value of your traffic. A three percent conversion rate on a one hundred and fifty dollar order is very different from a three percent rate on a fifteen dollar order. Global benchmarks vary by vertical, usually between one and a half and four percent, but do not chase a generic number. Choose one primary metric, like Revenue Per Visitor, and set guardrails so a test that lifts conversion but kills order value does not slip through. Next, we will diagnose where your data actually points to problems.
 owlclaw.comtriplewhale.comsmartinsights.com+21 min
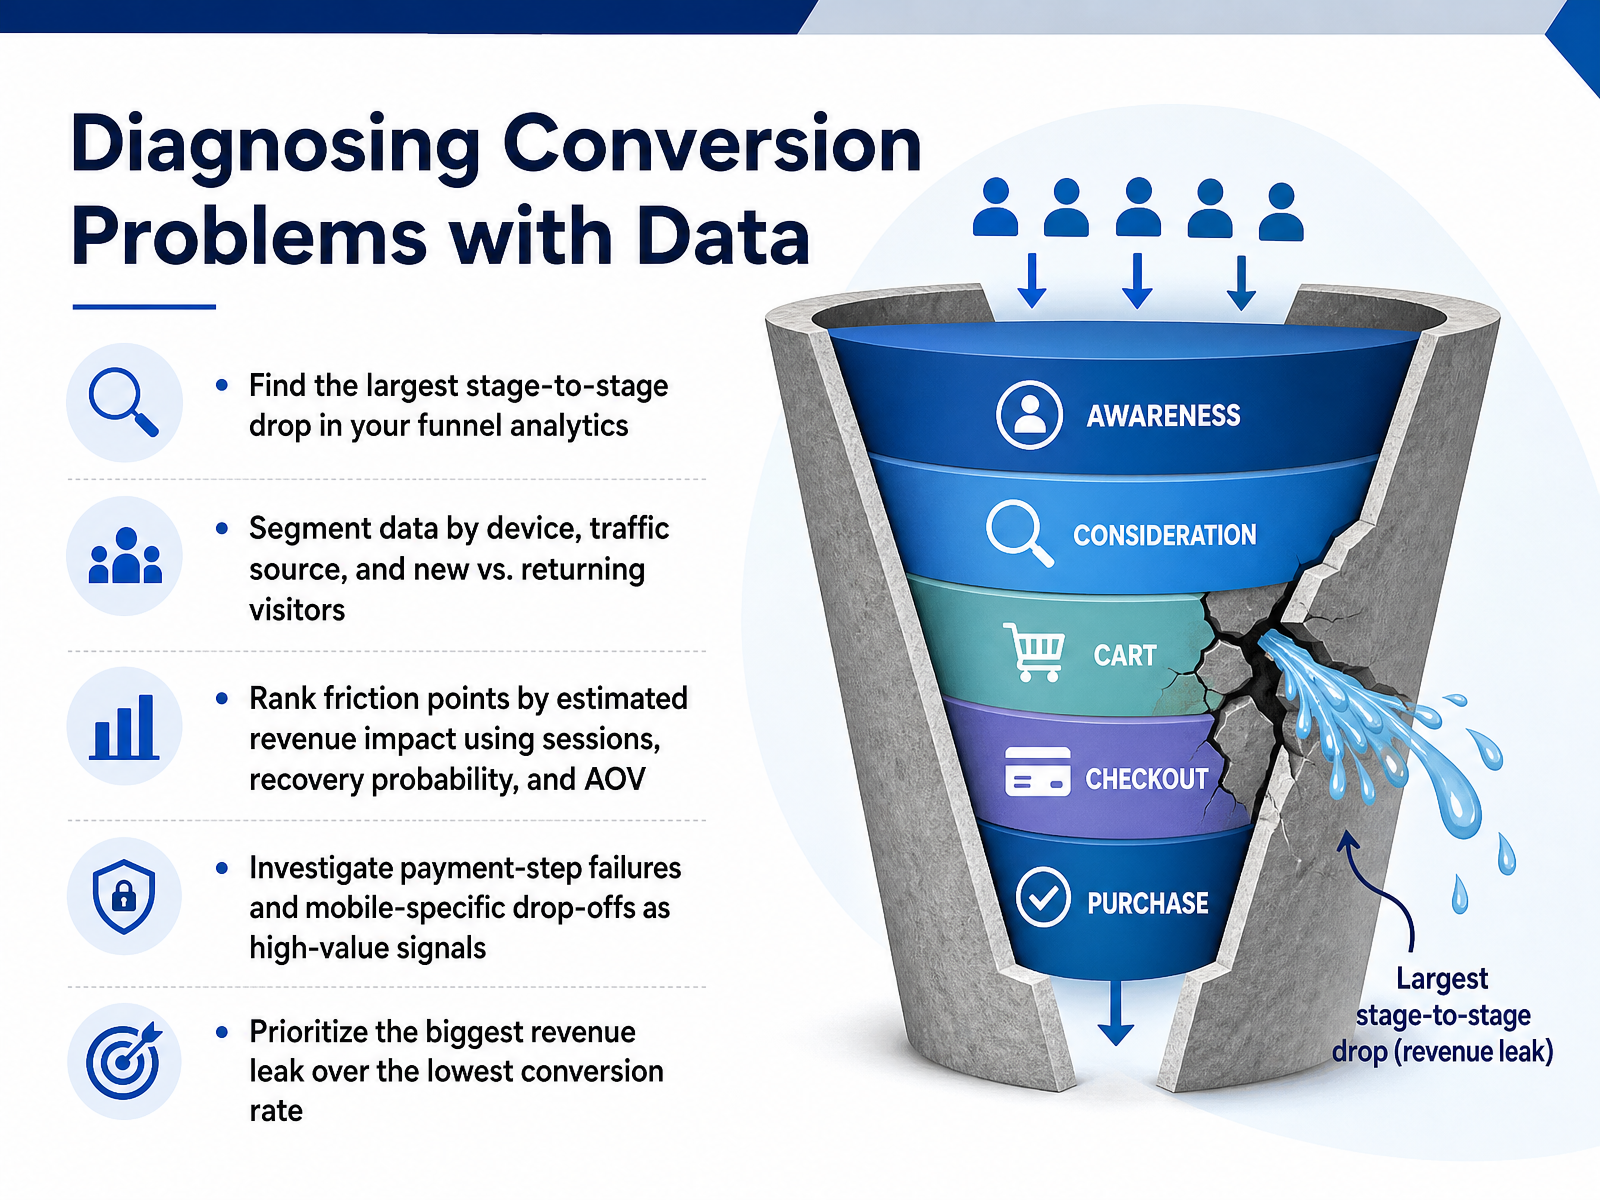
 - 03Diagnosing Conversion Problems with DataNow we get to the core diagnostic work. Start by pulling your funnel analytics for the last 90 days and find the largest stage-to-stage drop. That biggest absolute drop is your first candidate, not just the lowest conversion rate. Then segment immediately. You want to see the same funnel cut by device, by traffic source, and by new versus returning visitors. The mobile paid social segment is almost always hiding your worst leak. Once you have your candidates, rank them by estimated revenue impact. Multiply affected sessions by a realistic recovery rate, then by your average order value. That gives you a dollar number that ends the argument about what to fix first. And pay special attention to two signal types. Payment-step failures are invisible in normal analytics because the user never reaches the thank you page. And mobile-specific drop-offs are usually a different root cause than desktop. A silent payment error affecting a few thousand sessions a month can easily be worth over one hundred thousand dollars annually. So prioritize the biggest revenue leak, not the most obvious or easiest to fix. Next, we will layer in the qualitative tools to understand why that leak is happening.
 metricuno.combtng.studiobaymard.com+21 min
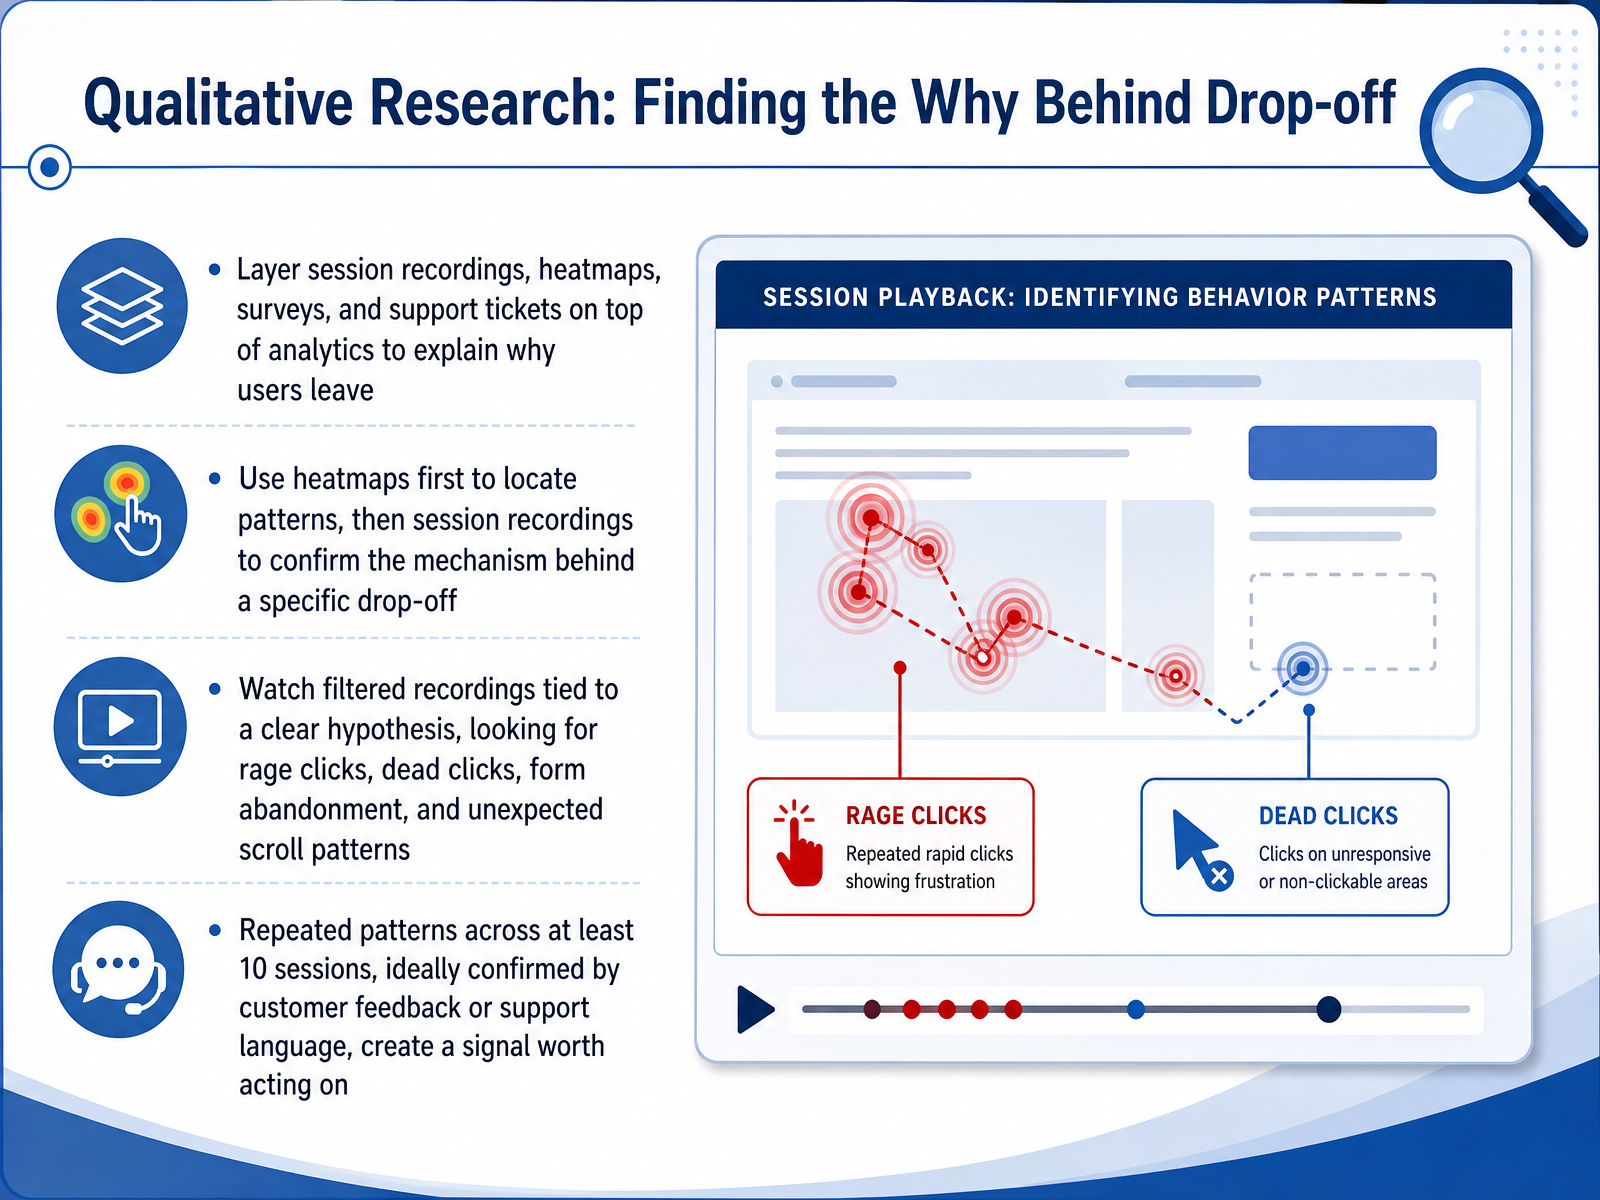
 - 04Qualitative Research: Finding the Why Behind Drop-offNow the real diagnostic work begins. Analytics told you where people leave, but only qualitative research explains the why. You need to layer session recordings, heatmaps, surveys, and even support tickets on top of your funnel data to understand what is actually happening. Start with heatmaps. They are your fastest way to spot patterns at scale. Look for cold zones where attention dies, scroll depth drop offs, or clicks on elements that are not clickable. Once you see a pattern, use session recordings to confirm the mechanism. Do not watch random sessions. Filter tightly to a specific drop off point or a clear frustration signal. Watch for rage clicks, dead clicks, form abandonment, and unexpected scroll behavior. If the same friction appears across at least ten sessions, and it is echoed in customer feedback or support language, you have a signal worth acting on. That is how you move from guessing to testing. Next, we will turn that diagnosis into a testable hypothesis.
 metricuno.combtng.studiobaymard.com+22 min
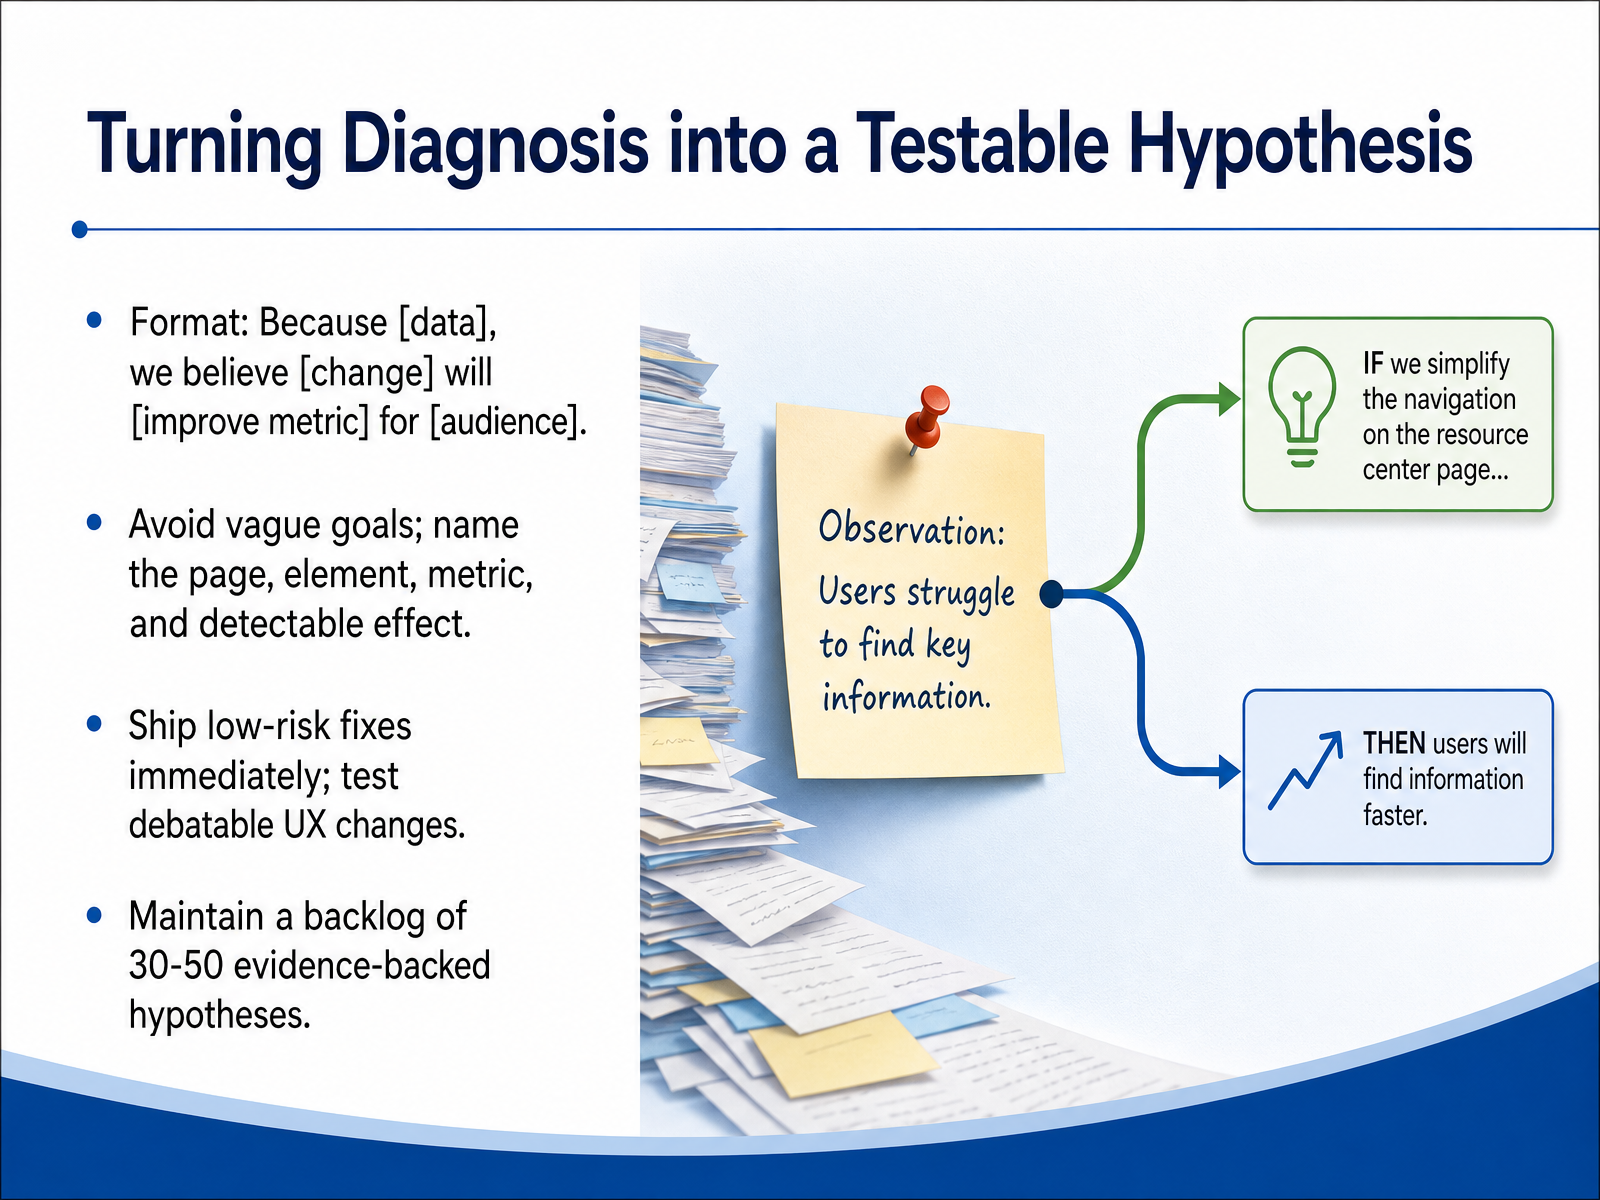
 - 05Turning Diagnosis into a Testable HypothesisSo you've found a real leak. Before you fix anything, you need to turn that diagnosis into a testable hypothesis, or you're just guessing with extra steps. Use this format: Because we saw this specific data, we believe this specific change will improve this specific metric for this specific audience. Vague goals don't work. Saying we want to improve the product page is useless. You need to name the exact page, the exact element, the metric, and the detectable effect you expect to see. Now, not every fix needs a full test. If the diagnosis is unambiguous, like a broken payment button or a missing trust badge, ship it immediately. Reserve A B tests for debatable UX changes where your intuition has about a fifty percent chance of being wrong. To keep the program moving, maintain a living backlog of thirty to fifty evidence-backed hypotheses. This ensures you never face a blank page at the start of a sprint. Next, we’ll look at building a CRO roadmap and prioritizing those tests.
 metricuno.comacceleroi.commetricuno.com+21 min
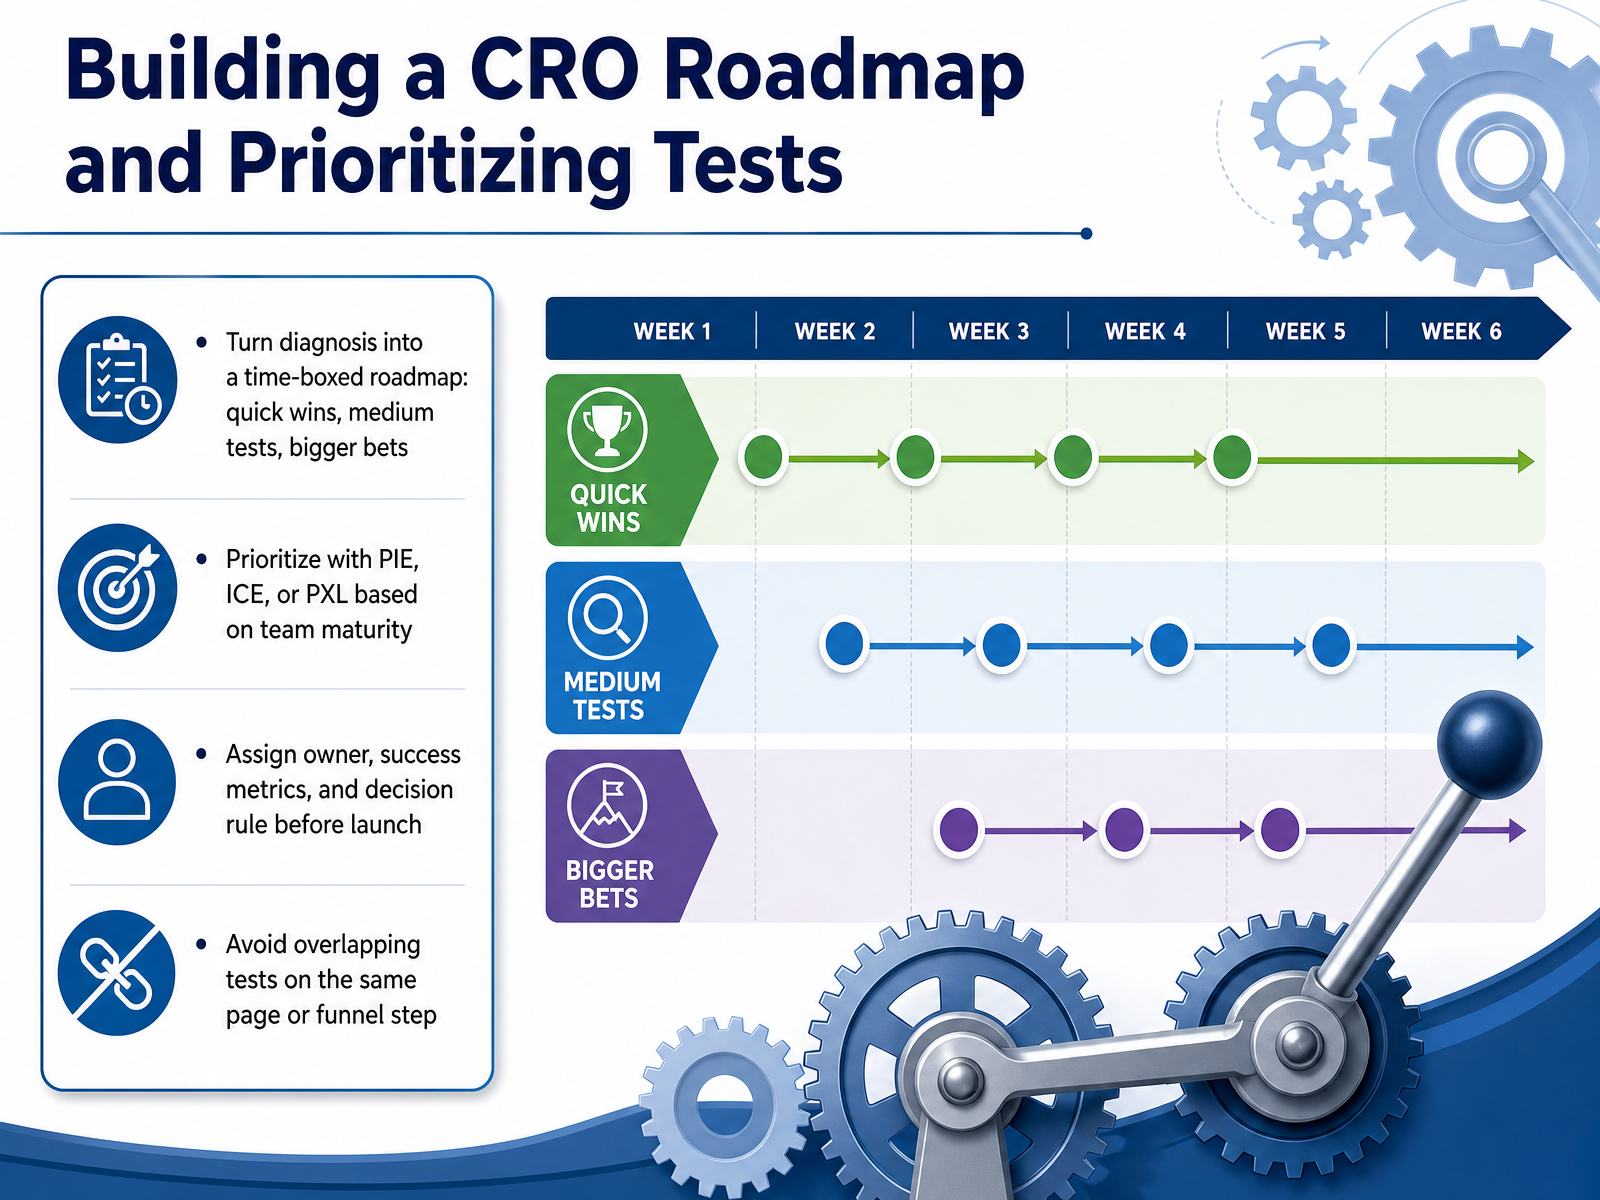
 - 06Building a CRO Roadmap and Prioritizing TestsNow let's turn that diagnosis into a working plan. The goal here is a time-boxed roadmap with three levels of effort. First, quick wins: low-risk, high-confidence changes you can ship and measure fast. Second, medium tests that build on those early learnings. Third, bigger bets that need more design or development work but can unlock meaningful lifts. For prioritization, keep it simple. If you're a newer team, use ICE: Impact, Confidence, and Ease. If you have solid traffic data, PIE, which factors in page importance, works well. For a more rigorous, evidence-based approach, use PXL. The important thing is to pick one and use it consistently. Before any test goes live, assign an owner, define the primary success metric, and write down your decision rule. That means you agree in advance what result ships, what result kills the test, and what result means you iterate. Finally, avoid overlapping tests on the same page or funnel step. Otherwise you contaminate the data and learn nothing. Up next, let's look at the specific high-impact ecommerce pages and test areas where these experiments actually move revenue.
 metricuno.comacceleroi.commetricuno.com+21 min
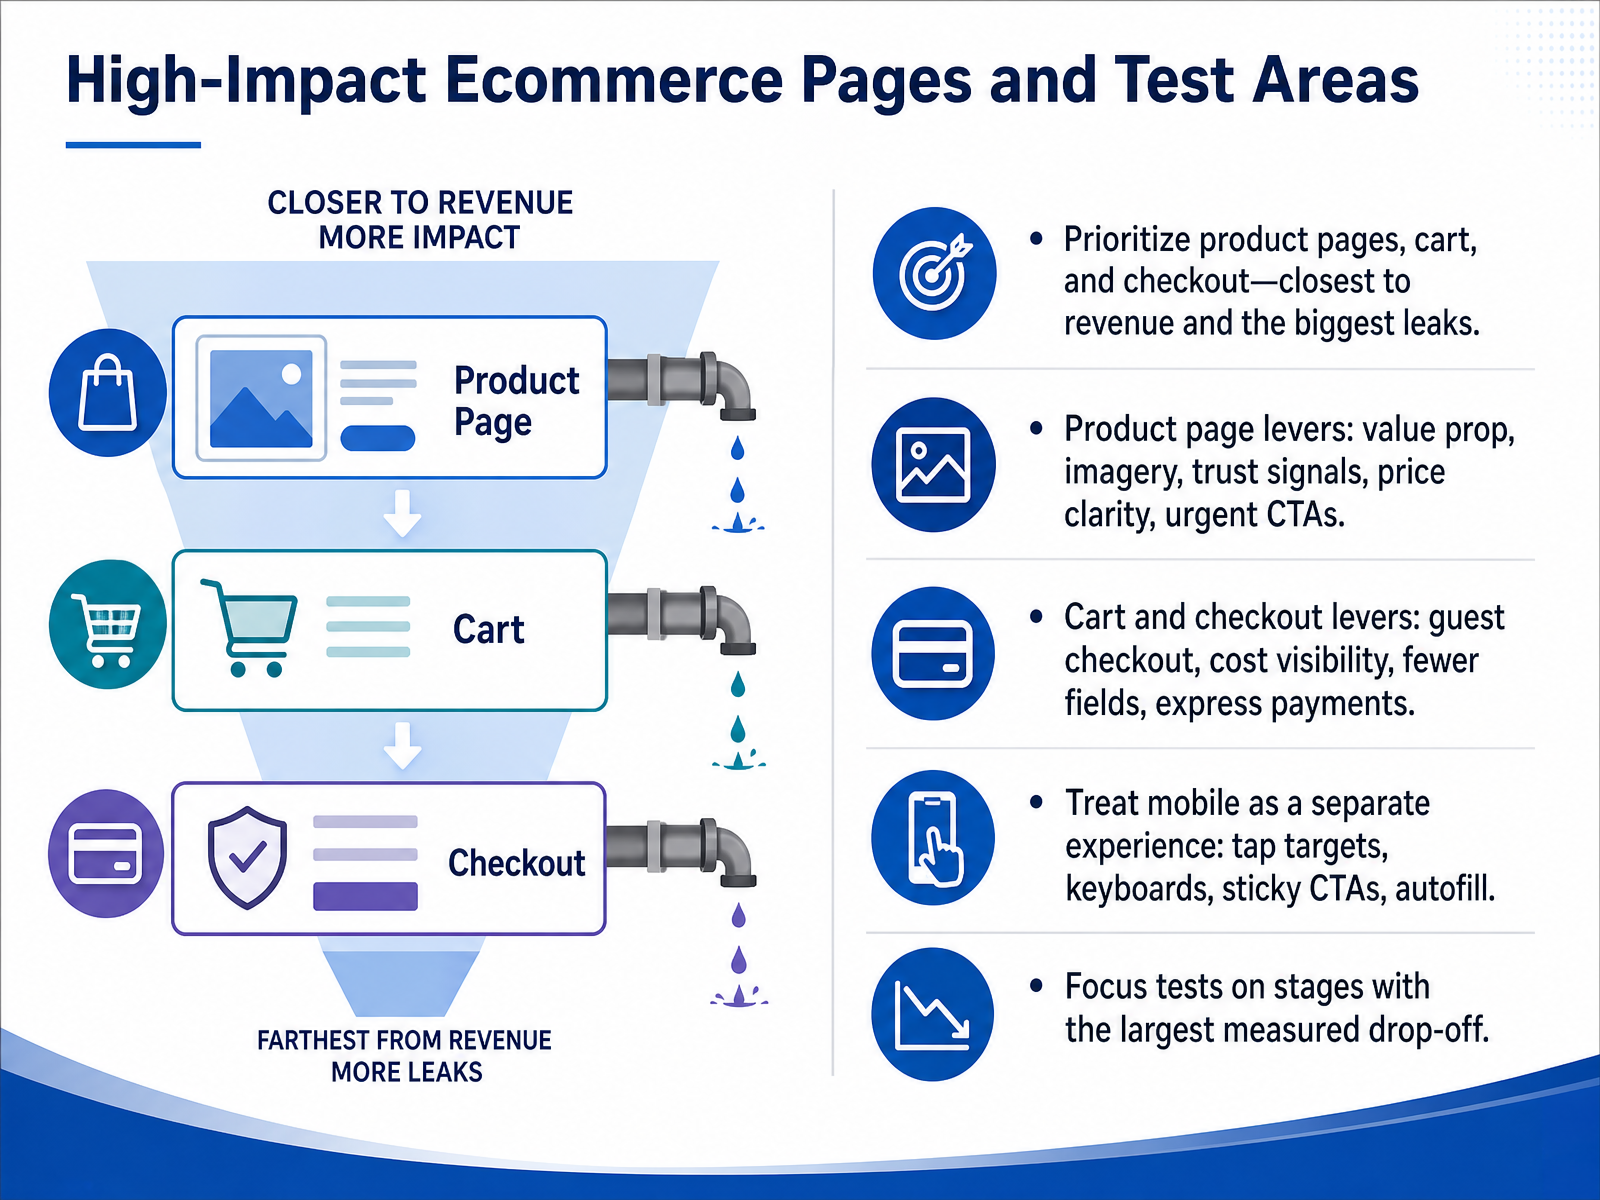
 - 07High-Impact Ecommerce Pages and Test AreasNow let's talk about where to focus your testing energy. Not all pages are created equal. Your product pages, cart, and checkout are the closest to revenue, and that's where the biggest leaks happen. Think of it this way: a five percent improvement on checkout usually beats a twenty percent improvement on a little-visited content page. On product pages, test the levers that drive confidence. That means your value proposition, the imagery, trust signals like reviews, price clarity, and the urgency of your call to action. For cart and checkout, the priorities are straightforward. Offer guest checkout, show all costs upfront, cut unnecessary form fields, and enable express payment methods like Apple Pay or Shop Pay. Now, treat mobile as its own experience. The data is clear that mobile conversion trails desktop significantly, and the fixes are specific. Check your tap targets, keyboard types, sticky call-to-action buttons, and autofill. Finally, focus your tests on the stages with the largest measured drop-off in your own funnel. Don't guess where the problem is. Let the data point you to it. That discipline sets up our next topic perfectly, because now we need to dig into the specific mobile barriers that cause those drop-offs.
 business.adobe.comeseospace.comshopify.com+21 min
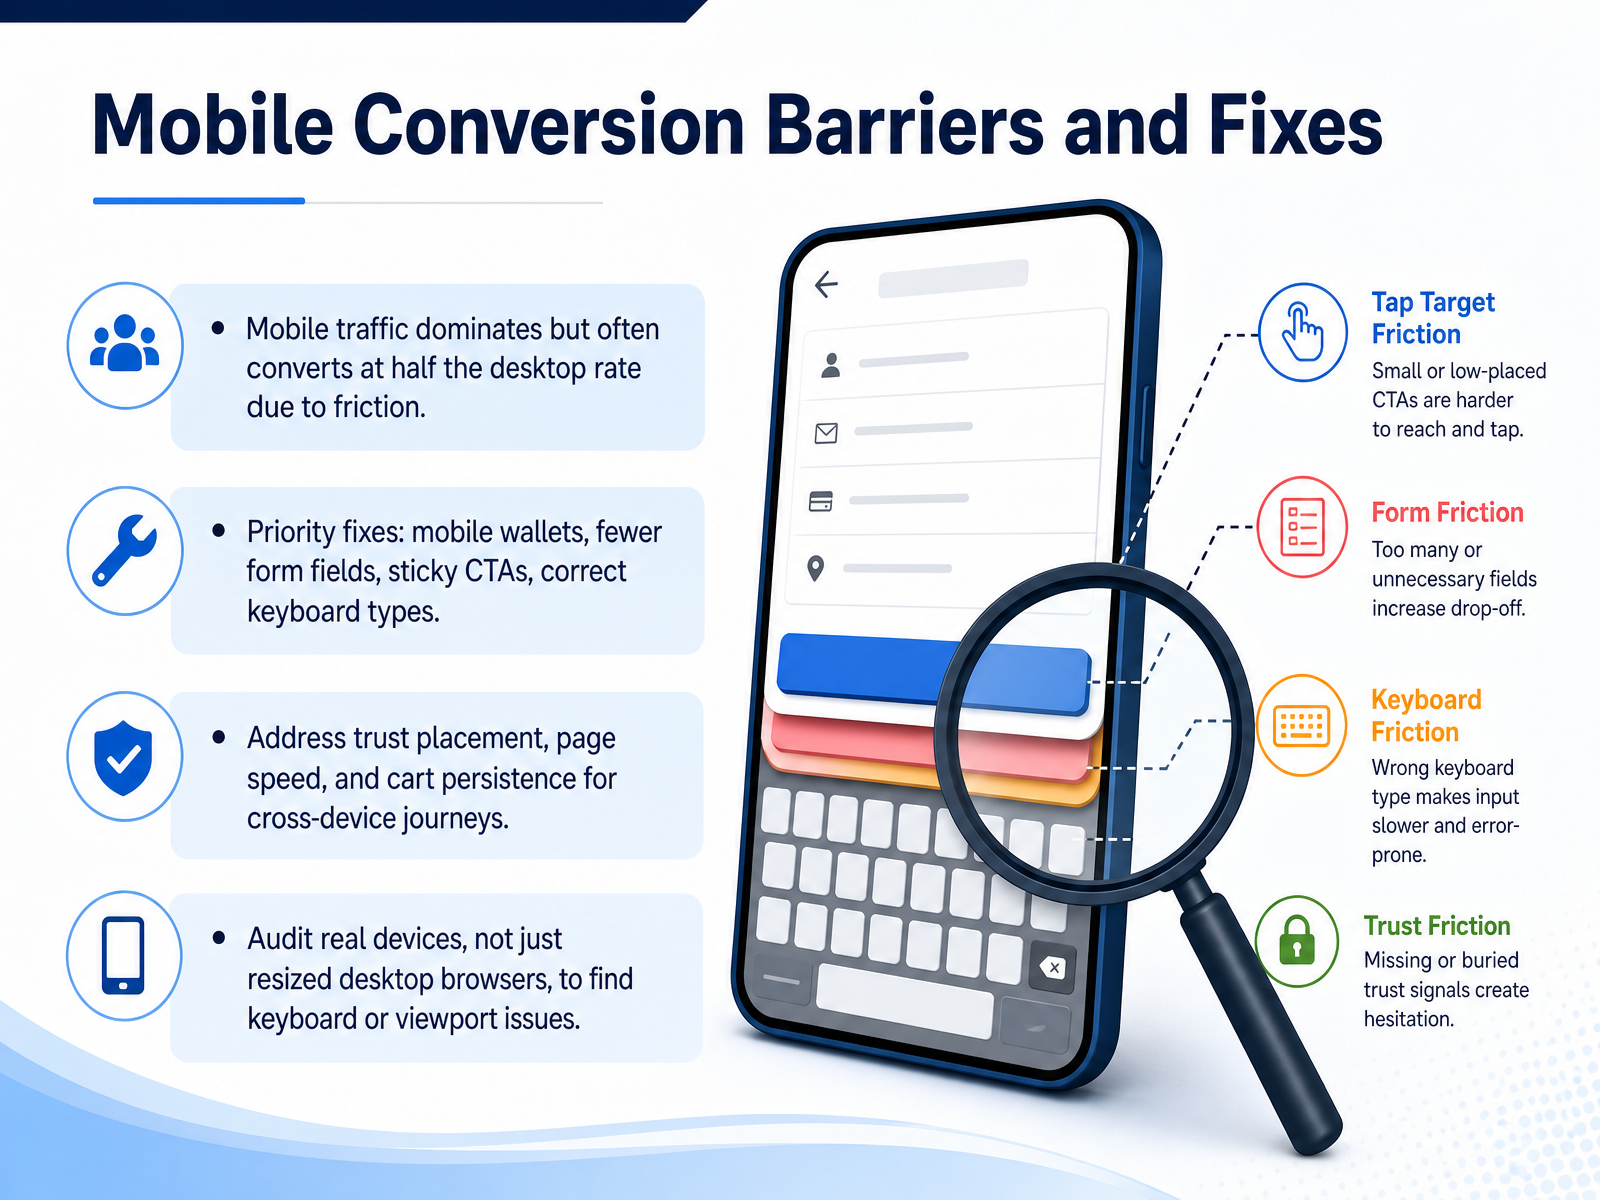
 - 08Mobile Conversion Barriers and FixesLet's get specific about mobile. You likely see most of your traffic on phones, but the conversion rate is often half of what you see on desktop. The good news is this gap is almost entirely friction, not intent. The highest impact fix is to lead with mobile wallets like Apple Pay, Google Pay, and Shop Pay. These can more than double your conversion compared to manual card entry. Next, cut your form down to only the essential fields. Each field you remove can reduce abandonment by five to ten percent. Make your primary call to action sticky at the bottom of the screen, and verify each input triggers the right keyboard, like a numeric pad for card details. Don't bury trust signals below the fold; place a security cue right above the pay button. Also, ensure carts persist across devices, since a large portion of shoppers start on mobile but finish on desktop. Finally, audit on real phones, not a resized desktop browser, to catch issues with keyboards and viewports. Once you've identified these fixes, the next step is validating them. Let's look at practical A and B testing and experiment design.
 business.adobe.comeseospace.comshopify.com+21 min
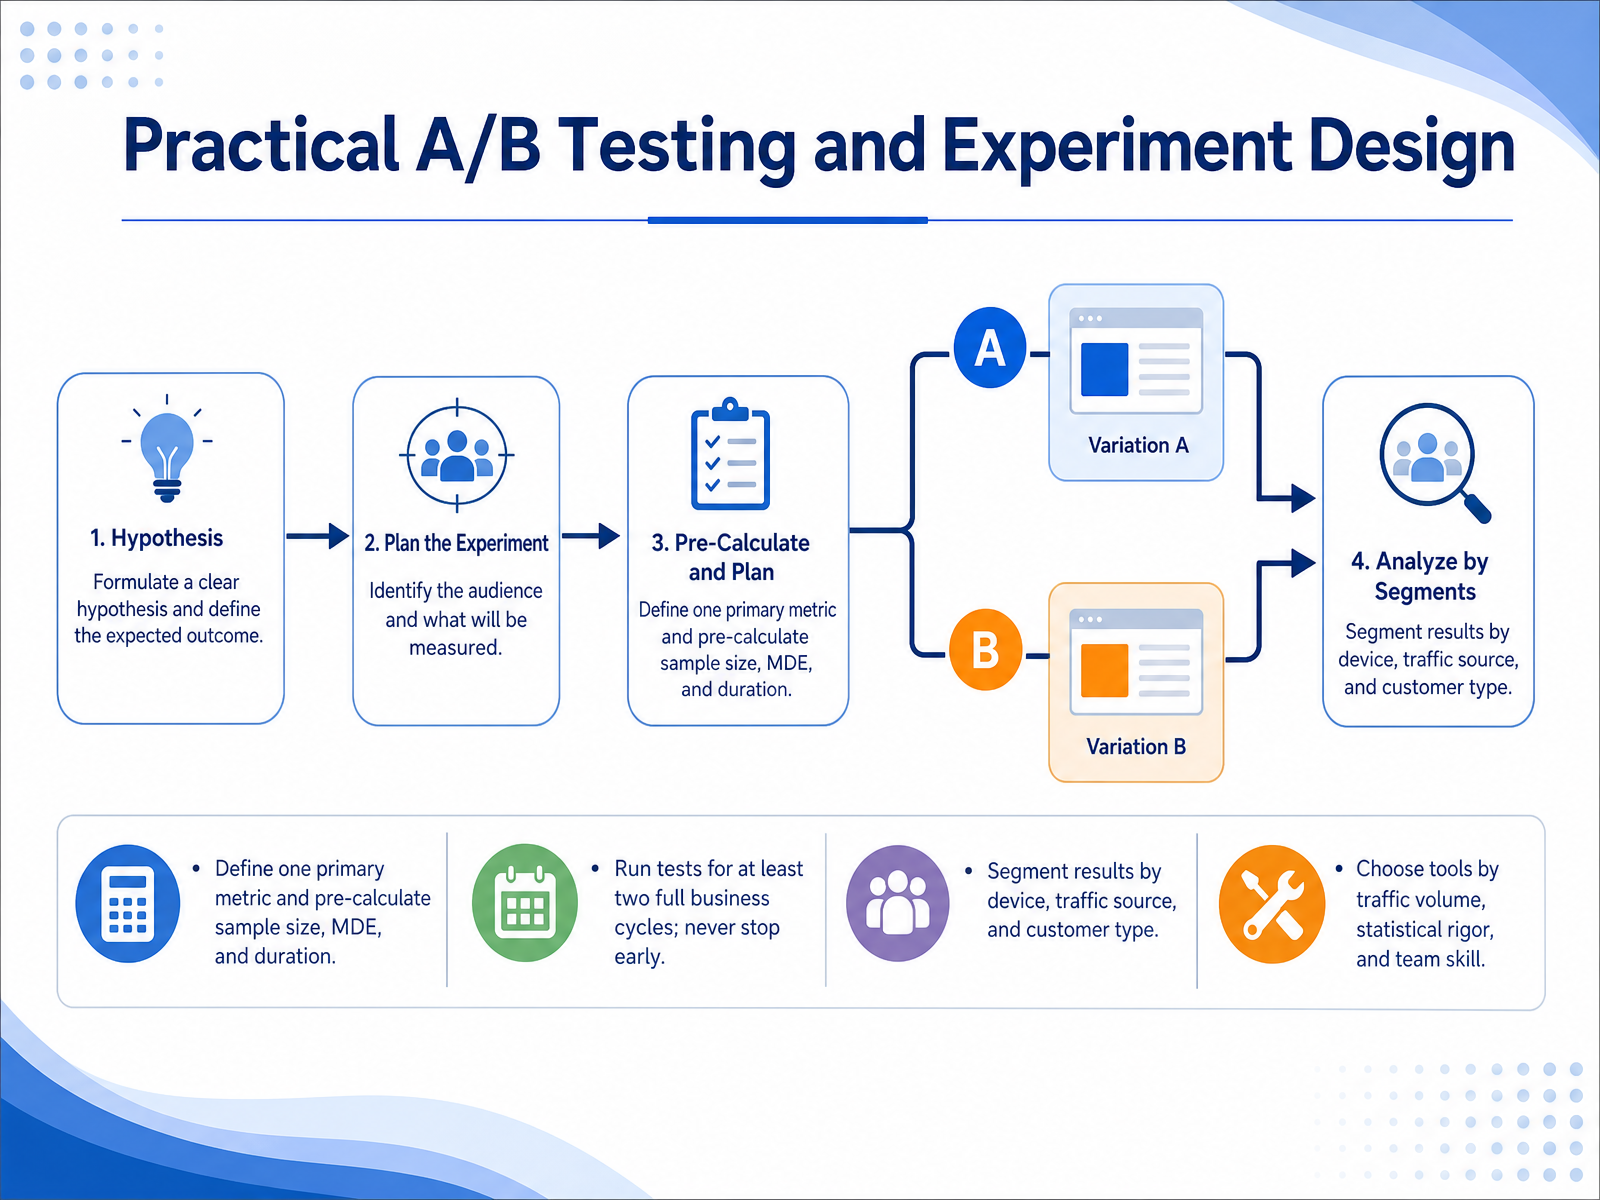
 - 09Practical A/B Testing and Experiment DesignPractical testing is where the program either earns its credibility or loses it quietly. Start with discipline, not ambition. Define one primary metric before launch. Then calculate your sample size, your minimum detectable effect, and your expected duration. If the math says a test will take eight weeks on your current traffic, you are not testing a hypothesis; you are delaying a decision. Run the test for at least two full business cycles. Never stop early because the dashboard flickered green on day three. Early peaks usually regress. When you have a result, segment it. A test can win overall but lose on mobile or with paid traffic. Device, source, and customer type each tell a different part of the story. Finally, choose your tool based on traffic volume, statistical rigor, and your team's actual skill level, not the logo on the vendor's website. A low-traffic store needs Bayesian or sequential testing, not an enterprise platform built for millions of sessions per month. That discipline carries directly into our next topic, running CRO when traffic is genuinely limited.
 metricuno.comacceleroi.commetricuno.com+22 min
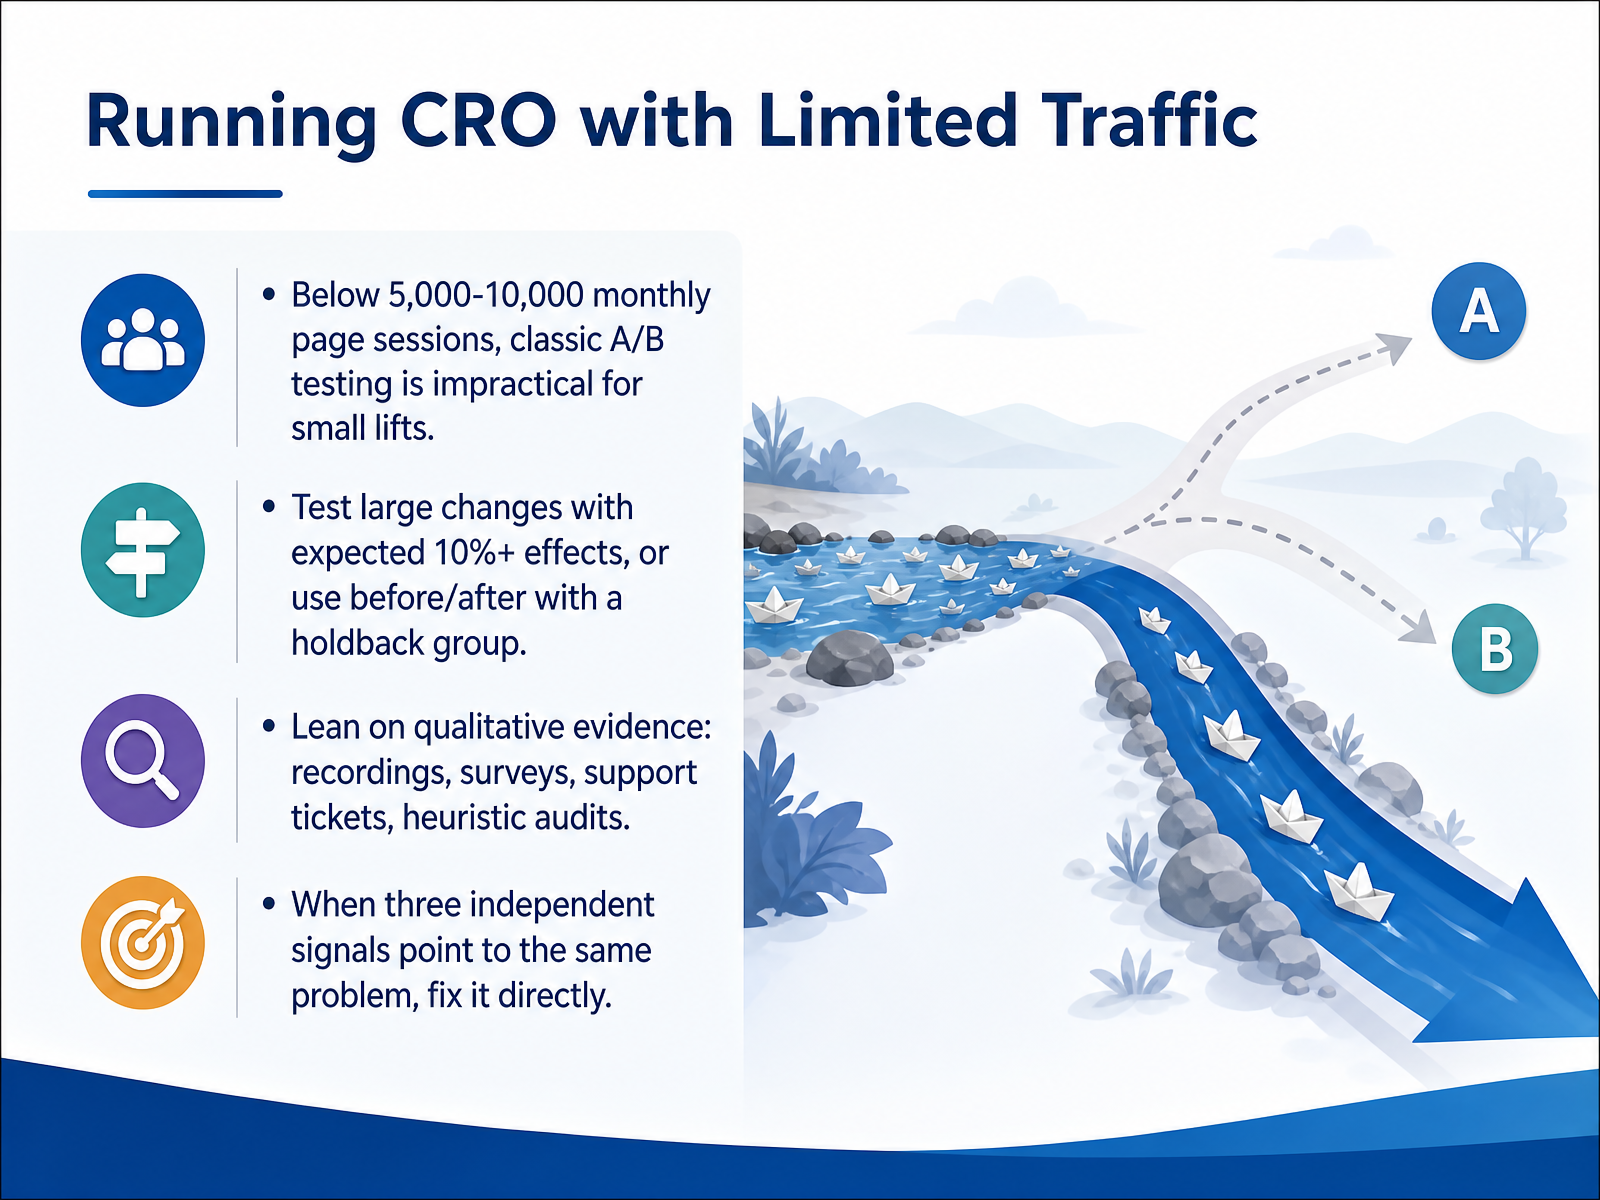
 - 10Running CRO with Limited TrafficHere's the reality when traffic is thin. If your store sees fewer than around five to ten thousand monthly sessions, classic A B testing for small gains just isn't practical. The math will not support it. So your method has to change. First, only test big swings. Look for changes with an expected effect of ten percent or more. Think new offers, pricing structures, or removing major checkout friction. Not button colors. If that still feels too heavy, use a before and after approach with a small holdback group. Expose most of your traffic to the change and keep a small slice untouched as your control. Second, lean hard into qualitative evidence. Watch session recordings. Read surveys and support tickets. Run a heuristic audit. When three independent signals point to the same problem, that is a pattern. Fix it directly. You don't need a p value to ship an obvious fix. With that mindset in place, let's move into execution, implementation, and cross team collaboration.
 metricuno.combtng.studiobaymard.com+22 min
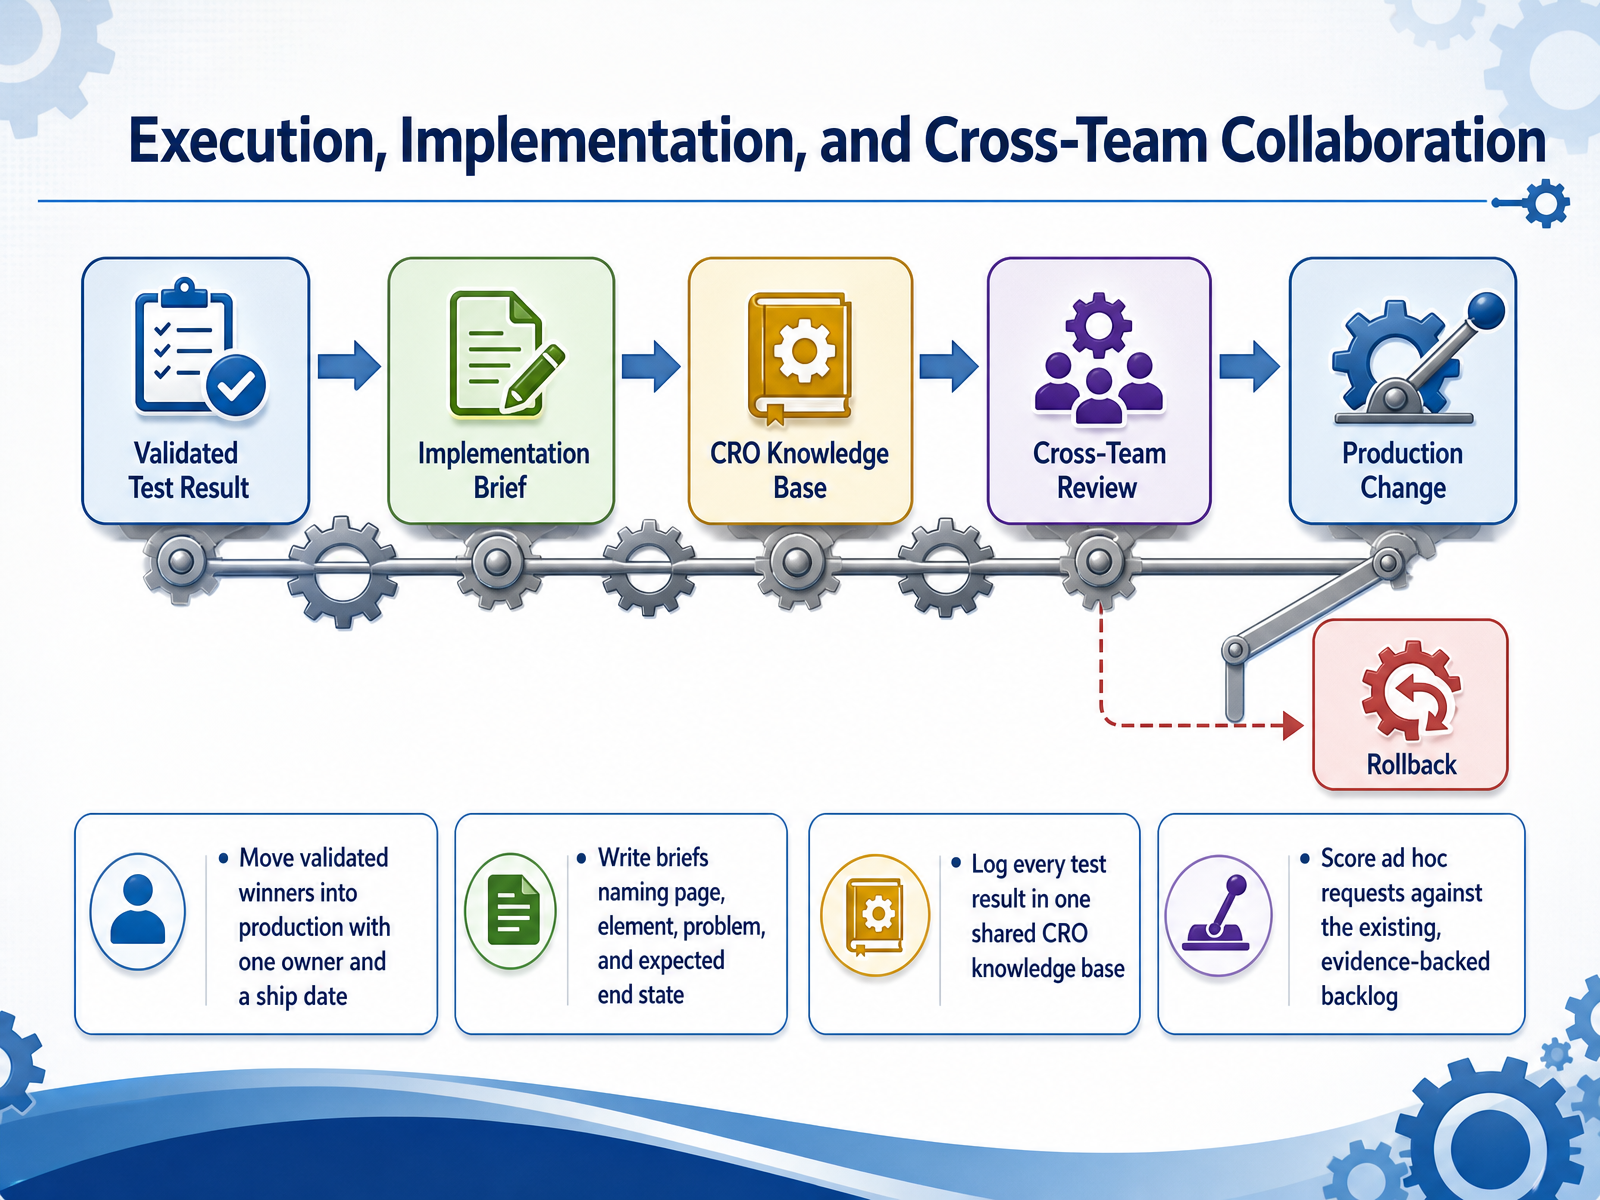
 - 11Execution, Implementation, and Cross-Team CollaborationTurning now from planning to execution, this is where most conversion programs quietly lose momentum. The fix is fairly mechanical, and comes down to ownership and documentation. First, every validated winner needs a production path with one named owner and a committed ship date. A task without both is just a suggestion. Second, briefs must be specific enough to survive a handoff between marketing, design, and development. Name the page, the element, the observed problem, and the expected end state. If a developer cannot act on it without asking a follow-up question, the brief is not done yet. Third, every test result, win or loss, gets logged in one shared knowledge base. This prevents your team from re-testing ideas that already failed, and surfaces patterns across experiments. Fourth, when ad hoc requests arrive, score them against the evidence-backed backlog using the same prioritization framework. If the request does not beat the current top three, it waits. This protects your roadmap from becoming a queue of whoever shouted last. Together, those four moves turn isolated wins into an operating system. Next, we will look at how to layer personalization and segmentation into that system.
 metricuno.comacceleroi.commetricuno.com+21 min
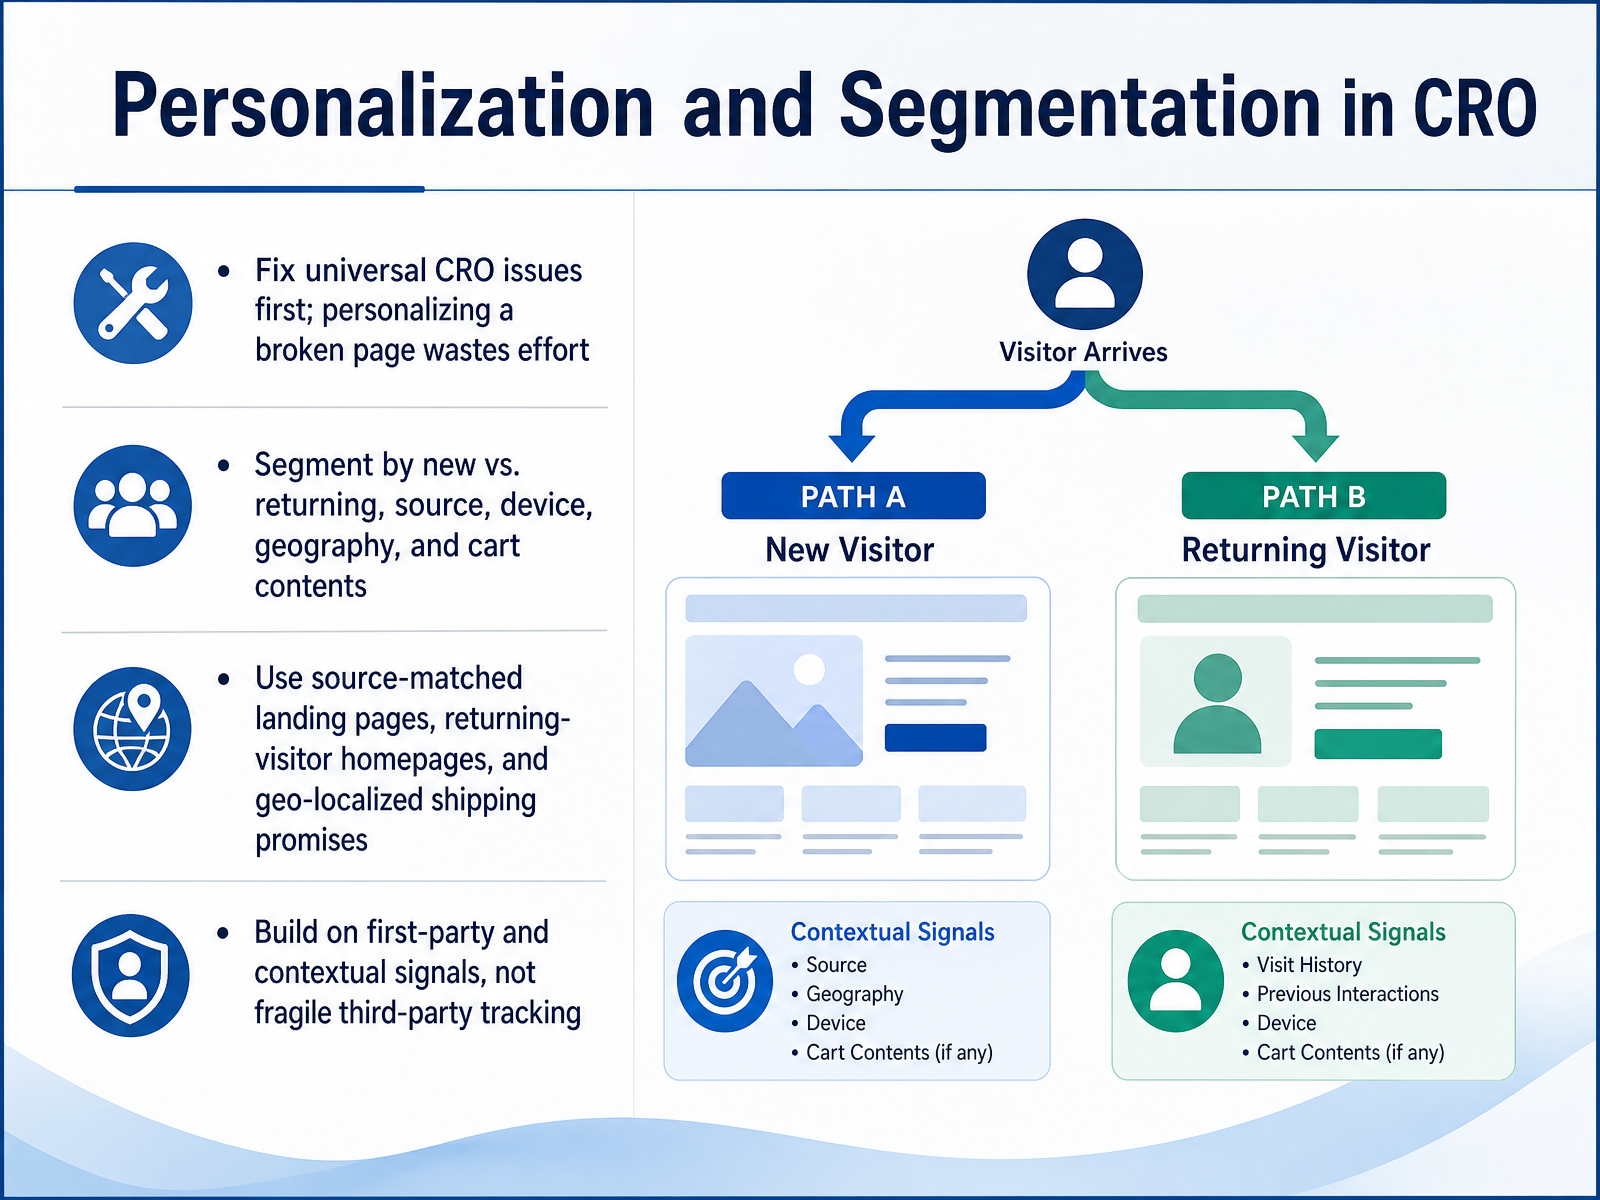
 - 12Personalization and Segmentation in CRONow let's talk about personalization and segmentation, because relevance drives conversion. First, one guardrail. Do not personalize a broken page. Fix your universal CRO issues first. A slow checkout or confusing product page stays broken no matter who sees it. Once the foundation is solid, segment by what actually changes intent. New versus returning visitors, acquisition source, device, geography, and cart contents. These signals are available right now without fragile tracking. Then put those segments to work. Match your landing page headline and hero to the ad or email that brought the visitor in. Show returning visitors their last browsed category instead of a generic homepage. And localize shipping promises and payment methods by region. These are high value, low effort moves. Typical lifts run from a few points to double digits on paid traffic when source matching is done well. The key is building on first party and contextual signals. Session context, UTM parameters, geography, and cart state do not depend on third party cookies. That keeps your personalization durable as privacy rules tighten. Treat every personalized rule as a hypothesis to test, not a feature to switch on and forget. Next, we'll look at how to measure, report, and sustain this entire CRO program.
 business.adobe.comeseospace.comshopify.com+22 min
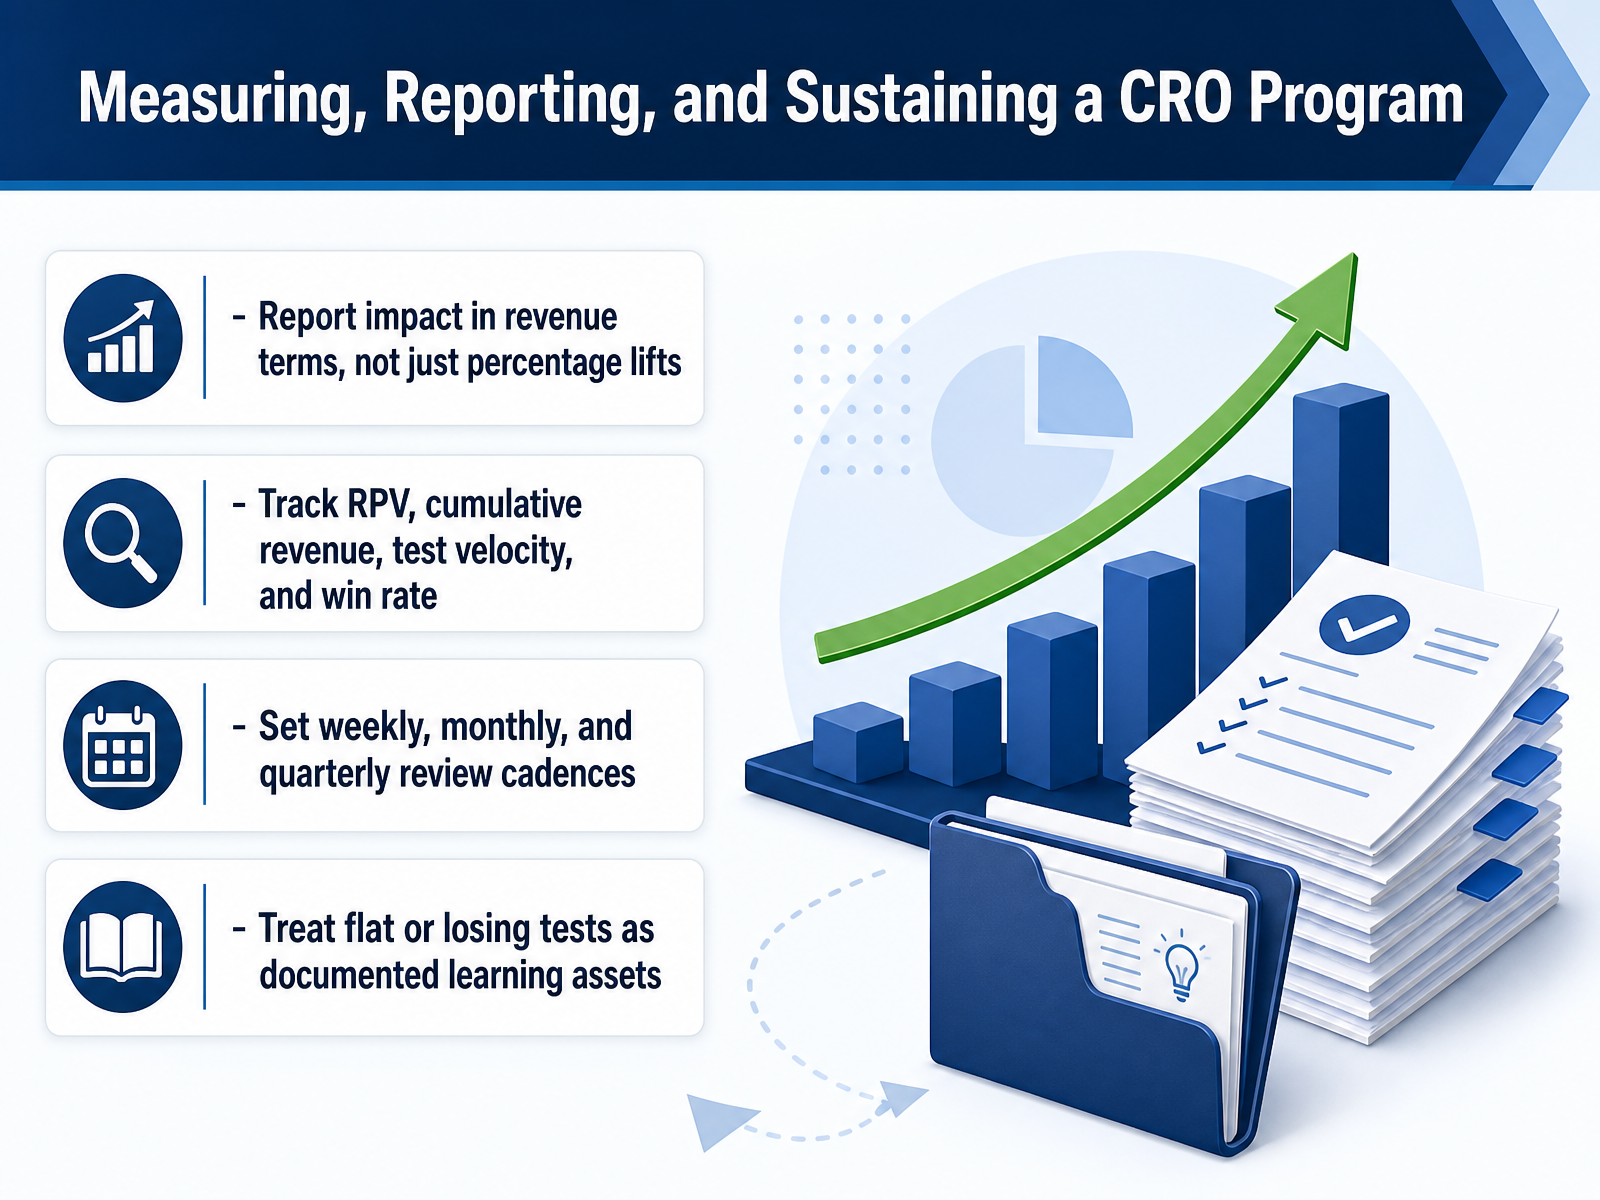
 - 13Measuring, Reporting, and Sustaining a CRO ProgramLet’s talk about how to keep a CRO program alive past the first few wins. Reporting is where most programs either get permanent buy-in or start to fade. So the first shift is language. Stop leading with percentage lifts. Lead with revenue. A five percent lift on a high-traffic checkout page is a line item. On a low-traffic blog page, it is noise. Translate every winner into estimated annual revenue impact, and your finance team will start paying attention for the right reasons. Next, track the right mix. Revenue per visitor is your north star because it captures both conversion and order value. Around it, track cumulative revenue from shipped winners, test velocity, and win rate. Velocity without a healthy win rate just means you are burning traffic. Win rate without velocity means you are learning too slowly to matter. Then, set a cadence and protect it. Weekly for active tests and blockers. Monthly for completed results and backlog updates. Quarterly for strategy and a fresh round of research. This rhythm is what turns sporadic testing into a program. And when a test comes back flat or loses, do not bury it. Archive it. A documented losing test prevents your team from re-running the same idea in six months. That archive is how your twentieth test gets sharper than your first. Now, that discipline sets up the execution phase directly. Let’s move into your 30, 60, and 90 day CRO action plan.
 metricuno.comacceleroi.commetricuno.com+22 min
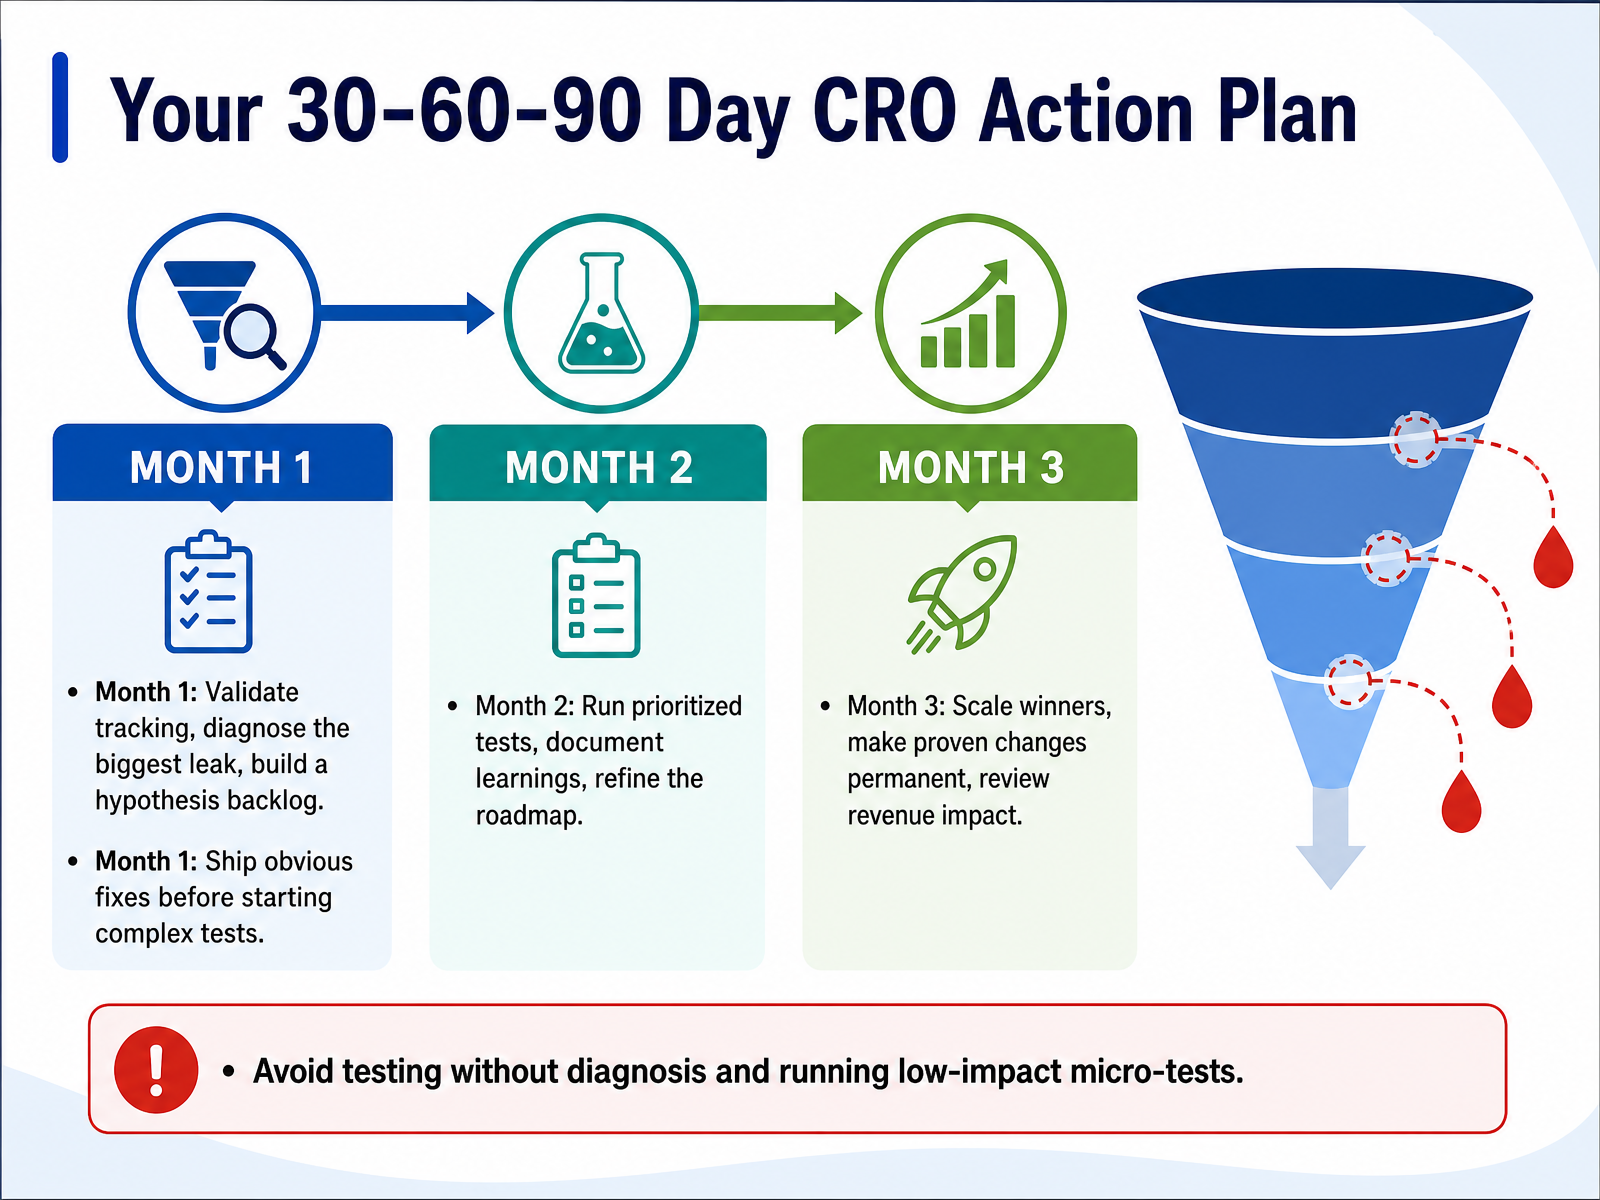
 - 14Your 30-60-90 Day CRO Action PlanHere is the plan. In the first thirty days, resist the urge to test. Your only job is to validate tracking, size up your funnel math, and pinpoint the biggest revenue leak. Once you know where the money is escaping, build a hypothesis backlog from that evidence. Ship obvious fixes immediately. If checkout is broken on mobile or shipping costs are hidden until the last step, do not waste time running a statistical test on it. Just fix it before launching anything complex. In month two, start running prioritized tests from your backlog. Run one major test per cycle with one primary metric and a clear guardrail. Document every result, even the losers, because that is what sharpens the next round. By month three, take the proven winners and make them your new default. Scale what works across your templates, then report the cumulative revenue impact, not just conversion lifts. And remember the two biggest traps: testing without a clear diagnosis, and wasting cycles on low impact micro tests. This is a repeating loop. Diagnose, ship, test, scale, and then diagnose again. That is how you build a CRO program that actually compounds. Thank you, and go run the system.
 metricuno.comacceleroi.commetricuno.com+22 min
Take the deck with you
Download this course as a file — free, no sign-up needed.
- PDF handoutEvery slide page, ready to print or share.15 pages · 3.7 MBDownload
- Narrated PowerPointThe deck that presents itself — every slide carries the digital human's narration video.15 pages · 17.4 MBDownload
- PowerPoint slidesThe full deck as a .pptx — open it in PowerPoint, Keynote, or Google Slides.15 pages · 3.6 MBDownload
Free to use in your own training — please keep the PersonWise credit page at the end.
Have your own deck? Turn it into a course
Sources consulted
Web sources consulted while building this course.
- Ecommerce conversion rate optimization — strategies, tips, and common mistakes — business.adobe.com
- Ecommerce CRO: How to Boost Conversion Rates (2025) — eseospace.com
- Ecommerce Conversion Rate: How To Improve Yours (2026) - Shopify — shopify.com
- eCommerce CRO: 26 Tips & Best Practices (2026) — omniconvert.com
- 16 Actionable Ecommerce Conversion Rate Optimization Tips - Baymard — baymard.com
- Ecommerce Marketing Benchmarks 2025: CVR, AOV, ROAS & Cart Abandonment | OwlClaw Technologies | OwlClaw Technologies — owlclaw.com
- Ecommerce Benchmarks 2025: Key Metrics & Industry Data - Triple Whale — triplewhale.com
- E-commerce conversion rate benchmarks - 2025 update — smartinsights.com
- E-Commerce Conversion Funnel Benchmarks Worldwide 2018-2030 — ecdb.com
- Ecommerce Funnel Benchmarks: CR, Abandonment & AOV (Key Stats) — bestforecommerce.com
- Ecommerce Friction Analysis: A Practical Guide — metricuno.com
- The Complete Guide to UX Research for Ecommerce | BTNG.studio — btng.studio
- Ecommerce UX Audit: How to Find What's Hurting Your Conversion – Baymard — baymard.com
- Heatmaps vs Session Replay: Which to Use First for CRO - Precision — goprecision.co
- Heatmaps & Session Recording: Understanding | Digital Codex — clarigital.com
- A/B Testing Roadmap: How to Plan a Quarter of Experiments — metricuno.com
- CRO Roadmap Template: Plan Your First 90 Days of Testing | acceleroi — acceleroi.com
- A/B Testing: Framework, Process & Pitfalls for DTC Stores — metricuno.com
- How to Build an Experimentation Roadmap That Actually Gets Used | Atticus Li — atticusli.com
- How To Build A CRO Roadmap | CROLabs — crolabs.com