Data Documentation Essentials
Begin
16 pages · ~32 min
Data Documentation Essentials
This training explains how to document data effectively, including defining terms, identifying sources, and recording assumptions for clearer data communication.
What you’ll learn
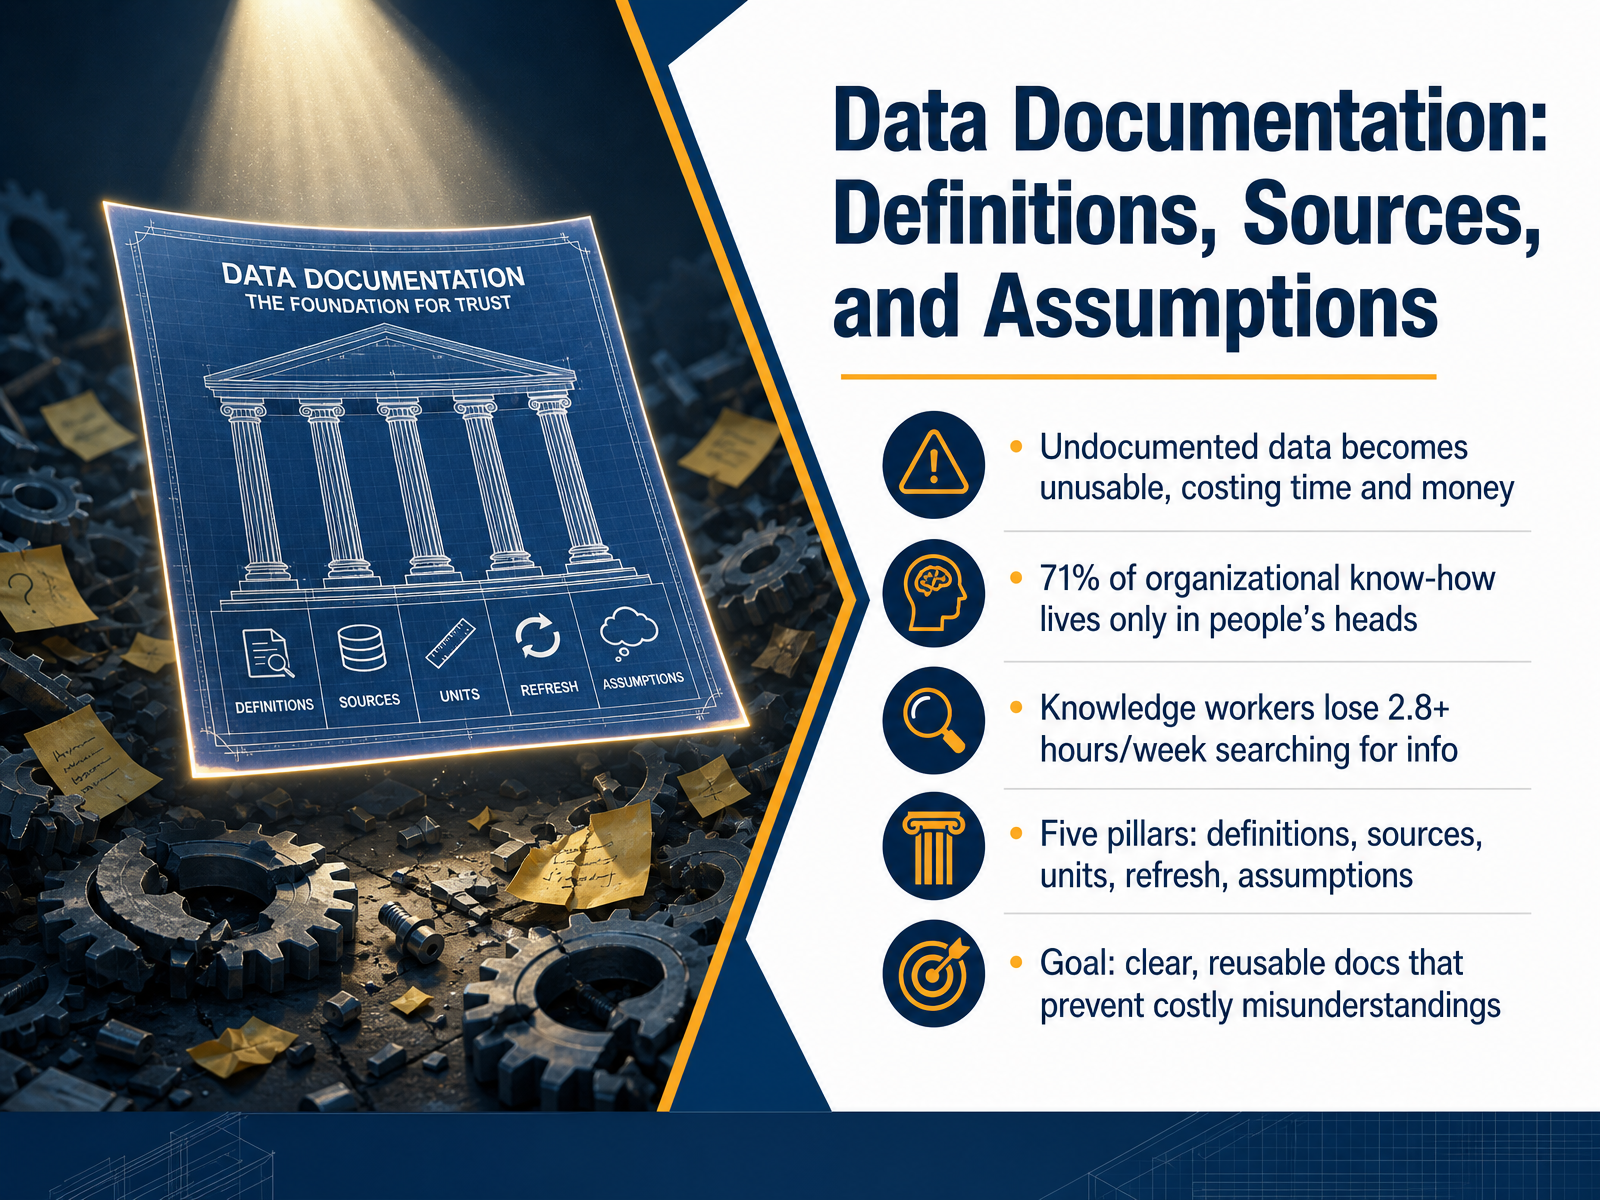
- 01Data Documentation: Definitions, Sources, and AssumptionsWelcome to Data Documentation: Definitions, Sources, and Assumptions. I'm glad you're here. In this course, we're going to build a practical skill together: making data trustworthy for the people who need it. We'll focus on five pillars that make that possible: definitions, sources, units, refresh, and assumptions. By the end, you'll know how to create clear, reusable documentation that prevents costly misunderstandings. Let's start by looking at the real cost of undocumented data.scribe.compaligo.netmedia.bitpipe.com+21 min
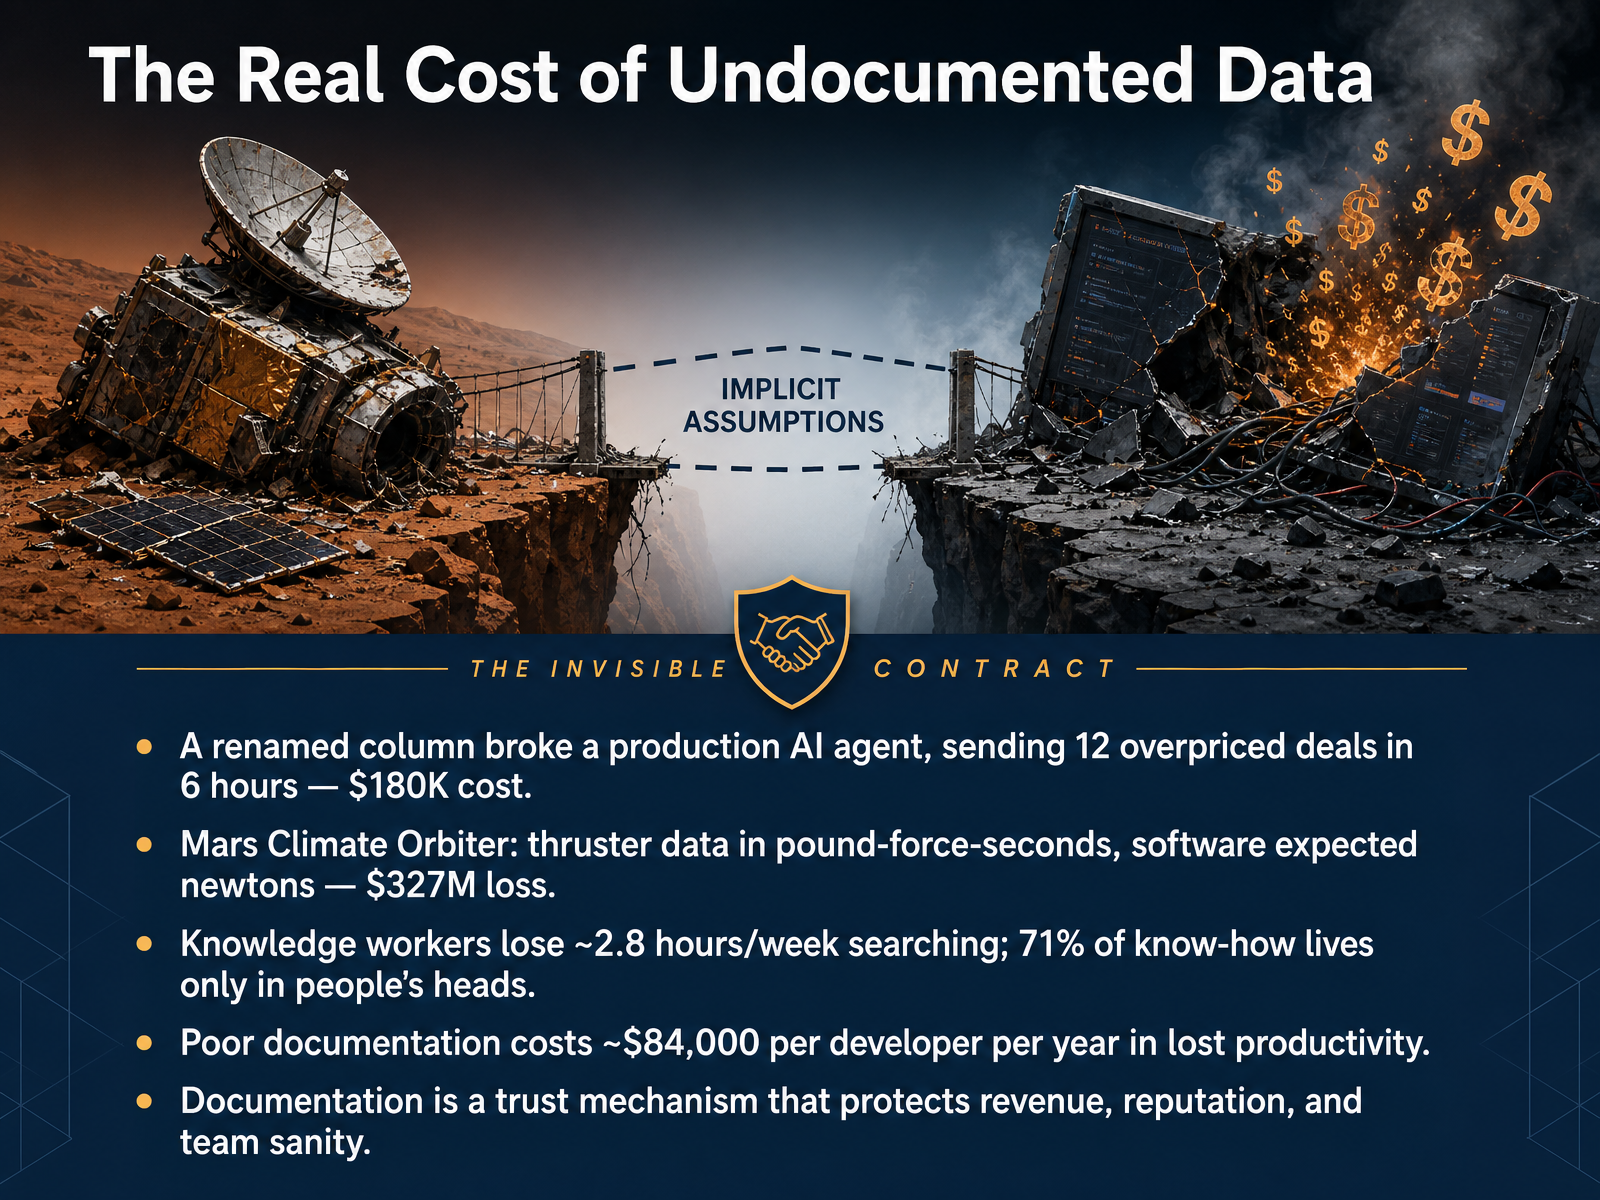
- 02The Real Cost of Undocumented DataLet's look at why documentation isn't just a nice-to-have, but a trust mechanism that protects revenue, reputation, and team sanity. Consider a real incident from just last year. A team renamed a column from net revenue to revenue net. It took four seconds. That rename broke a production AI agent which silently defaulted to list price for six hours. Twelve deals went out overpriced, costing about one hundred eighty thousand dollars in pricing corrections alone. And the team only found out from a customer. Then there's the Mars Climate Orbiter. One team produced thruster data in pound-force seconds. The navigation software expected newton-seconds. That unspoken assumption cost three hundred twenty-seven million dollars and the entire mission. The pattern is clear. When units, sources, and definitions aren't written down, systems fail at the boundary where no one is looking. In our daily work, the cost shows up as lost time. Studies show knowledge workers lose about 2.8 hours each week just searching for information. And poor documentation costs roughly eighty-four thousand dollars per developer per year in lost productivity. Documentation is the contract that prevents these failures. Let's build that contract, starting with who relies on your documentation.
 medium.comdev.todev.to+22 min
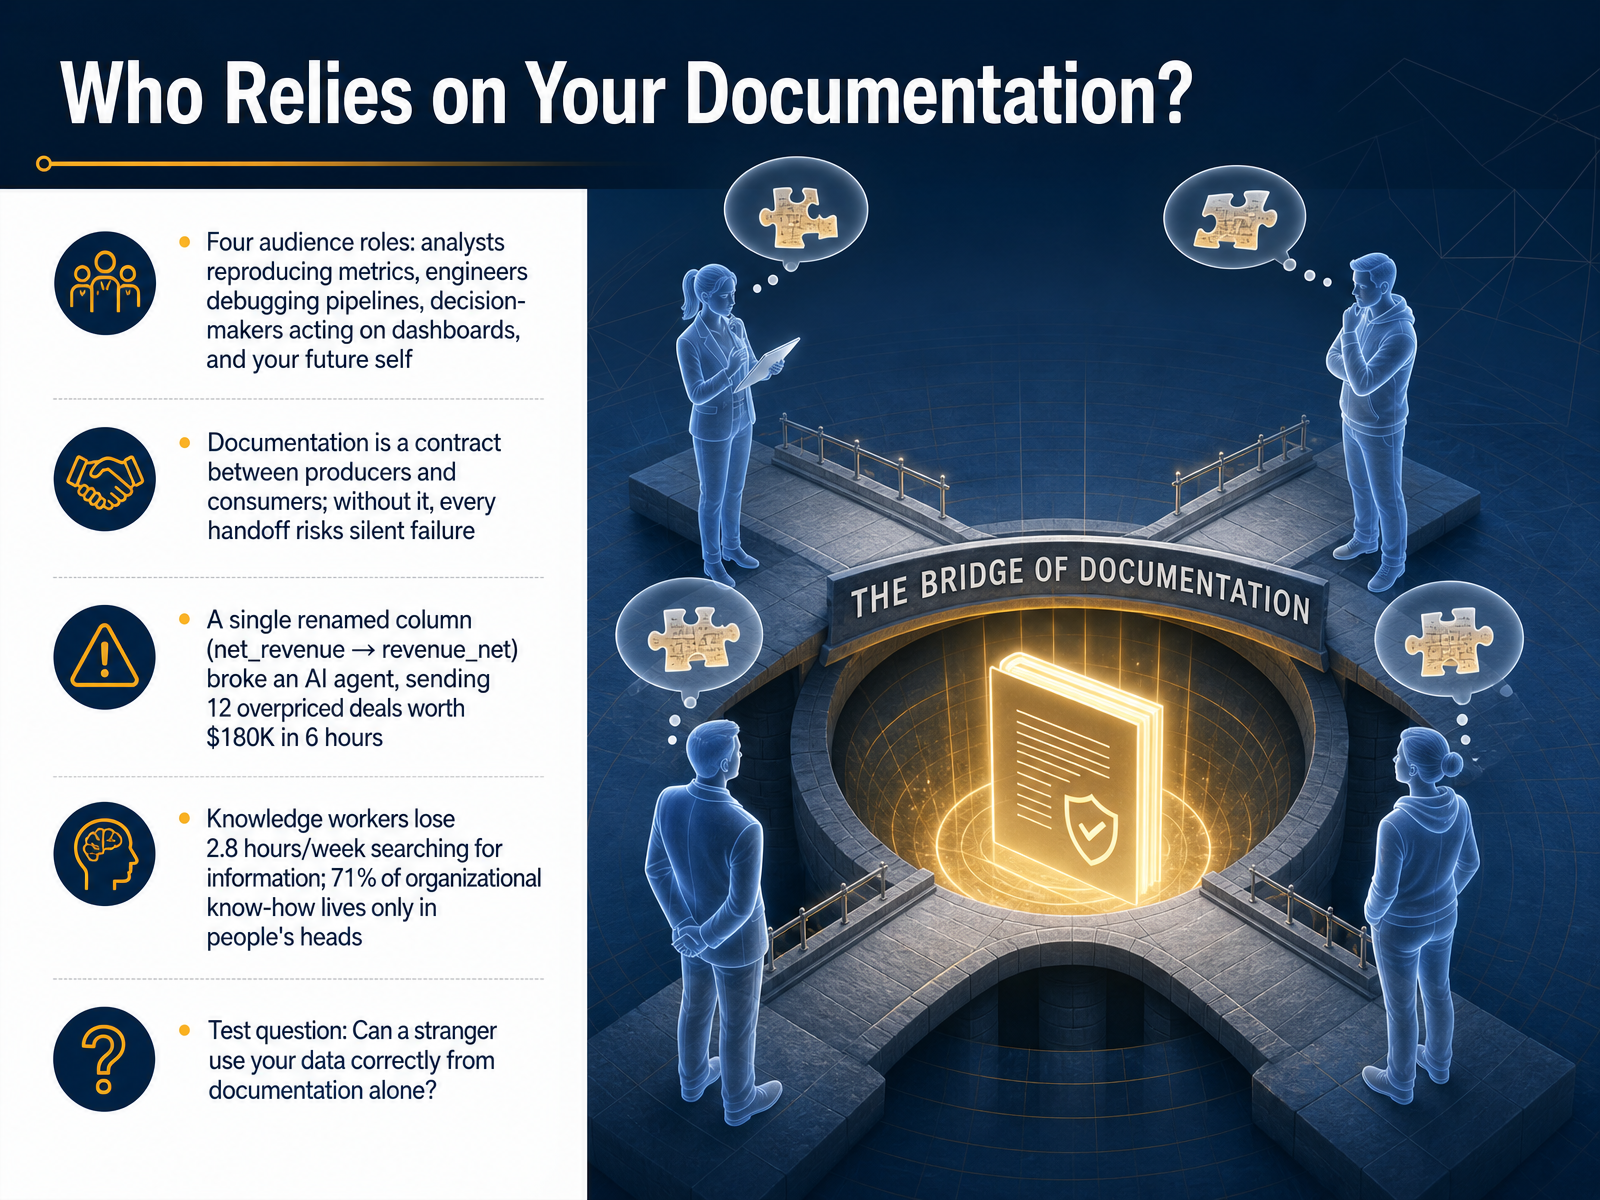
 - 03Who Relies on Your Documentation?So who actually relies on your documentation? It is not just you. Think of at least four different readers. There is the analyst who needs to reproduce your exact metric. There is the engineer debugging a broken pipeline at two in the morning. There is the decision-maker acting on a dashboard. And most importantly, there is your future self. Without written definitions, every handoff between these groups risks a silent failure. Consider this real example. An upstream team renamed a column from net_revenue to revenue_net. No contract existed, no alert fired, so an AI pricing agent saw nulls and defaulted to list price. In six hours, twelve overpriced deals went out, costing about one hundred eighty thousand dollars. The column rename took four seconds. This is not rare. Knowledge workers lose nearly three hours a week just searching for information, and over seventy percent of institutional know-how lives only in people's heads. So here is your test question. Can a complete stranger use your dataset correctly using only your documentation? If the answer is no, you have work to do. Let us start that work next with Pillar One: Writing Field Definitions That Last.
 medium.comdev.todev.to+22 min
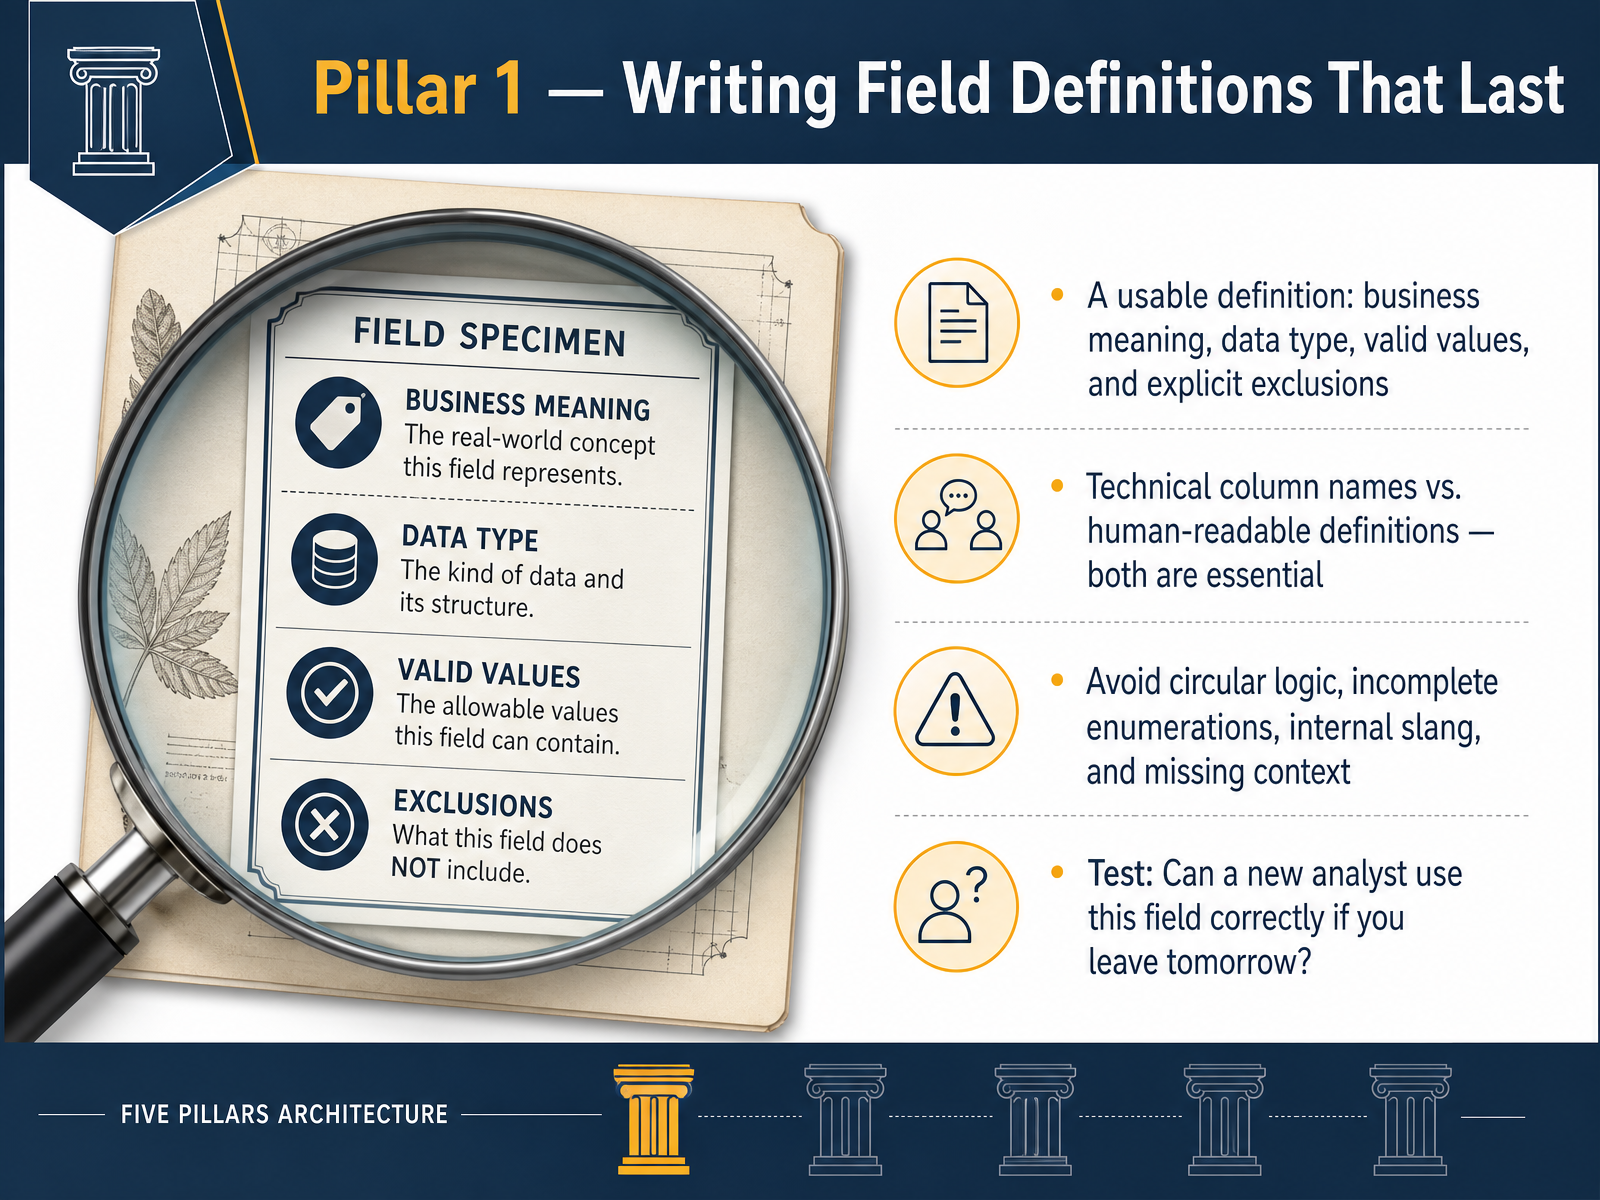
 - 04Pillar 1 — Writing Field Definitions That LastNow we turn to the first pillar: writing field definitions that last. A usable definition does four things. It gives the business meaning, states the data type, lists valid values, and calls out explicit exclusions. For example, a field called customer_tier might mean the customer's current loyalty level. The data type is text. Valid values are bronze, silver, gold, and platinum. An explicit exclusion could be that former customers who have churned are not included. Remember, technical column names and human-readable definitions are both essential. One is for the machine, the other is for the person reading your work. Avoid three common mistakes. First, circular logic that defines a term by using the term itself. Second, incomplete lists that leave out rare but real values. Third, internal slang that only your immediate team understands. A good test is this: can a new analyst use this field correctly if you leave tomorrow? If the answer is no, the definition needs more clarity. Next, we will look at the anatomy of a field definition and walk through a few clear examples.
 2 min
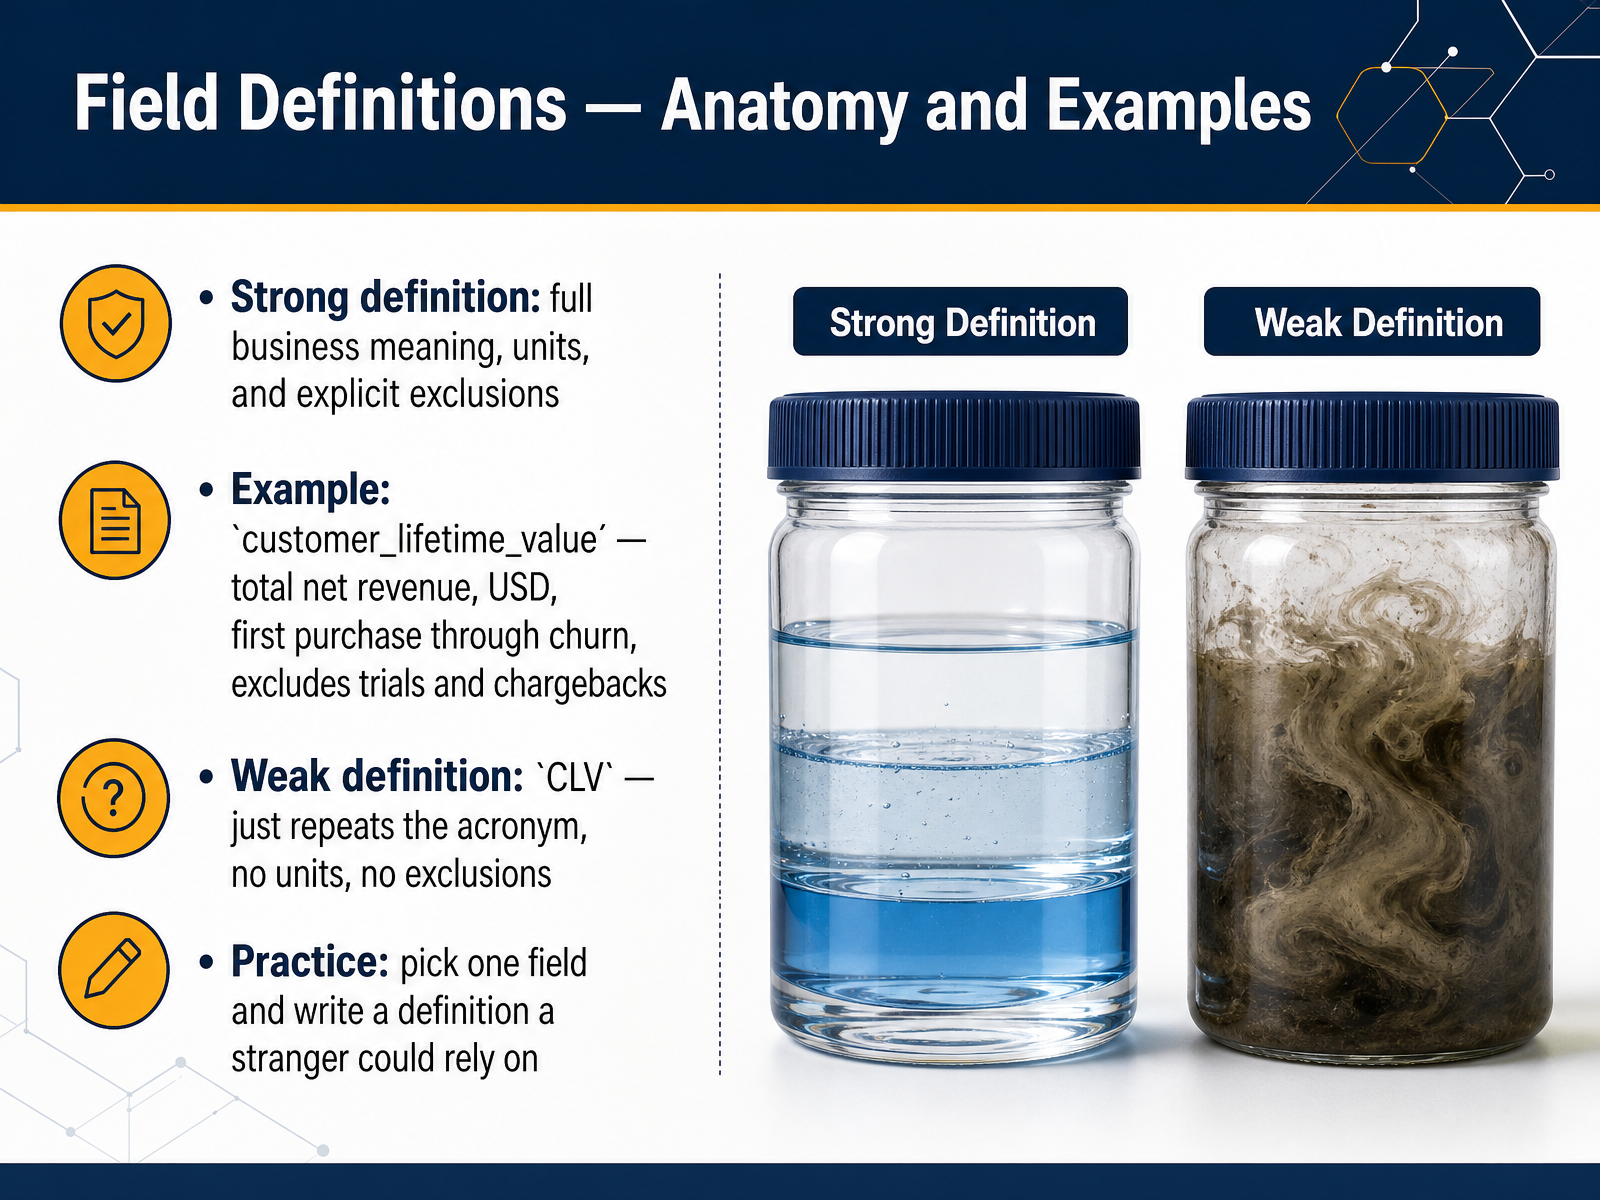
2 min - 05Field Definitions — Anatomy and ExamplesLet's look at the anatomy of a field definition. A strong definition gives someone the full business meaning, the units, and what's explicitly not included. Think of it as a label that lets a stranger trust the number without asking you. For example, take a field called customer_lifetime_value. A strong definition says: total net revenue in US dollars, from a customer's first purchase through churn, excluding trials and chargebacks. You see the unit, the time window, and the exclusions all in one sentence. A weak definition for the same field just repeats the acronym, like C L V, with no units and no boundaries. That leaves everyone guessing. Now, for practice, pick one field you work with and write a definition a stranger could rely on. State the unit, the timeframe, and what's outside the scope. That's the standard we're aiming for. Up next, we'll move into Pillar 2, documenting data sources.
 1 min
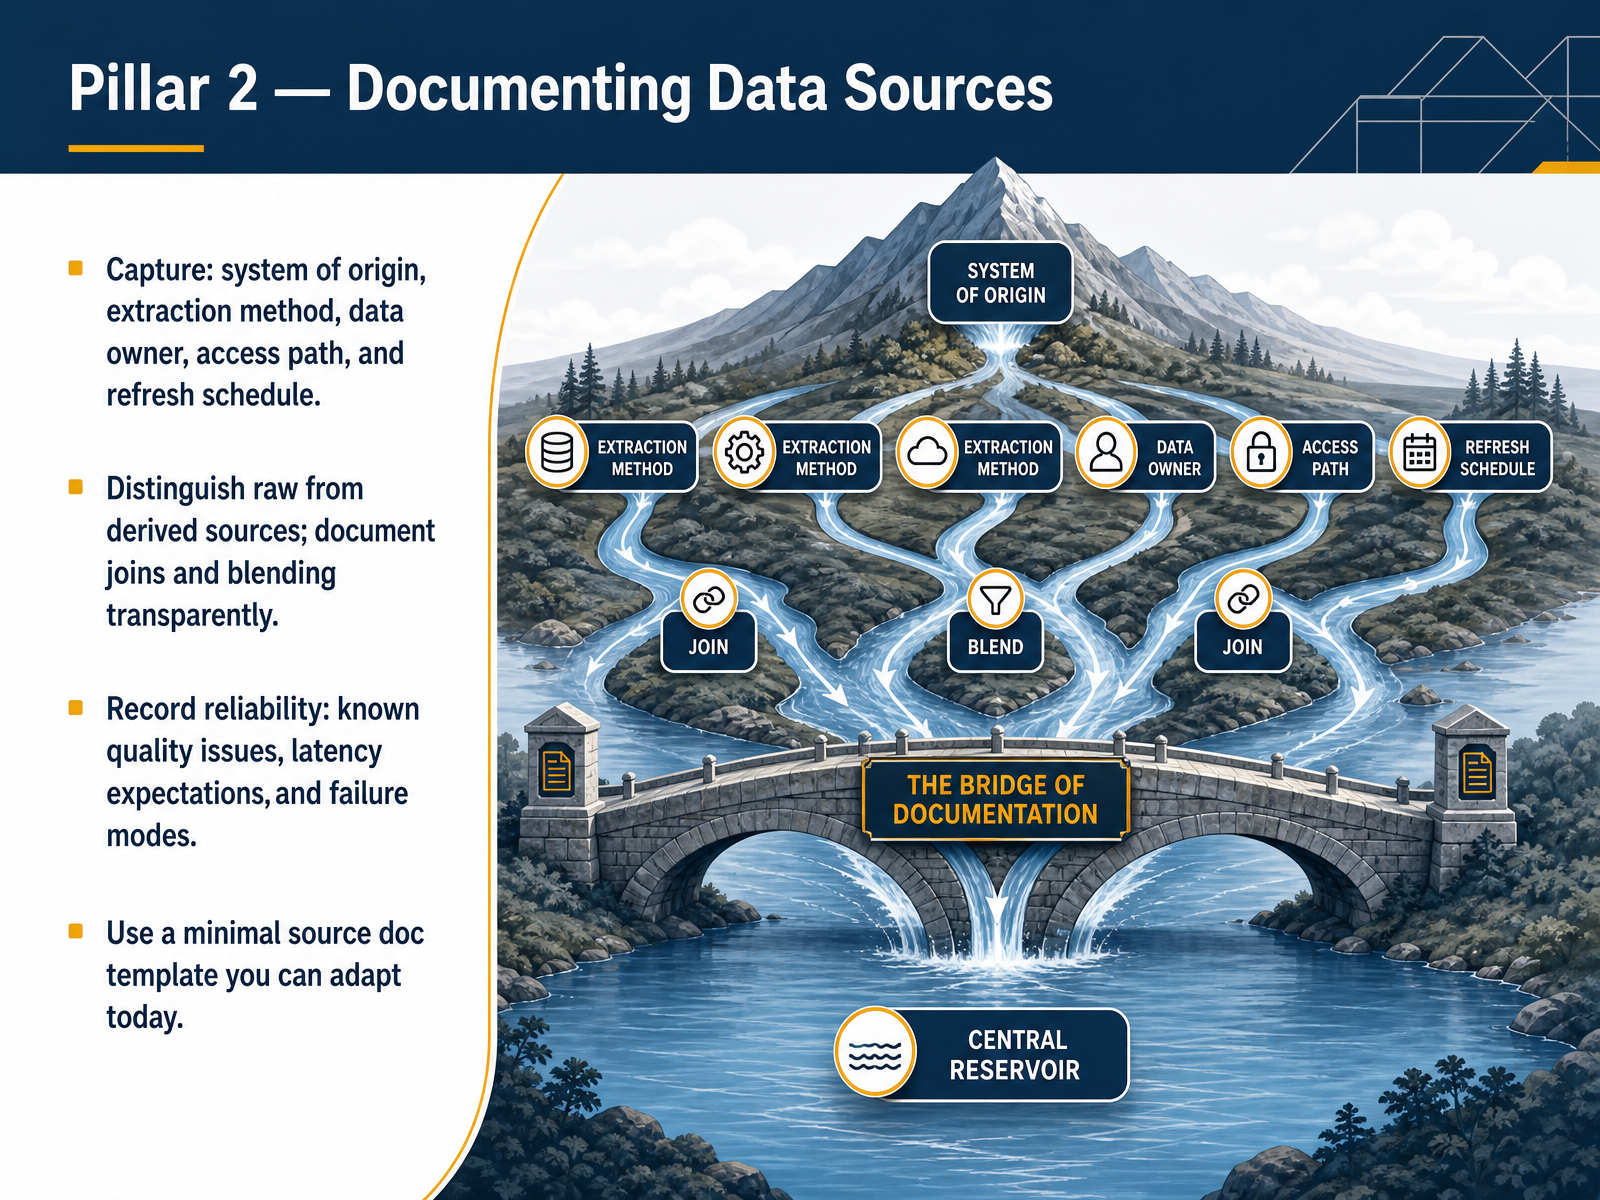
1 min - 06Pillar 2 — Documenting Data SourcesNow let’s turn to our second pillar: documenting data sources. A field definition answers what the data means. The source answers where it actually came from, and that is just as important for trust. We recommend capturing five pieces every time. First, the system of origin, meaning the exact database or application. Second, the extraction method, like a scheduled query or an API call. Third, the data owner, the person or team accountable for that source. Fourth, the access path, the specific schema and table name. And fifth, the refresh schedule, how often the source updates and when the next run is expected. Pause here and remember that raw sources and derived sources are not the same. A table that comes directly from a transactional system is raw. A table built by joining three raw sources in dbt is derived. You need to document those joins and any blending logic explicitly, because a column that looks simple may actually be a calculated field stitched together from multiple places. Next, record reliability. Note known quality issues, like late-arriving records, missing values on weekends, or occasional duplicate keys. Also state the latency expectation, how many hours after close of business the data should be available, and list what happens when the source fails. Does the pipeline send an alert? Who responds? What is the manual fallback? Even one sentence here prevents confusion later. Finally, start with a minimal source template you can adapt right away. It does not need to be a heavy governance document. Four fields, source name, owner, refresh schedule, and known caveats, are enough to move your team from guessing to knowing. That template is something you can fill in today. In the next slide, we will follow that data as it moves, looking at source lineage from the operational database all the way to the dashboard.
 databricks.comcloud.google.comgartner.com+22 min
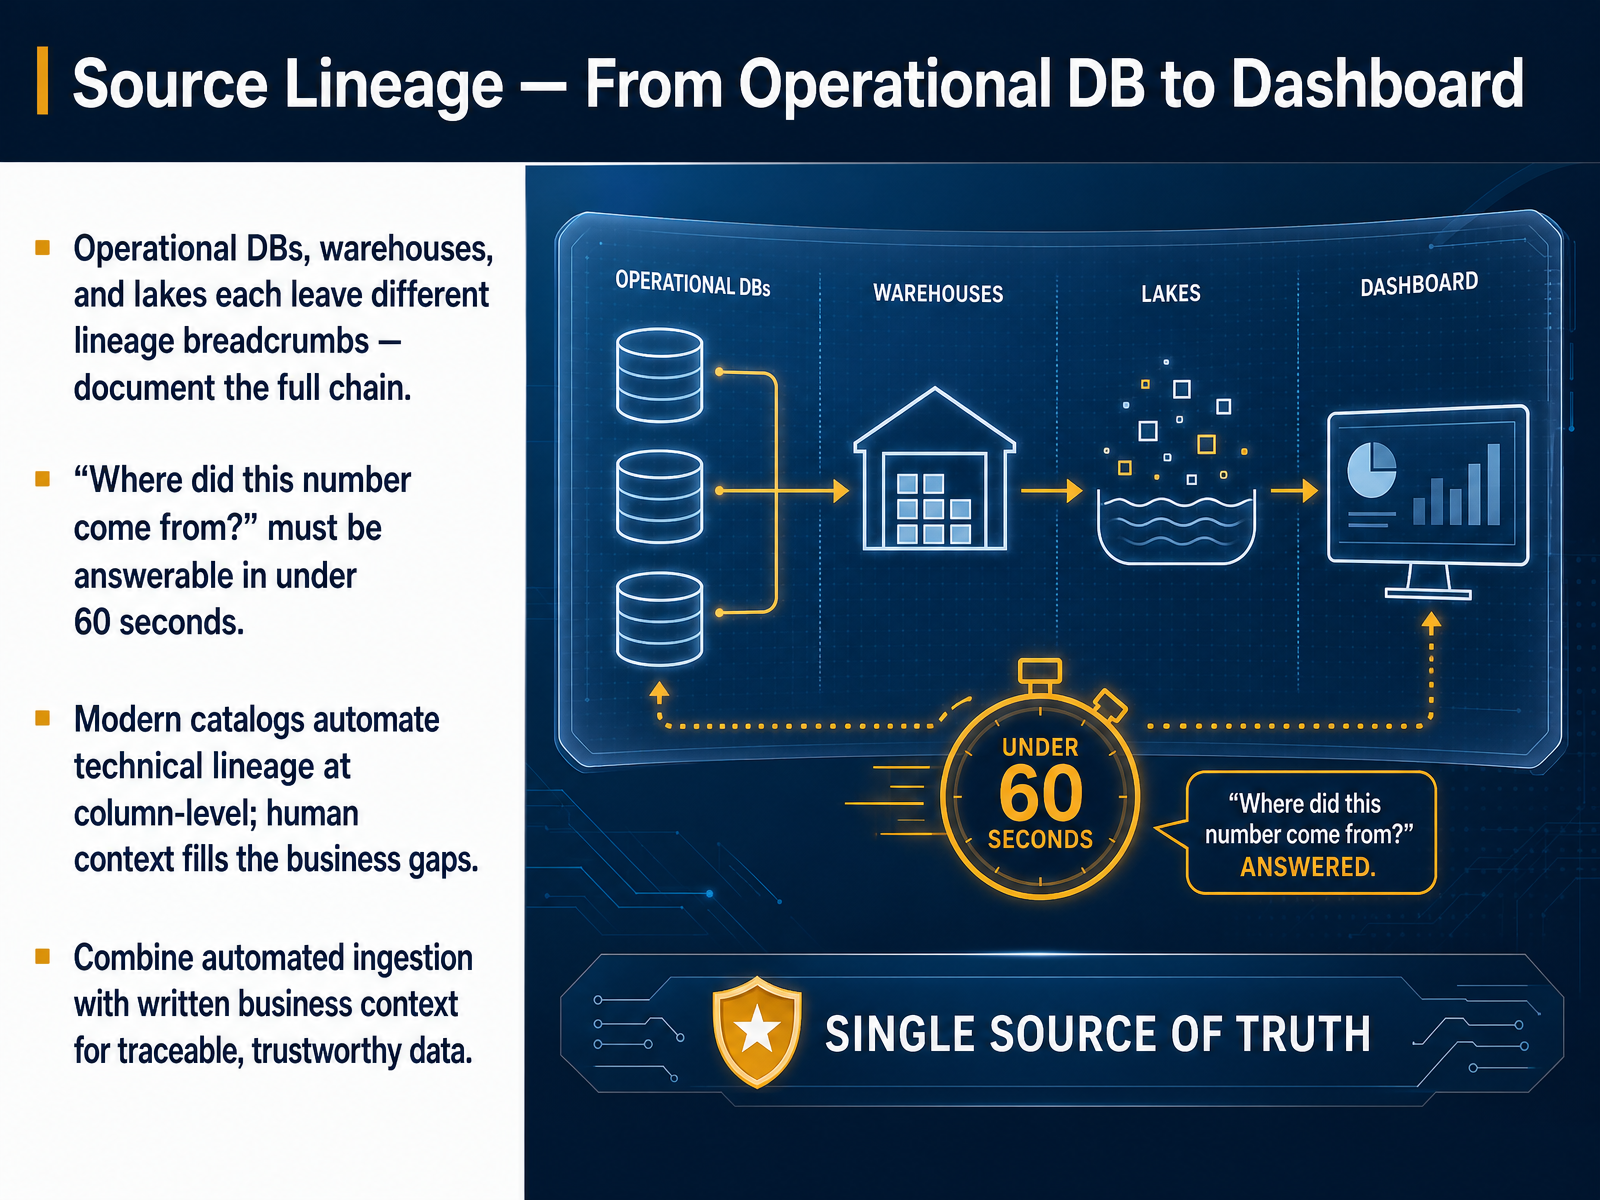
 - 07Source Lineage — From Operational DB to DashboardNow let's talk about where data comes from, its source lineage. When a number travels from an operational database to a warehouse, then to a dashboard, it leaves breadcrumbs. Each stop might rename a column, change a filter, or aggregate things differently. Documenting that full chain is what makes a number trustworthy. The real test is the sixty-second rule. If someone asks, 'Where did this number come from?' you need to be able to trace it from the dashboard back to the source in under a minute. Modern data catalogs help immensely here. They automate the technical lineage at the column level, so you can see exactly how data flows system to system. But automation isn't the whole picture. You must add the human business context. Write down why the data was joined that way, what assumption was made about nulls, or why a specific filter was applied. Combining automated ingestion with your written business context gives you truly traceable, trustworthy data. Next, let's explore Pillar Three, Units and Measurement Context.
 databricks.comcloud.google.comgartner.com+22 min
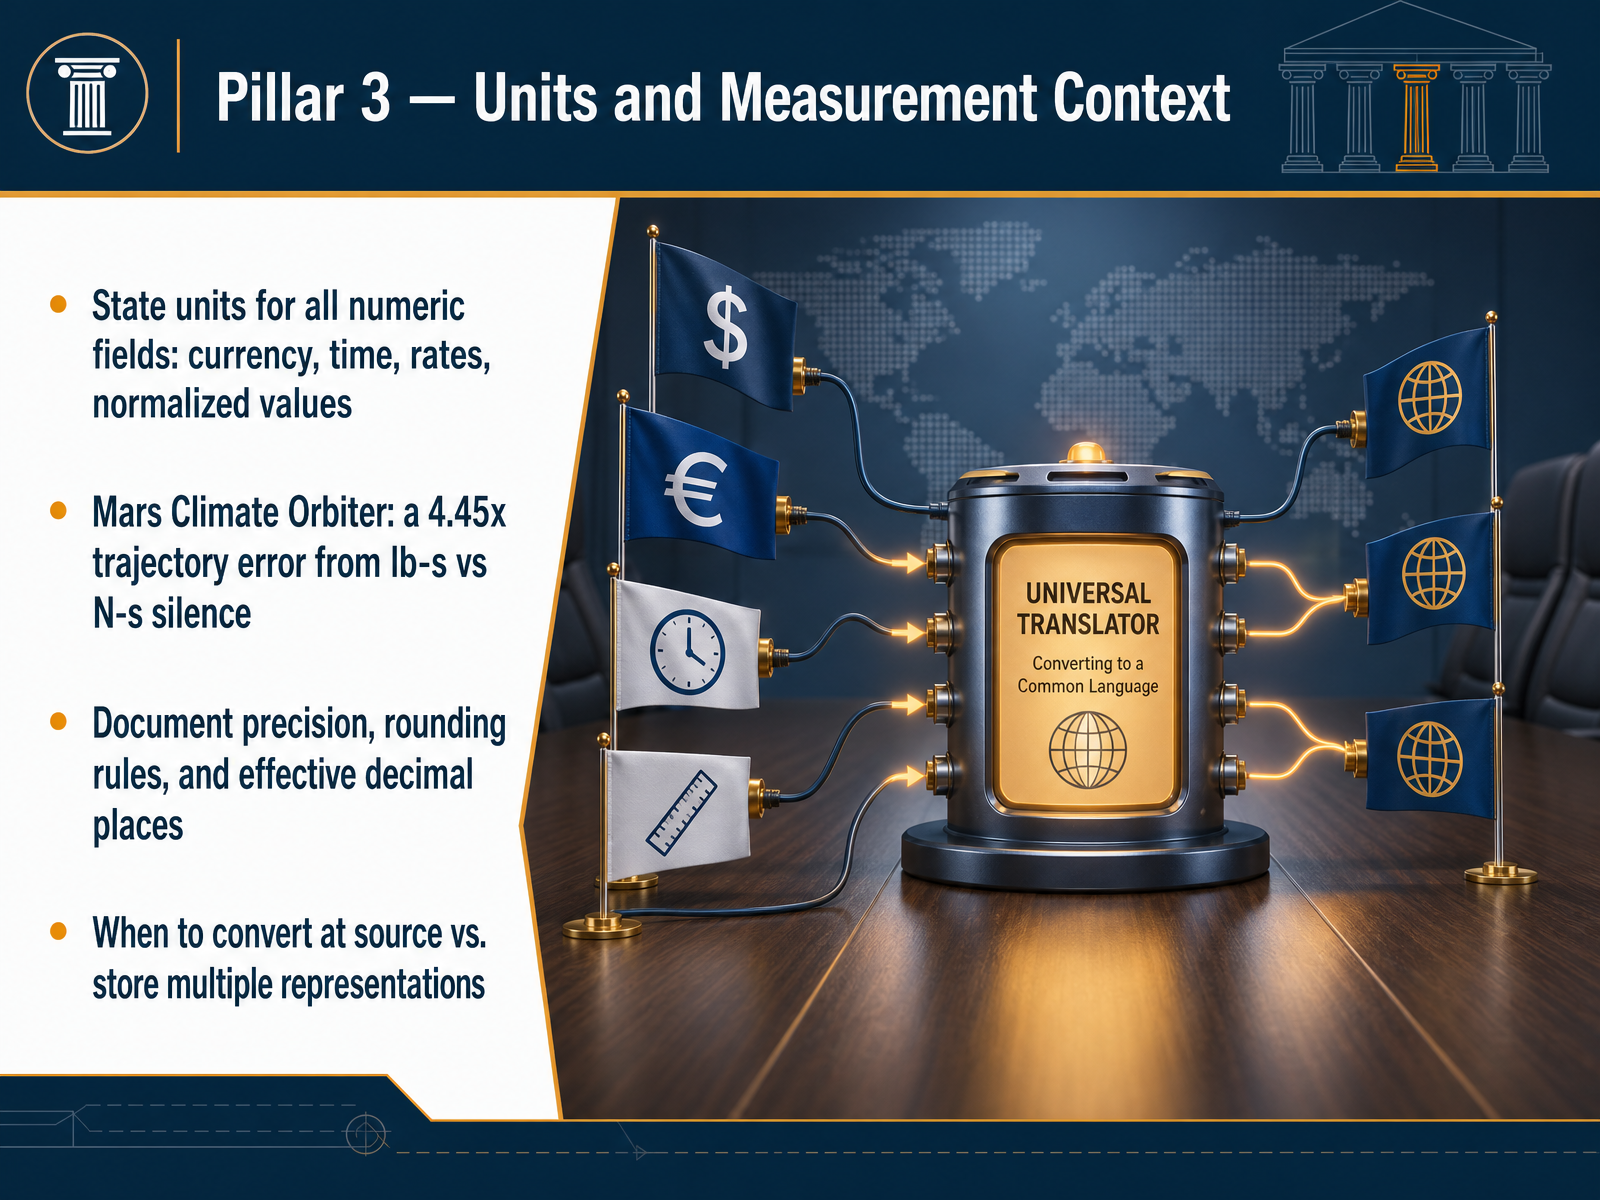
 - 08Pillar 3 — Units and Measurement ContextNow let’s talk about the pillar that turned a spreadsheet into a spacecraft disaster: units and measurement context. For every numeric field in your data—currency, time, rates, or normalized values—state the unit explicitly. Never assume the recipient knows whether revenue is in dollars, thousands of dollars, or euros. A classic warning: the Mars Climate Orbiter was lost because thruster performance data was delivered in pound-force seconds instead of the required newton seconds. That single silence introduced a factor of four point four five error in the trajectory, and a 193-million-dollar spacecraft burned up in the Martian atmosphere. When you document, also include precision, rounding rules, and the effective number of decimal places. For example, note when a rate is calculated to four decimal places but stored to two. Finally, decide early whether to convert units at the source or to store multiple representations. Each choice affects downstream traceability. Let your documentation remove the guesswork so nobody has to reverse-engineer your assumptions.
 discovery.larc.nasa.govscience.orgdiscovery.larc.nasa.gov+22 min
 - 09Unit Disasters Are Preventable — Case StudiesLet's look at what happens when units go unstated. In 1999, NASA's Mars Climate Orbiter approached the planet for orbital insertion. The navigation team expected thruster impulse data in newton‑seconds, as required by the interface specification. The spacecraft team delivered the data in pound‑force‑seconds. One pound‑force equals 4.45 newtons. Because no unit contract was enforced at the interface, the spacecraft entered the atmosphere too low and disintegrated. The cost: three hundred twenty‑seven million dollars, lost over a missing unit label. Procurement comparisons fail the same way every day. Vendor A reports IOPS at a four‑K block size, Vendor B at eight‑K. The numbers sit side by side in a matrix and look comparable, but the assumptions underneath are incompatible. Across global procurement, decisions like these create an estimated one hundred thirty to three hundred ninety billion dollars in annual waste. The fix is a process, not a one‑time check. Explicit unit documentation at every interface. Automated cross‑checks whenever data moves between systems. And peer review that spans team boundaries. In our next slide, we turn to the final pillar: update frequency and freshness.
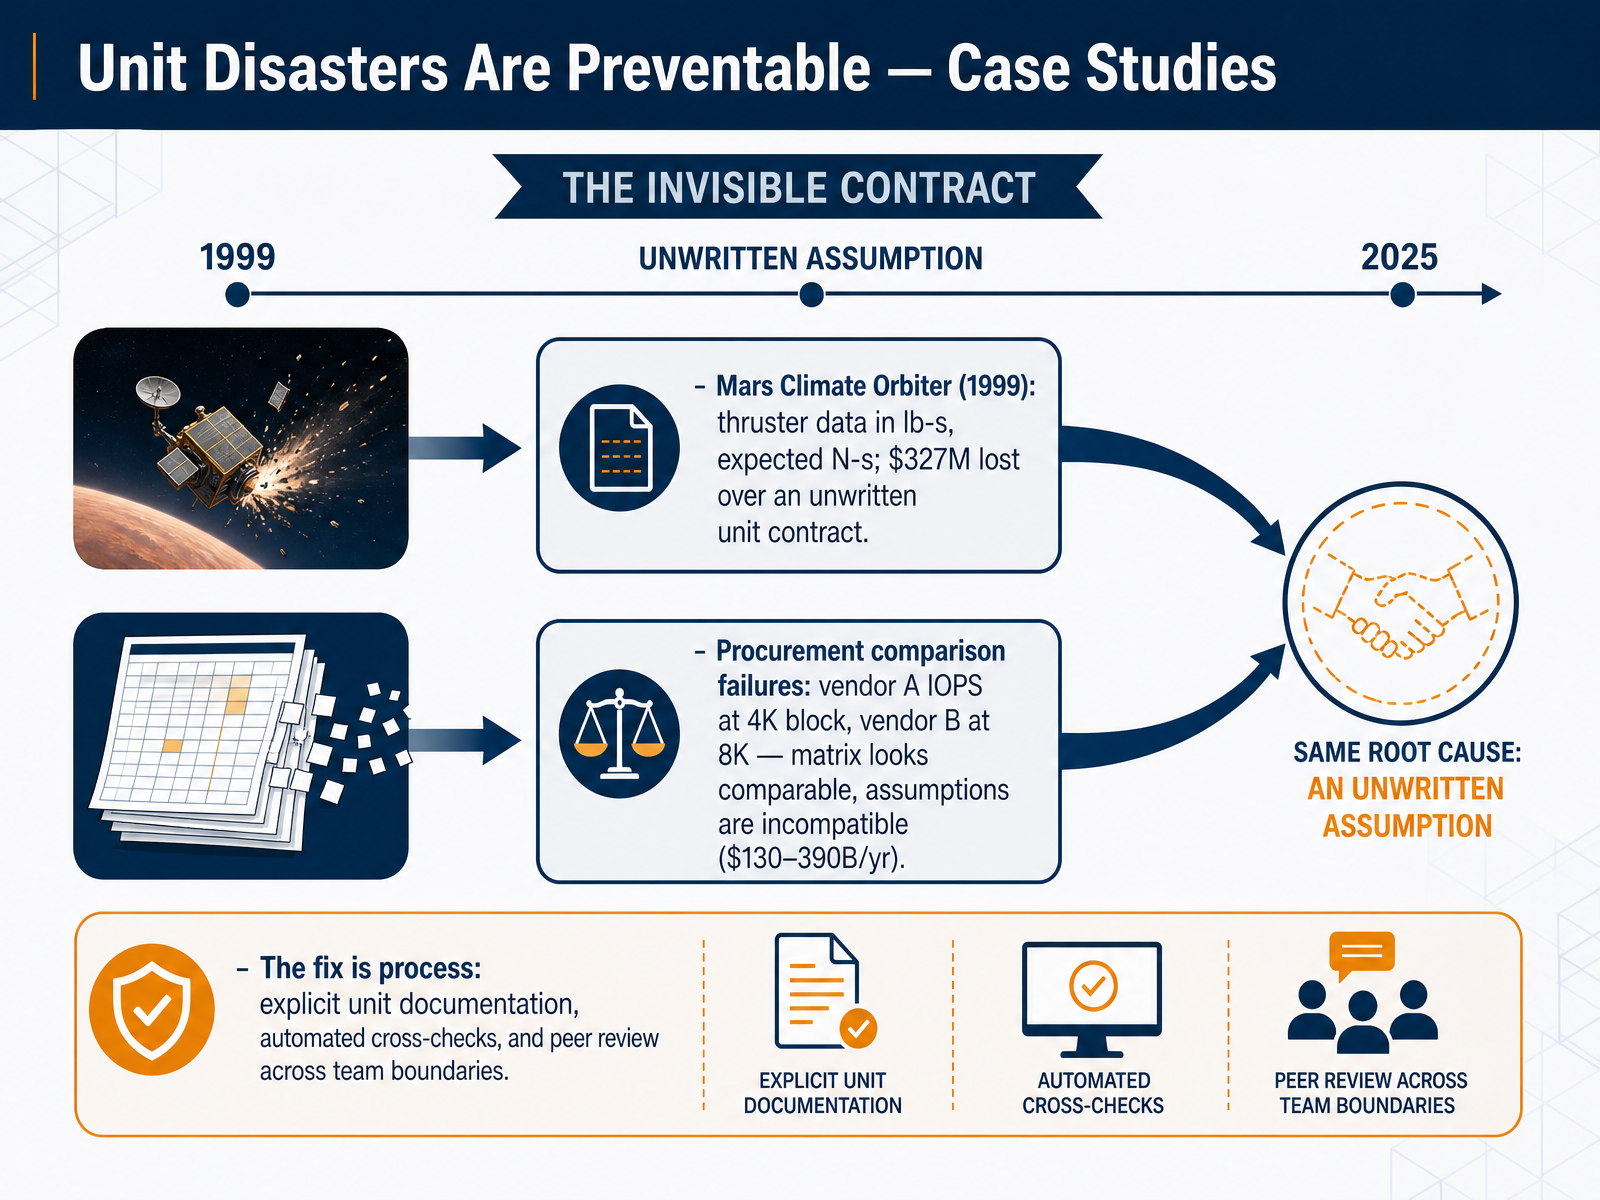 discovery.larc.nasa.govscience.orgdiscovery.larc.nasa.gov+22 min
 - 10Pillar 4 — Update Frequency and FreshnessNow let's look at the fourth pillar: Update Frequency and Freshness. This is about setting clear expectations so your colleagues know how current the data is. First, define the refresh cadence. Does this field update daily, hourly, or in real time? Be specific. And always name an escalation contact so people know exactly who to reach when a refresh fails. Second, separate extraction timestamps from actual event timestamps. A transaction might happen at noon, but the pipeline loads it at three P M. If you only record the load time, your team could make decisions on stale information. Third, set staleness thresholds. Tell consumers flat out: if this data is more than twenty-four hours old, stop using it. Modern catalogs surface freshness signals automatically, but you still have to add the business context. An auto-generated timestamp doesn't tell the whole story. You must explain why a thirty-minute delay is acceptable for one revenue table but unacceptable for a fraud detection feed. Now let's move to the final pillar: Assumptions and Known Limitations.
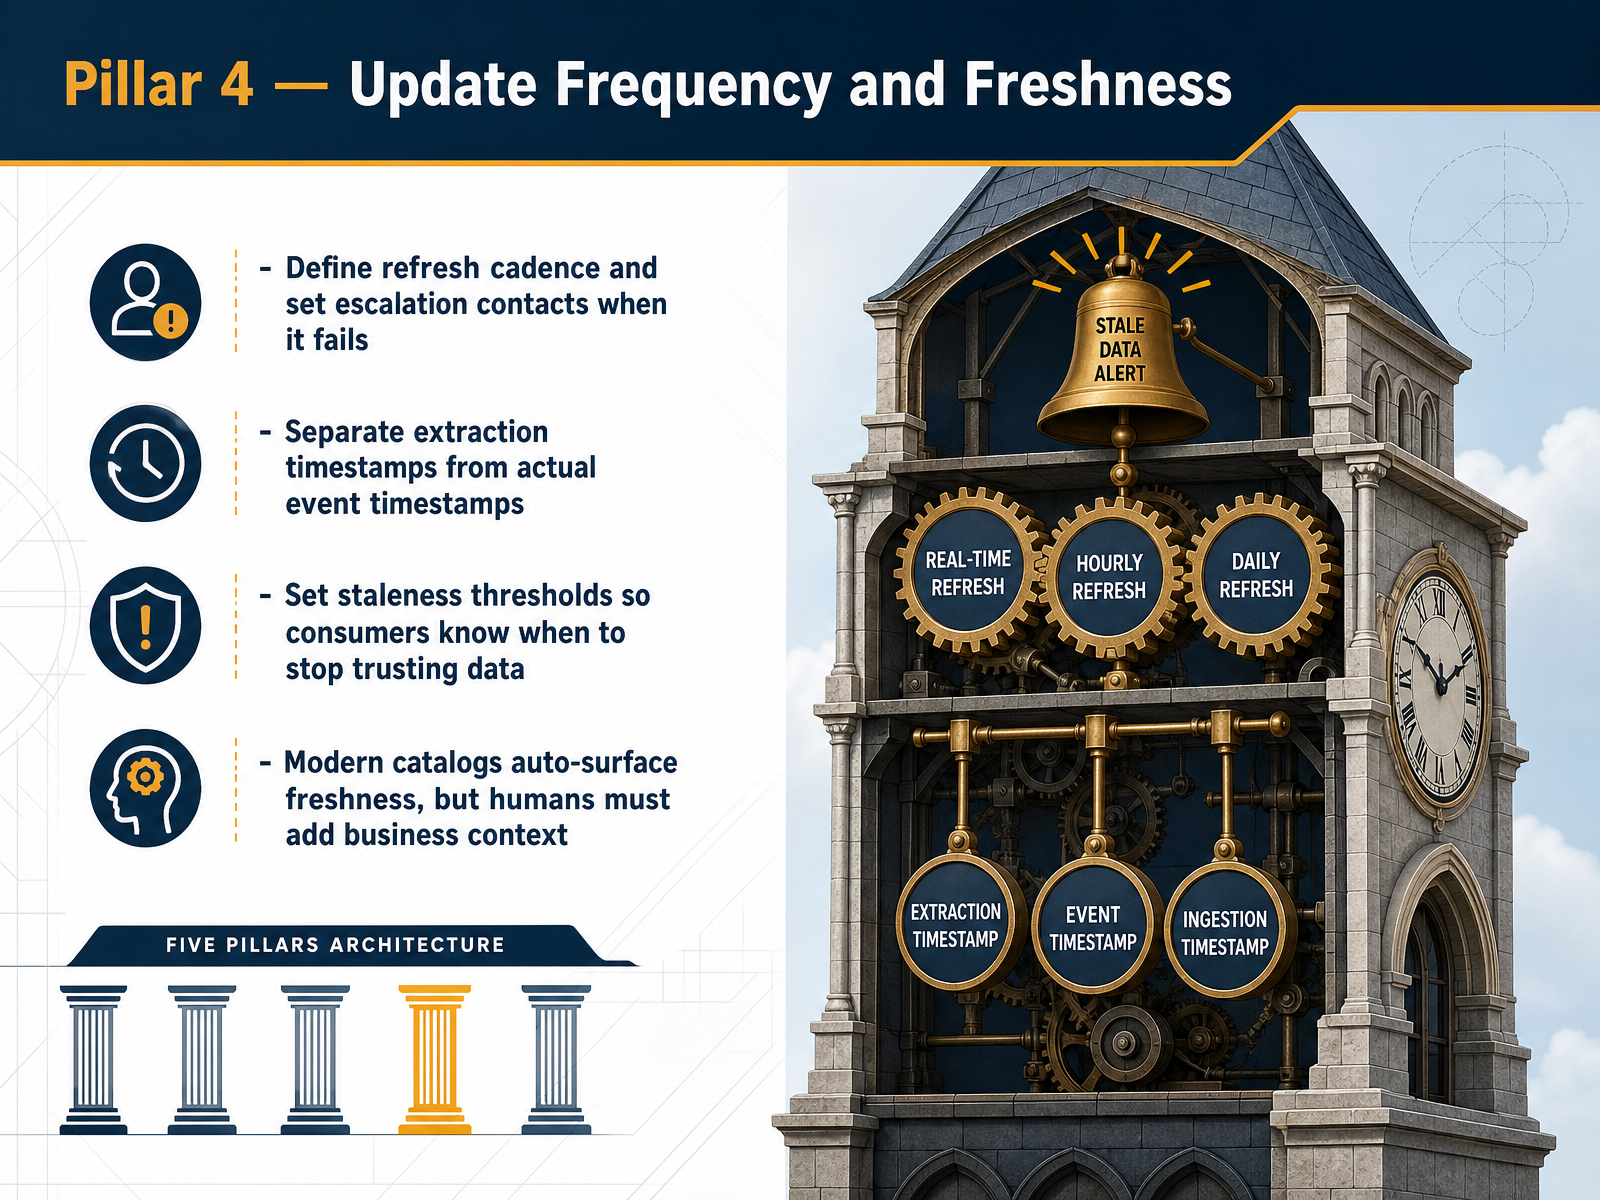 databricks.comcloud.google.comgartner.com+22 min
 - 11Pillar 5 — Assumptions and Known LimitationsNow, the pillar that separates trustworthy data from a ticking clock: assumptions and known limitations. This is where you document everything before it gets misread. That means capturing all formulas, business rules, and filters applied before the data reaches a dashboard or a model. State exactly what a field represents, not what you think it represents. A silent filter, like excluding zero-order customers from a retention model, can break someone's analysis completely. Unwritten assumptions are just as dangerous. For example, one team renamed a column and an AI agent kept querying the old name, got nulls, and defaulted to list price. Six hours later, the team was correcting a one hundred eighty thousand dollar pricing error. The rename took four seconds. The lesson is simple: assumptions must be explicit and versioned. When they change, you must keep a change log. This is the documentation that prevents three-day fire drills and customer-facing mistakes. It is the artifact that says: here is what we know, here is what we do not know, and here is what happens if something shifts. Next, let's look at where documentation actually lives.
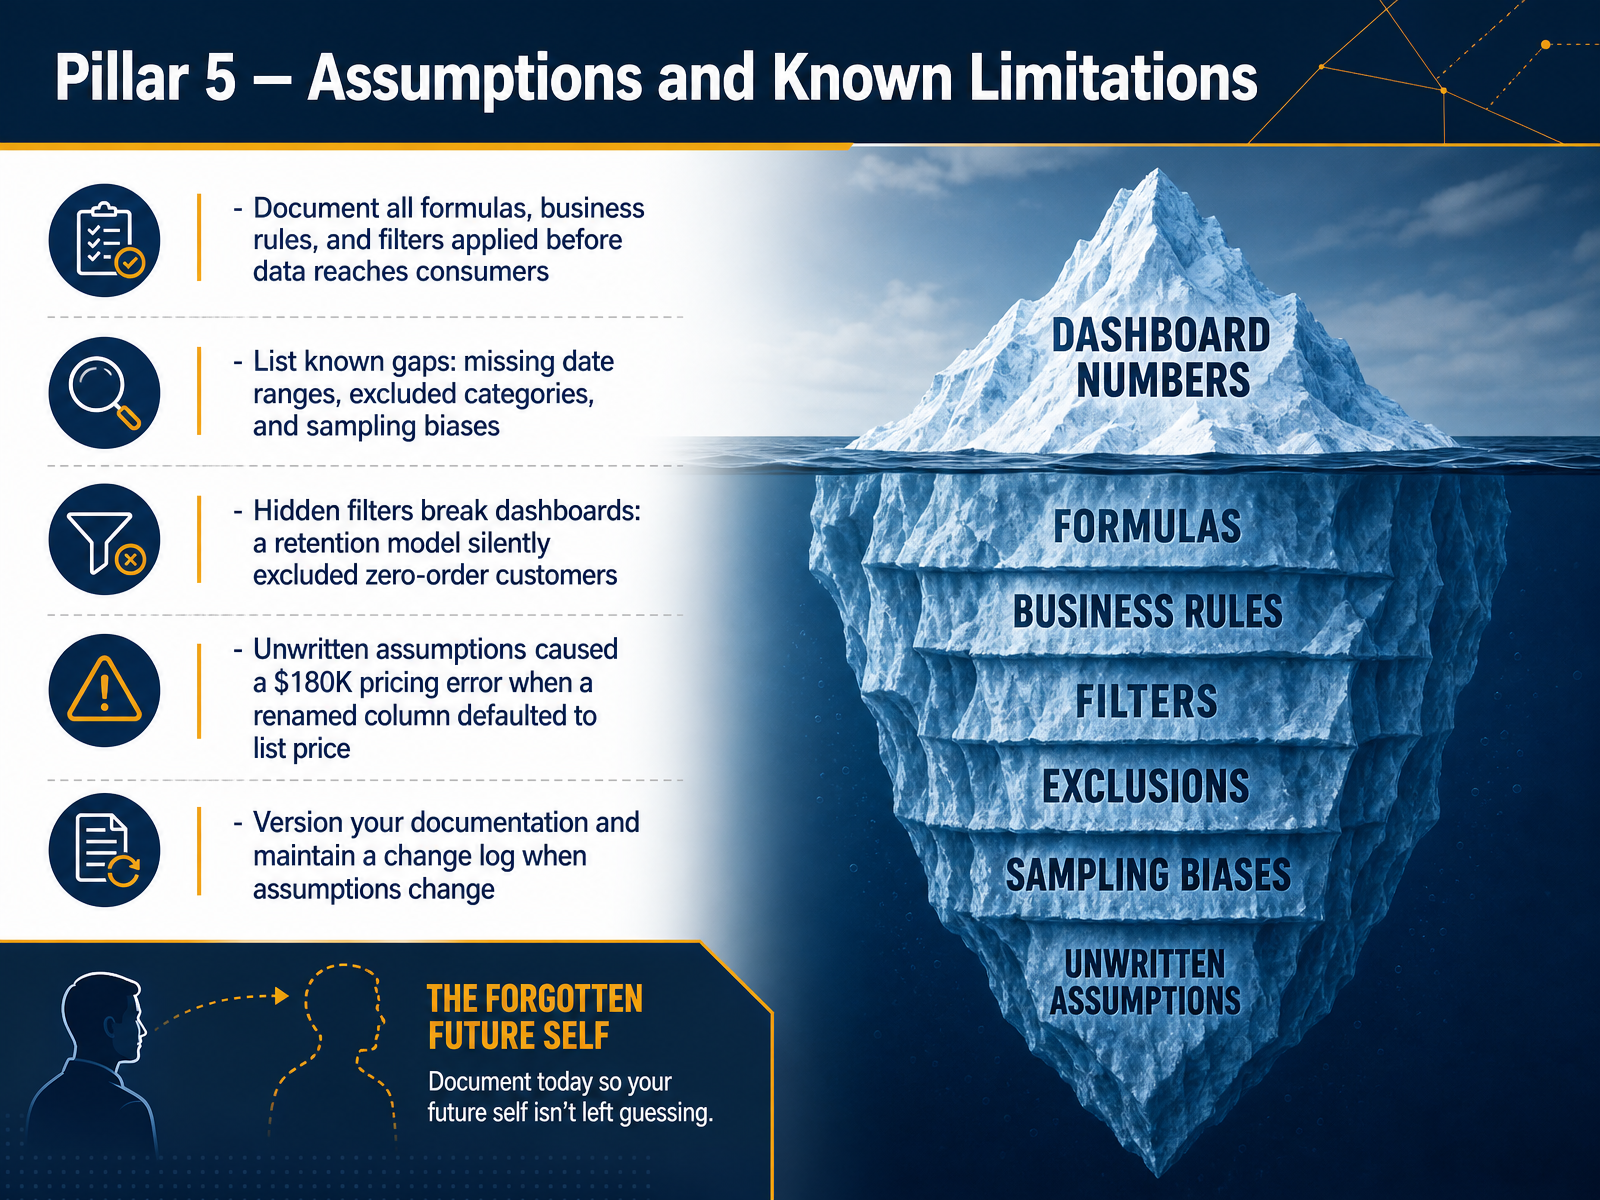 medium.comdev.todev.to+21 min
 - 12Where Documentation LivesNow, where does all this documentation actually live? You have several practical options. Data catalogs, wikis, repos, standard README files, and schema comments. Each one has a strength. The trick is to use them together. Schema comments stay right next to the data, so they are the first thing someone sees when they open a table. That immediate context is powerful. But schema comments alone are hard to search. That is where data catalogs come in. Catalogs let humans discover data across the whole organization, using plain business language. So, use both. Put your core field definitions and source lineage in a catalog, and also maintain them as schema comments for quick, in-place access. A key practice here is to treat your docs like code. Review them in pull requests. Automate checks, for example with your CI pipeline, to flag when documentation is stale. And when you are starting out, keep it sustainable. Focus first on clear field definitions and accurate source lineage. Those two things alone build a foundation of trust. In the next slide, we will look at the modern tools and platforms landscape for 2026.
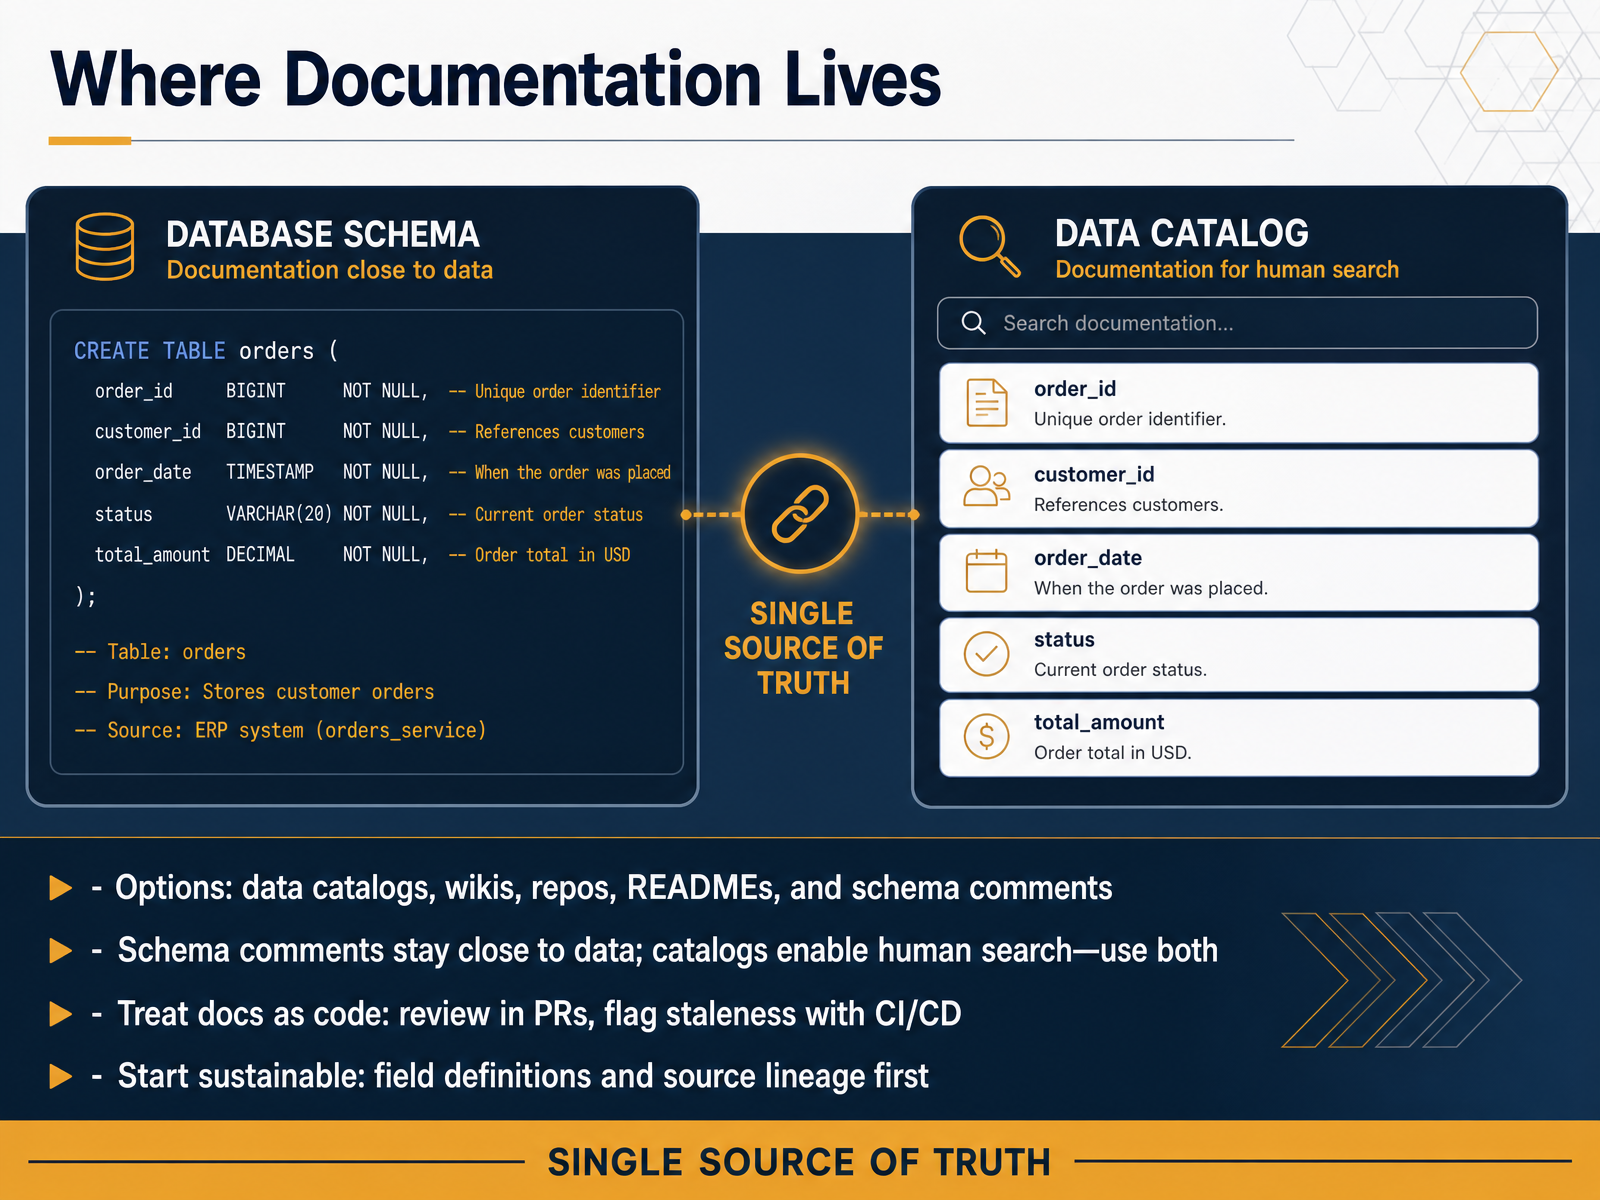 databricks.comcloud.google.comgartner.com+22 min
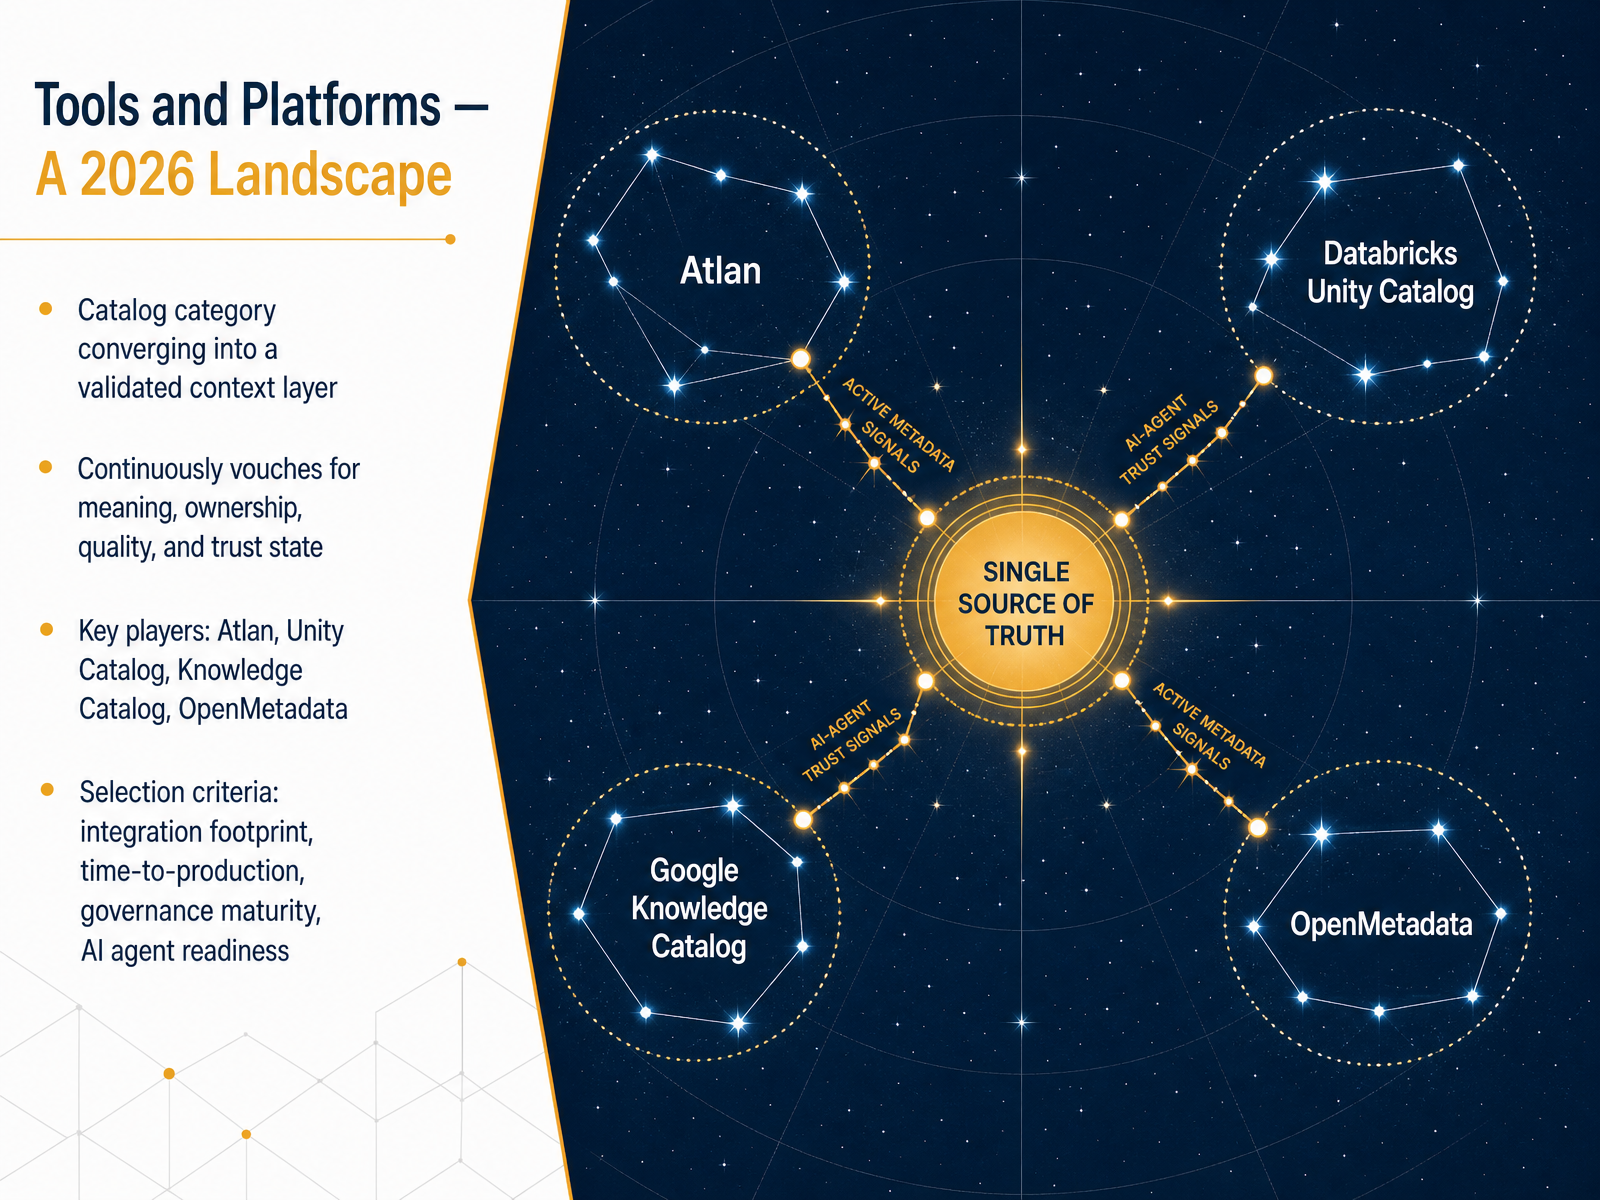
 - 13Tools and Platforms — A 2026 LandscapeNow let’s look at the tooling landscape as it stands in 2026. The catalog category is shifting. Instead of just a searchable inventory, we’re seeing it become a validated context layer. Think of it as a layer that continuously vouches for meaning, ownership, quality, and the overall trust state of every data asset. It’s not just about finding a table anymore; it’s about knowing whether that table is reliable for your specific use case. Key platforms you will see in evaluations include Atlan, Databricks Unity Catalog, Google’s Knowledge Catalog, and the open-source project OpenMetadata. When you select a tool, don’t just look at features. Focus on four criteria: the integration footprint, meaning how easily it connects to your actual stack; time-to-production, because a tool that takes nine months to deploy can stall your entire program; governance maturity, to make sure it supports your policy and compliance needs; and A I agent readiness, which means the catalog can serve trusted context directly to automated agents that need it. Let’s carry these platform insights forward and talk about building a documentation habit.
 databricks.comcloud.google.comgartner.com+22 min
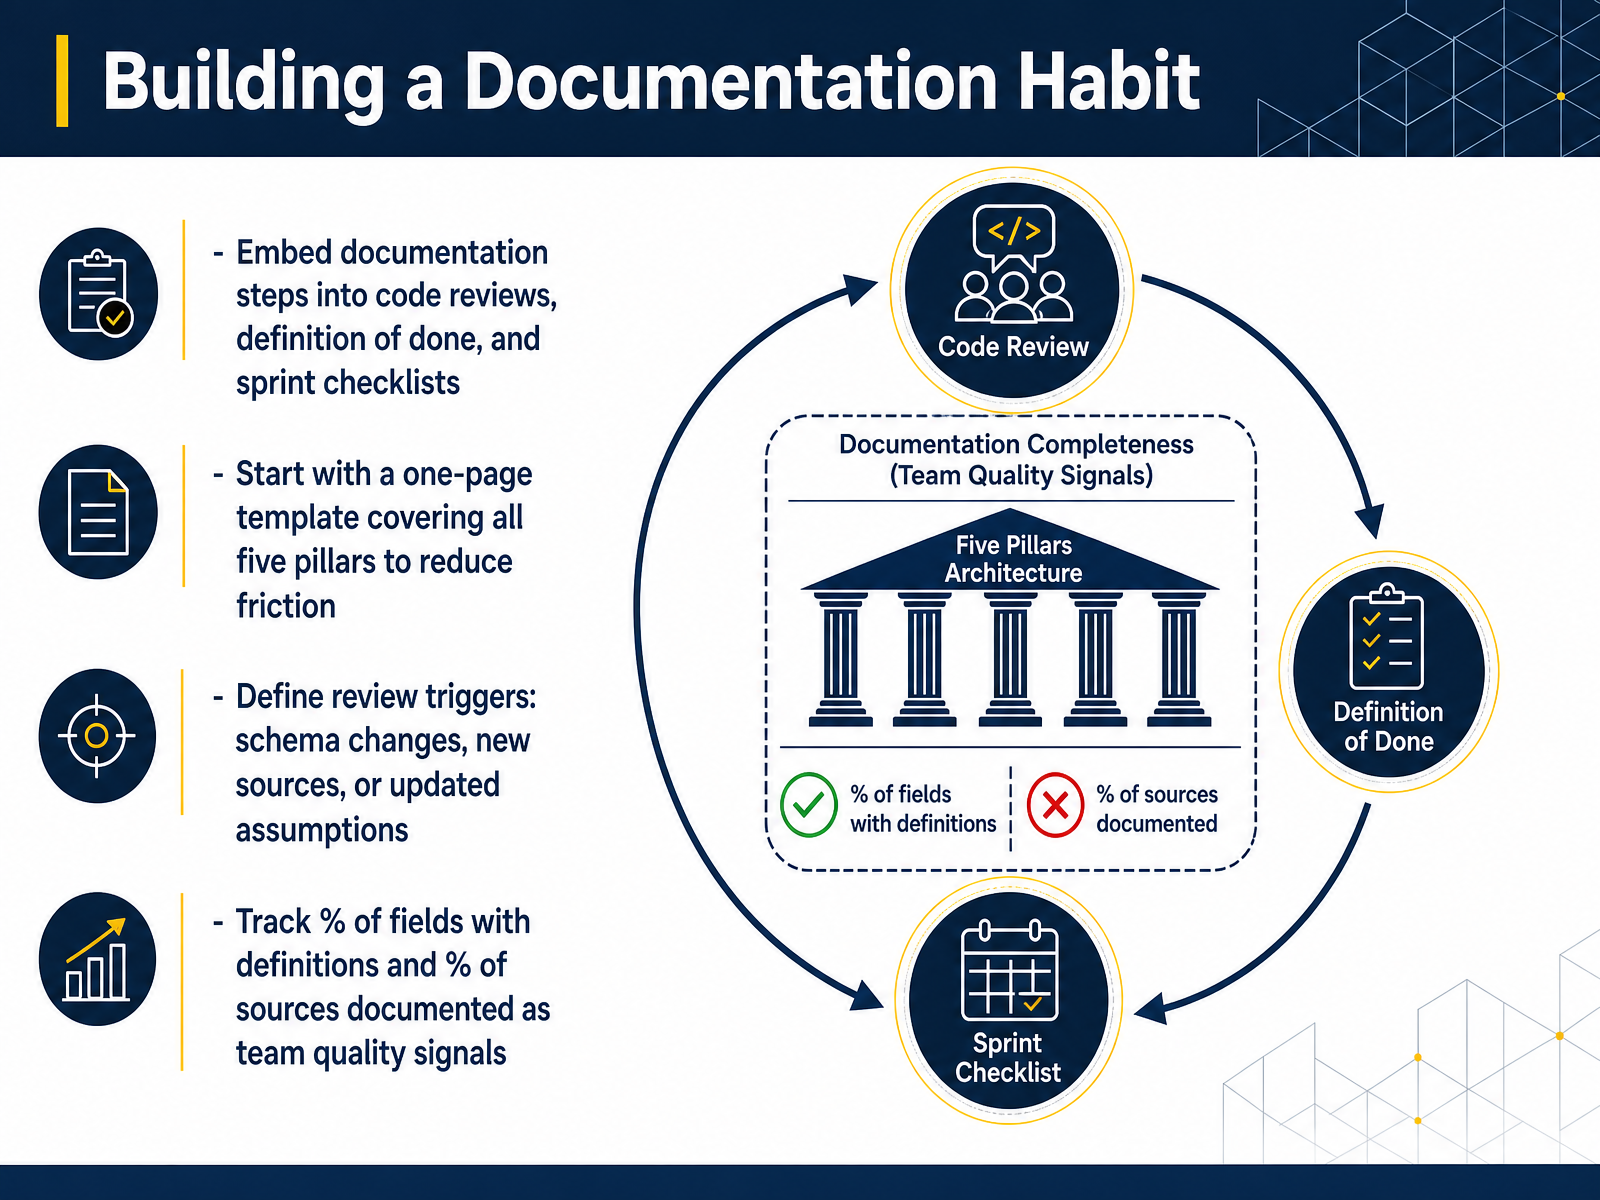
 - 14Building a Documentation HabitBuilding a documentation habit doesn't mean you have to overhaul everything overnight. Instead, weave lightweight checks into processes your team already uses. For example, add a documentation step to your code review checklist. Include field definitions in your definition of done. Add a quick one-line prompt to your sprint checklist: 'Were any data sources or assumptions updated?' To lower the barrier, start with a simple one-page template that covers all five pillars: definition, source, unit, update frequency, and assumptions. Make it so easy that filling it out becomes automatic. Then, define clear triggers. When does the team need to stop and document? A schema change is an obvious trigger. A new data source is another. An updated business assumption is a third. Write these triggers down so the decision is already made before the pressure of a deadline hits. Finally, make progress visible. Two simple team signals work well here. Track what percentage of your fields have complete definitions, and what percentage of your sources are documented. These numbers won't be perfect at first, but watching them climb builds momentum and turns documentation into a shared win. Now that we've talked about building the habit, let's move from process to practice. The next slide covers Immediate Actions to start with one dataset.
 scribe.compaligo.netmedia.bitpipe.com+22 min
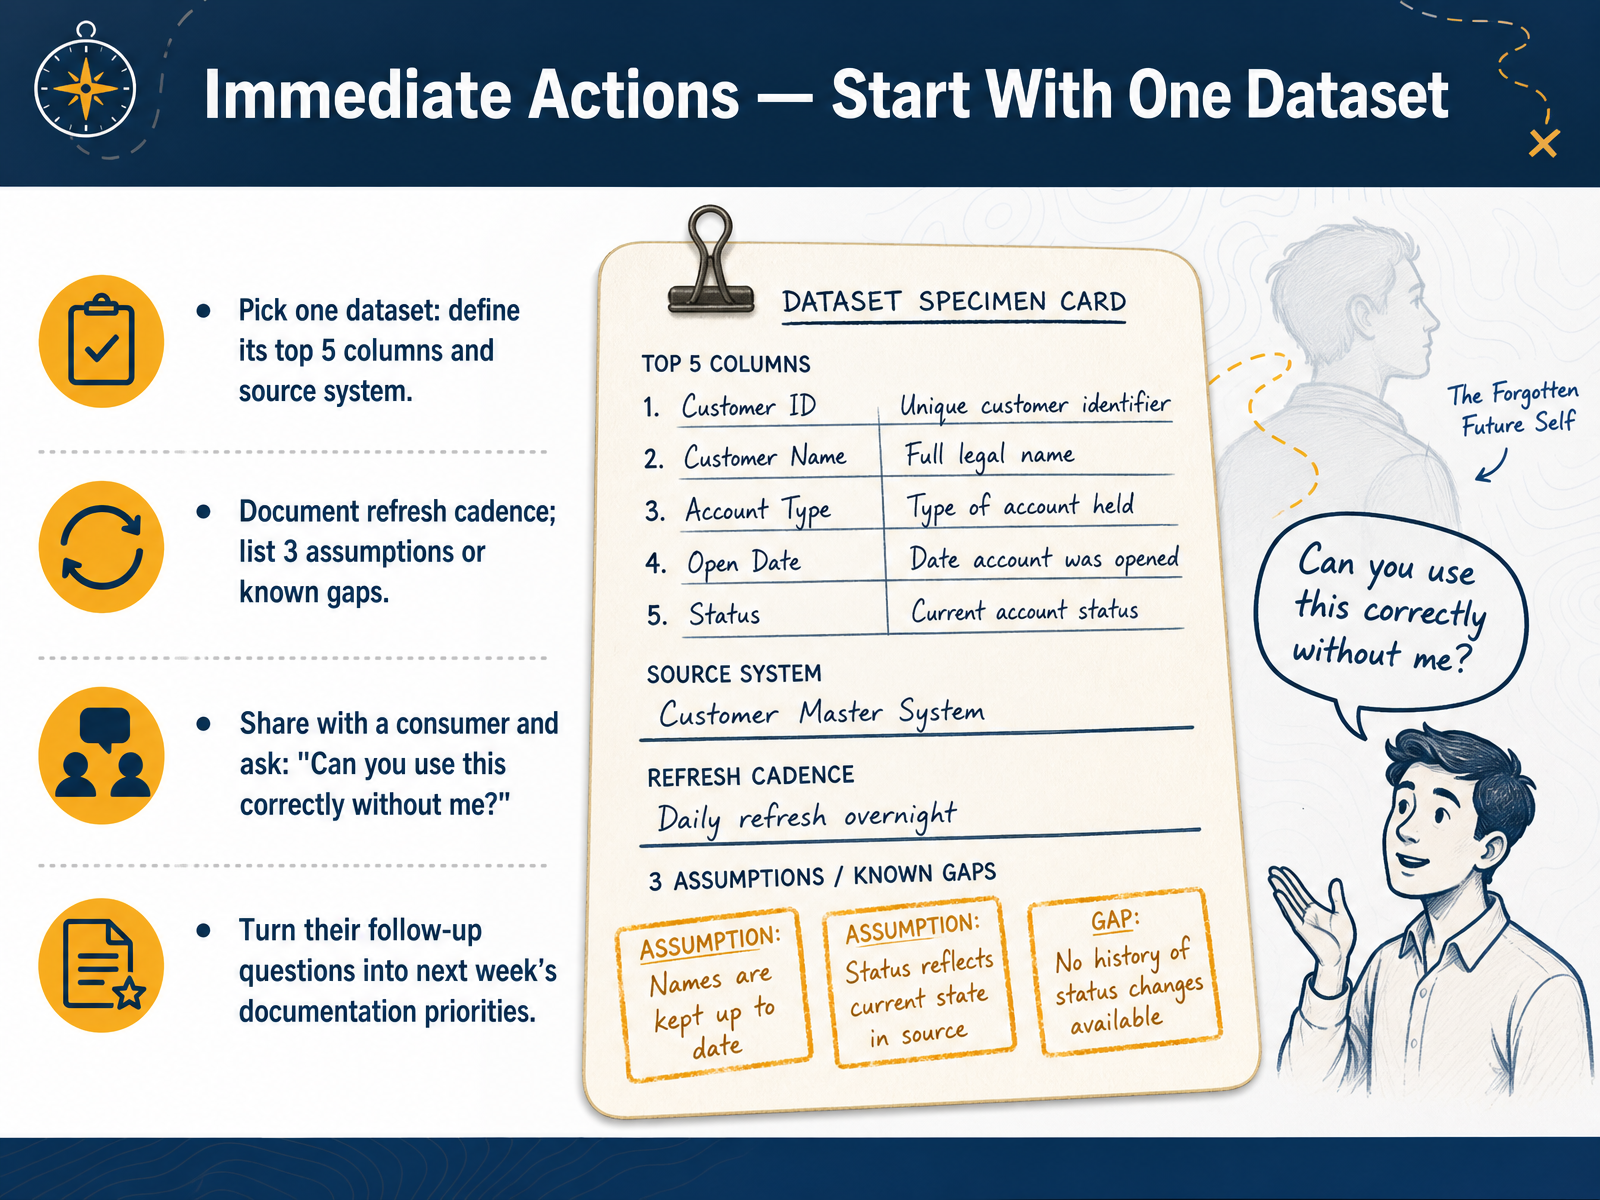
 - 15Immediate Actions — Start With One DatasetLet's turn these principles into an immediate action you can take this week. Start with just one dataset. Pick a dataset you already use, and define its top five columns and the source system it comes from. That alone removes a lot of guesswork. Next, document the refresh cadence. How often does the data update? Daily, hourly, or on a specific schedule? Then list three assumptions or known gaps. These are things like 'null values mean the transaction was canceled' or 'time stamps are in UTC.' Now comes the most important step. Share this one-page documentation with someone who actually uses the data. Ask them directly, 'Can you use this correctly without me?' Listen carefully to their follow-up questions. Those questions tell you exactly what is still unclear. Use those questions to set your documentation priorities for next week. That keeps your work focused on what consumers really need to know. In our final slide, we'll bring everything together with a summary and clear next steps.
 2 min
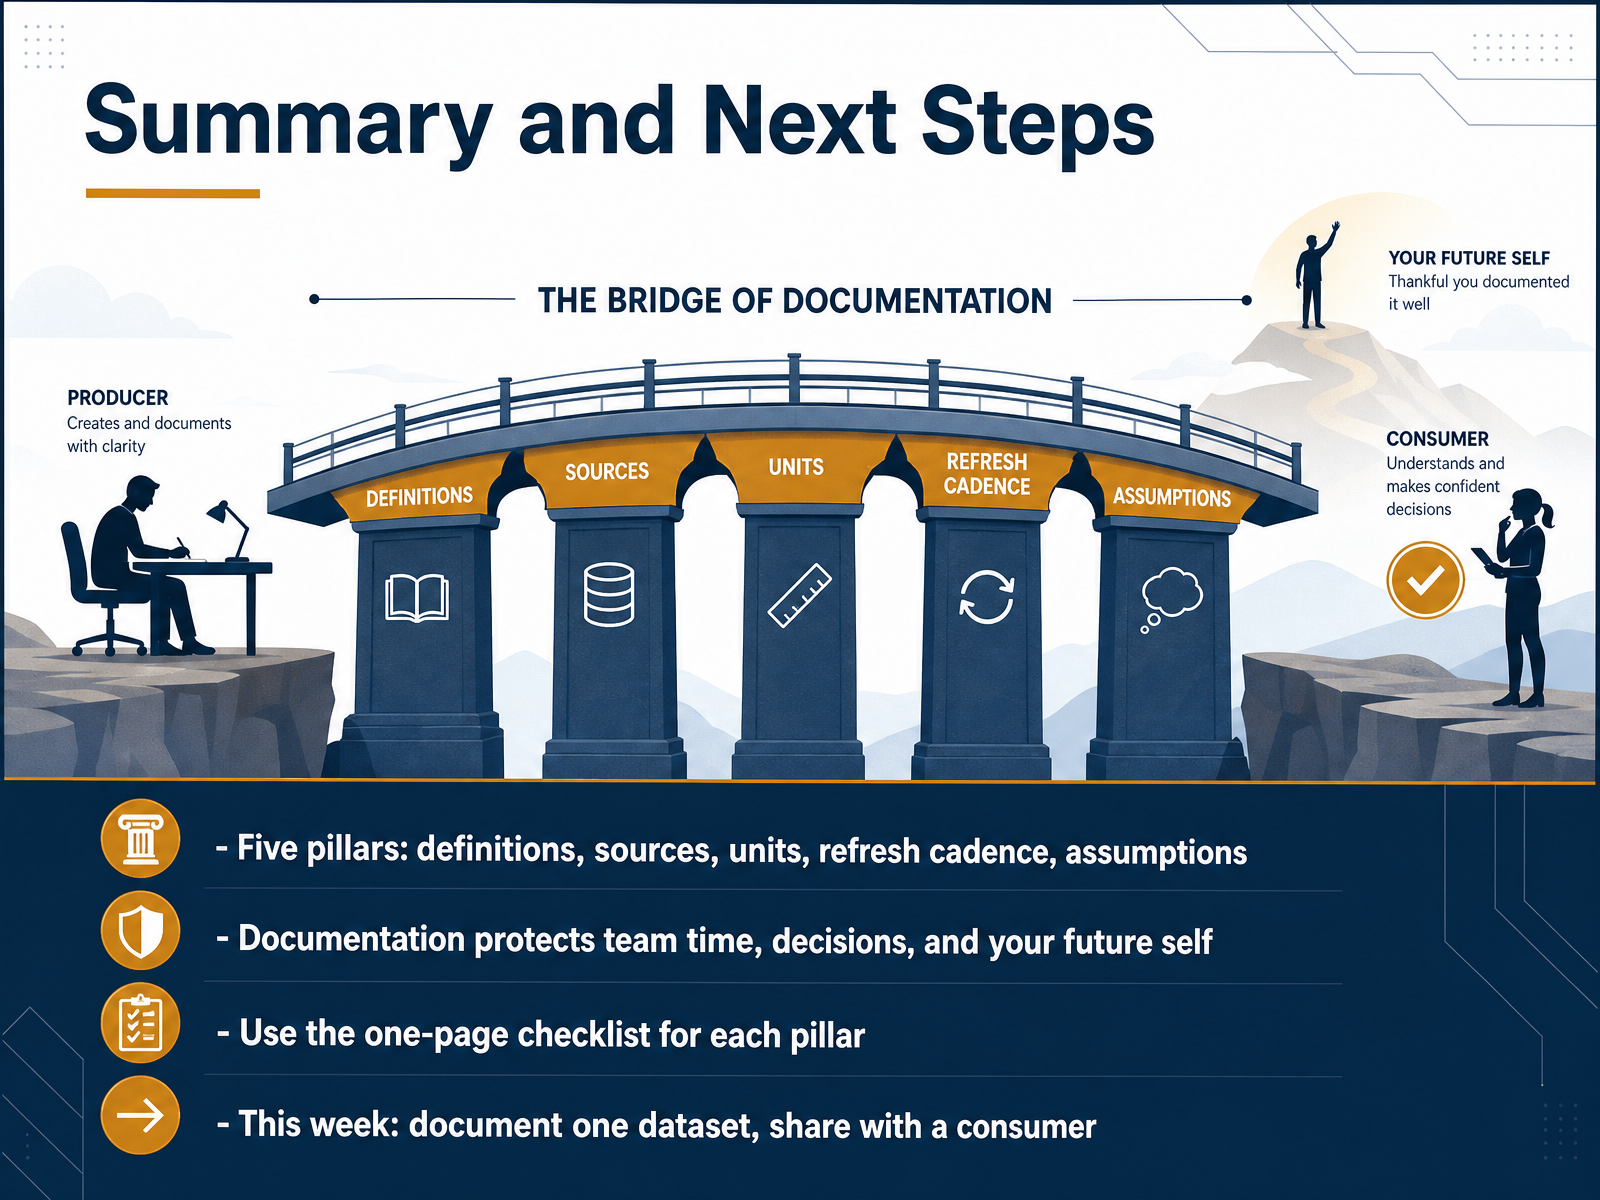
2 min - 16Summary and Next StepsWe have covered the five pillars of trustworthy data documentation: clear definitions, transparent sources, explicit units, reliable refresh cadence, and documented assumptions. These five practices protect your team's time, strengthen everyday decisions, and will save your future self from second-guessing. To make this stick, use the one-page checklist we reviewed. Go through each pillar one at a time. This week, pick one dataset you own, document it fully, and share it with at least one person who consumes that data. Watch their reaction. You will notice fewer questions, fewer misunderstandings, and more confidence. Thank you for investing this time in practical clarity. Start small, finish the week with one well-documented dataset, and build the habit from there.
 1 min
1 min
Take the deck with you
Download this course as a file — free, no sign-up needed.
- PDF handoutEvery slide page, ready to print or share.17 pages · 5.2 MBDownload
- Narrated PowerPointThe deck that presents itself — every slide carries the digital human's narration video.17 pages · 17.8 MBDownload
- PowerPoint slidesThe full deck as a .pptx — open it in PowerPoint, Keynote, or Google Slides.17 pages · 5.1 MBDownload
Free to use in your own training — please keep the PersonWise credit page at the end.
Have your own deck? Turn it into a course
Sources consulted
Web sources consulted while building this course.
- ROI Report — scribe.com
- Scaling smarter: structured AI-ready content that delivers ROI: Customer Insights Report 2025 | Paligo — paligo.net
- State of Data Analysts in the Age of AI — media.bitpipe.com
- State of Docs Report 2025 – Purchase decisions and business impact — stateofdocs.com
- https://www.stateofdocs.com/2025/documentation-metrics-and-measurement — stateofdocs.com
- How One Renamed Column Broke a $2M AI Agent | by Arjunkumar kansagara | Apr, 2026 | Medium — medium.com
- The Hidden Cost of Poor Project Documentation on GitHub - DEV Community — dev.to
- The $327 Million Implicit Contract - DEV Community — dev.to
- The Real Cost of a Wrong API Example in Financial Services — ekline.io
- What a wrong API example costs healthtech companies — ekline.io
- Unity Catalog | Databricks — databricks.com
- Knowledge Catalog (formerly Dataplex) | Google Cloud — cloud.google.com
- Best Metadata Management Solutions Reviews 2026 — gartner.com
- Best Data Catalog Tools in 2026: A Practitioner's Buyer Guide — dqlabs.ai
- Alation Data Catalog | AI-Powered Data Discovery & Governance — alation.com
- Mars Climate Orbiter — discovery.larc.nasa.gov
- A System Fails at Mars, a Spacecraft Is Lost | Science — science.org
- Report on Project Management in NASA — discovery.larc.nasa.gov
- Mars Climate Orbiter Team Finds Likely Cause of Loss | NASA Jet Propulsion Laboratory (JPL) — jpl.nasa.gov
- Report on Project Management in NASA — discovery.larc.nasa.gov