Begin
14 pages · ~28 min
Data-Driven Narrative Storytelling Framework
This training teaches the components and application of the Data Driven Narrative Storytelling Framework, helping professionals build clear, persuasive stories from data insights.
A digital instructor presents all 14 pages. Hold “Ask” at any point and ask out loud — the answer comes from this course. No sign-up needed.
What you’ll learn
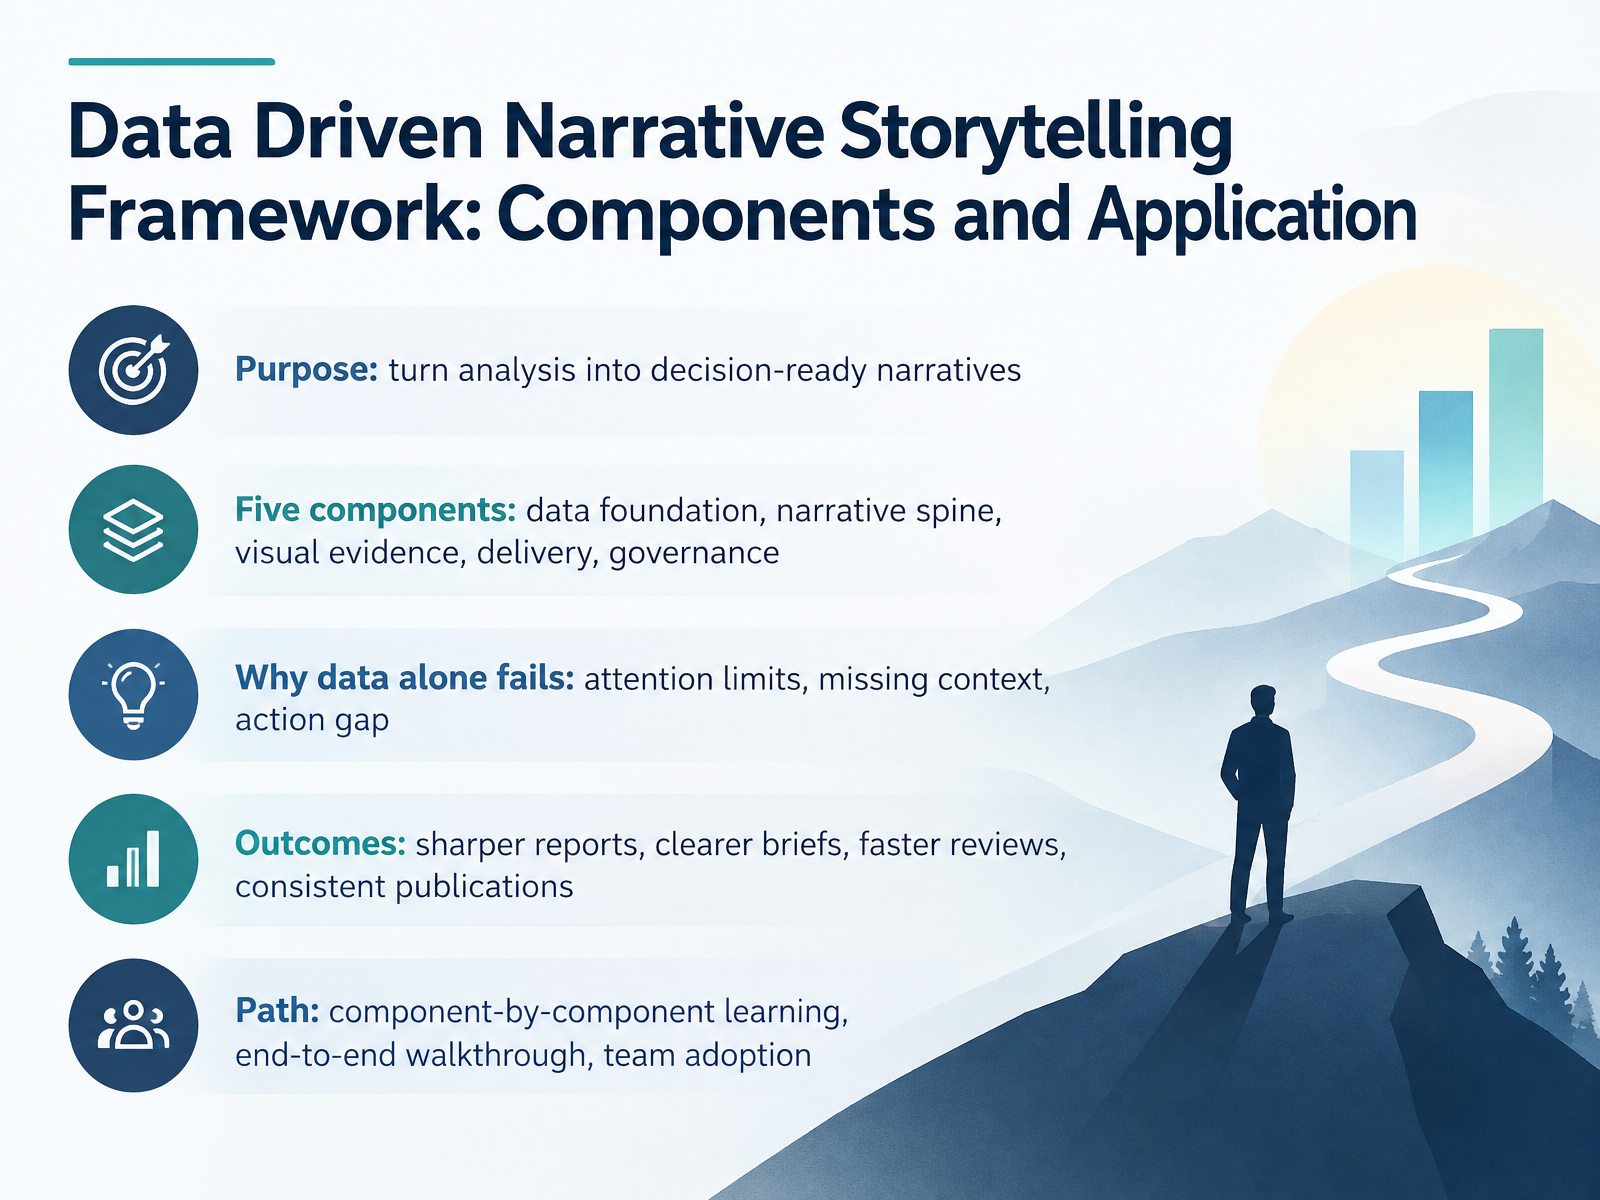
- 01Data Driven Narrative Storytelling Framework: Components and ApplicationWelcome. I'm glad you're here. This course is for analysts, report authors, publishers, and team leads who want their analysis to lead somewhere, not just get read. The goal is a data driven narrative storytelling framework. Its purpose is simple, to turn analysis into decision ready narratives. The framework has five components: data foundation, narrative spine, visual evidence, delivery, and governance. You'll learn each one in turn. First, why does data alone fall short? Three reasons. People have attention limits. Numbers arrive without context. And insight often stops short of action. Picture it in your own review meeting: a strong chart, but no clear decision by the end. That's the action gap. In practice, this framework sharpens reports, clarifies briefs, speeds up reviews, and keeps publications consistent. Our path is component by component first, then an end to end walkthrough, then team adoption. Next, we look at why data alone doesn't persuade.databricks.commicrosoft.comiiba.org+22 min
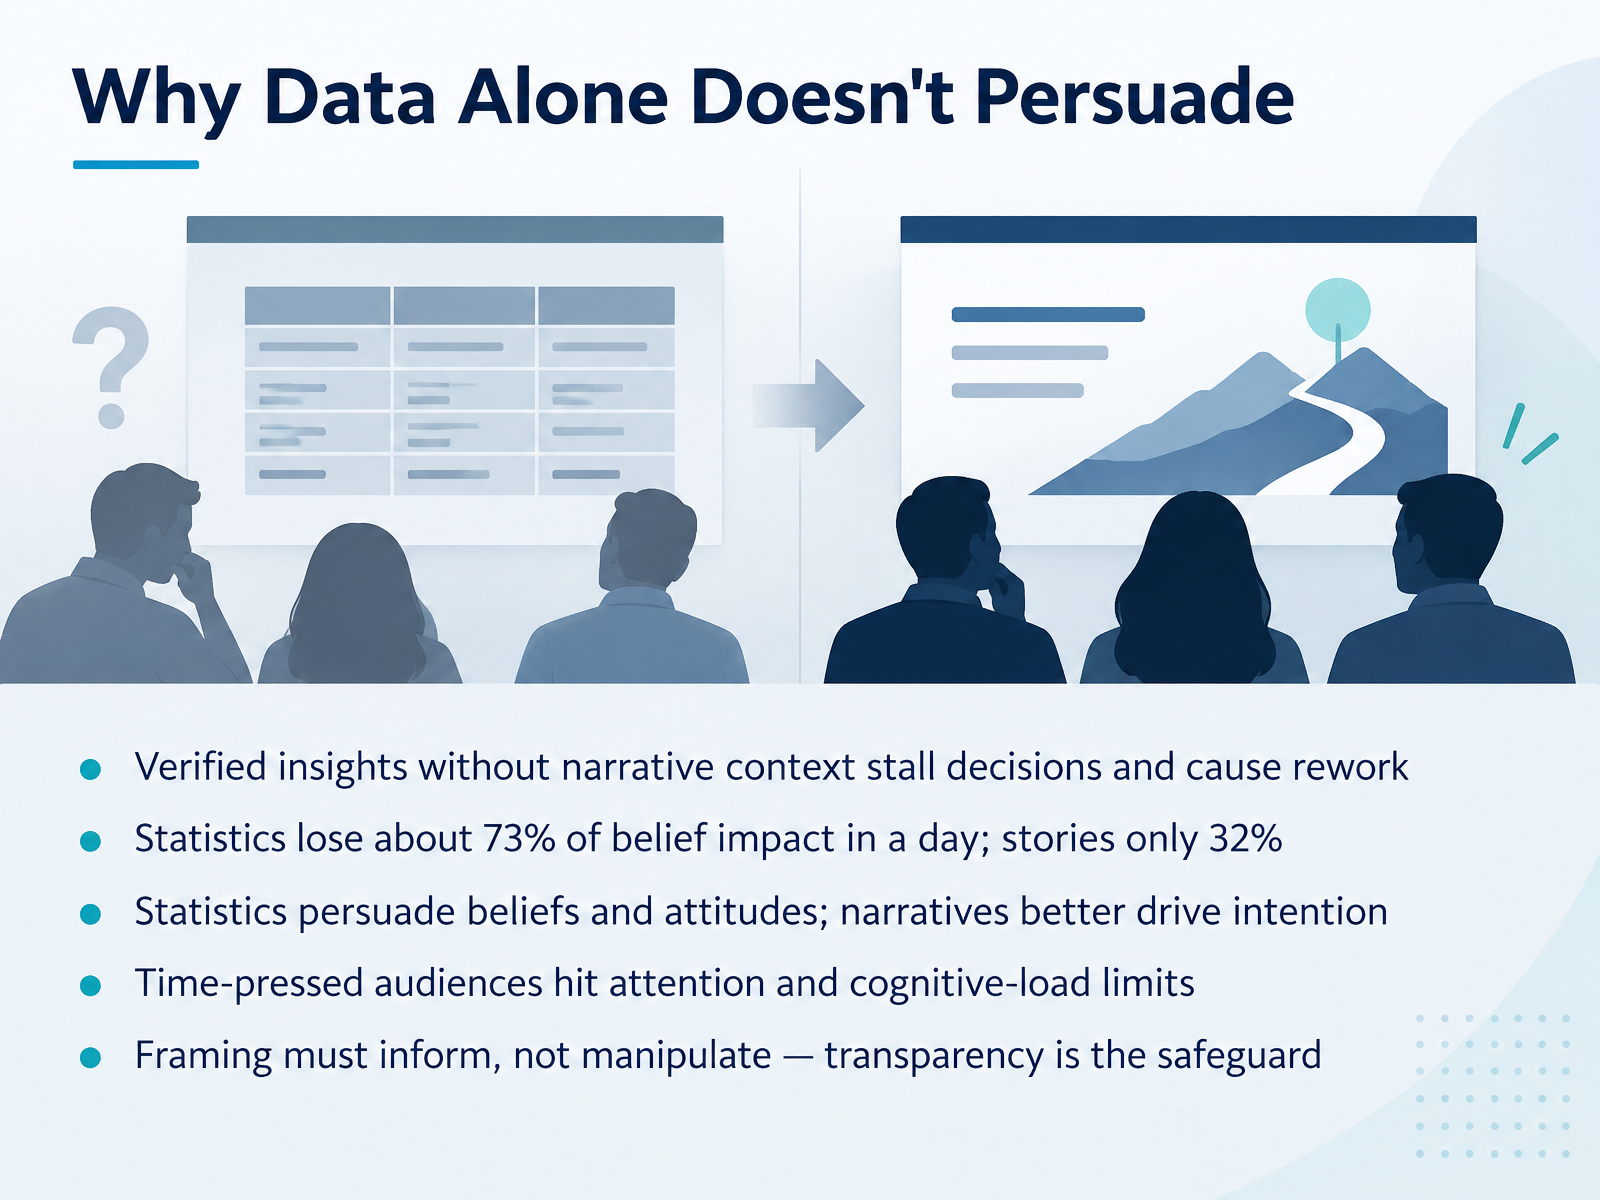
- 02Why Data Alone Doesn't PersuadeLet's look at why data alone doesn't persuade. First, verified insights without narrative context tend to stall decisions and cause rework. A report full of accurate numbers can still leave a review meeting wondering what it means for them. Next, consider memory. Research shows the average impact of statistics on beliefs fades by seventy-three percent over the course of a day, while the impact of a story fades by only thirty-two percent. That matters when your audience reads a draft in the morning and decides in the afternoon. In practice, statistics are strong for shaping beliefs and attitudes, while narratives better drive intention, the will to act. And time-pressed audiences hit attention and cognitive-load limits fast, so structure and storytelling help them stay with you. One safeguard. Framing must inform, not manipulate. Be transparent about what the data shows and what it doesn't. Now let's move on to the Framework at a Glance.
 doi.orgdoi.orgdoi.org+22 min
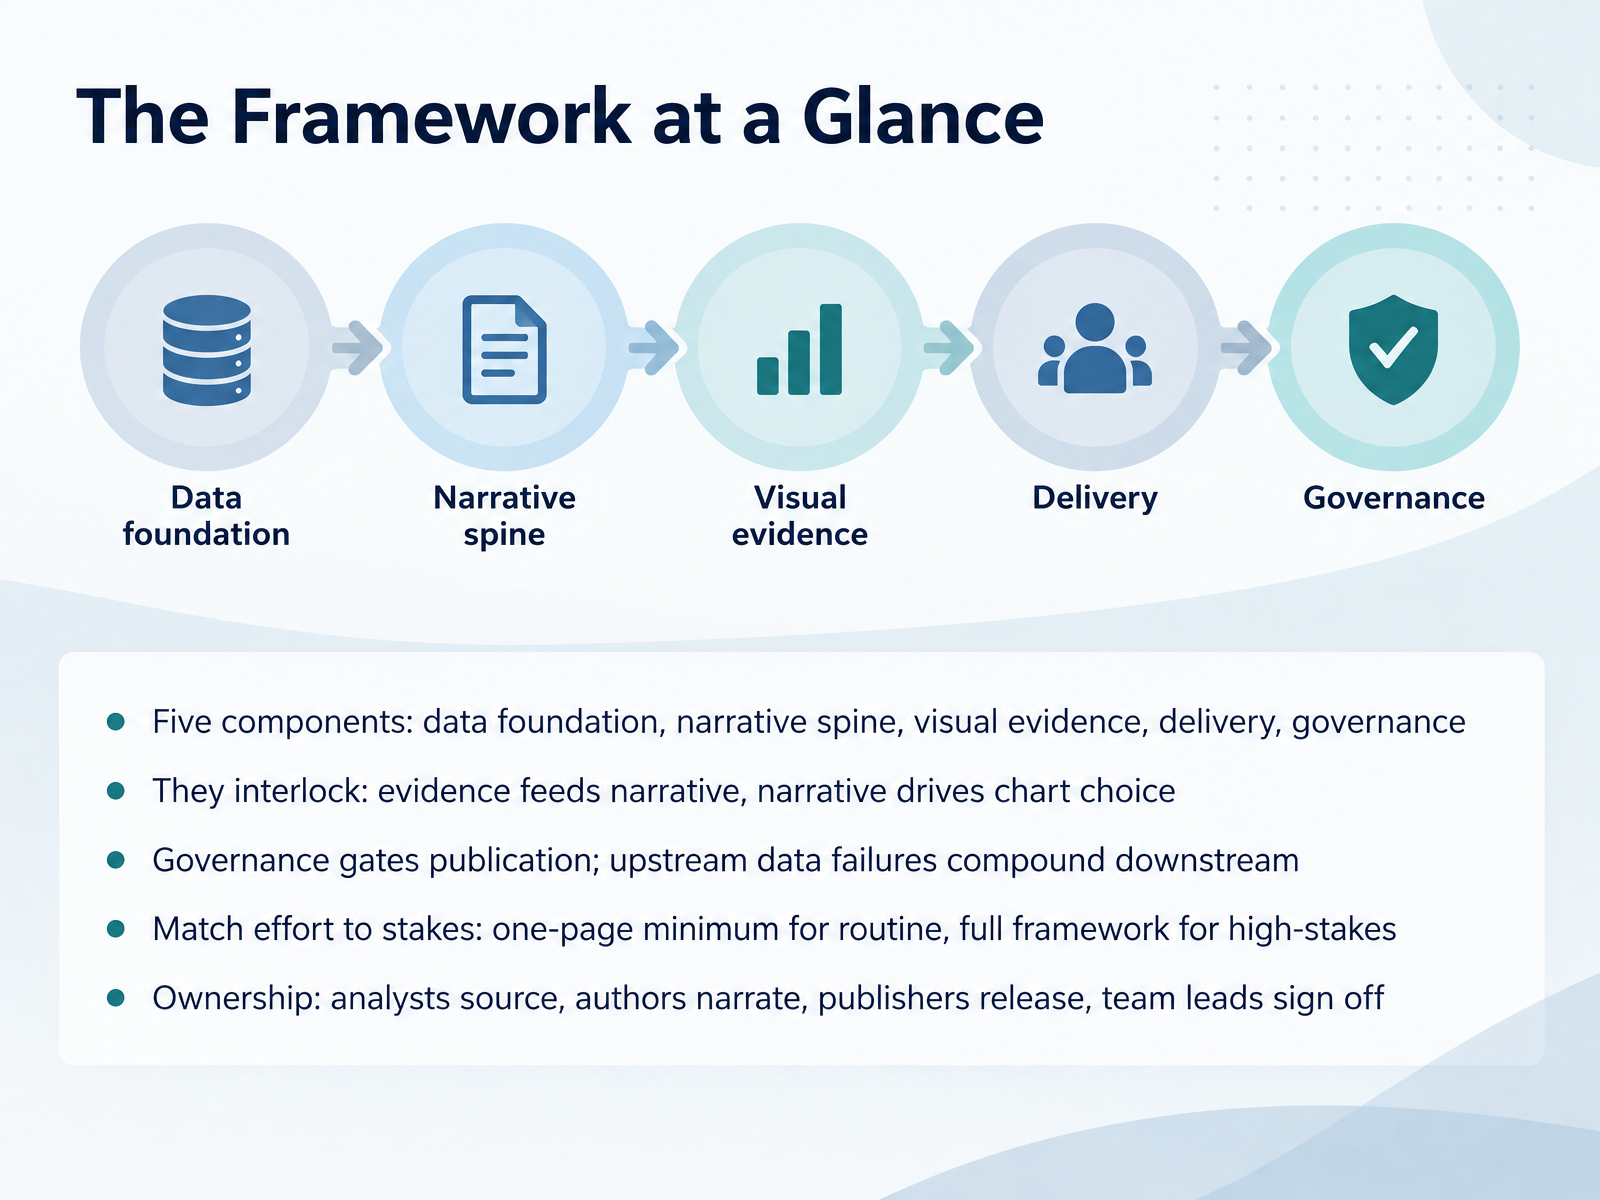
- 03The Framework at a GlanceLet's look at the framework as a whole before we go into each part. It has five components: data foundation, narrative spine, visual evidence, delivery, and governance. A component here simply means one part of the work that has to hold up. First, notice how they interlock. Evidence feeds the narrative, and the narrative drives chart choice, so a chart is picked because it supports the story, not because it looks good. Next, governance gates publication. Nothing goes out until it passes review. And upstream data failures compound downstream, which means a weak source shows up as a wrong chart in the final report. In practice, match effort to stakes. A routine update can be a one-page minimum, while a high-stakes review deserves the full framework. Finally, ownership is clear: analysts source, authors narrate, publishers release, and team leads sign off. Let's start with the first component: Data Foundation and Integrity.
 databricks.commicrosoft.comiiba.org+22 min
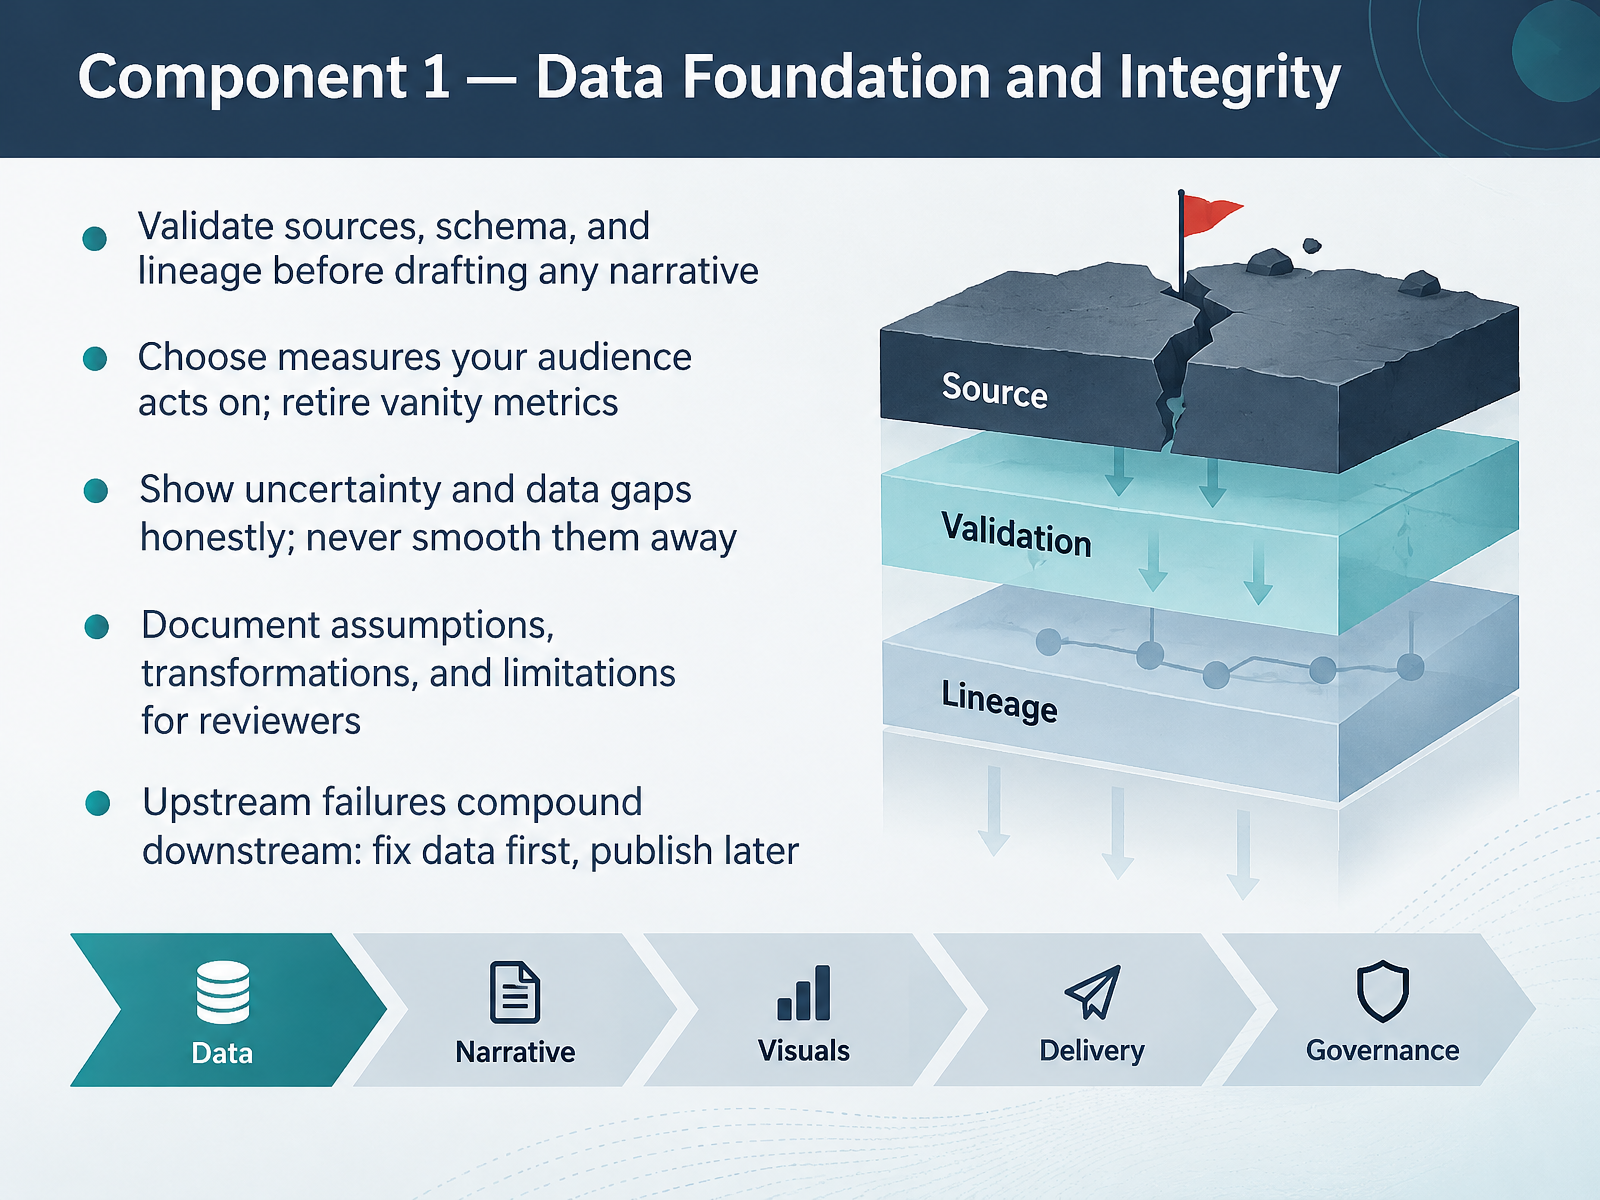
- 04Component 1 — Data Foundation and IntegrityNow we move to the first component: data foundation and integrity. Before you draft a single sentence of narrative, validate your sources, your schema, and your lineage. In practice, that means checking where each column came from, how it was transformed, and whether the units and categories are consistent. Next, choose measures your audience actually acts on, and retire vanity metrics that look impressive but change no decision. When you hit a data gap, show it honestly and label the uncertainty rather than smoothing it away. Document your assumptions, transformations, and limitations so reviewers can follow your reasoning in a report draft or review meeting. And remember that upstream failures compound downstream. Fix the data first, then publish. That discipline protects your credibility with every audience. Component 2, Building the Narrative Spine, comes next.
 nces.ed.govuaskos.orgdata.europa.eu+21 min
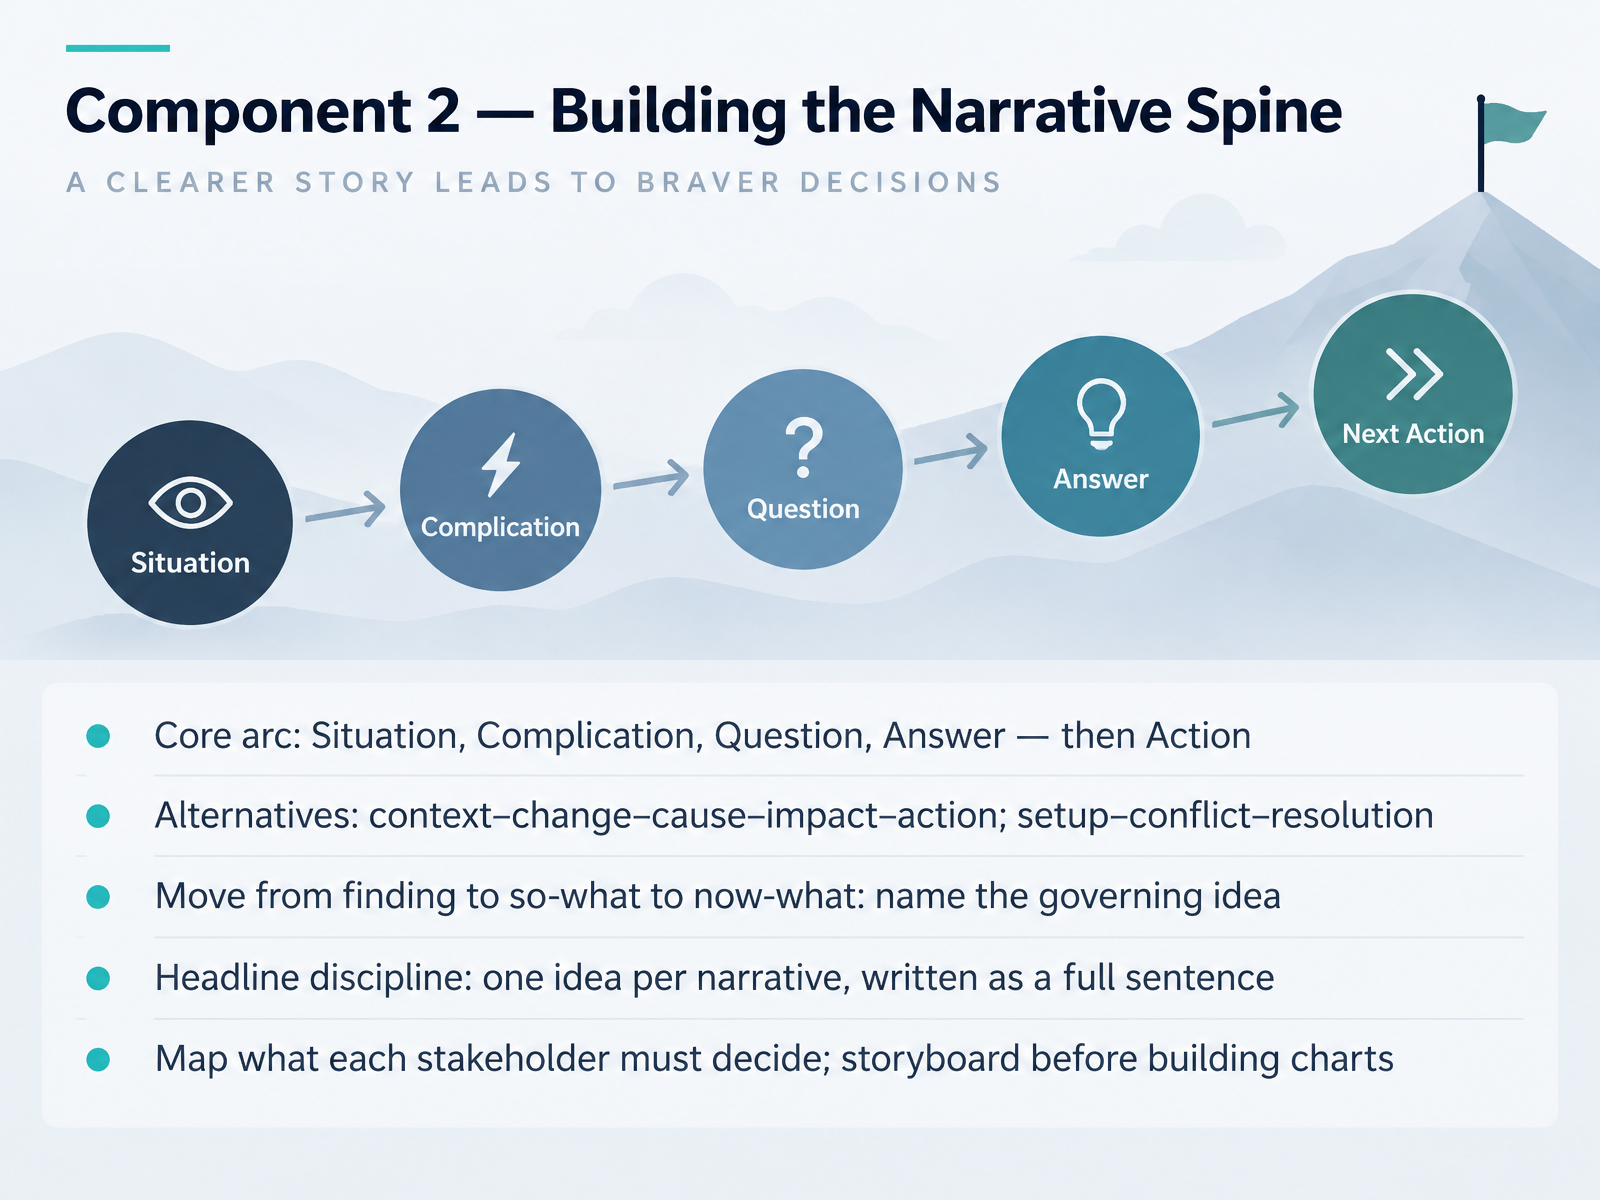
- 05Component 2 — Building the Narrative SpineNow let's build the narrative spine. The core arc many analysts use is Situation, Complication, Question, and Answer, followed by Action. The situation is the shared baseline. The complication is what changed. The question frames what must be decided. The answer resolves it, and the action tells people what to do next. You can swap in alternatives, such as context, change, cause, impact, and action, or setup, conflict, resolution. The structure matters less than the movement. Move from what you found, to the so-what, to the now-what, and name the governing idea in one full sentence. That is your headline. One idea per narrative. In practice, take your report draft and map what each stakeholder must decide. Then storyboard before you build any charts. Keeping that order saves rework at the publishing deadline. Next, we look at Component 3, Visual Evidence That Supports the Story.
 doi.orgdoi.orgslidescience.co+22 min
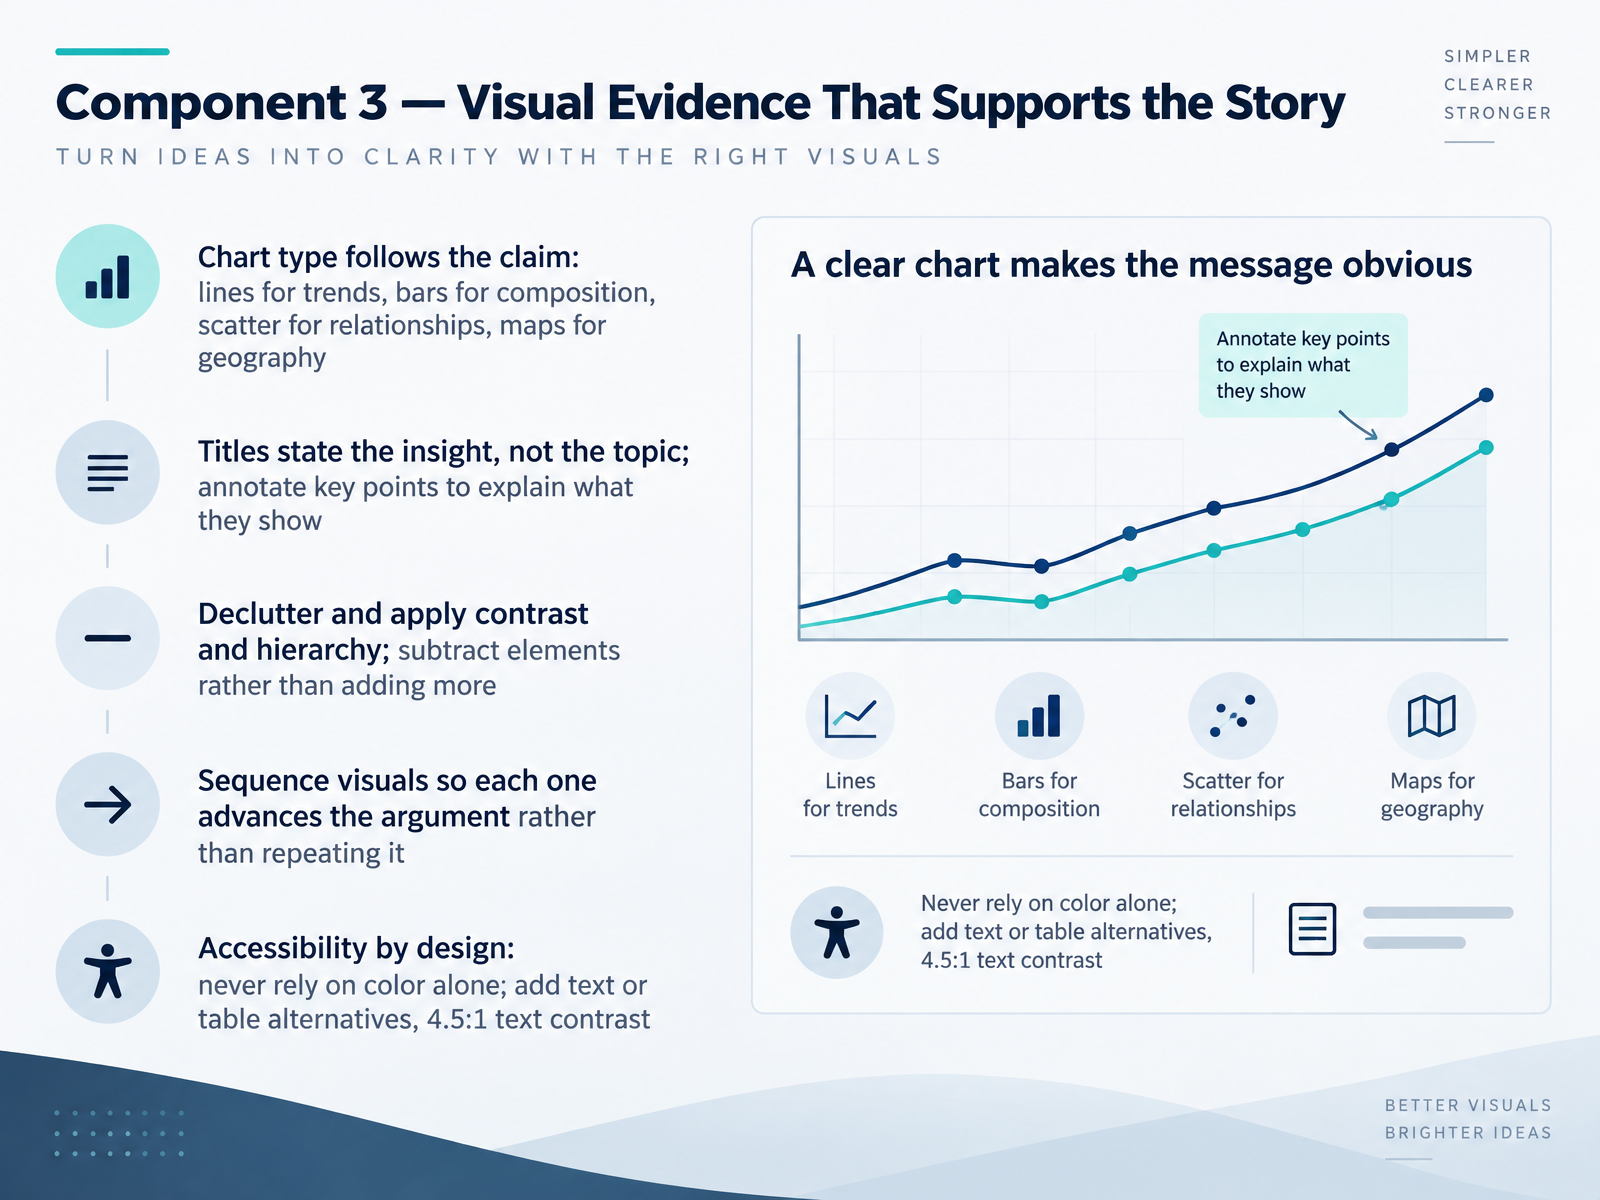
- 06Component 3 — Visual Evidence That Supports the StoryNow let's look at the third component: visual evidence that supports the story. In practice, the chart type follows the claim. Use lines for trends over time, bars for composition, scatter plots for relationships, and maps when geography matters. Next, write titles that state the insight, not just the topic, and annotate key points so readers know what they show. Then declutter. Apply contrast and hierarchy, and subtract elements rather than adding more. Sequence visuals so each one advances the argument instead of repeating it. Accessibility is by design: never rely on color alone, add text or table alternatives, and keep text contrast at four point five to one. Think of your next report draft. Does each chart make one clear claim? If you strip away color, can a reader still understand it? Those questions keep your visual evidence honest and useful. Next, we move to Component 4, Delivery and Stakeholder Engagement.
 2 min
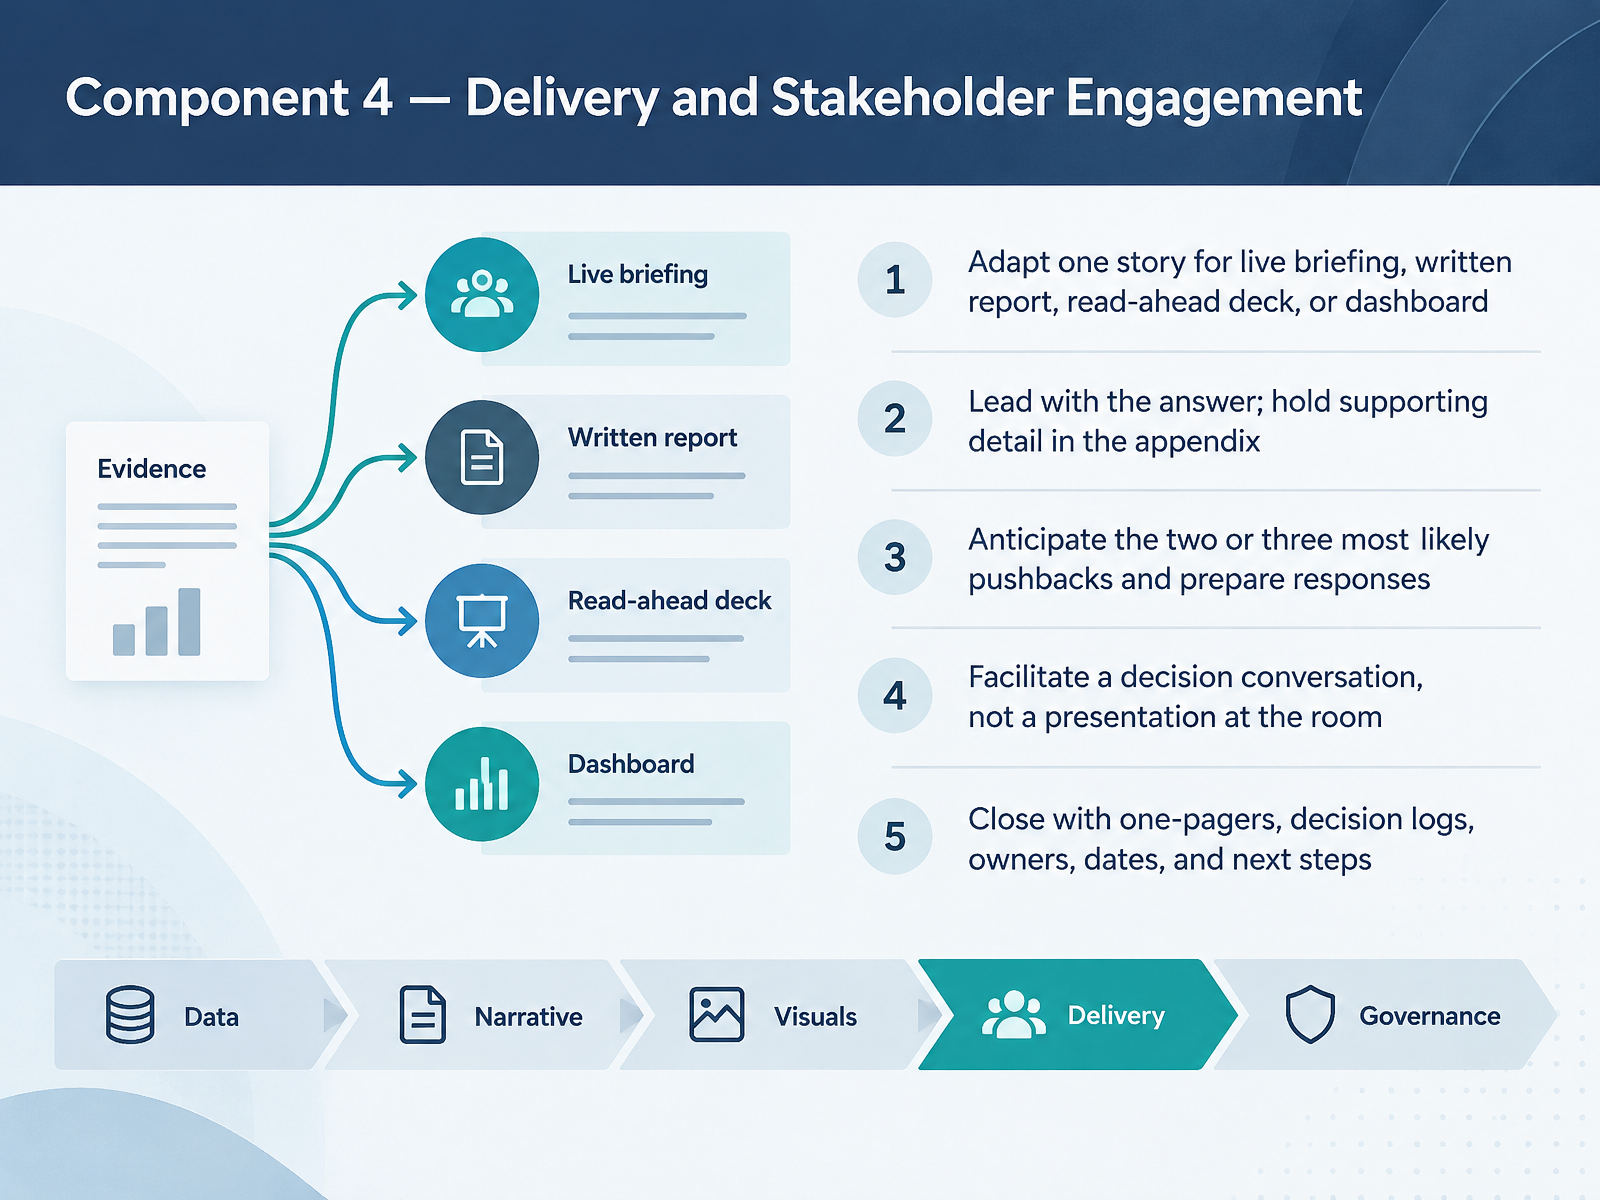
- 07Component 4 — Delivery and Stakeholder EngagementNow we come to component four: delivery and stakeholder engagement. This is where the story actually meets the room. First, adapt one story to the format. The same narrative works as a live briefing, a written report, a read-ahead deck, or a dashboard, but each format changes how much you explain and where you place detail. Next, lead with the answer. State your finding or recommendation up front, and hold supporting detail in the appendix for the questions that follow. In practice, anticipate the two or three most likely pushbacks and prepare a short response for each. Then facilitate a decision conversation, not a presentation at the room. Ask what people need to decide, and work toward it together. Close with concrete artifacts: a one-pager, a decision log, named owners, dates, and next steps. That close is what turns a briefing into action. Next, we look at component five: governance, review, and responsible use.
 2 min
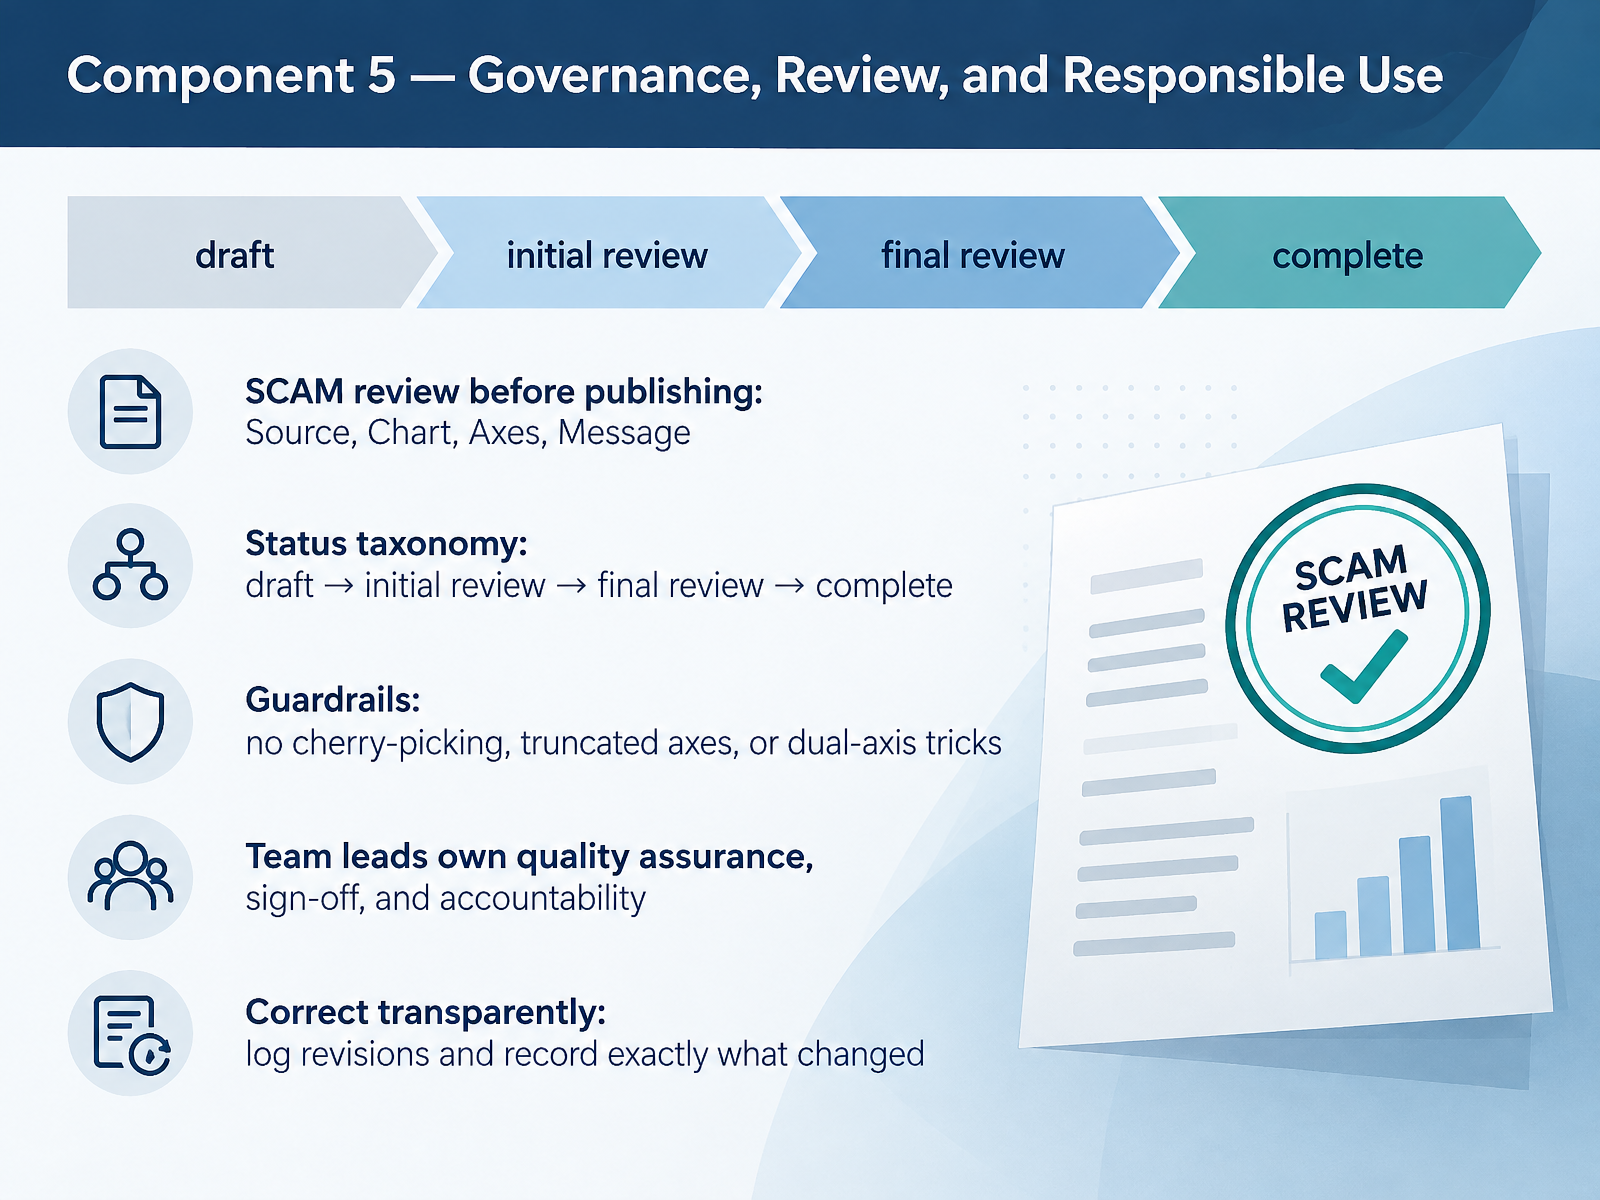
- 08Component 5 — Governance, Review, and Responsible UseNext, let's look at component five. Governance, review, and responsible use keeps every narrative trustworthy. Before publishing, run a SCAM review. That stands for Source, Chart, Axes, and Message. Check where the data came from, whether the chart type fits, whether the axes are honest, and whether the takeaway matches what the data actually supports. In practice, track each piece through a status taxonomy. Draft, then initial review, then final review, then complete. This makes progress visible in your tracker and your review meetings. Guardrails are simple. No cherry-picking data, no truncated axes, and no dual-axis tricks that manufacture a relationship. As a team lead, you own quality assurance, sign-off, and accountability, so your name on a report means something. And when something is wrong, correct it transparently. Log the revision and record exactly what changed. That record is how trust survives a mistake. Next, we put this all together in the applied walkthrough, from raw data to a stakeholder-ready narrative.
 nces.ed.govuaskos.orgdata.europa.eu+22 min
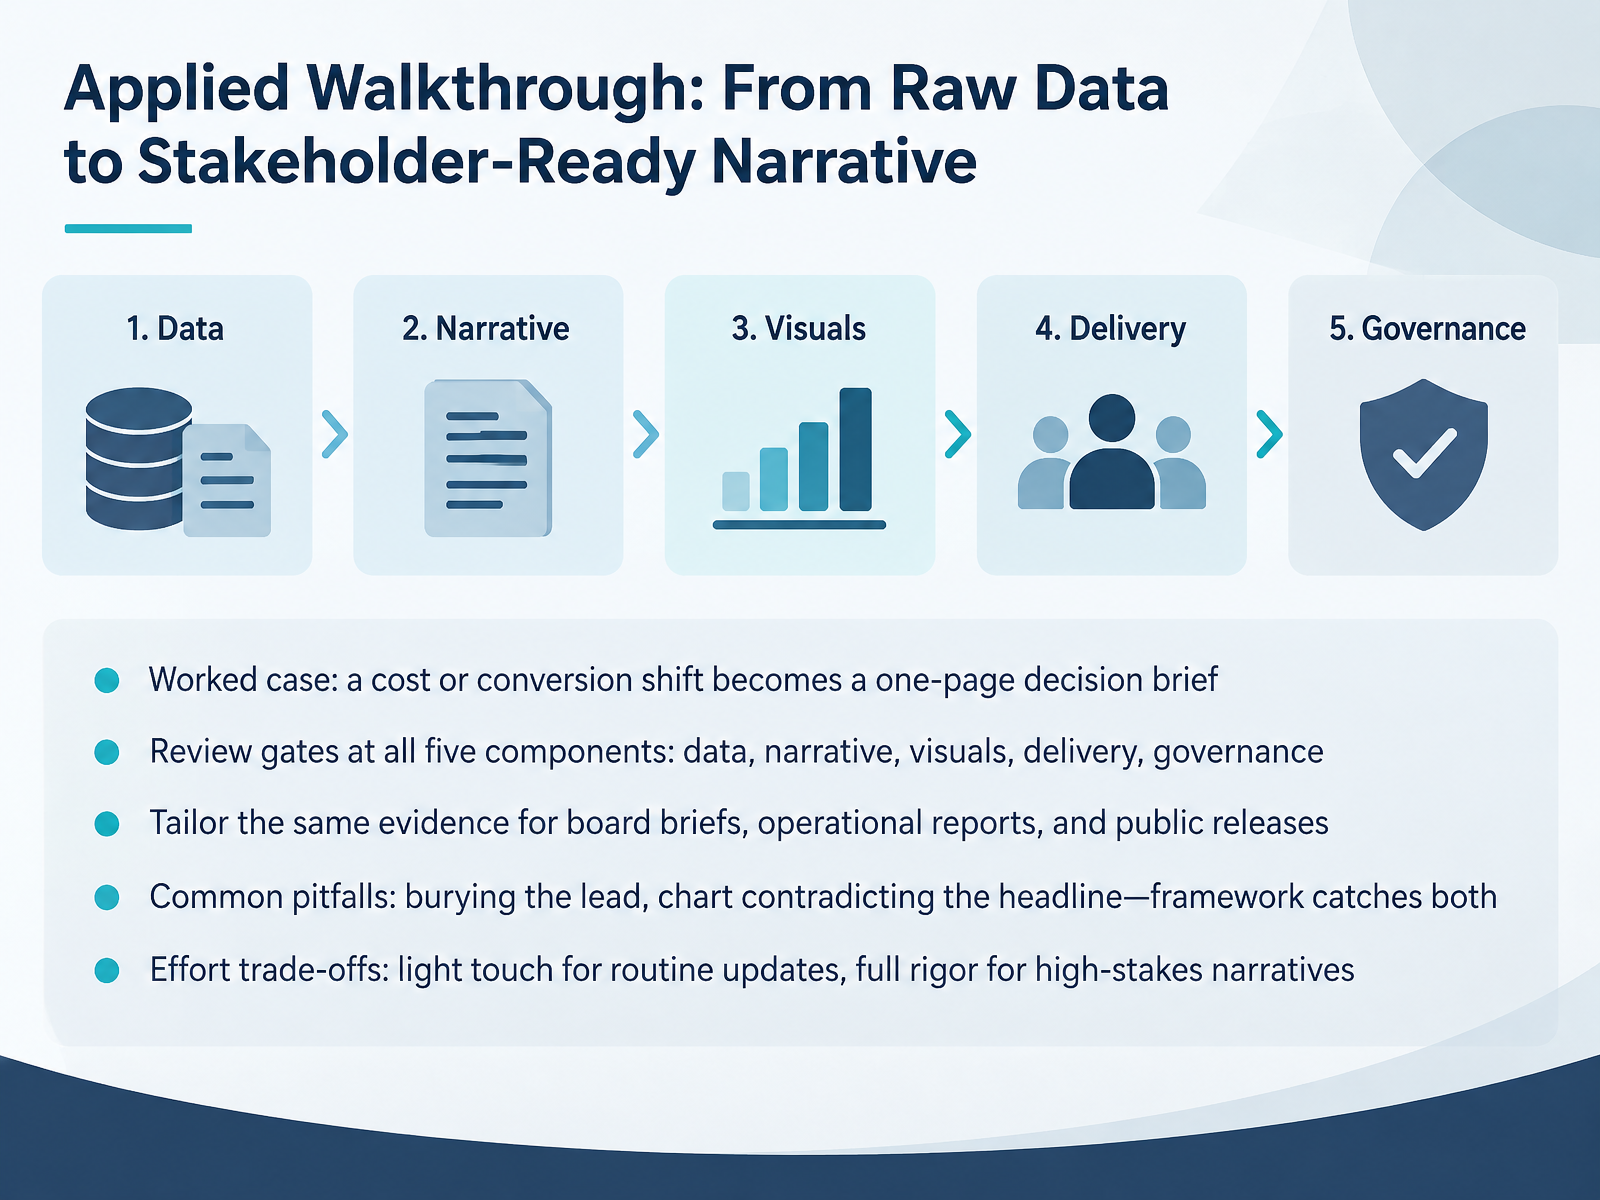
- 09Applied Walkthrough: From Raw Data to Stakeholder-Ready NarrativeNow let's apply the framework end to end. Picture a cost shift or a conversion drop landing on your desk. Your job is to turn that raw data into a one-page decision brief your stakeholders can act on. First, run review gates at all five components: data, narrative, visuals, delivery, and governance. Next, tailor the same evidence to the audience: a board brief needs the decision up front, an operational report needs detail on causes, and a public release needs plain language and context. Watch for two common pitfalls: burying the lead, and a chart that contradicts the headline. The framework catches both, because every gate forces alignment. Finally, match effort to stakes. Routine updates can take a light touch, while high-stakes narratives deserve full rigor. Next, we'll look at reusable templates: the one-pager, storyboard, and review checklist.
 2 min
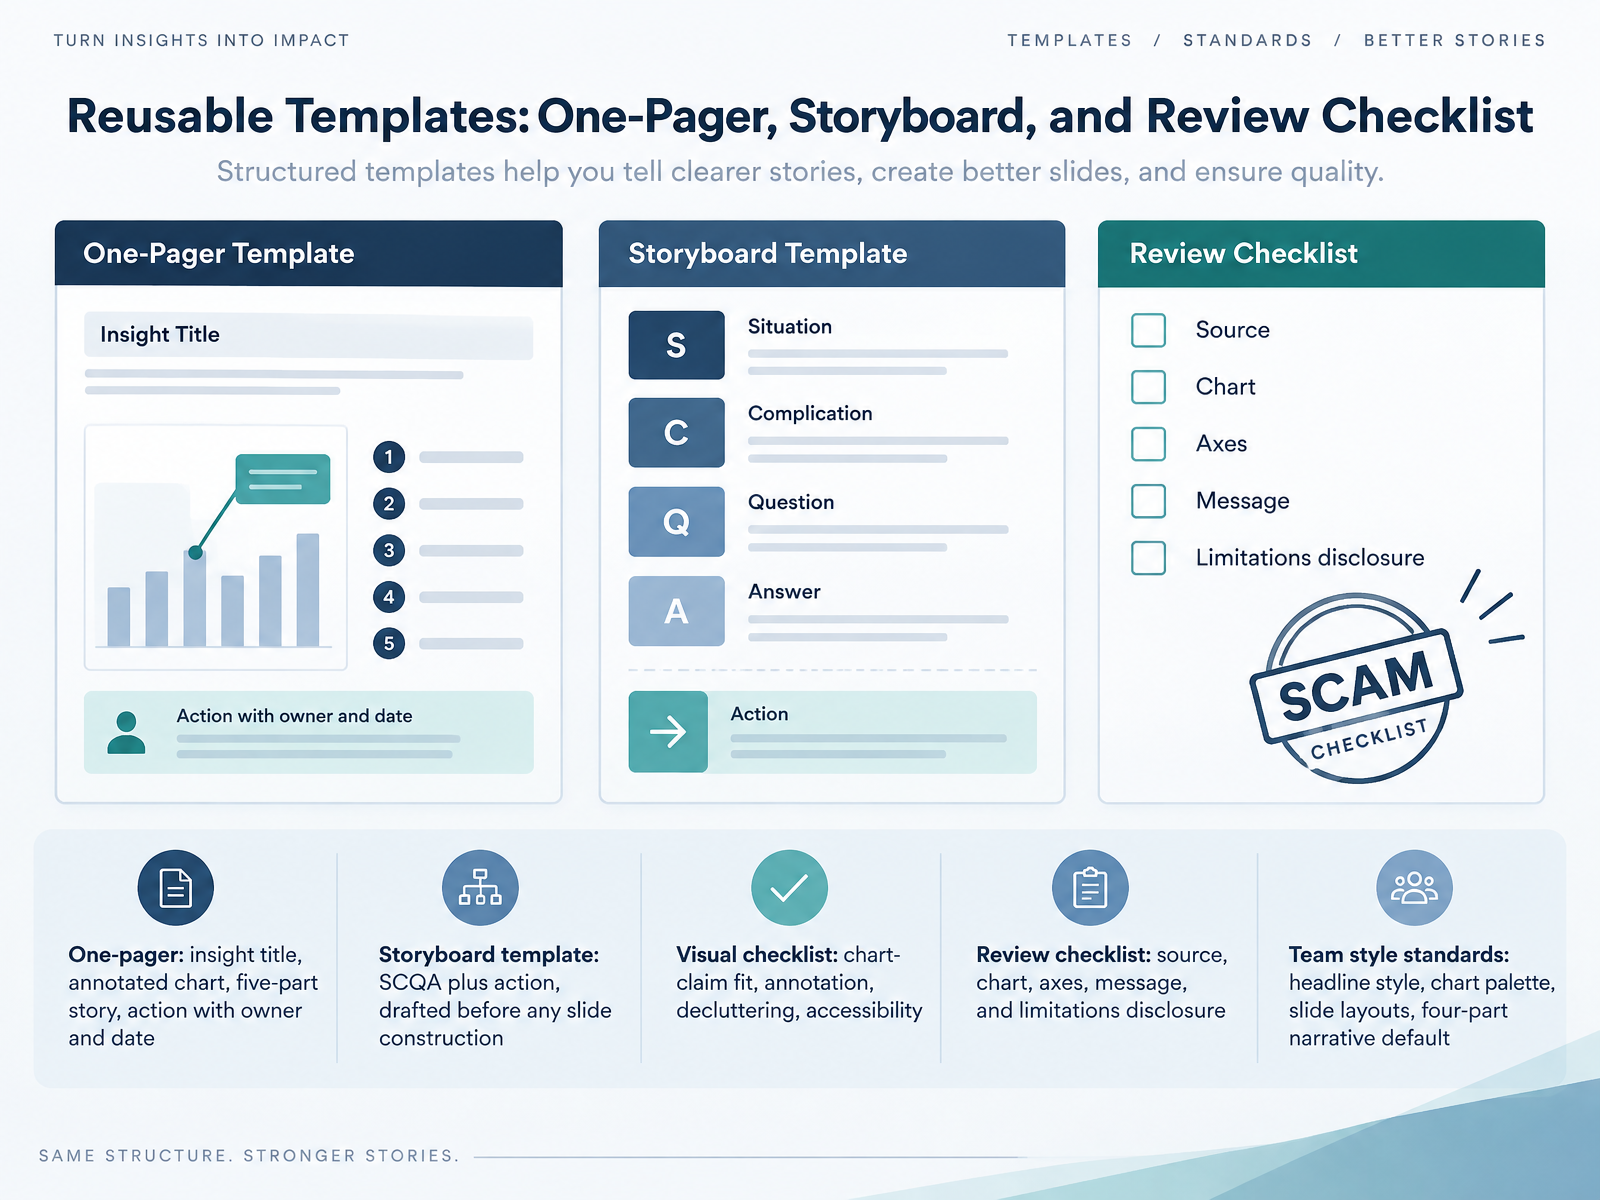
- 10Reusable Templates: One-Pager, Storyboard, and Review ChecklistNow let's be practical and talk about reusable templates. Templates are a big help because they save time and they make it easier to maintain a consistent quality level across the whole team. First, the one-pager. It has an insight title, one annotated chart, a five-part story, and an action with a named owner and a date. Before anyone builds a single slide, draft the storyboard template using SCQA, which stands for situation, complication, question, and answer, plus the action. This maps out the logic of your story early. Next, run a visual checklist covering whether each chart supports its claim, whether annotations are present, whether the chart is decluttered, and whether it is accessible. Then a review checklist covering source, chart, axes, message, and limitations disclosure. Finally, team style standards for headline style, chart palette, slide layouts, and a four-part narrative default. Next, we will put this into practice with a coaching exercise where you rewrite a weak data story.
 2 min
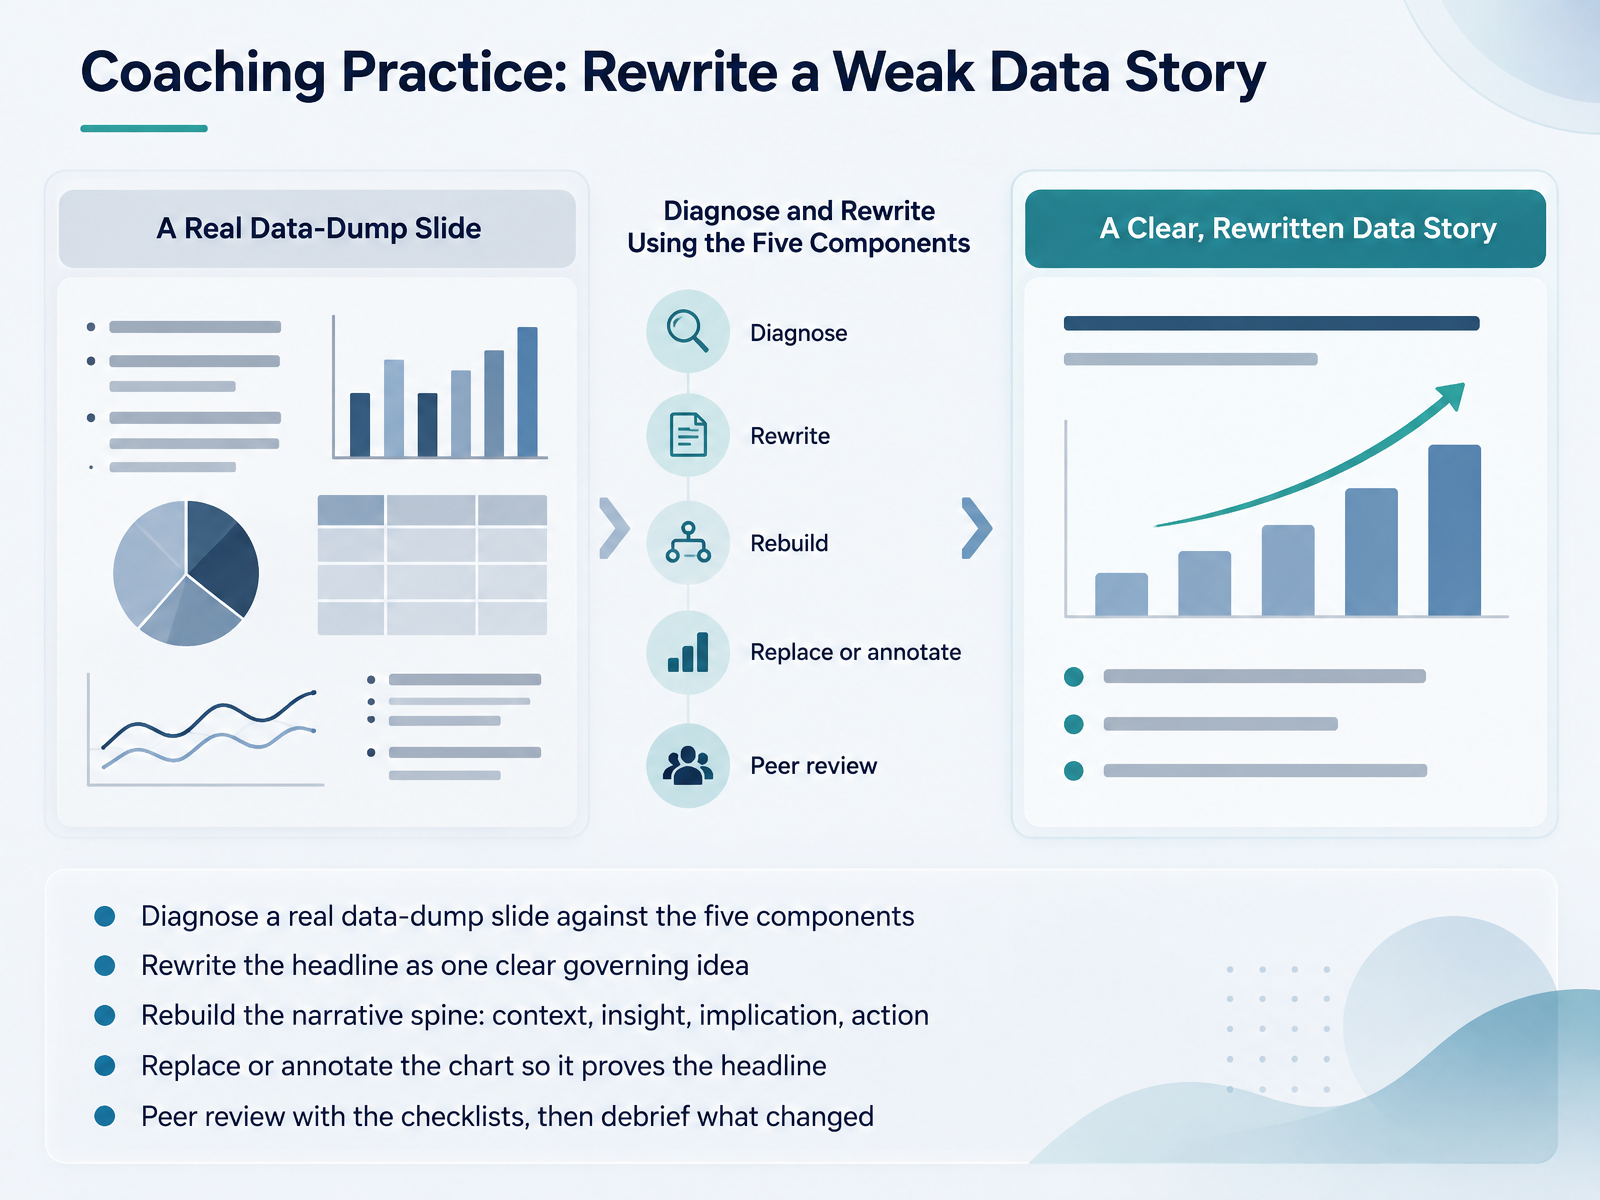
- 11Coaching Practice: Rewrite a Weak Data StoryNow let us put the framework into practice with a coaching exercise. You start by taking a real data-dump slide, one of your own draft slides, and diagnosing it against the five components. Next, you rewrite the headline so it states one clear governing idea, not a topic label. Then you rebuild the narrative spine in order: context, insight, implication, action. After that, replace or annotate the chart so it actually proves that headline, adding labels and a source note rather than leaving the chart to speak for itself. Finally, run a peer review using the checklists, then debrief what changed and why. This exercise works well in a review meeting with analysts, authors, and team leads, and it fits before a publishing deadline. The debrief is where the learning sticks, so keep it short and concrete. Next, we look at measuring narrative effectiveness.
 nces.ed.govuaskos.orgdata.europa.eu+22 min
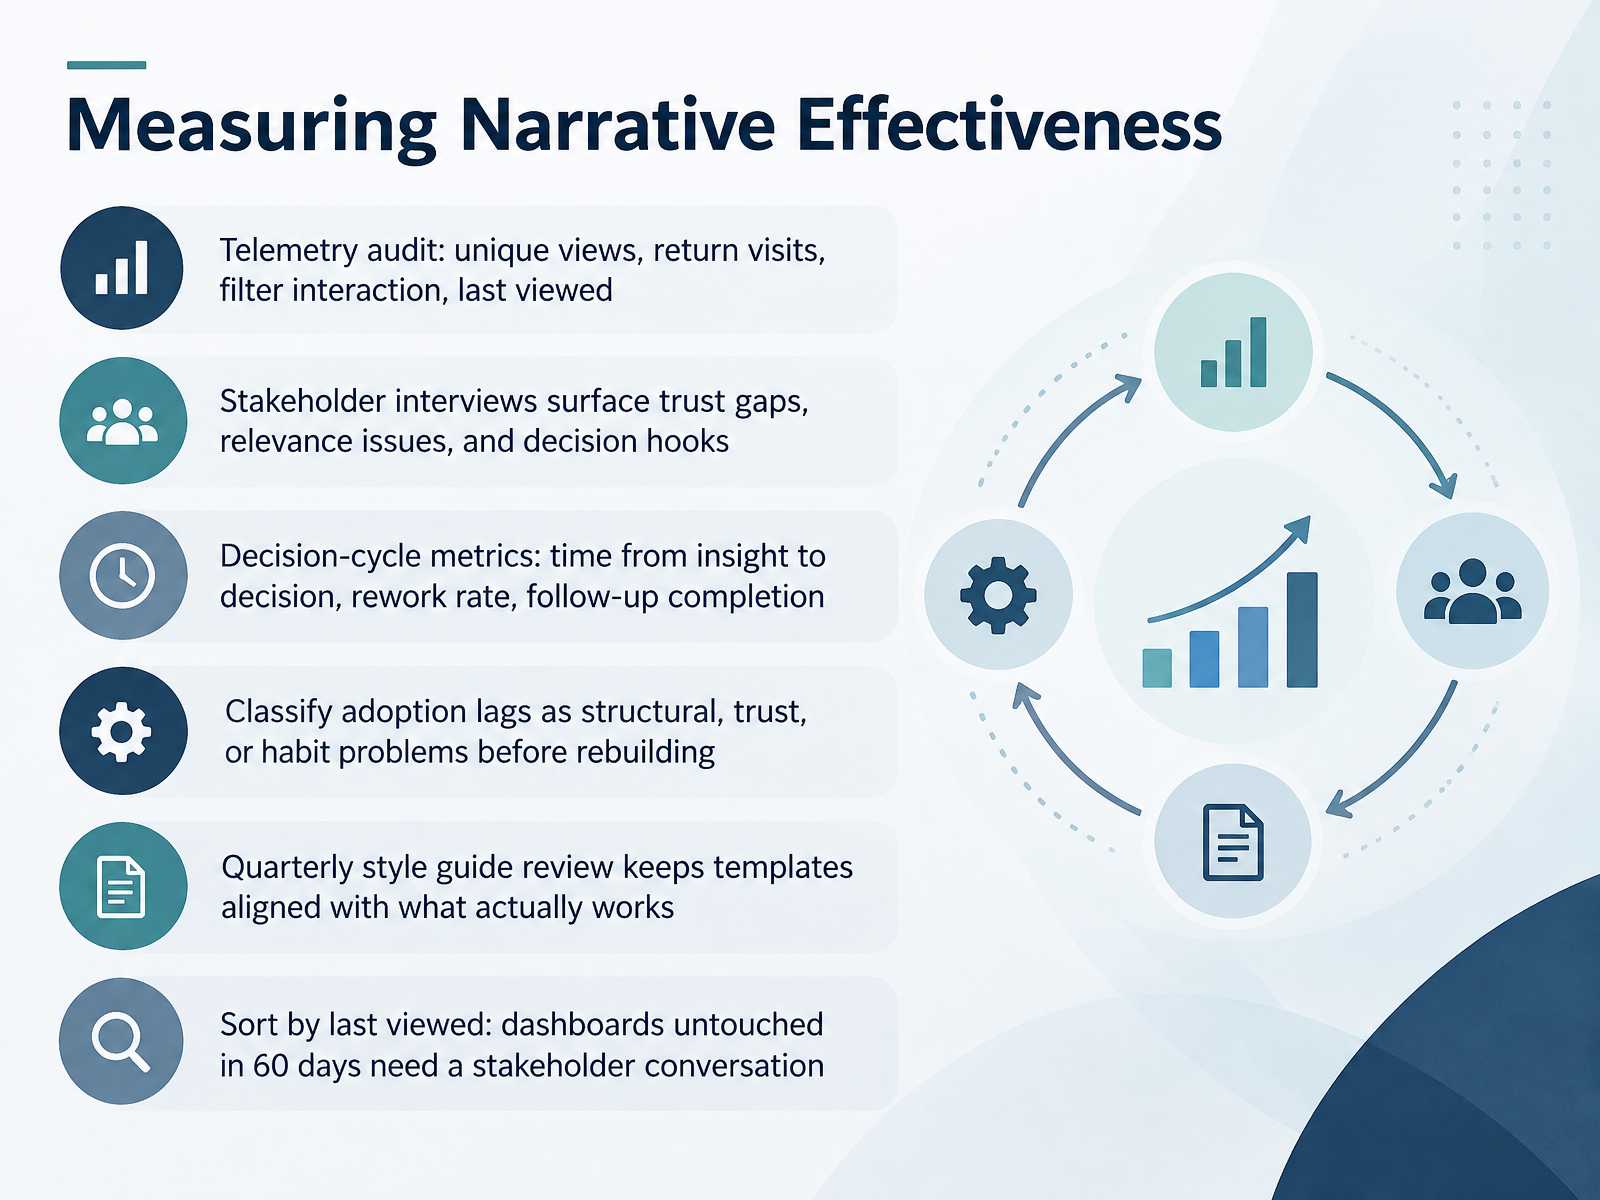
- 12Measuring Narrative EffectivenessNow let's talk about measuring narrative effectiveness. A framework is only as good as its evidence, so you need to check whether your stories actually change decisions. First, run a telemetry audit on thirty days of usage. Track unique views, return visits, filter interaction, and last viewed date. Then, interview three to five stakeholders per team. These short conversations surface trust gaps, relevance issues, and whether a clear decision hook exists. Next, measure the decision cycle. How long does it take from insight to decision? What is your rework rate? Are follow-ups being completed? In practice, before you rebuild anything, classify any adoption lag as structural, trust, or habit related. Then schedule a quarterly style guide review so your templates stay aligned with what actually works. And one practical rule. Sort by last viewed. Any dashboard untouched for sixty days needs a stakeholder conversation before you invest another hour in it. Next, we will turn these findings into a Team Adoption Plan: 30, 60, 90 Days.
 2 min
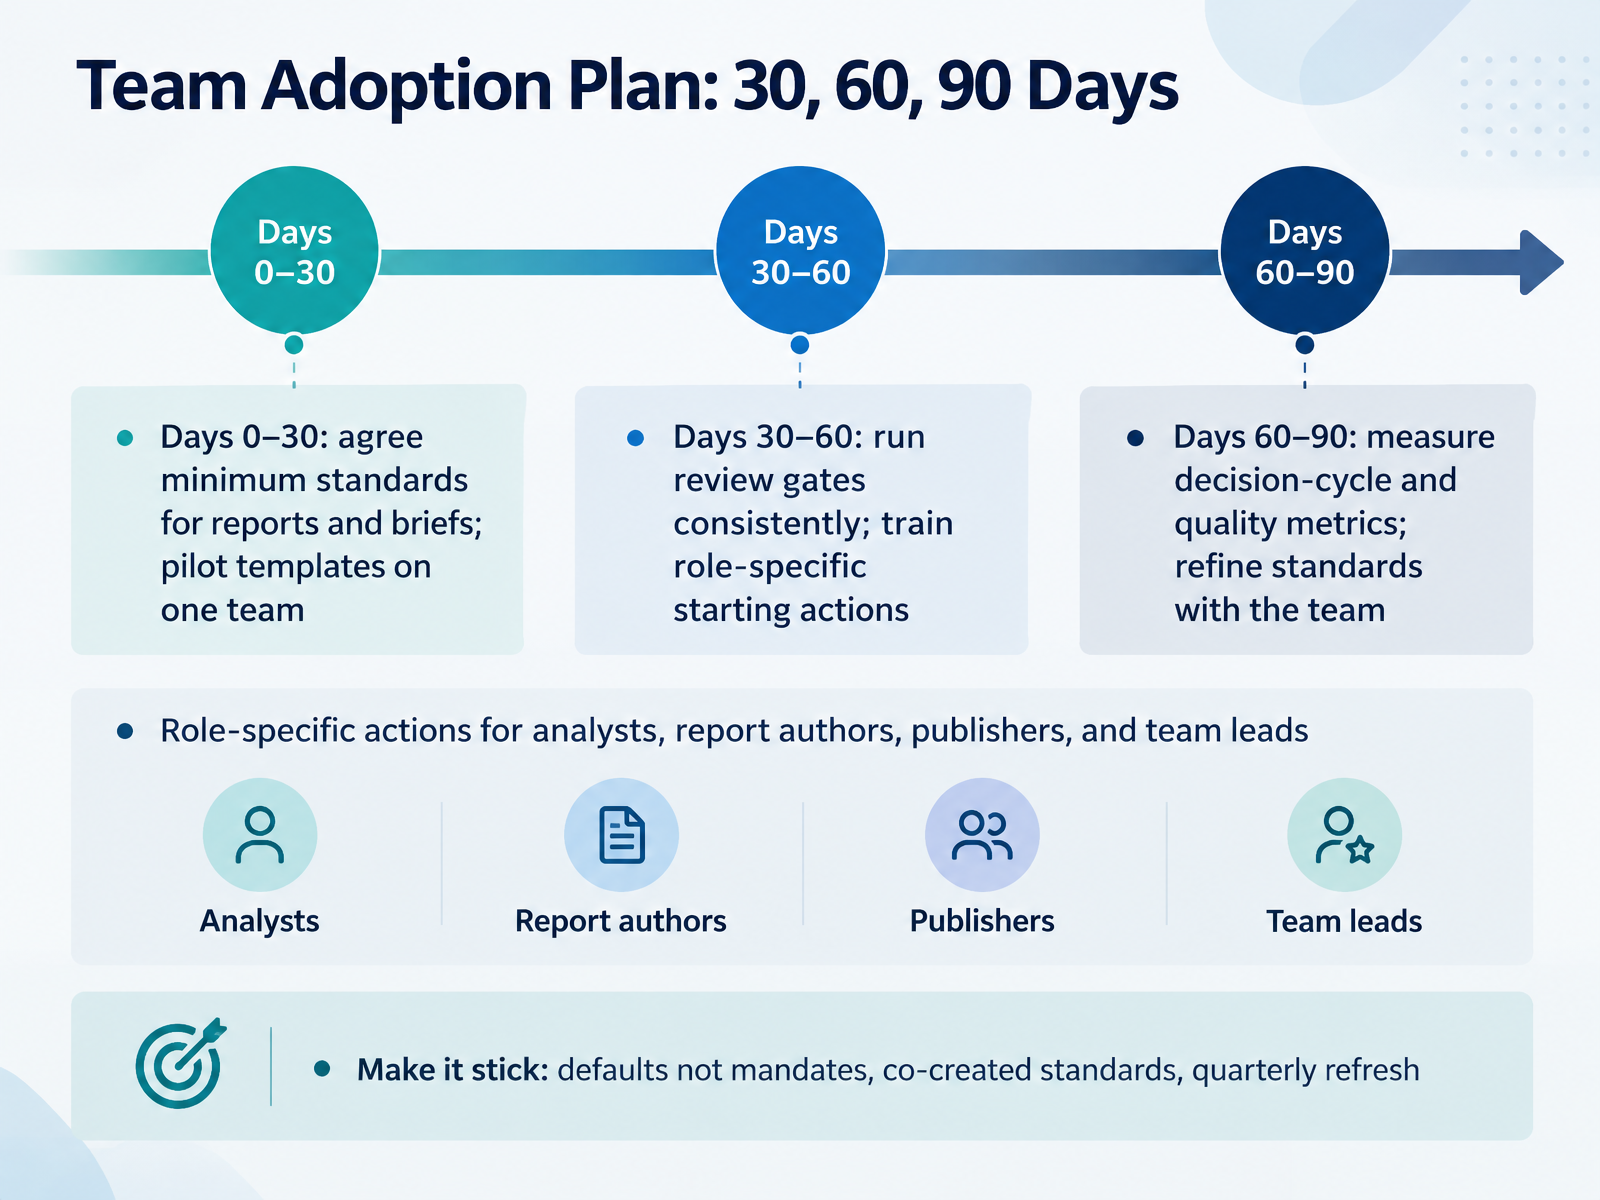
- 13Team Adoption Plan: 30, 60, 90 DaysHere is how you turn the framework into a team habit, in three phases over ninety days.
In the first thirty days, agree on minimum standards for reports and briefs, and pilot your templates on one team. Keep that pilot team small enough to learn from.
Next, from day thirty to sixty, run review gates consistently, every single time. Then train role-specific starting actions, so analysts, report authors, publishers, and team leads each know their first move.
From day sixty to ninety, measure decision-cycle time and quality metrics. Then refine the standards with the team, using what the metrics show.
To make it stick, treat standards as defaults, not mandates. Co-create them, and refresh them quarterly, like a style guide review, rather than letting them go stale.
Next, let us bring this together with the key takeaways and next steps.
 1 min
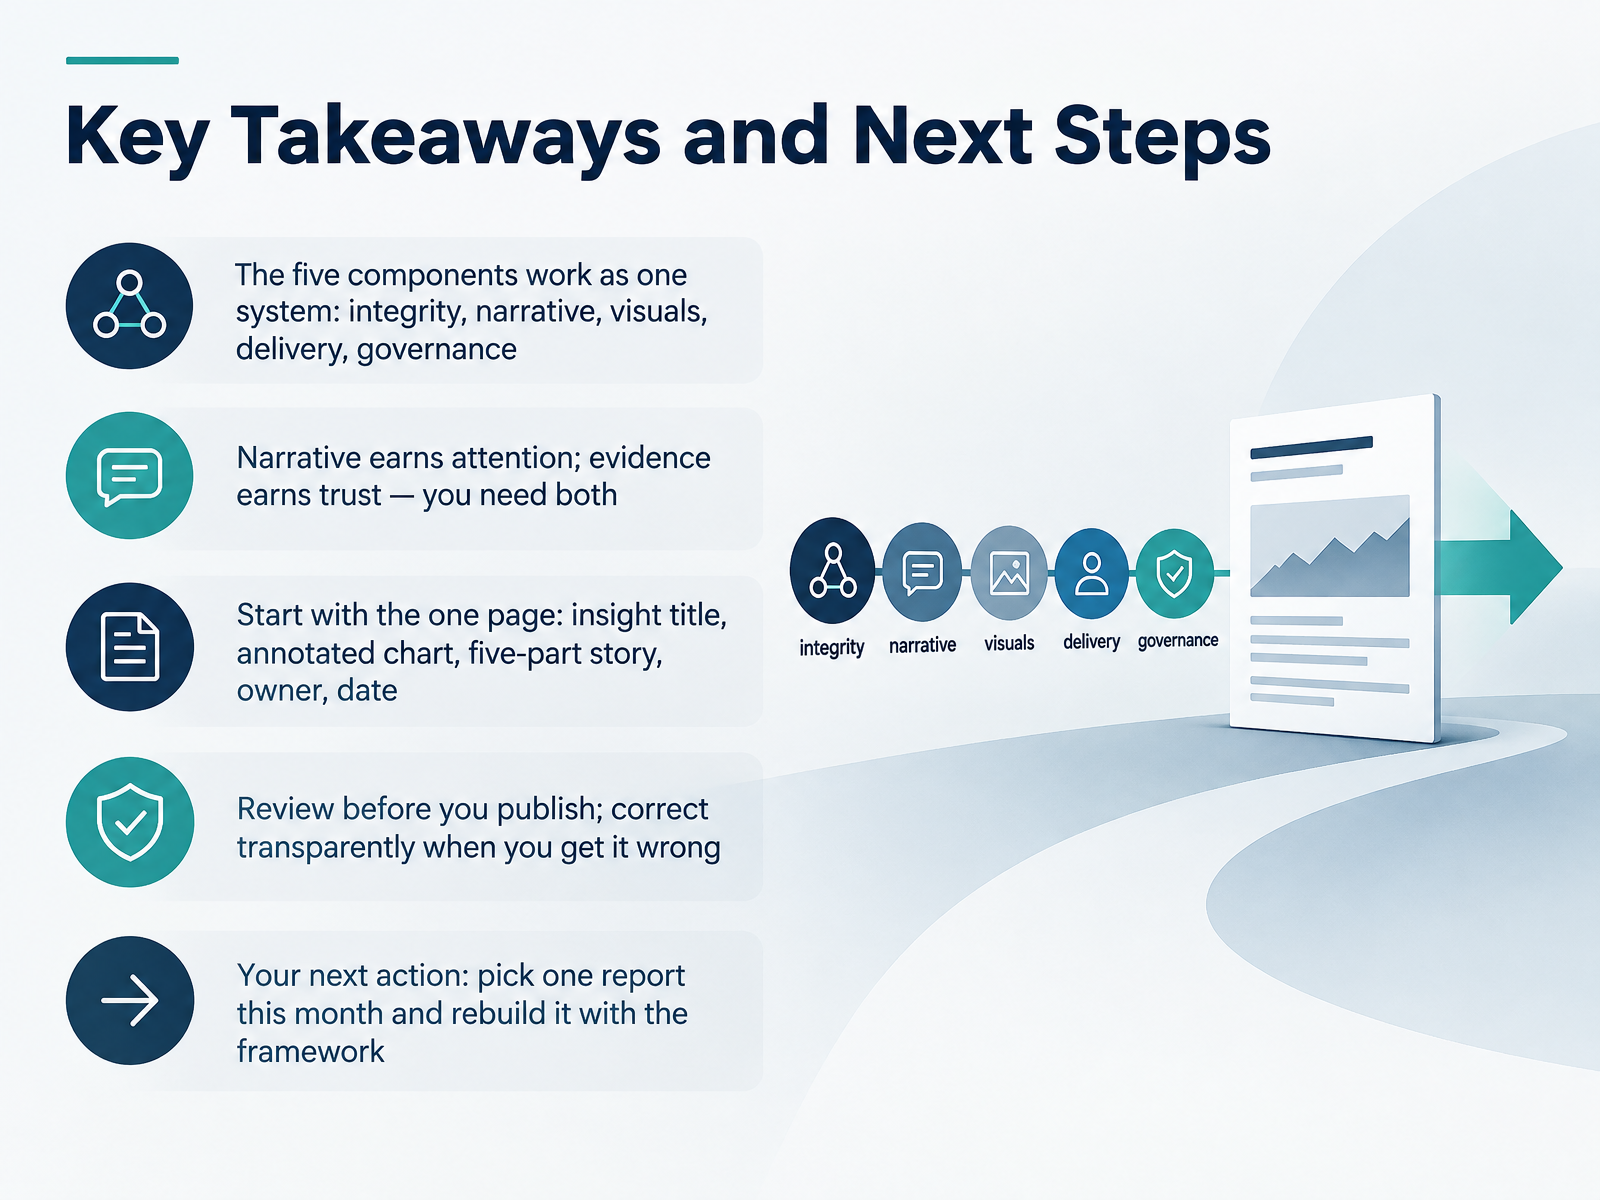
- 14Key Takeaways and Next StepsLet's bring this together. The five components work as one system: integrity, narrative, visuals, delivery, and governance. Weaken any one, and the report loses traction. Next, remember that narrative earns attention, and evidence earns trust. You need both. In practice, start with the one page: an insight title, an annotated chart, the five part story, an owner, and a date. That format works in an email, a dashboard, or a review meeting. Before you publish, review. Check the chart against the source and the message, and when you get it wrong, correct it transparently, because that protects trust. Here is your next action: pick one report this month and rebuild it with the framework. Thank you for your time and attention. You now have a practical process, so choose that one report and start building. I wish you success with it.
 databricks.commicrosoft.comiiba.org+21 min
Take the deck with you
Download this course as a file — free, no sign-up needed.
- PDF handoutEvery slide page, ready to print or share.15 pages · 3.0 MBDownload
- Narrated PowerPointThe deck that presents itself — every slide carries the digital human's narration video.15 pages · 12.2 MBDownload
- PowerPoint slidesThe full deck as a .pptx — open it in PowerPoint, Keynote, or Google Slides.15 pages · 2.9 MBDownload
Free to use in your own training — please keep the PersonWise credit page at the end.
Have your own deck? Turn it into a course
Sources consulted
Web sources consulted while building this course.
- What is Data Storytelling? | Databricks — databricks.com
- What is Data Storytelling and Data Storytelling Examples | Microsoft Power BI — microsoft.com
- Making Data Impossible to Ignore: How to Turn Insights into Action | IIBA — iiba.org
- What Powers Data Storytelling in 2026 — usdsi.org
- How to Tell a Story With Data: A Framework for Analysts and Founders | Emilytics — emilytics.com
- Strategic Storytelling: When Narratives Help Versus Hurt the Persuasive Power of Facts — doi.org
- Stories, Statistics, and Memory — doi.org
- The persuasive effects of narratives: a systematic review of reviews — doi.org
- A Meta-Analysis Comparing the Effectiveness of Narrative vs. Statistical Evidence: Health vs. Non-Health Contexts - PubMed — pubmed.ncbi.nlm.nih.gov
- When poignant stories outweigh cold hard facts: A meta-analysis of the anecdotal bias - ScienceDirect — sciencedirect.com
- Data Visualization Checklist — nces.ed.gov
- Data visualisation — HIF — uaskos.org
- Honest charts: Ethics and integrity in data visualisation | data.europa.eu — data.europa.eu
- Addressing misuse and misinterpretation of official statistics — osr.statisticsauthority.gov.uk
- Visualization traps | ML Universal Guides | Google for Developers — developers.google.com
- Telling stories with data -- A systematic review — doi.org
- An Argument Structure for Data Stories — doi.org
- SCQA Framework: Overview, Examples & How To Use It — slidescience.co
- Storytelling with data – Data Analytics with Accounting Data — odp.library.tamu.edu
- Performance Prediction A4 — consultingmethodology.com