Begin
14 pages · ~28 min
Evaluating Digital Marketing Quality
This training teaches marketers how to evaluate the quality of digital marketing efforts, covering key metrics and assessment methods to improve campaign performance.
A digital instructor presents all 14 pages. Hold “Ask” at any point and ask out loud — the answer comes from this course. No sign-up needed.
What you’ll learn
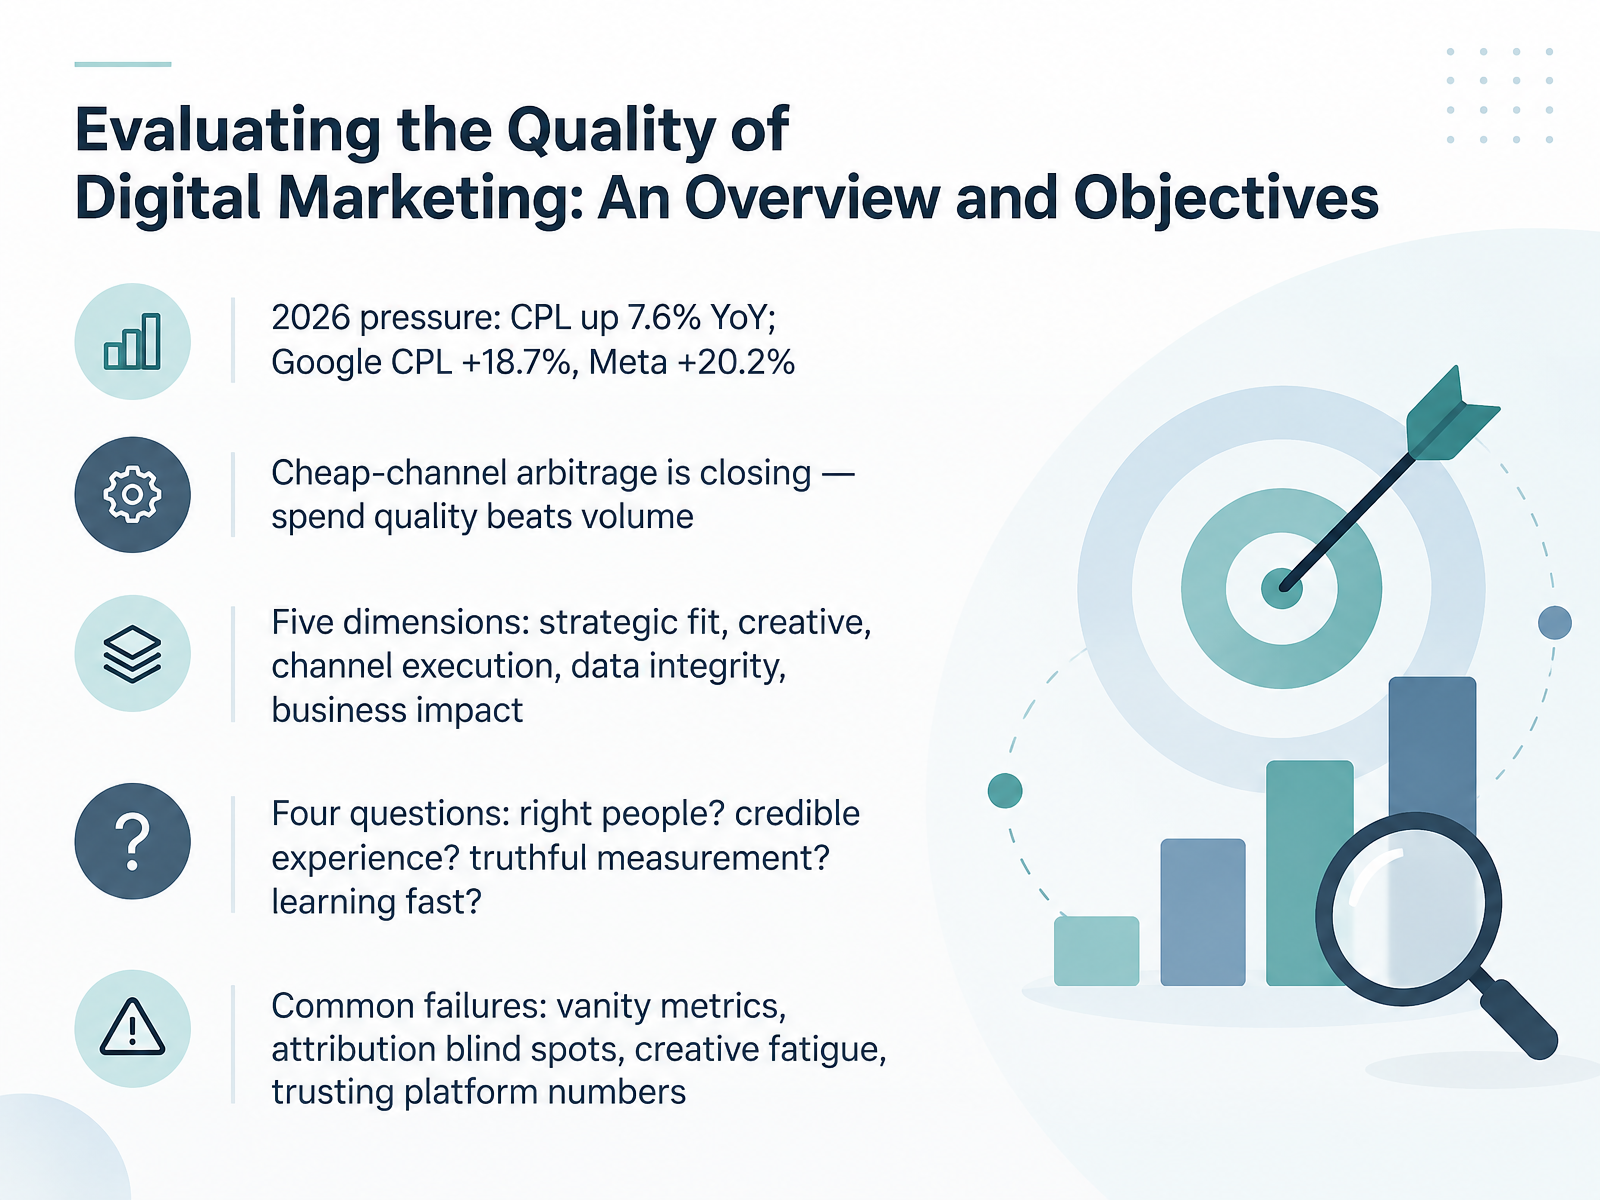
- 01Evaluating the Quality of Digital Marketing: An Overview and ObjectivesWelcome. This session is about judging the quality of your digital marketing, not just the volume it produces. Here is the context you are working in. In twenty twenty six, average cost per lead is up seven point six percent year over year. Google is up eighteen point seven percent, and Meta is up twenty point two percent. The cheap-channel arbitrage is closing, so spend quality now beats volume. In this course we evaluate quality across five dimensions: strategic fit, creative, channel execution, data integrity, and business impact. We will keep returning to four questions. Are we reaching the right people? Is the experience credible? Is our measurement truthful? And are we learning fast enough? We will also name the common failures, including vanity metrics, attribution blind spots, creative fatigue, and trusting platform numbers at face value. For now, open your current campaign review and note where you suspect one of those failures is hiding. Next, we walk through the Five-Dimension Quality Framework.foundrycro.combenchmarketing.orgadlyse.com+22 min
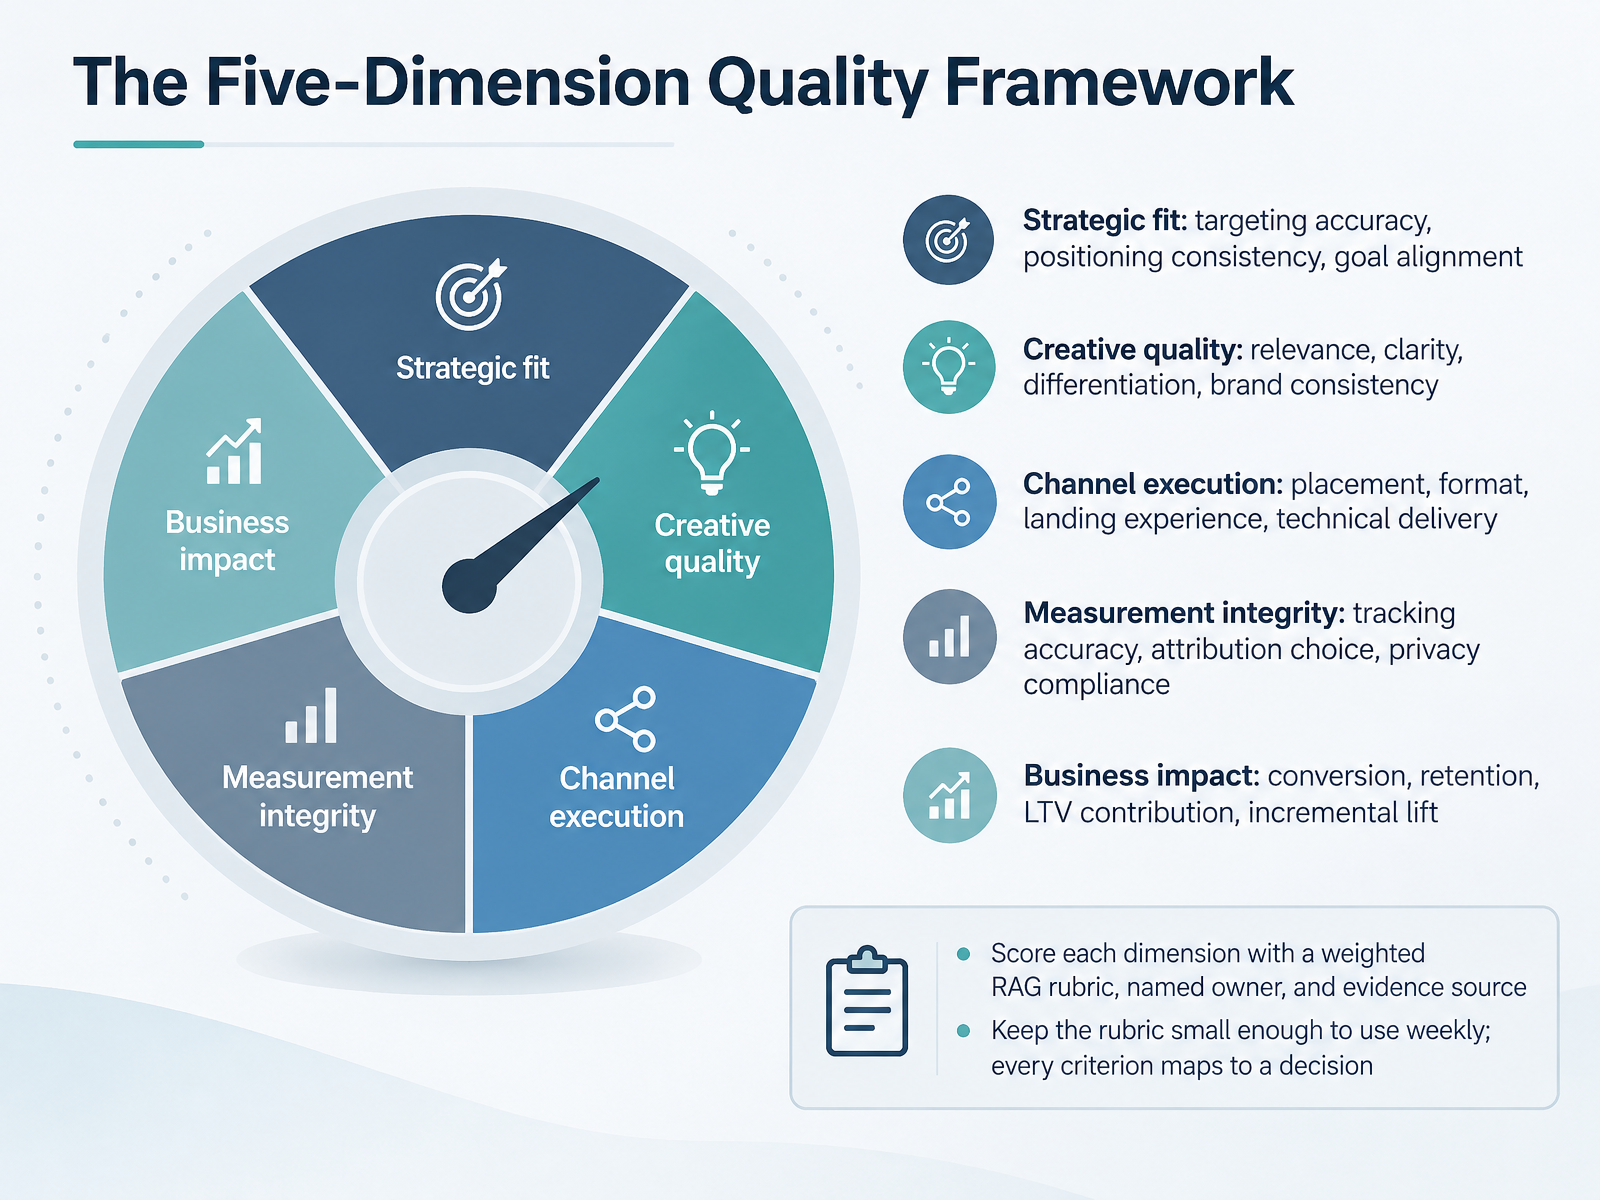
- 02The Five-Dimension Quality FrameworkNow let's look at the framework that holds your review together. There are five dimensions to score. Strategic fit covers targeting accuracy, positioning consistency, and goal alignment. Creative quality covers relevance, clarity, differentiation, and brand consistency. Channel execution covers placement, format, landing experience, and technical delivery. Measurement integrity covers tracking accuracy, attribution choice, and privacy compliance. And business impact covers conversion, retention, lifetime value contribution, and incremental lift. Score each one with a weighted red, amber, green rubric, and name an owner plus an evidence source for every score. Keep the rubric small enough to run weekly, and make sure every criterion maps to a decision you would actually act on. So ask yourself before you finalize it: which of these five, if it dropped to red, would change your spend this month? Those are the criteria worth keeping. Next, let's separate the metrics that matter from the metrics that flatter.
 foundrycro.combenchmarketing.orgadlyse.com+22 min
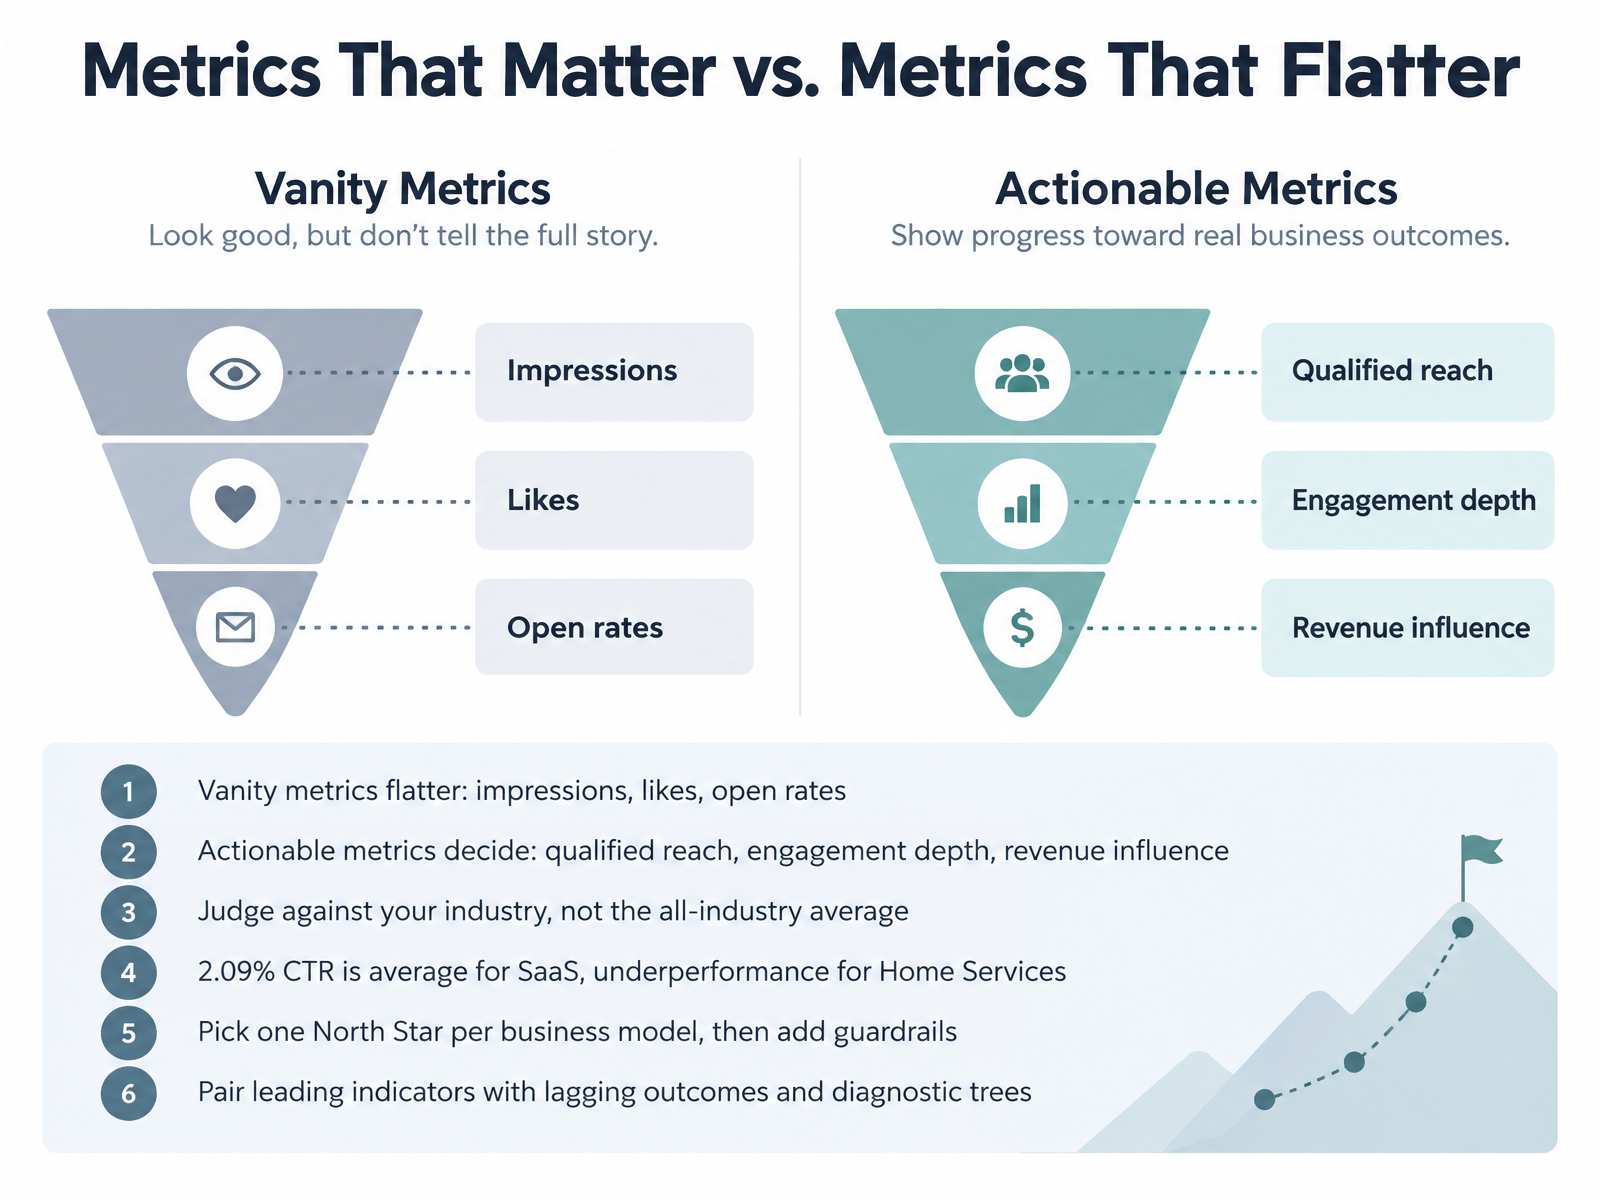
- 03Metrics That Matter vs. Metrics That FlatterLet's turn now to the numbers themselves. Vanity metrics flatter you. Impressions, likes, open rates. They feel good and rarely change a decision. Actionable metrics decide. Qualified reach, engagement depth, revenue influence. So before your next campaign review, ask your team which of the numbers on the page actually changed a decision.
Then judge against your own industry, not the all-industry average. A click-through rate of two point zero nine percent is average for SaaS, and clear underperformance for Home Services. Same number, different verdict. Pick one North Star per business model, then add guardrails so you don't win one metric by breaking another. And pair leading indicators with lagging outcomes, with diagnostic trees that tell you where to look when a number moves.
Now let's look at the constraints around measurement. Next, Platform Reality Check: Privacy, Consent, and Measurement Constraints.
 benchmarketing.org1clickreport.comcmbeyer.com+21 min
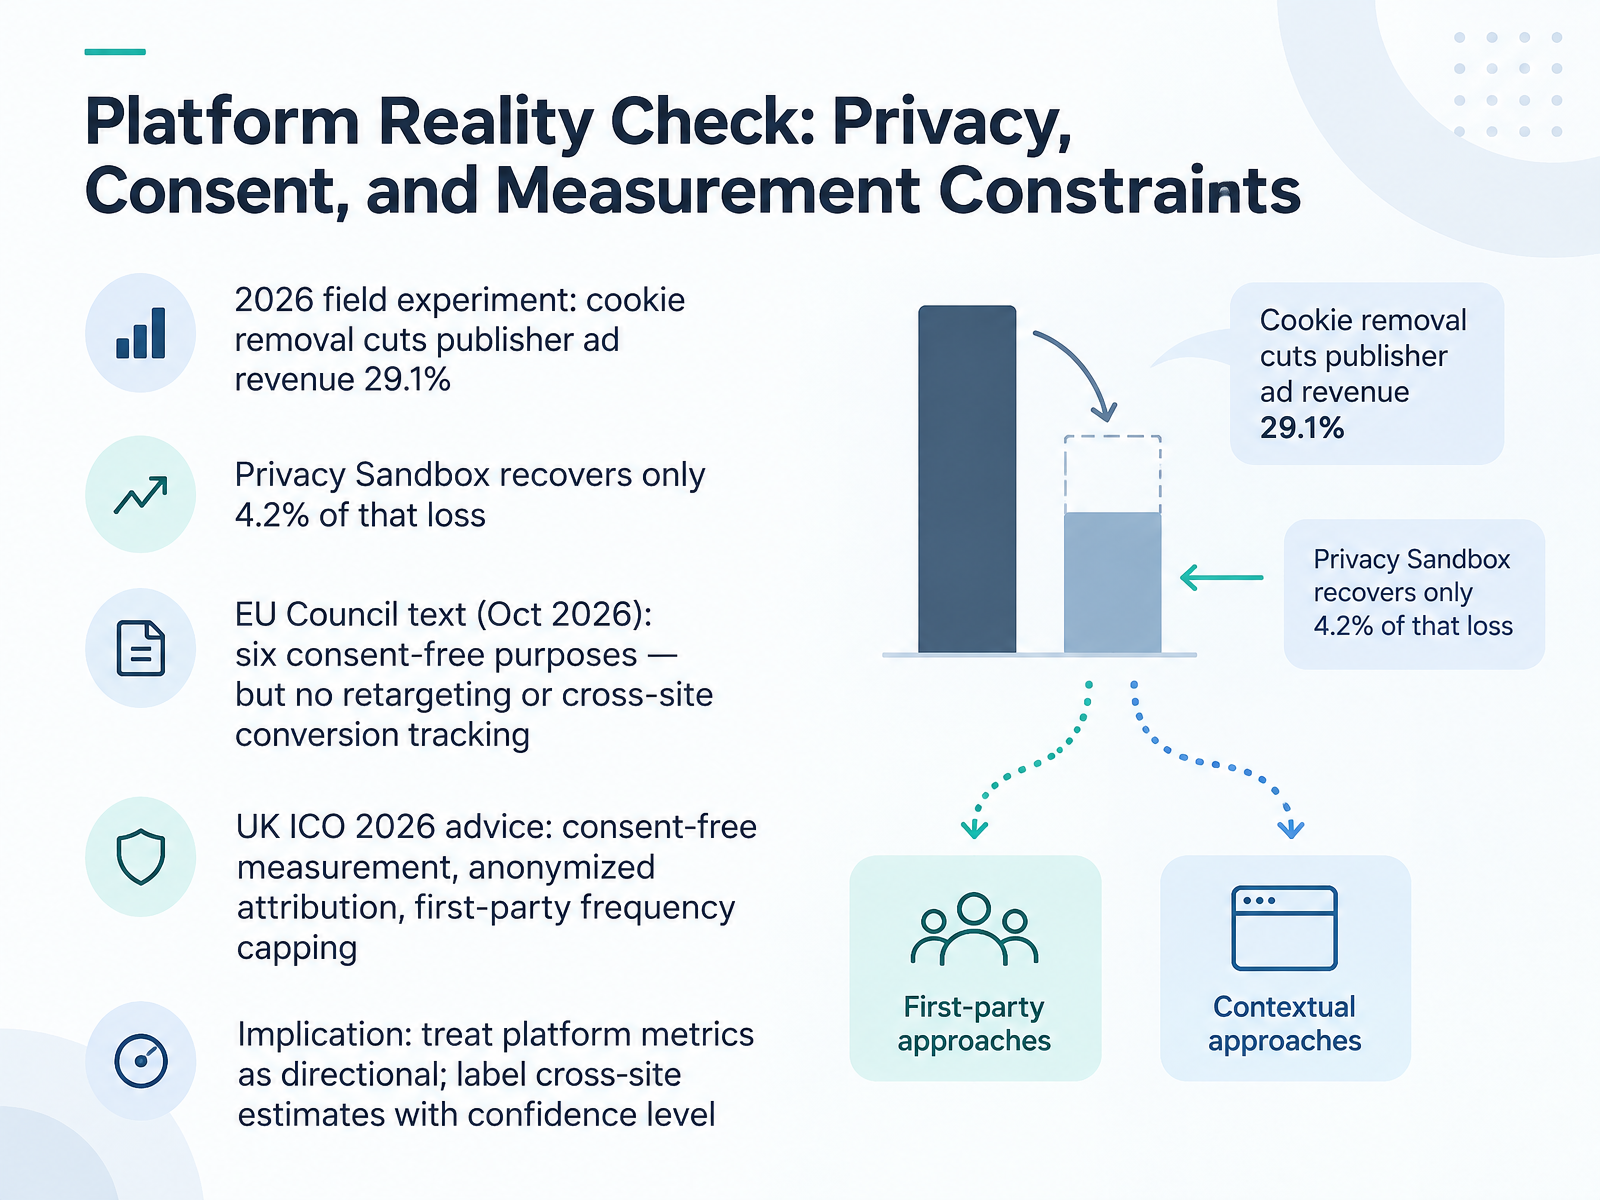
- 04Platform Reality Check: Privacy, Consent, and Measurement ConstraintsNext, let's run a platform reality check on privacy, consent, and measurement limits. In a twenty twenty-six field experiment, removing third-party cookies cut publisher ad revenue by twenty-nine point one percent. The Privacy Sandbox recovered only four point two percent of that loss. So don't assume a replacement technology is going to close the gap for you. Check your own dashboard before you plan the next quarter. The EU Council text from October twenty twenty-six lists six consent-free purposes, but it still excludes retargeting and cross-site conversion tracking. In the UK, the ICO's twenty twenty-six advice supports consent-free measurement, anonymized attribution, and first-party frequency capping. Here is your action. Treat every cross-site estimate as directional, and label it with a confidence level in campaign reviews. That keeps performance checks honest, and it gives your team a habit they can pass on. Coming up, we look at creative and content quality assessment.
 ico.org.ukpnas.orgtaylorwessing.com+22 min
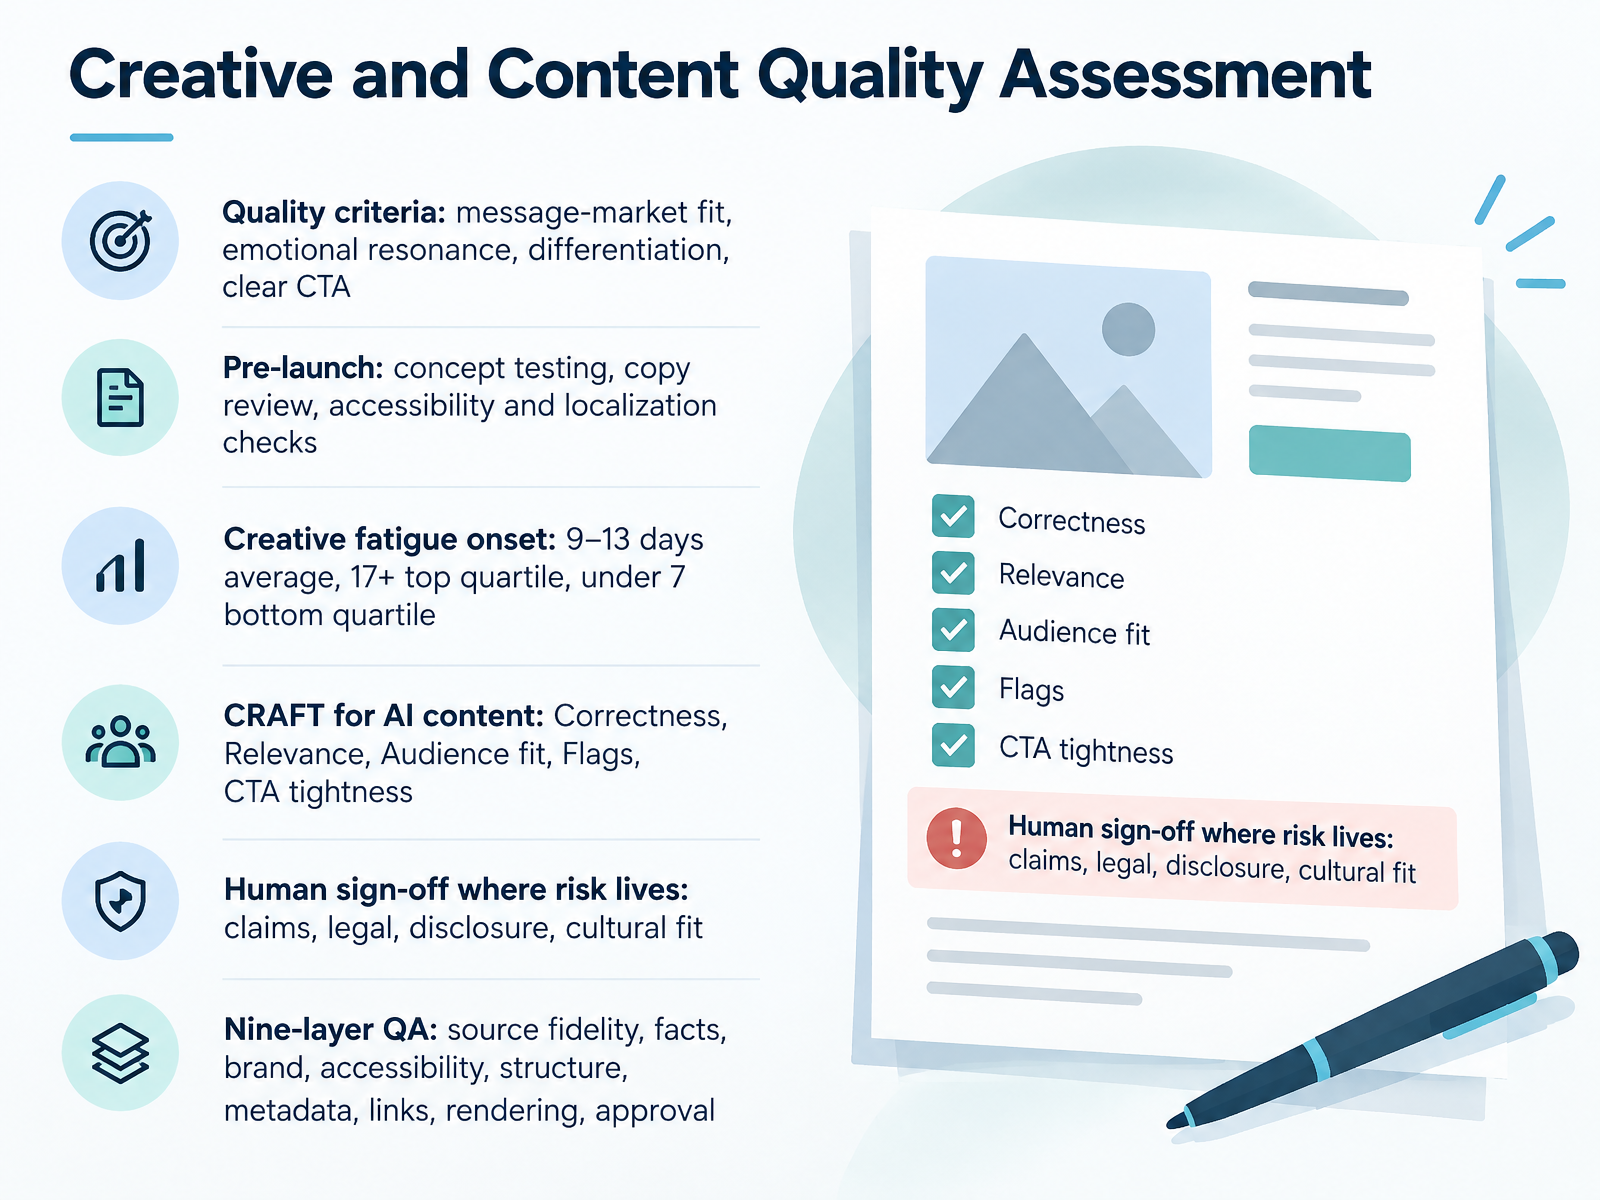
- 05Creative and Content Quality AssessmentLet's turn to creative and content quality. Start with four criteria. Message-market fit, emotional resonance, differentiation, and a clear call to action. Apply them in your campaign reviews and content approvals. Before launch, run concept testing, copy review, and accessibility and localization checks. Ask your team to sign off in the planning meeting, not after publishing.
Watch for creative fatigue. Average onset is around nine to thirteen days. Top quartile creative lasts seventeen days or more, and bottom quartile drops under seven. Check your dashboard's frequency and click-through trend, then refresh your best assets before performance slides.
For AI-assisted content, use the CRAFT checklist. Correctness, relevance, audience fit, flags, and tightness of the call to action. Keep human sign-off where risk lives, meaning claims, legal, disclosure, and cultural fit. Then run the nine-layer QA. Source fidelity, facts, brand, accessibility, structure, metadata, links, rendering, and approval. Next, we move into Channel-Level Quality Checks.
 searchengineland.comgradial.commarkup.ai+22 min
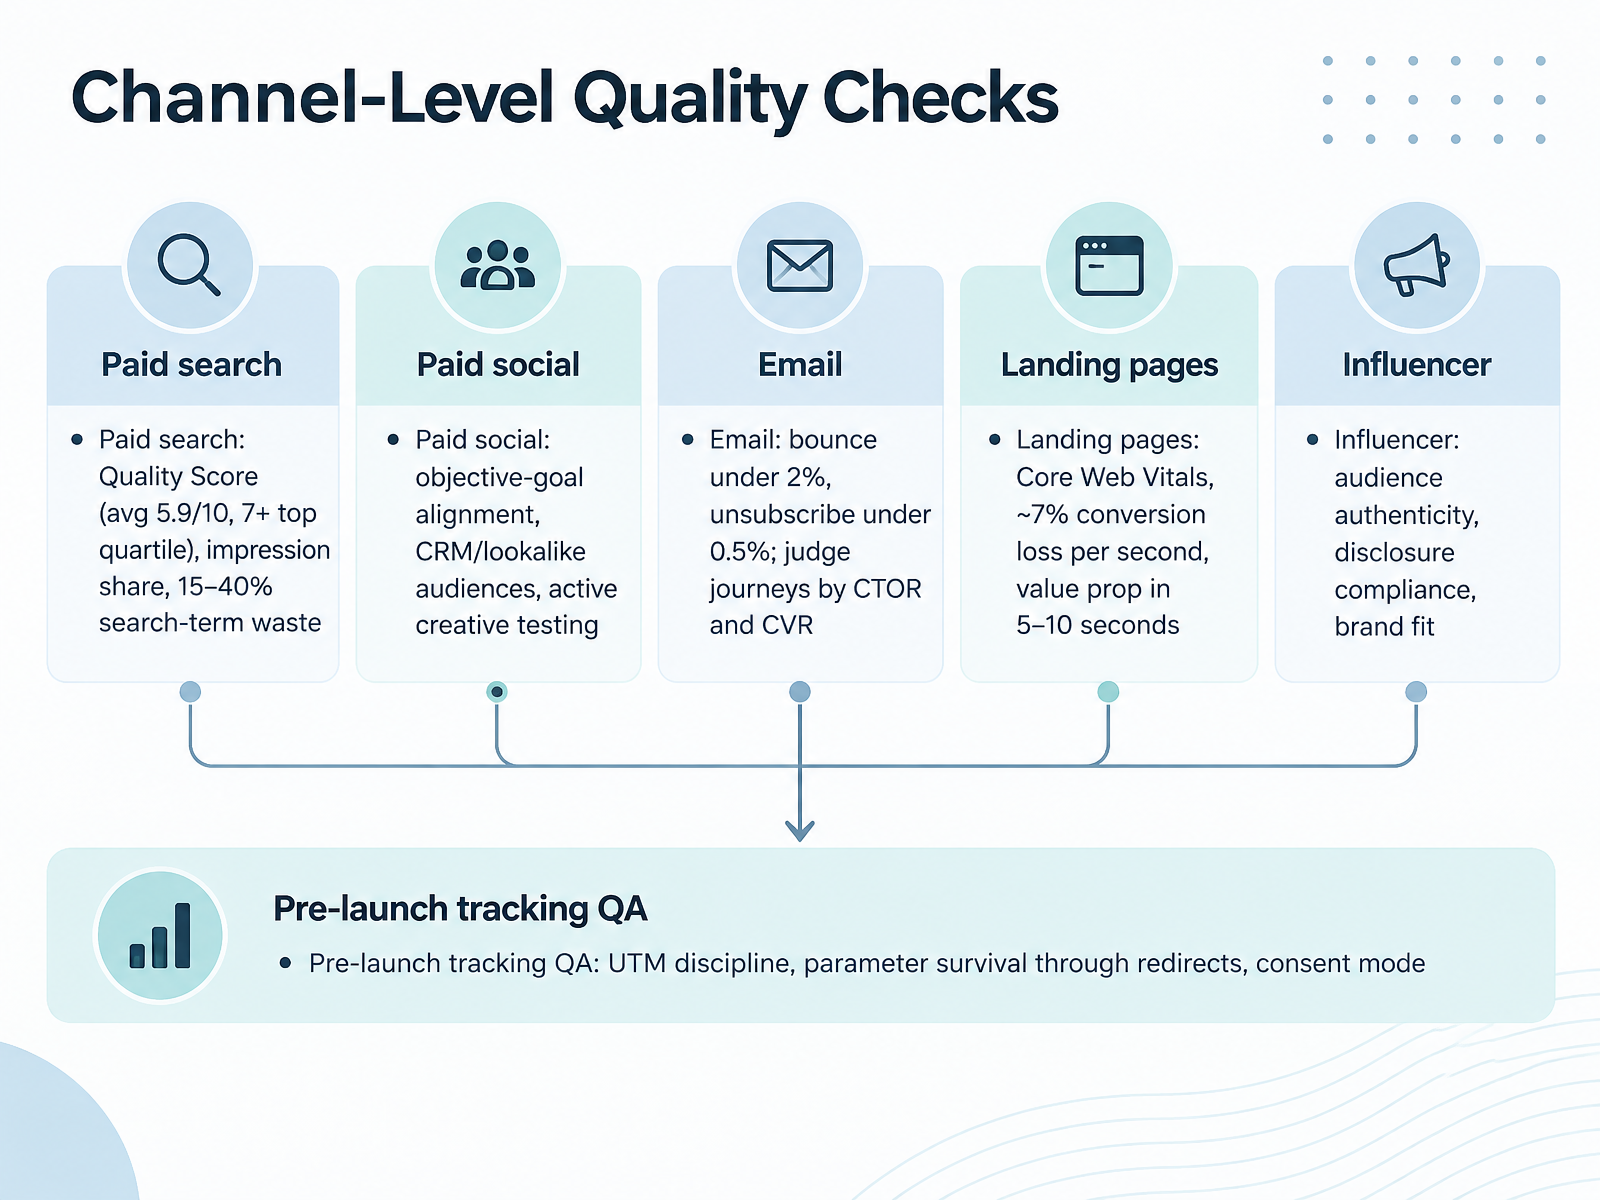
- 06Channel-Level Quality ChecksNow let's get practical about channel-level quality checks you can run in your next campaign review. On paid search, look at three things first. Quality Score, where the market average sits around five point nine out of ten and seven or above puts you in the top quartile. Impression share. And search-term waste, which typically runs fifteen to forty percent of spend, so pull the report and add negatives. On paid social, ask your team three questions. Does the campaign objective match the business goal? Are audiences built from CRM lists and lookalikes rather than assumed demographics? And is creative being actively tested, or have the same ads run for months? For email, keep bounces under two percent and unsubscribes under zero point five percent. Then judge your journeys by click-to-open rate and conversion rate, not just opens. On landing pages, check Core Web Vitals. Expect roughly seven percent conversion loss per second of delay, and make sure the value proposition lands in five to ten seconds. For influencers, verify audience authenticity, disclosure compliance, and brand fit. Finally, run tracking QA before launch. UTM discipline, parameter survival through redirects, and consent mode. Pick one channel and schedule that check this week. Next, we move into measurement integrity and attribution.
 benchmarketing.org1clickreport.comcmbeyer.com+22 min
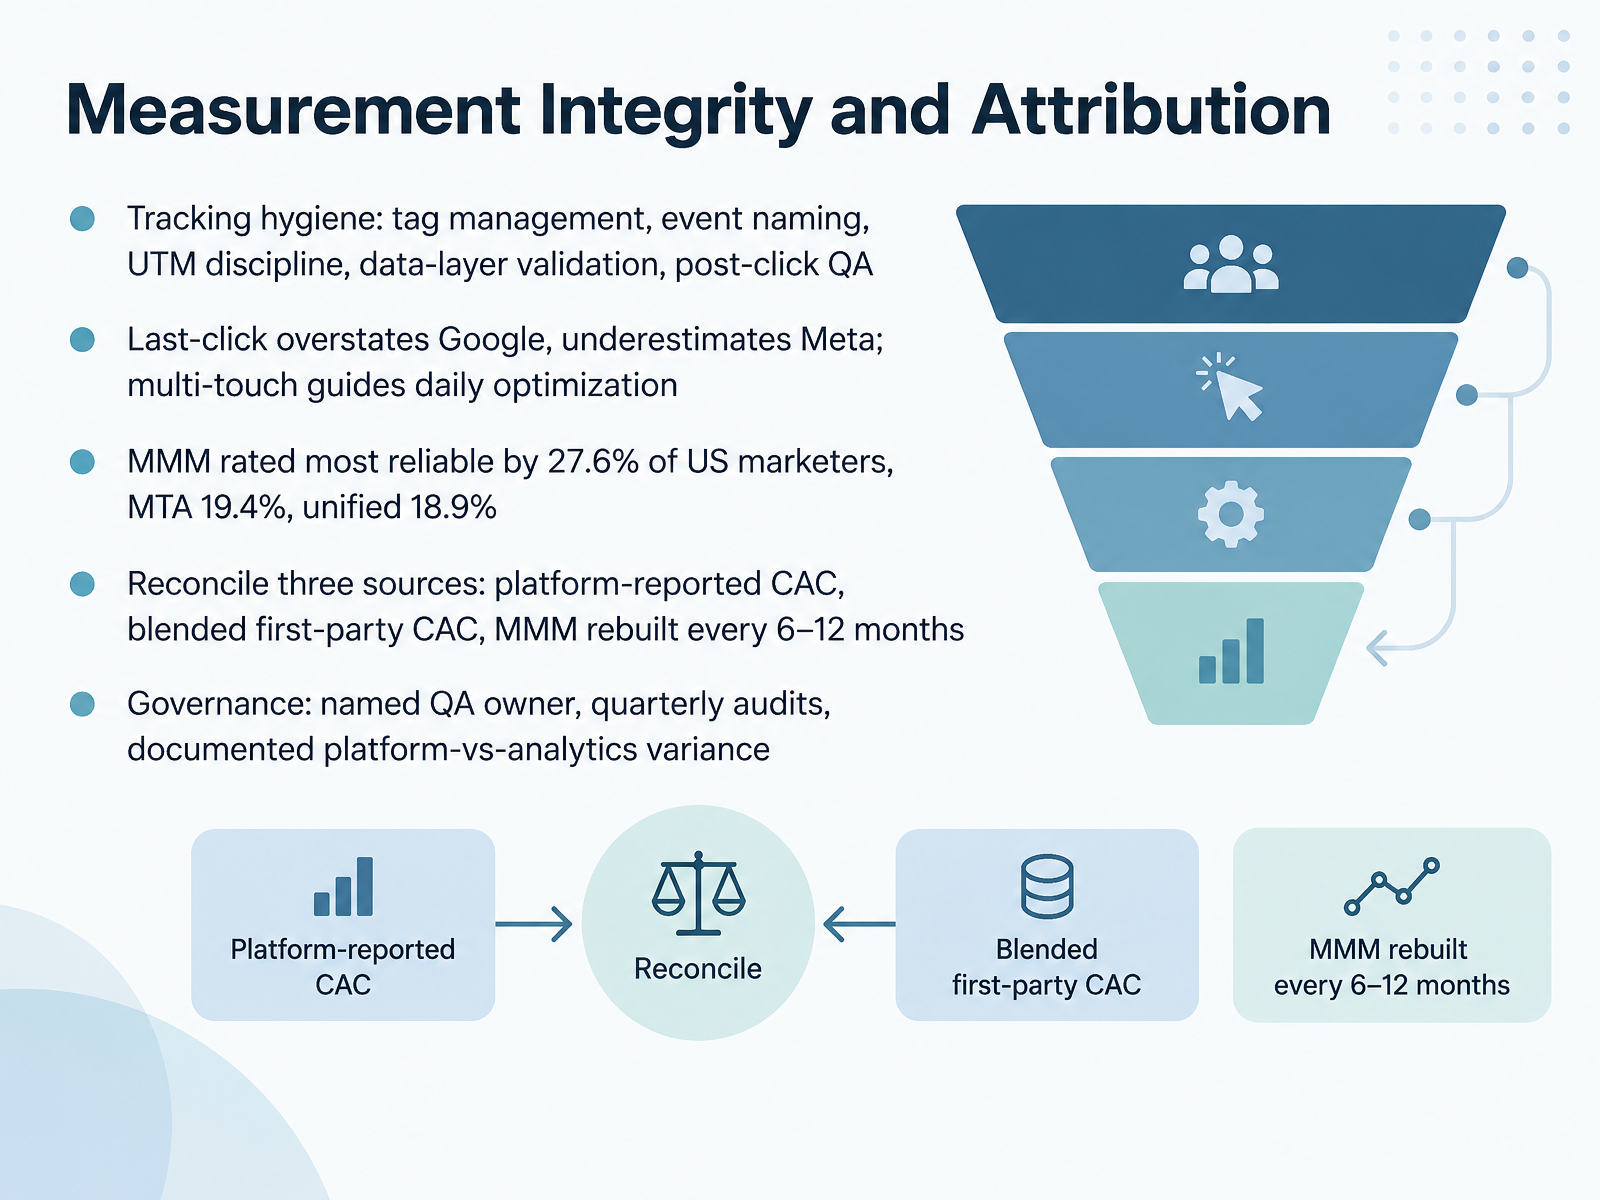
- 07Measurement Integrity and AttributionNext, let's talk about measurement integrity and attribution. Your dashboards are only as good as the data feeding them. Before anyone debates channel performance, check your tracking hygiene: tag management, consistent event naming, UTM discipline, data-layer validation, and post-click quality assurance. Assign one named QA owner and run quarterly audits.
Second, know your models' biases. Last-click overstates Google and underestimates Meta, so use multi-touch attribution to guide daily optimization. Ask your team how each channel is being credited.
Third, reconcile three sources: platform-reported CAC, blended first-party CAC, and a marketing mix model rebuilt every six to twelve months. MMM leads on reliability, with twenty-seven point six percent of US marketers naming it most reliable, ahead of multi-touch at nineteen point four and unified measurement at eighteen point nine. Document platform-versus-analytics variance, so campaign reviews run on evidence, not opinion.
Next, we move into proving incremental impact, starting with testing design basics.
 foundrycro.combenchmarketing.orgadlyse.com+22 min
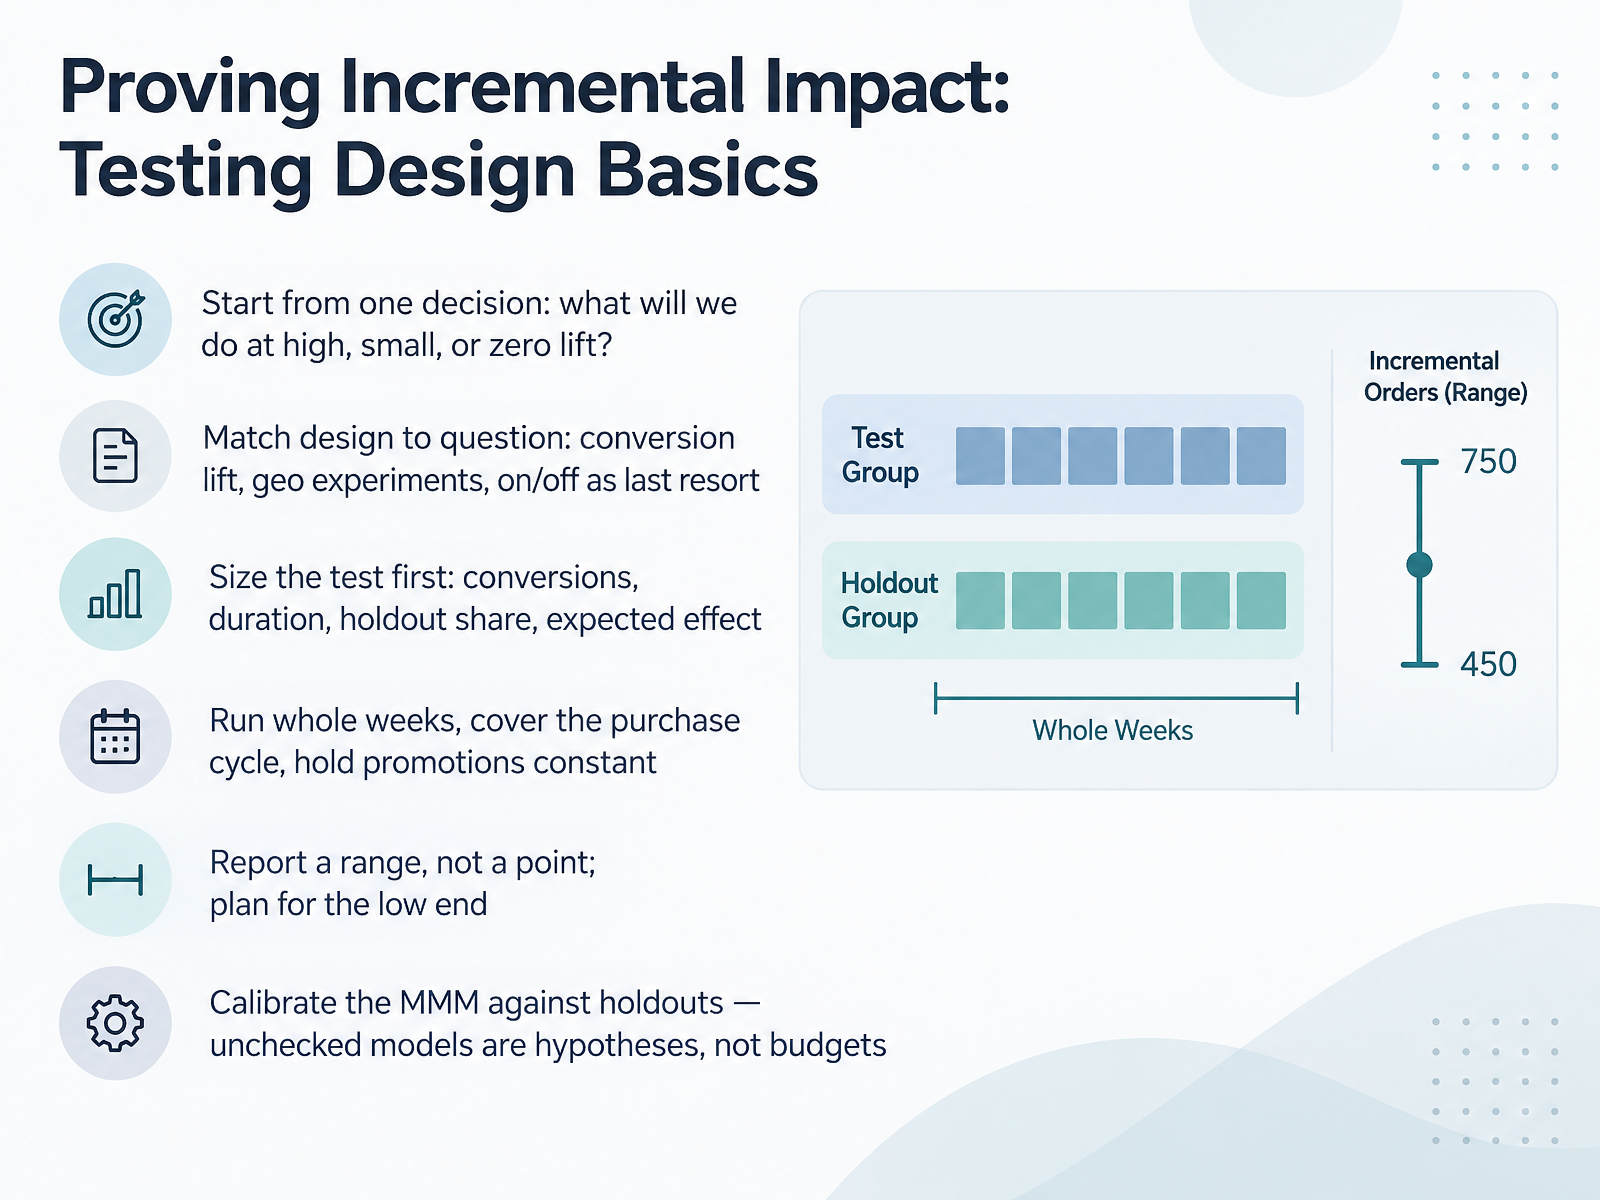
- 08Proving Incremental Impact: Testing Design BasicsLet's turn to proving incremental impact, because a lift number only matters if the design behind it is sound. Start from one decision. Write down what you will do at high lift, small lift, or zero lift. Then match the design to the question. Use a conversion lift study, a geo experiment, and keep on and off tests as a last resort. Size the test before you spend anything: conversions, duration, holdout share, and the effect size you expect. Run whole weeks, cover the full purchase cycle, and hold promotions constant across both groups. When you report, report a range, not a point, and plan your budget for the low end. Finally, calibrate your marketing mix model against real holdouts. An unchecked model is a hypothesis, not a budget. Ask your team which channel they trust least, and test that one first. Now let's move from metrics to business decisions.
 1 min
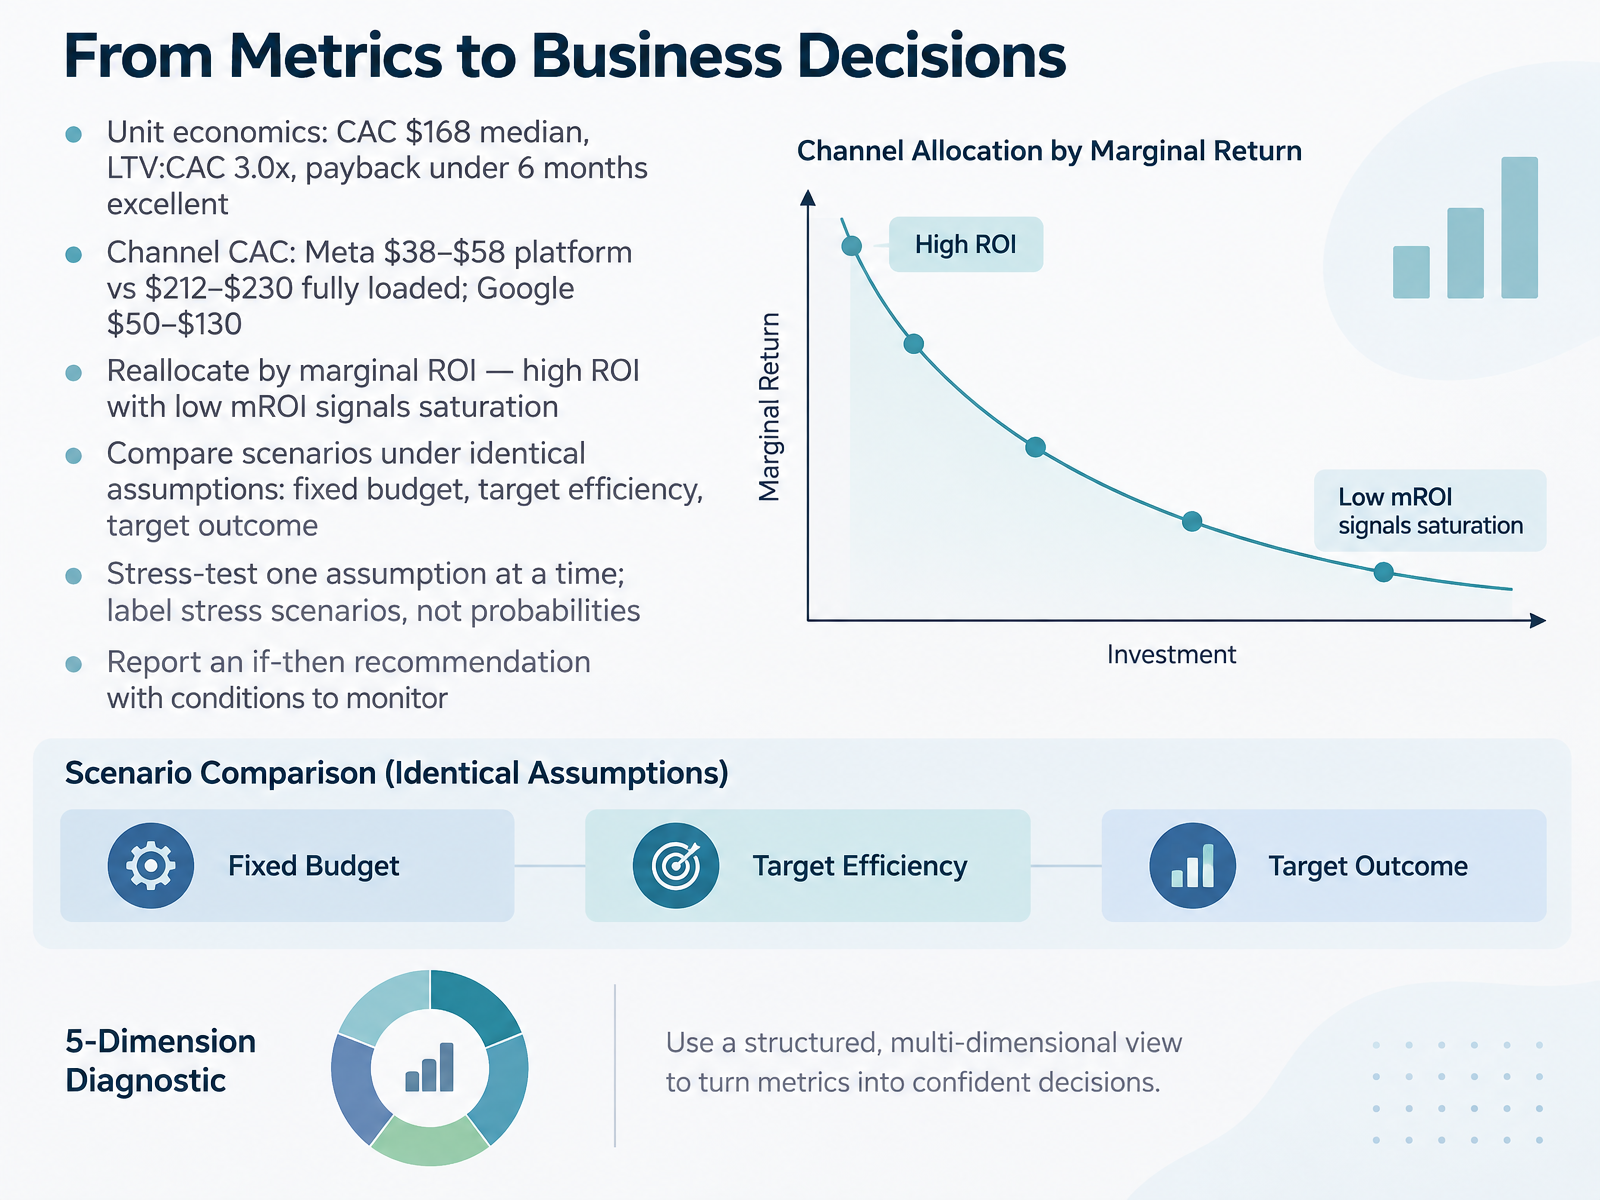
- 09From Metrics to Business DecisionsNow let's turn metrics into decisions you can actually defend in a campaign review. Start with unit economics. A median customer acquisition cost of one hundred sixty eight dollars means little on its own. Pair it with a lifetime value to acquisition cost ratio near three, and payback under six months, which is excellent. Next, check channel cost honestly. Meta can look like thirty eight to fifty eight dollars at the platform level, but two hundred twelve to two hundred thirty fully loaded. Google runs fifty to one hundred thirty. Then reallocate by marginal return, not average. High return with low marginal return signals saturation. Compare scenarios under identical assumptions: fixed budget, target efficiency, or target outcome. Stress-test one assumption at a time, and label stress scenarios as stress scenarios, not probabilities. Finally, report an if-then recommendation with the conditions your team should monitor. That gives you a decision, not a dashboard. The Evaluation Operating Rhythm is where we put this into practice.
 foundrycro.combenchmarketing.orgadlyse.com+22 min
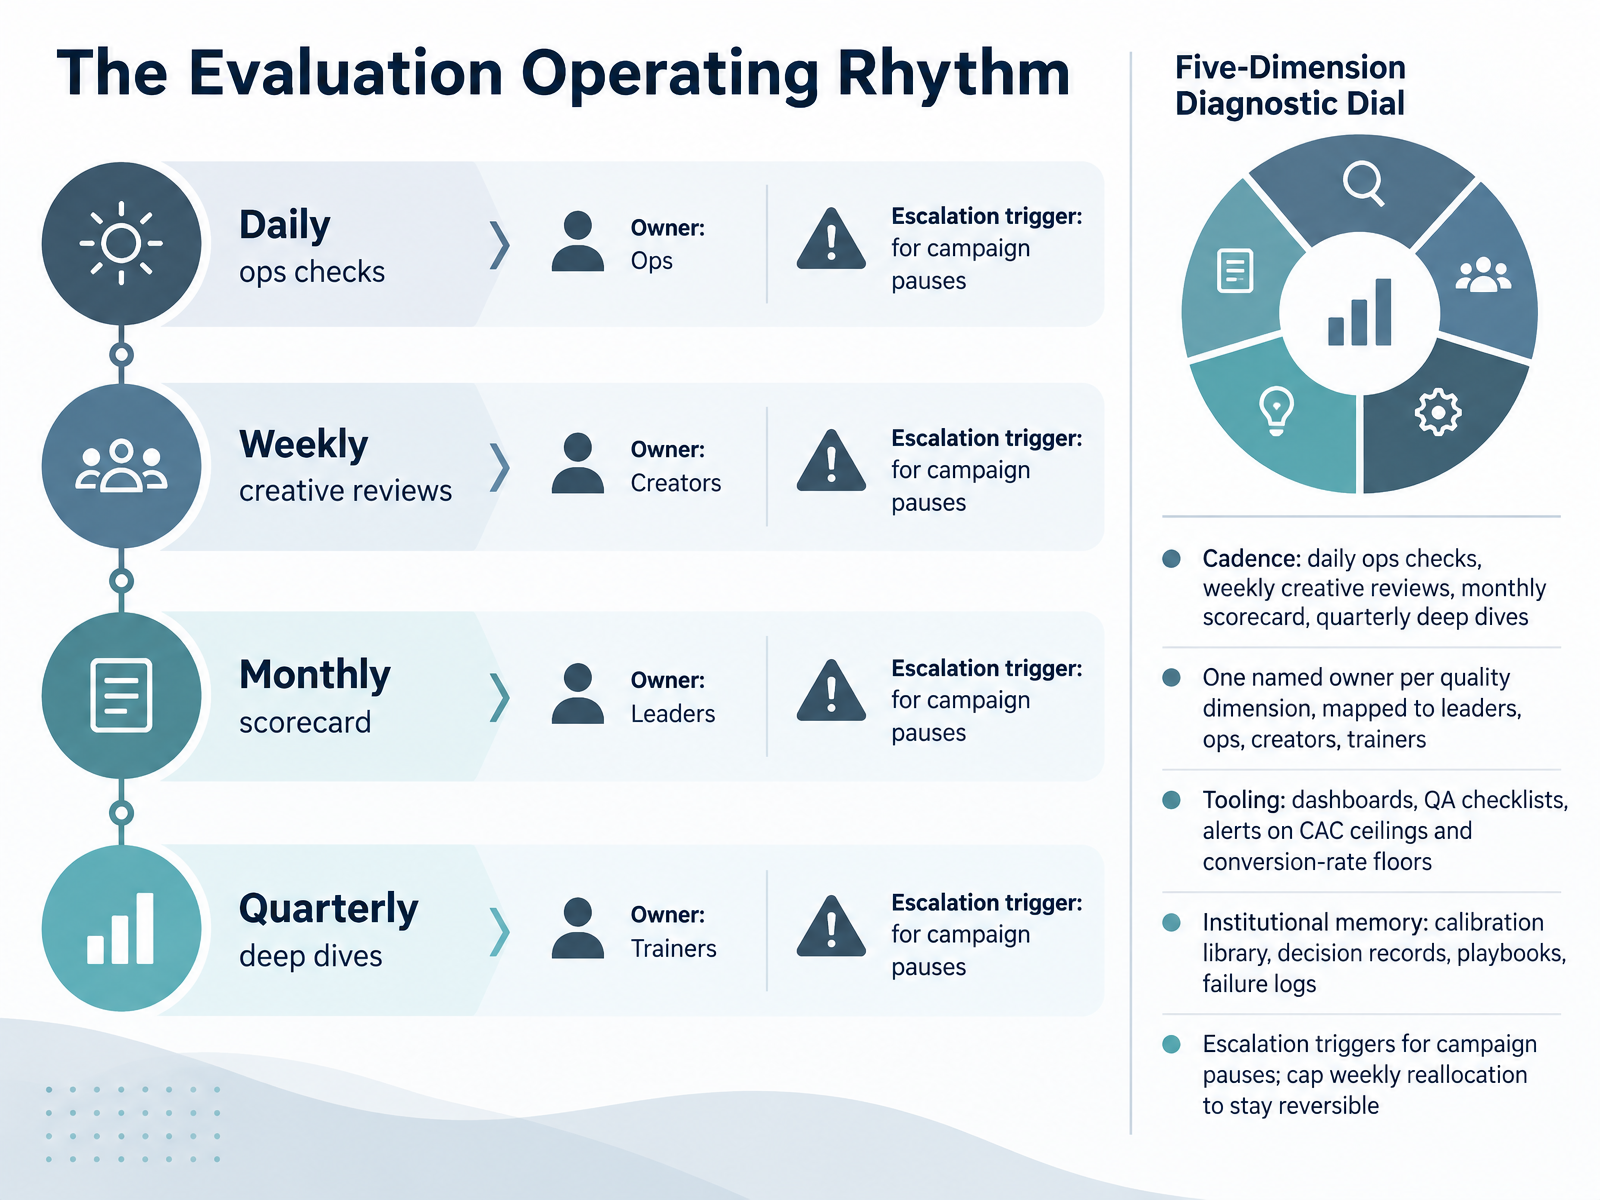
- 10The Evaluation Operating RhythmNow let's put evaluation on a rhythm. Cadence first. Daily ops checks catch broken tracking and budget pacing. Weekly creative reviews focus on the assets you are actually approving. A monthly scorecard pulls the picture together, and quarterly deep dives test the bigger assumptions. Name one owner per quality dimension. Map those owners across marketing leads, ops, creators, and trainers, so no dimension sits unowned. For tooling, keep dashboards visible, run QA checklists before launch, and set alerts on your CAC ceilings and conversion rate floors. Build institutional memory too. A calibration library, decision records, playbooks, and a failure log save you from relitigating the same calls. Decide escalation triggers now, such as when a campaign pauses, and cap weekly budget reallocation so every move stays reversible. Next, we'll look at training the team to evaluate quality.
 searchengineland.comgradial.commarkup.ai+22 min
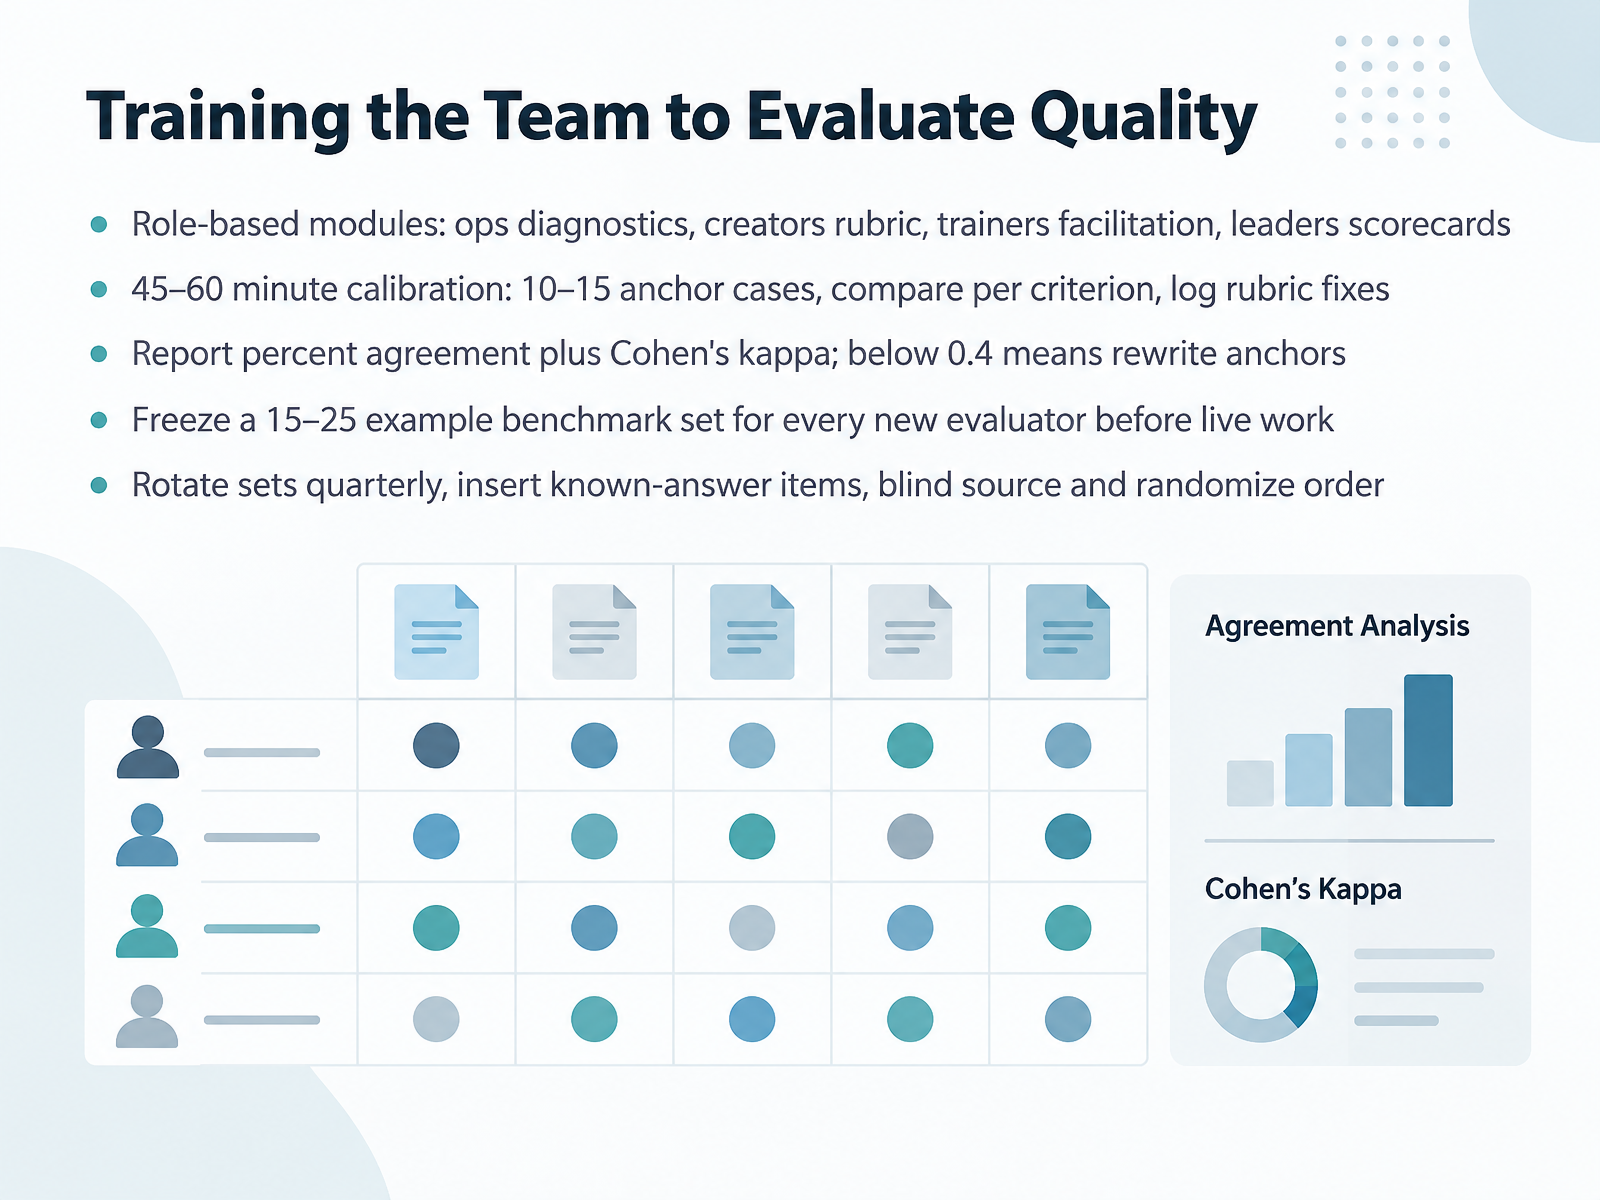
- 11Training the Team to Evaluate QualityNow let's look at how you train your team to evaluate quality consistently. Start with role-based modules. Ops staff get diagnostics, creators get the rubric, trainers get facilitation, and leaders get scorecards. Then run a calibration session of forty-five to sixty minutes with ten to fifteen anchor cases. Have everyone score independently, compare per criterion, and log rubric fixes. Report percent agreement plus Cohen's kappa. If kappa falls below zero point four, the rubric is ambiguous, so rewrite the anchors. Before anyone touches live work, freeze a benchmark set of fifteen to twenty-five examples and make every new evaluator pass through it. Rotate your sets quarterly, insert known-answer items, blind the source, and randomize order. Ask your team to run one calibration this month. Next, we'll cover common pitfalls and how to catch them early.
 1 min
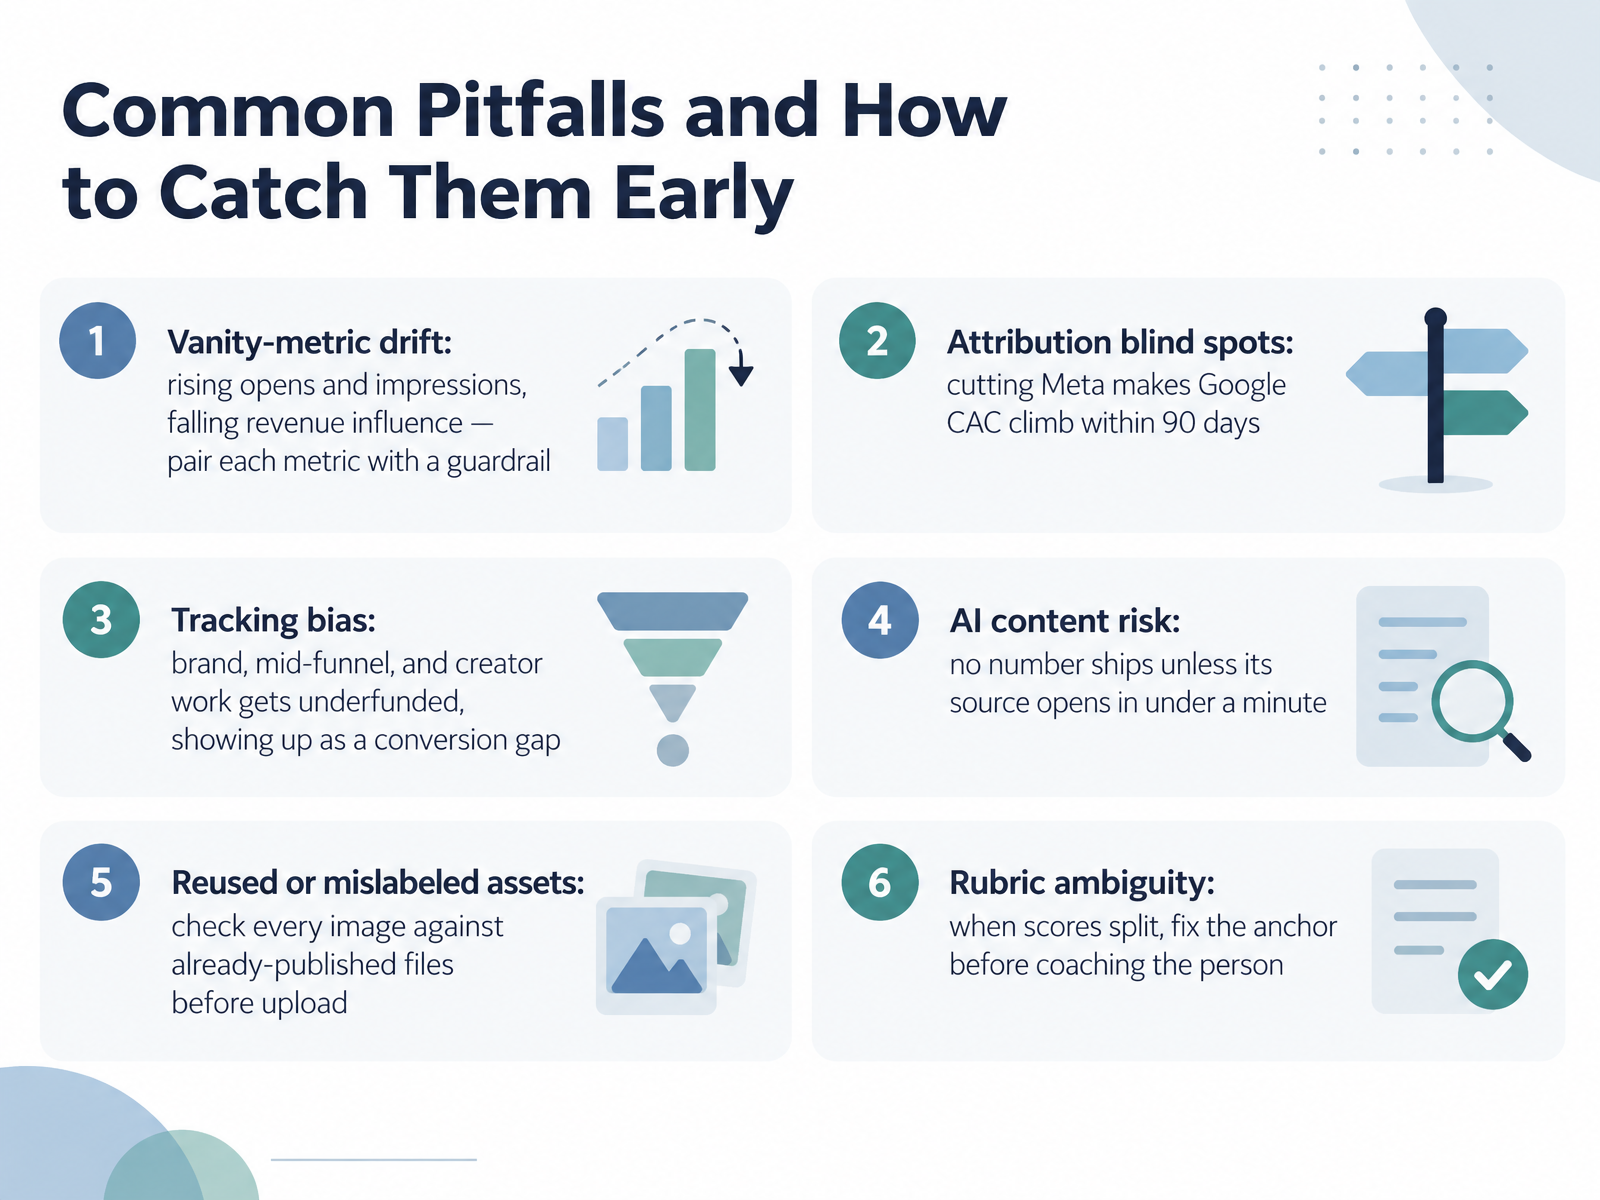
- 12Common Pitfalls and How to Catch Them EarlyLet's talk about the pitfalls that quietly cost you money, and how to catch them early. Start with vanity-metric drift. Opens and impressions climb while revenue influence falls. So pair every metric with a guardrail, like revenue per thousand impressions, and check it in your weekly review. Next, attribution blind spots. If you cut Meta, watch Google's customer acquisition cost climb within ninety days. Verify with a blended view before you shift budget. Tracking bias underfunds brand, mid-funnel, and creator work, and it shows up later as a conversion gap. Give those channels a fair share of your reporting. On AI content, set one rule: no number ships unless its source opens in under a minute. Before uploading any image, check it against already-published files for reuse or mismatched labels. And when reviewers split on a score, fix the rubric anchor first, then coach the person. Ask your team which of these they can catch this week.
 searchengineland.comgradial.commarkup.ai+22 min
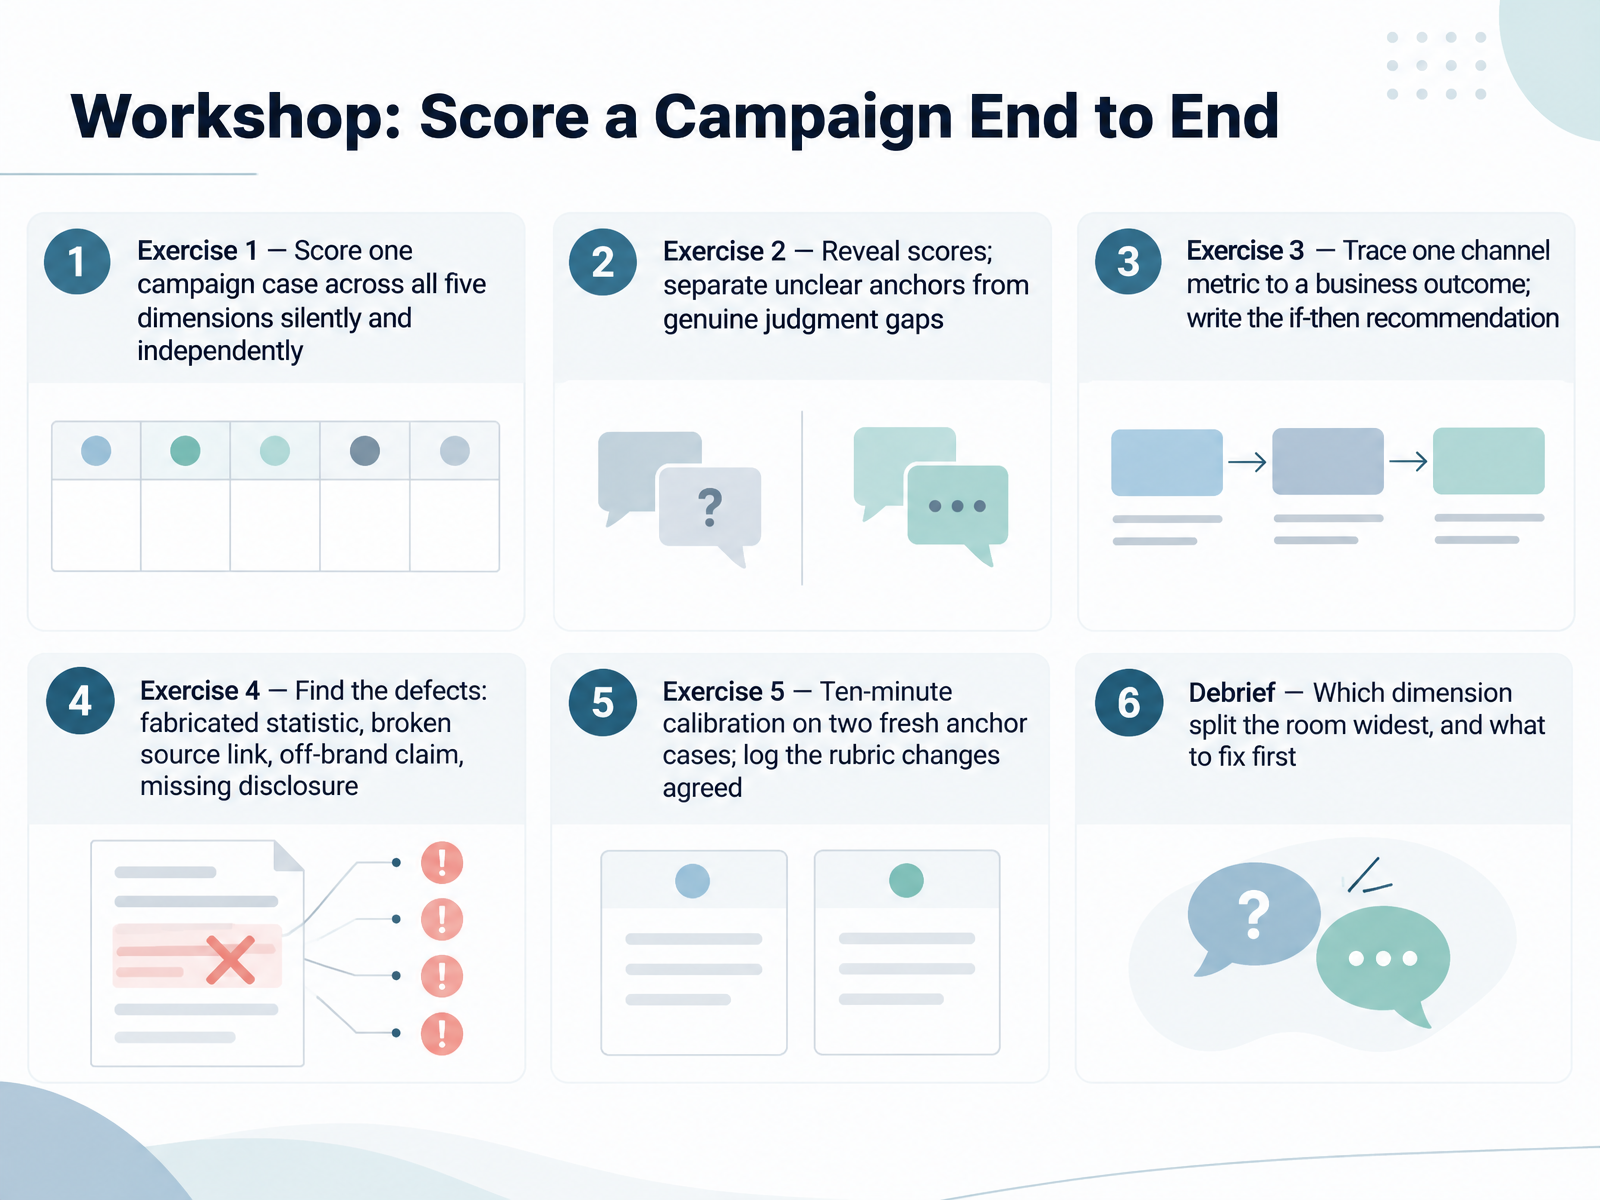
- 13Workshop: Score a Campaign End to EndNow let's put the rubric to work in a live workshop. Your team works through five exercises. In the first, everyone scores the same campaign case across all five dimensions silently and independently, so no one anchors on a colleague's answer. Then you reveal scores and sort the disagreements: which ones came from unclear anchors, and which are genuine judgment gaps. In exercise three, each person traces one channel metric to a business outcome and writes a simple if-then recommendation. Next, find the defects in a prepared asset: a fabricated statistic, a broken source link, an off-brand claim, and a missing disclosure. Exercise five is a ten-minute calibration on two fresh anchor cases, and you log the rubric changes the group agrees on. Before you close, run the debrief: ask which dimension split the room widest, and fix that anchor first. Keep the log, and rotate in fresh cases next session. That brings us to the action plan and key takeaways.
 searchengineland.comgradial.commarkup.ai+22 min
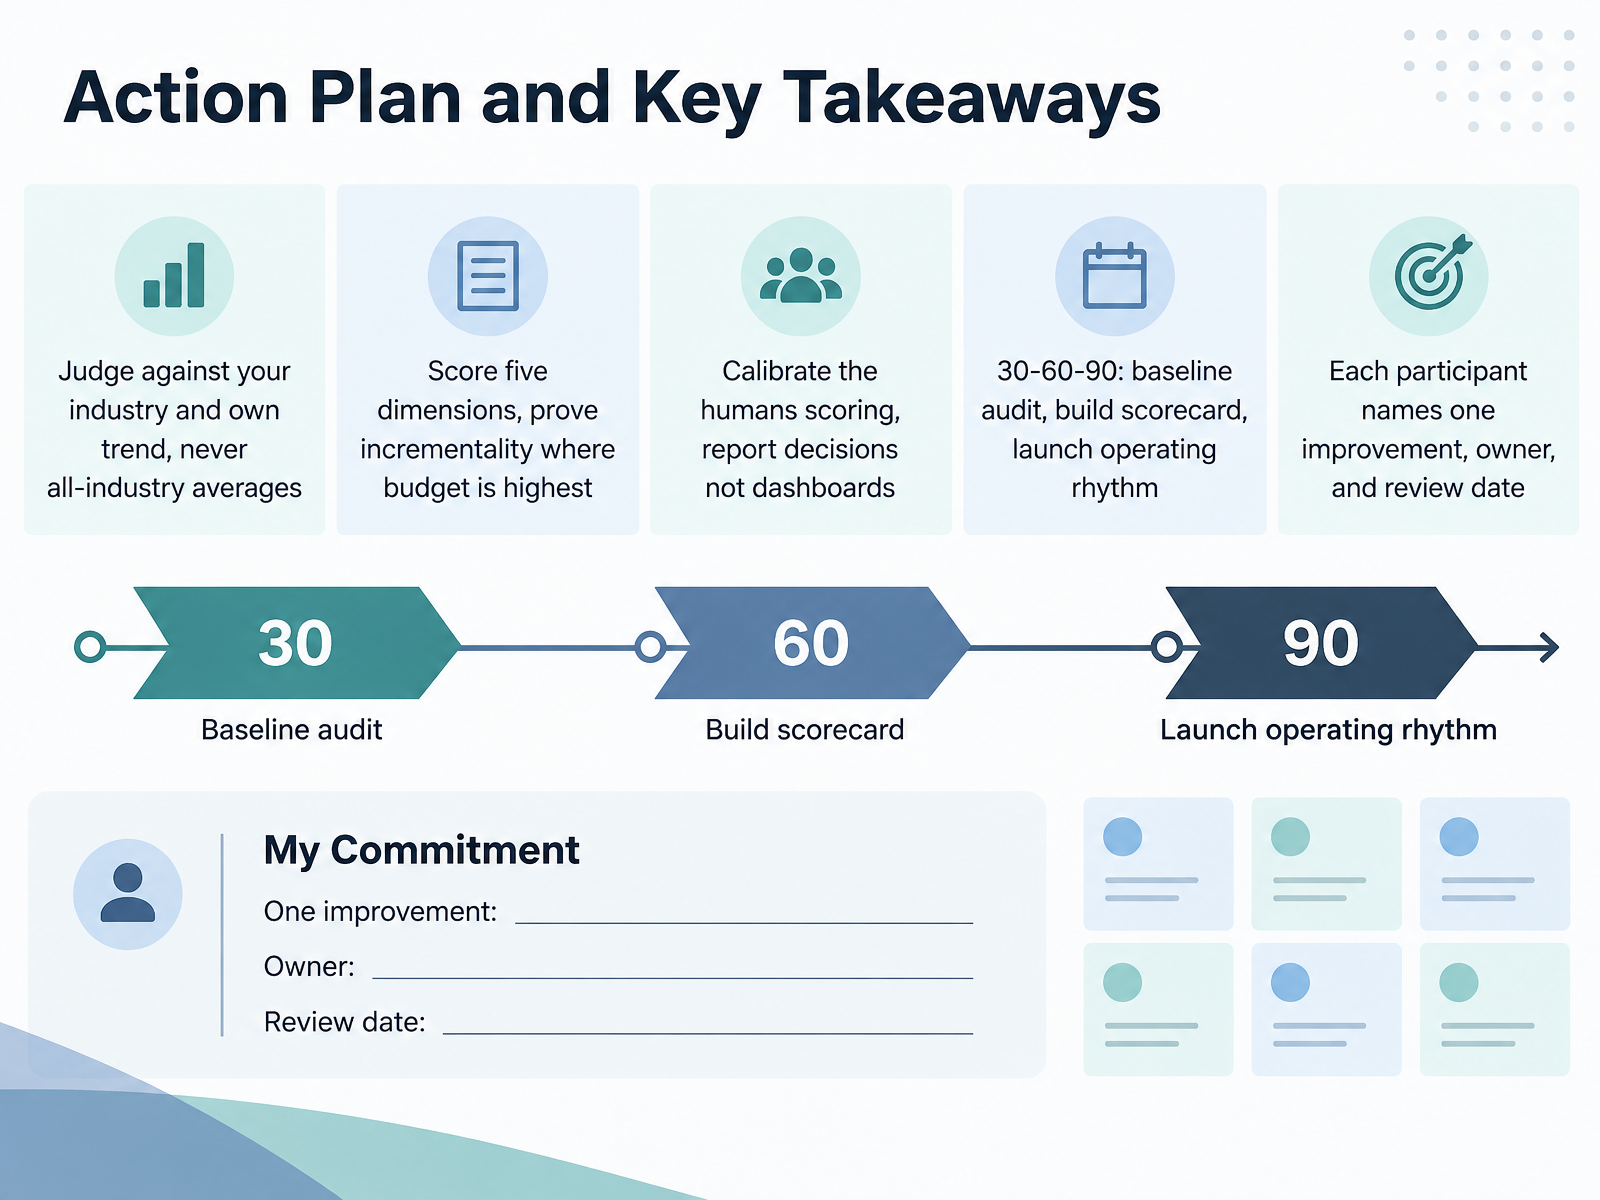
- 14Action Plan and Key TakeawaysLet's close by turning everything we covered into an action plan you can actually run. First, judge performance against your industry and your own trend, never the all-industry average. A click-through rate that looks weak overall may be strong for your vertical. Second, score all five dimensions, and where your budget is highest, prove incrementality with a holdout test. Third, calibrate the humans doing the scoring, so two reviewers reach the same verdict. Then report decisions, not dashboards; tell leadership what you will change and why. Fourth, use a simple thirty, sixty, ninety rhythm: audit your baseline, build the scorecard, then launch the operating rhythm into your campaign reviews. Finally, have each participant name one improvement, one owner, and a review date. Write those down before you leave today. Thank you for your attention and the good questions. You now have a practical path to evaluate quality with more confidence. Go apply one piece this week, and keep the conversation going with your team.
 benchmarketing.org1clickreport.comcmbeyer.com+22 min
Take the deck with you
Download this course as a file — free, no sign-up needed.
- PDF handoutEvery slide page, ready to print or share.15 pages · 3.0 MBDownload
- Narrated PowerPointThe deck that presents itself — every slide carries the digital human's narration video.15 pages · 12.9 MBDownload
- PowerPoint slidesThe full deck as a .pptx — open it in PowerPoint, Keynote, or Google Slides.15 pages · 2.9 MBDownload
Free to use in your own training — please keep the PersonWise credit page at the end.
Have your own deck? Turn it into a course
Sources consulted
Web sources consulted while building this course.
- The 2026 Paid Media Benchmark Report — FoundryCRO — foundrycro.com
- Metrics Benchmarks 2026 | Benchmarketing — benchmarketing.org
- The 2026 Paid Media Benchmark Report — adlyse.com
- Digital Benchmarks by Industry: PPC | WordStream — wordstream.com
- Average CAC by Channel 2026: Meta $42, Google $38, TikTok $51 | Eightx — eightx.co
- Marketing Benchmarks by Industry 2026 | 500+ Verticals — benchmarketing.org
- marketing KPI benchmarks by industry for 2026 — 1clickreport.com
- CM Beyer North America — Marketing Benchmarks 2026 — cmbeyer.com
- 300+ Marketing Benchmarks by Industry 2026 — cufinder.io
- Performance Marketing Benchmarks 2026 — CPC, CPM, CPA, ROAS by Platform — calc4marketers.com
- Guidance on the use of storage and access technologies | ICO — ico.org.uk
- Can privacy technologies replace cookies? Ad revenue in a field experiment | PNAS — pnas.org
- The Digital Omnibus: cookies, consent and digital advertising — taylorwessing.com
- Potential changes to UK online advertising rules ICO publishes advice to government - Bird & Bird — twobirds.com
- Adapting digital marketing strategies for a cookieless future: Challenges and opportunities — doi.org
- How to QA AI-generated content + free QA workflow checklist — searchengineland.com
- Content Quality Assurance for AI Marketing | Gradial — gradial.com
- AI Content Review: How to Check AI Content | Markup AI — markup.ai
- CMA AI Playbooks — thecma.ca
- How to Evaluate AI-Generated Marketing Content Quality — futurefactors.ai