Begin
15 pages · ~30 min
Sales Enablement Metrics Analysis
This training teaches sales enablement professionals how to measure and interpret key performance metrics to evaluate and improve program effectiveness.
A digital instructor presents all 15 pages. Hold “Ask” at any point and ask out loud — the answer comes from this course. No sign-up needed.
What you’ll learn
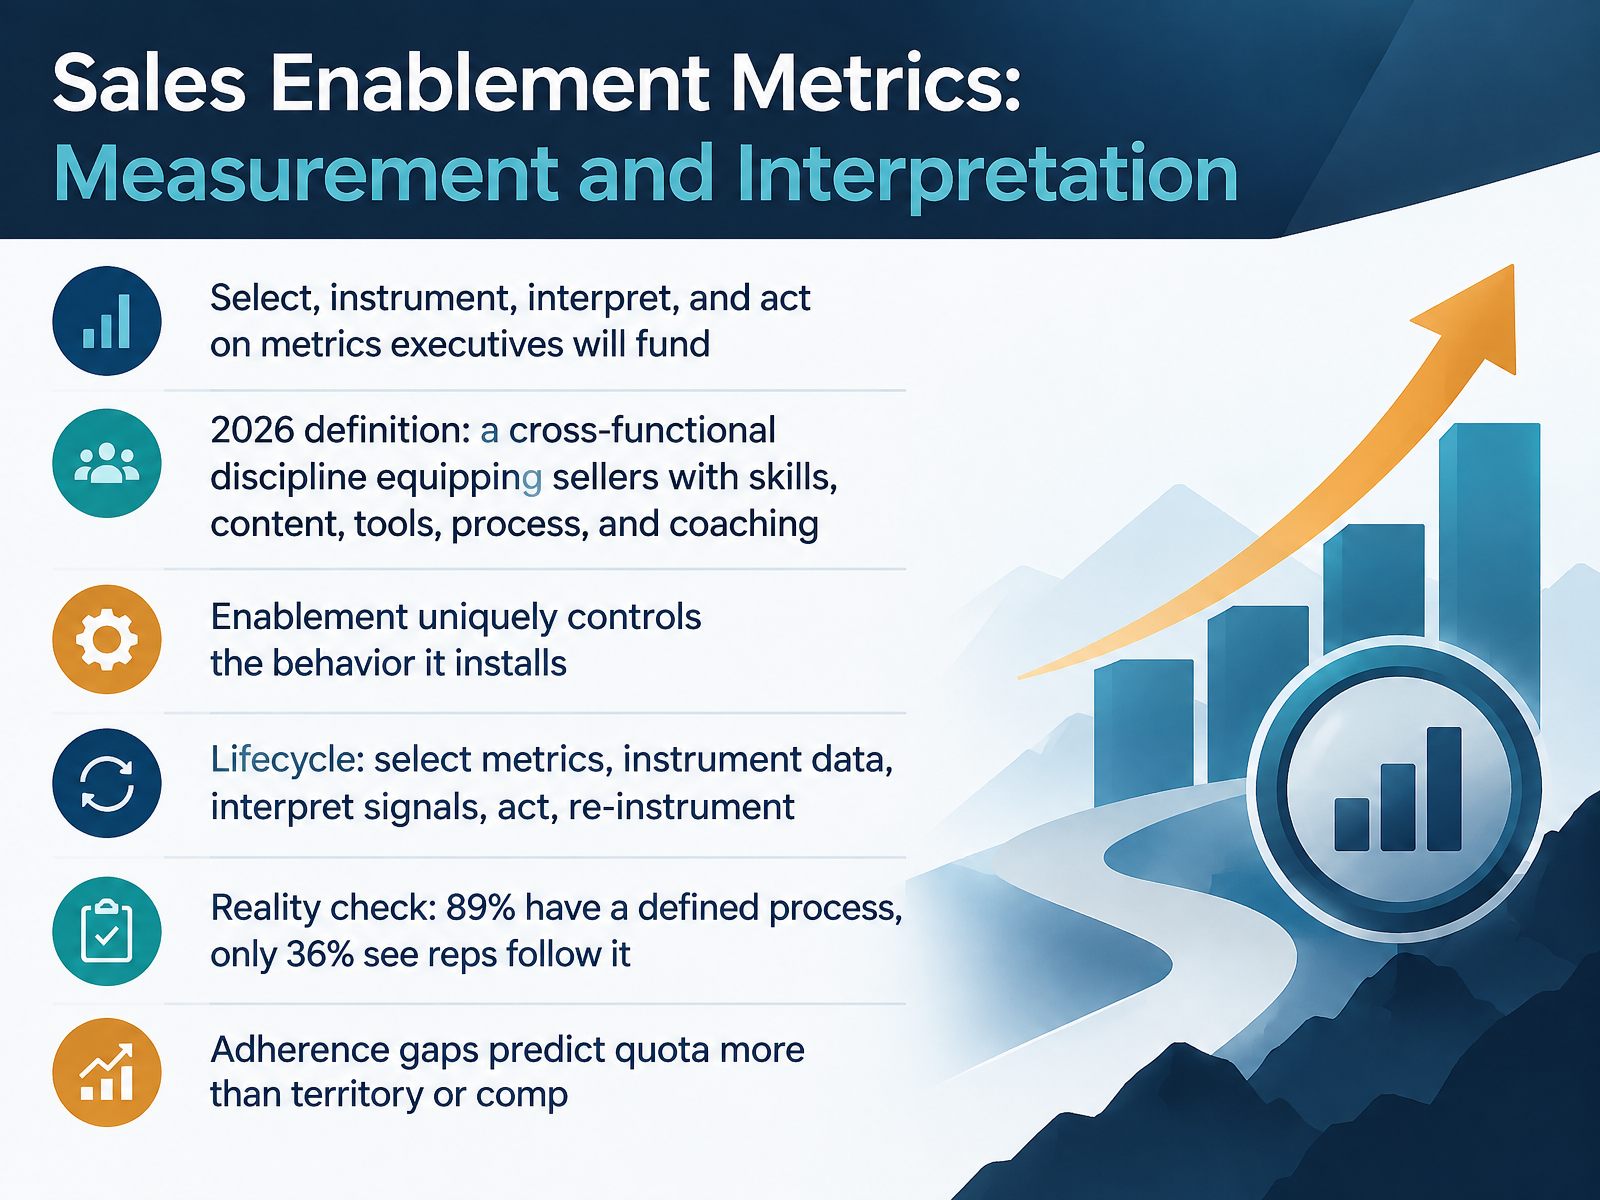
- 01Sales Enablement Metrics: Measurement and InterpretationWelcome. Over the next few minutes, we're going to talk about sales enablement metrics, and specifically how to measure and interpret them so executives actually fund the work. Here's the discipline in one line. Select metrics, instrument the data, interpret the signals, act, then re-instrument. In 2026, enablement is a cross-functional discipline. It equips sellers with skills, content, tools, process, and coaching. What makes it different from every other function? Enablement uniquely controls the behavior it installs. Now, the reality check. Eighty-nine percent of teams have a defined process. Only thirty-six percent see reps follow it. Read that again, because adherence gaps predict quota better than territory or compensation. So when you report a number, tell the story behind it. This tells you whether reps changed how they sell, not just whether training happened. Watch for adoption that looks healthy while deal behavior stays flat. That's the core idea. Measure what changes behavior, then prove it moved the number. Let's move on to why most enablement measurement fails.seismic.comsalesassembly.comapollo.io+22 min
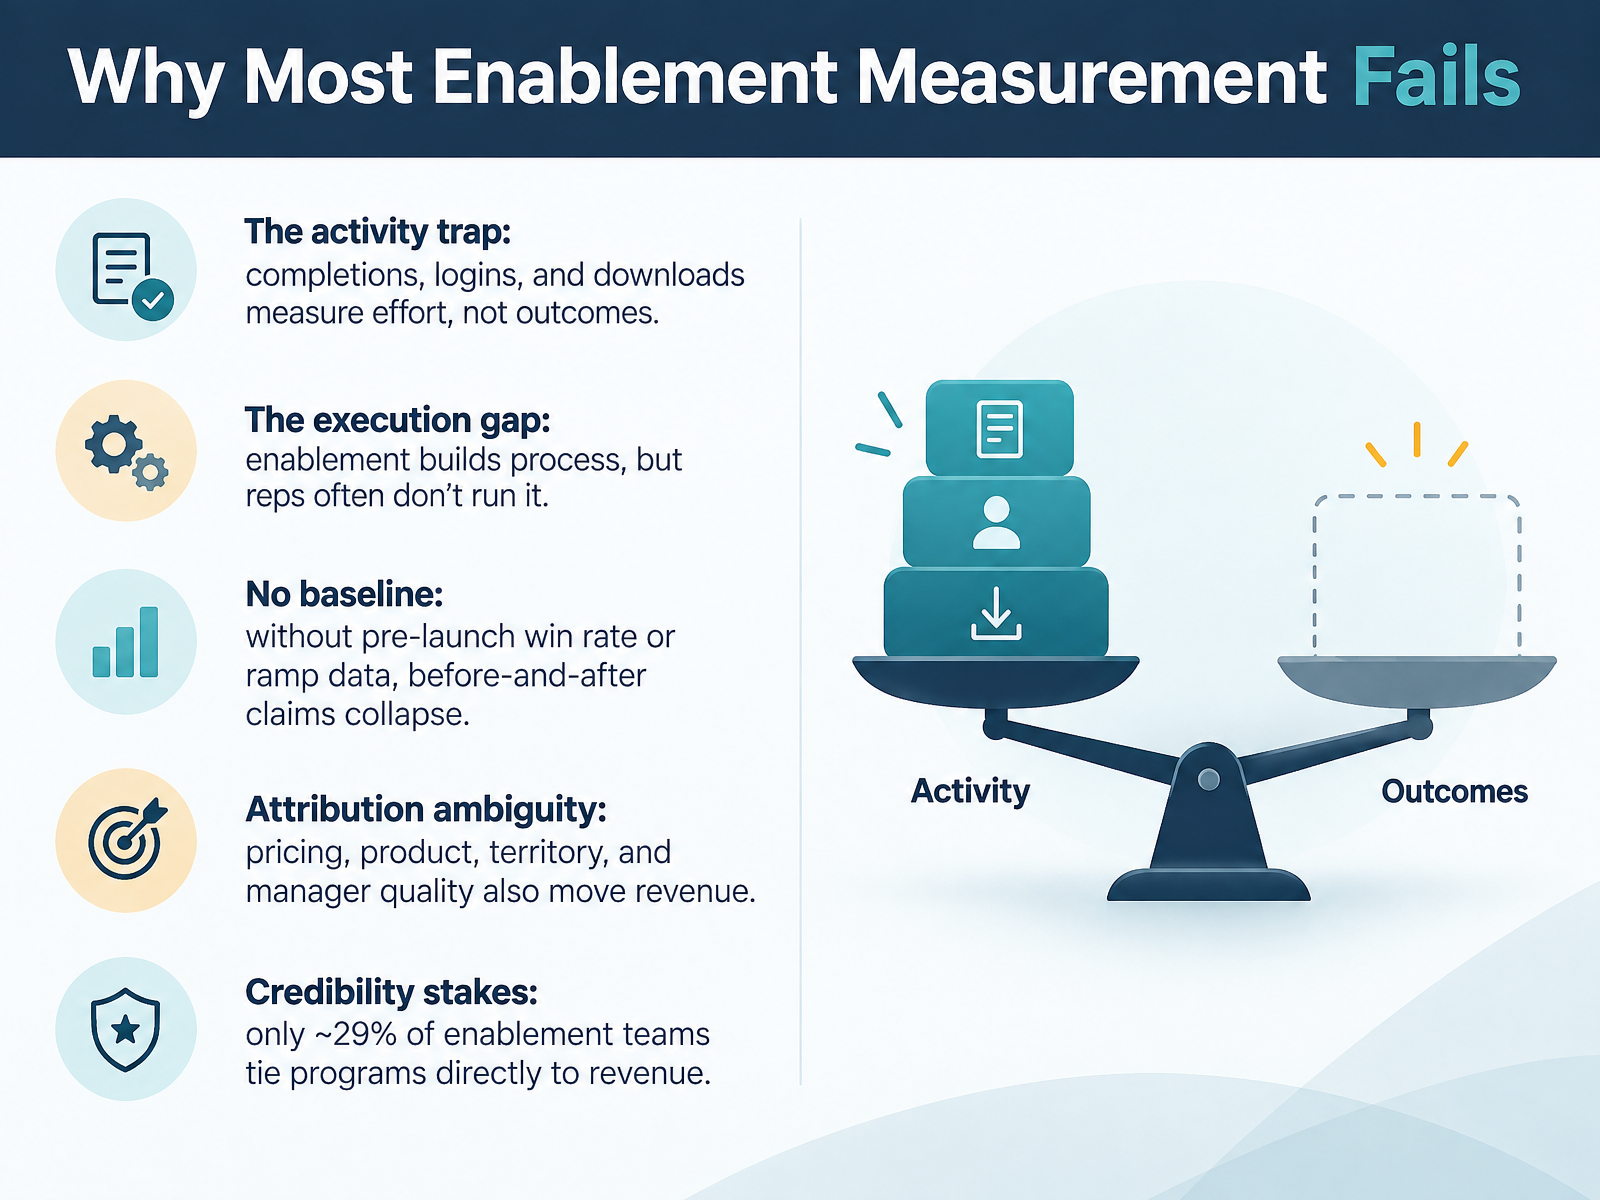
- 02Why Most Enablement Measurement FailsLet's talk about why most enablement measurement fails. There are five traps, and you have probably seen at least three of them this quarter. First, the activity trap. Completions, logins, downloads. This tells you people showed up, not that anything changed. Watch for dashboards where every metric is a consumption metric. Second, the execution gap. Most teams have a defined process, but only about a third of reps follow it consistently. You built the motion; reps aren't running it. Third, no baseline. If you didn't capture win rate or ramp time before launch, your before-and-after claim collapses. Watch for retroactively chosen start dates. Fourth, attribution ambiguity. Pricing, product, territory, and manager quality all move revenue. Claim all the credit and finance discounts all of it. Fifth, credibility. Only about twenty nine percent of enablement teams tie programs directly to revenue. So here's the takeaway: measure effort as a gate, never as proof. Next, we'll look at core metric categories and the balanced scorecard.
 community.highspot.comaccent-technologies.comkaon.com+21 min
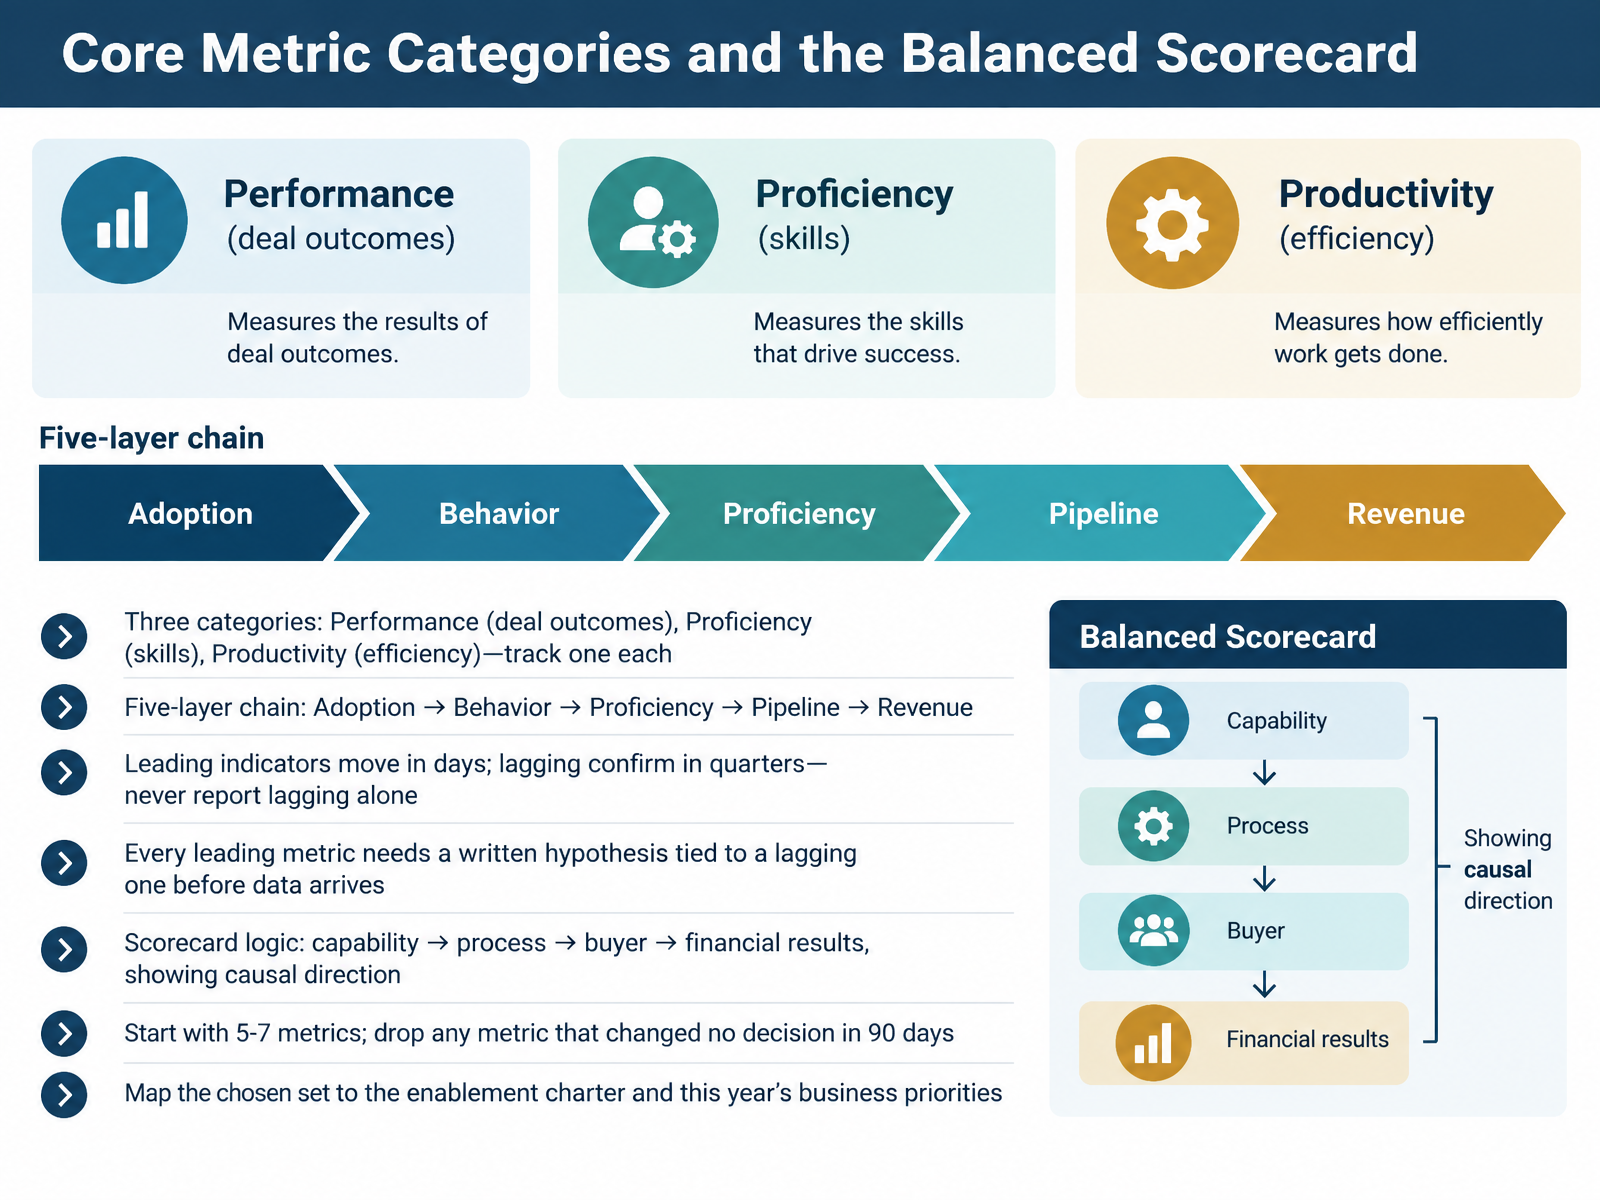
 - 03Core Metric Categories and the Balanced ScorecardLet's walk through the metric categories that hold your scorecard together. You have three: Performance, which covers deal outcomes. Proficiency, which covers skills. And Productivity, which covers efficiency. Track at least one from each. Why all three? Performance alone is too lagging. Proficiency alone is too disconnected from revenue. And Productivity alone can be gamed. Next, the five-layer chain: Adoption leads to Behavior, which leads to Proficiency, then Pipeline, then Revenue. Leading indicators move in days. Lagging indicators confirm in quarters. So never report lagging metrics alone. Every leading metric needs a written hypothesis tied to a lagging one before the data arrives. That gives you a testable claim, not a vague story. The scorecard logic follows causal direction: capability, then process, then buyer, then financial results. One discipline keeps this honest. Start with five to seven metrics, and drop any metric that changed no decision in ninety days. Finally, map your chosen set to the enablement charter and this year's business priorities. Now let's look at where that data actually comes from in Data Sources and Instrumentation Requirements.
 kpidepot.comkpidepot.comcommunity.highspot.com+22 min
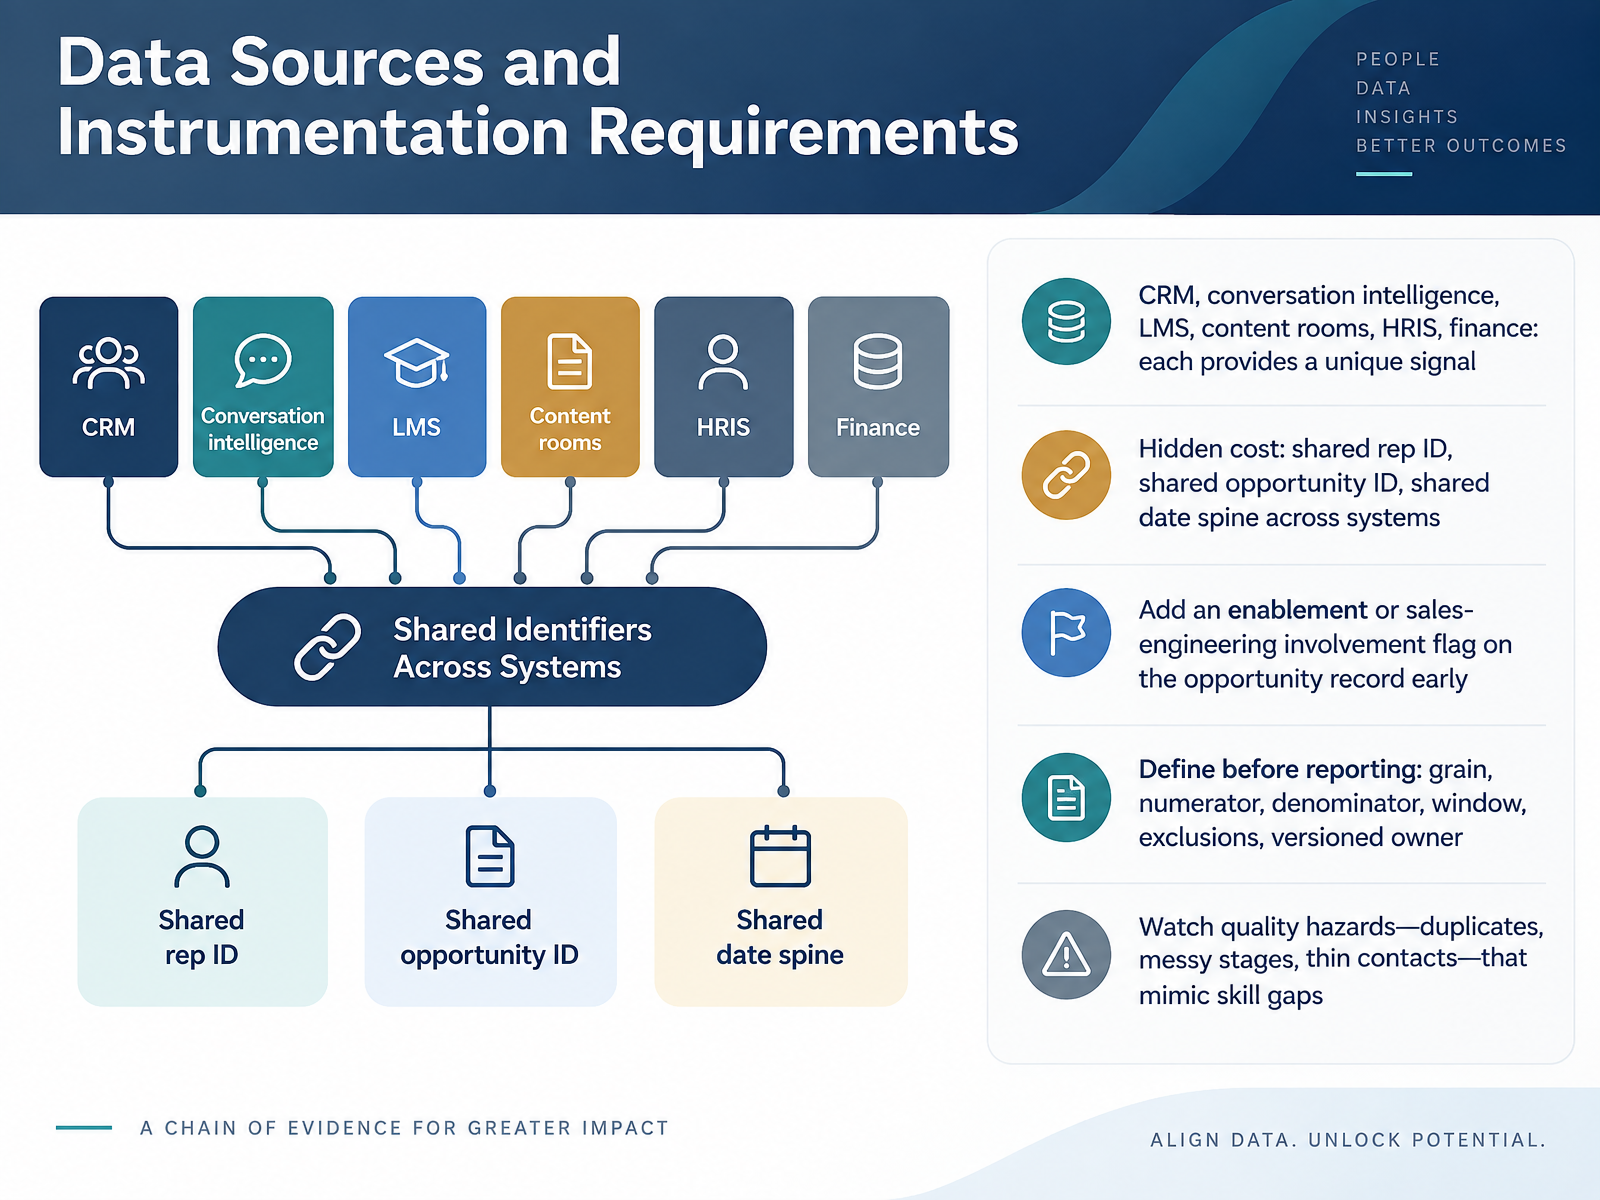
 - 04Data Sources and Instrumentation RequirementsNow let's talk about where your numbers actually come from. Each system gives you a different signal. Your CRM shows pipeline and outcomes. Conversation intelligence shows what reps said on calls. Your learning platform shows training. Content rooms, HRIS, and finance each add a layer. What this tells you is that no single source is the truth. The hidden cost is the plumbing: a shared rep ID, a shared opportunity ID, and a shared date spine across all of them. So add an enablement or sales engineering involvement flag on the opportunity record early. It takes minutes, and it becomes the foundation for attribution later. Then define before you report. Grain, numerator, denominator, window, exclusions, and a versioned owner. And watch for quality hazards that mimic skill gaps: duplicates, messy stages, thin contacts. A low connect rate can look like a messaging problem when it is really a coverage problem. So fix the data before you judge the rep. Next, we will cover writing shared metric definitions.
 datalane.comhelp.salesloft.comguideflow.com+22 min
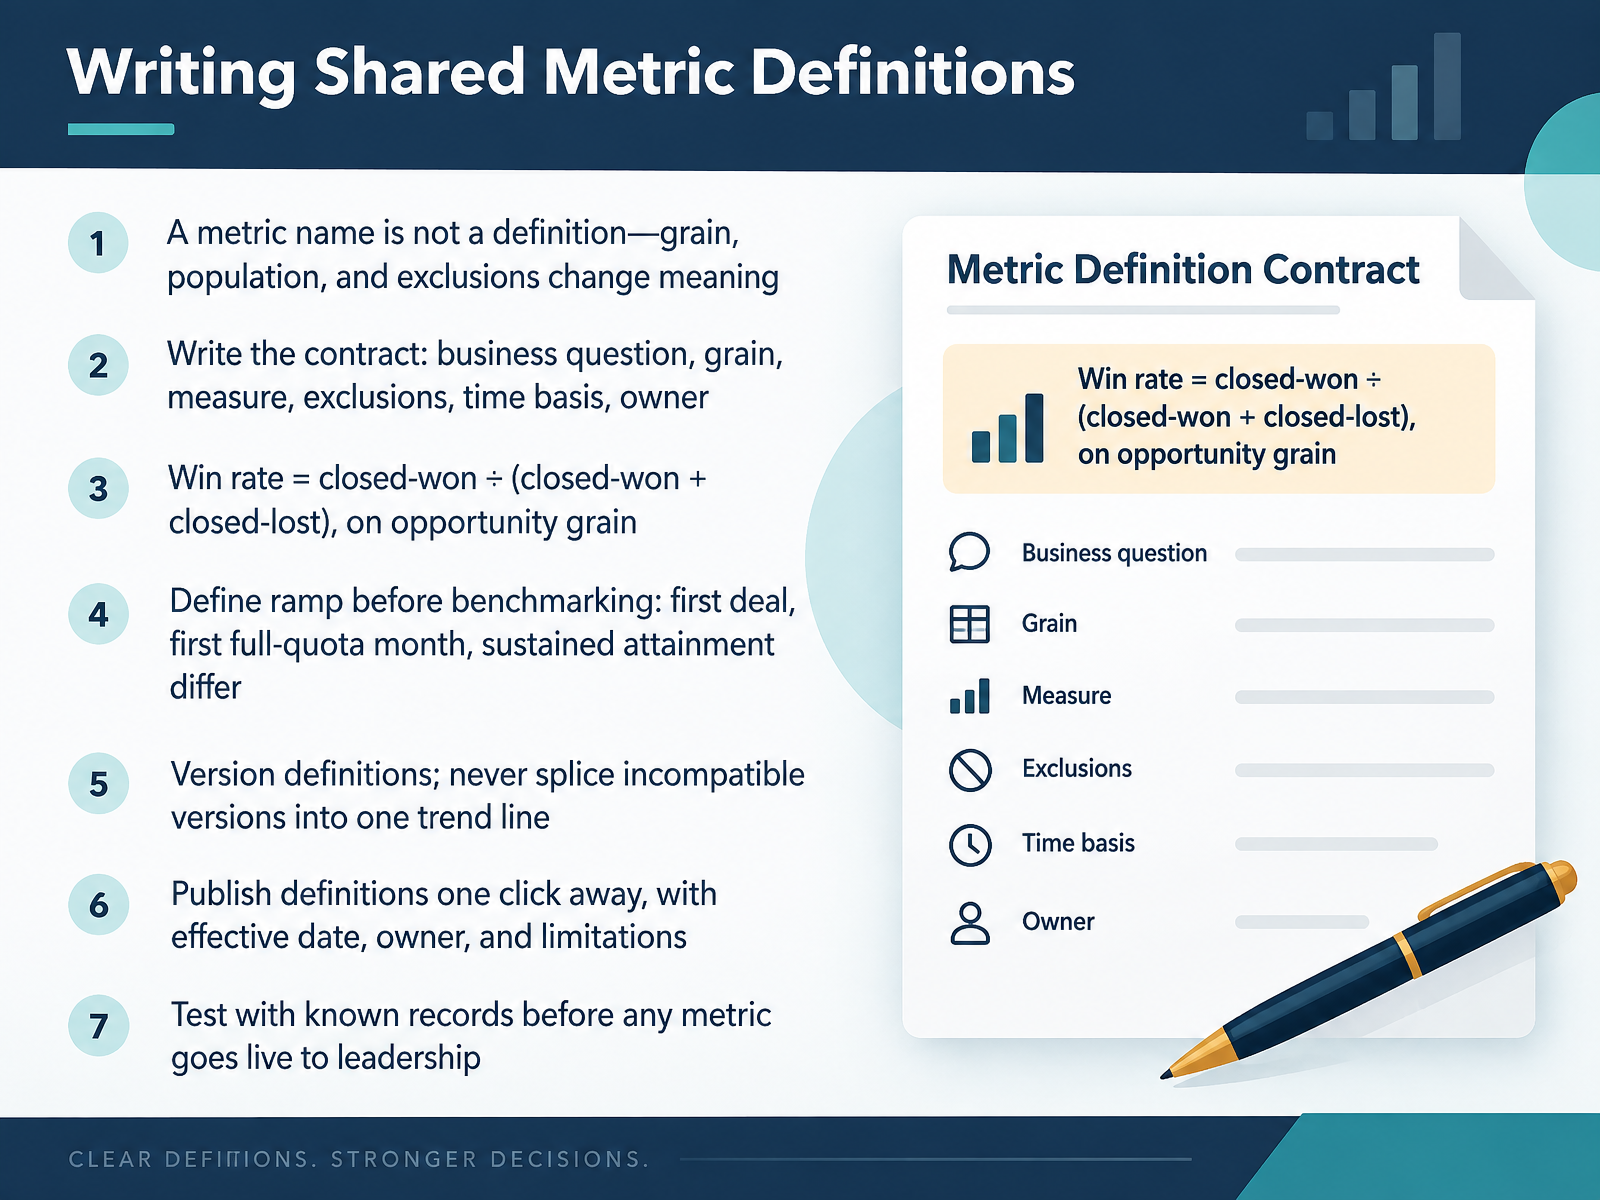
 - 05Writing Shared Metric DefinitionsLet's talk about writing shared metric definitions. A metric name is not a definition. Grain, population, and exclusions change meaning. Watch for this: pipeline means something different when the grain is one opportunity versus one rep-period. So write the contract. Business question, grain, measure, exclusions, time basis, and owner. For example, win rate equals closed-won divided by closed-won plus closed-lost, on opportunity grain. That tells you the unit of observation before anyone argues about the number. Define ramp before you benchmark it, because time to first deal, first full-quota month, and sustained attainment are three different things. Version your definitions, and never splice incompatible versions into one trend line. Publish definitions one click away, with effective date, owner, and known limitations. Then test with known records before any metric goes live to leadership. So the takeaway is this: the definition is the contract. Interpreting Results: Baselines, Benchmarks, and Causality.
 revenuetools.iosendnow.liveman.digital+21 min
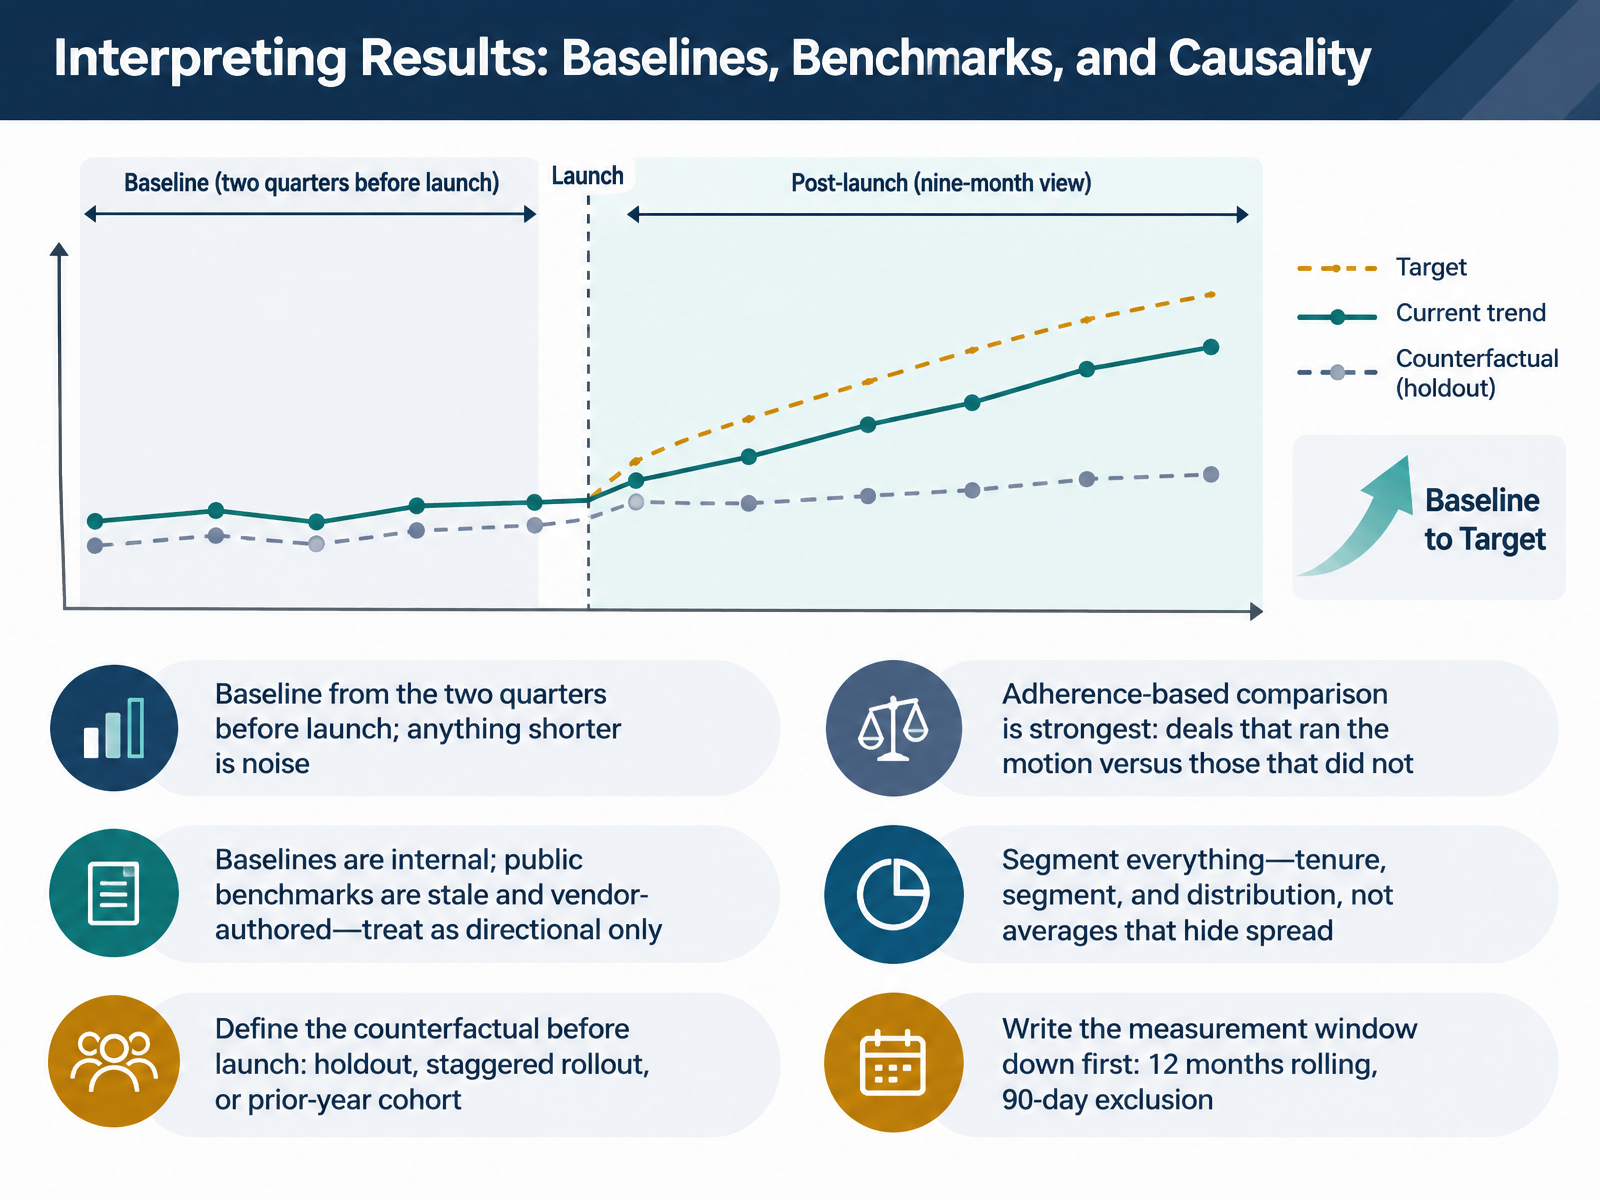
 - 06Interpreting Results: Baselines, Benchmarks, and CausalityNow let's talk about interpreting results. This is where most enablement measurement quietly falls apart. Start with your baseline. Set it from the two quarters before launch. Anything shorter is noise. Baselines are internal. Public benchmarks are usually stale and vendor authored, so treat them as directional only. Before launch, define the counterfactual. What would have happened without the program? A holdout, a staggered rollout, or a prior year cohort all work. The strongest comparison is adherence based. Compare deals that ran the motion against deals that did not. Then segment everything by tenure, segment, and distribution. Averages hide spread, and spread is usually the story. Finally, write the measurement window down first. Twelve months rolling, with a ninety day exclusion at the front. This tells you what actually moved, and it protects you from claiming credit too early. Building the Chain of Evidence From Behavior to Revenue.
 accent-technologies.comsupered.iokaon.com+12 min
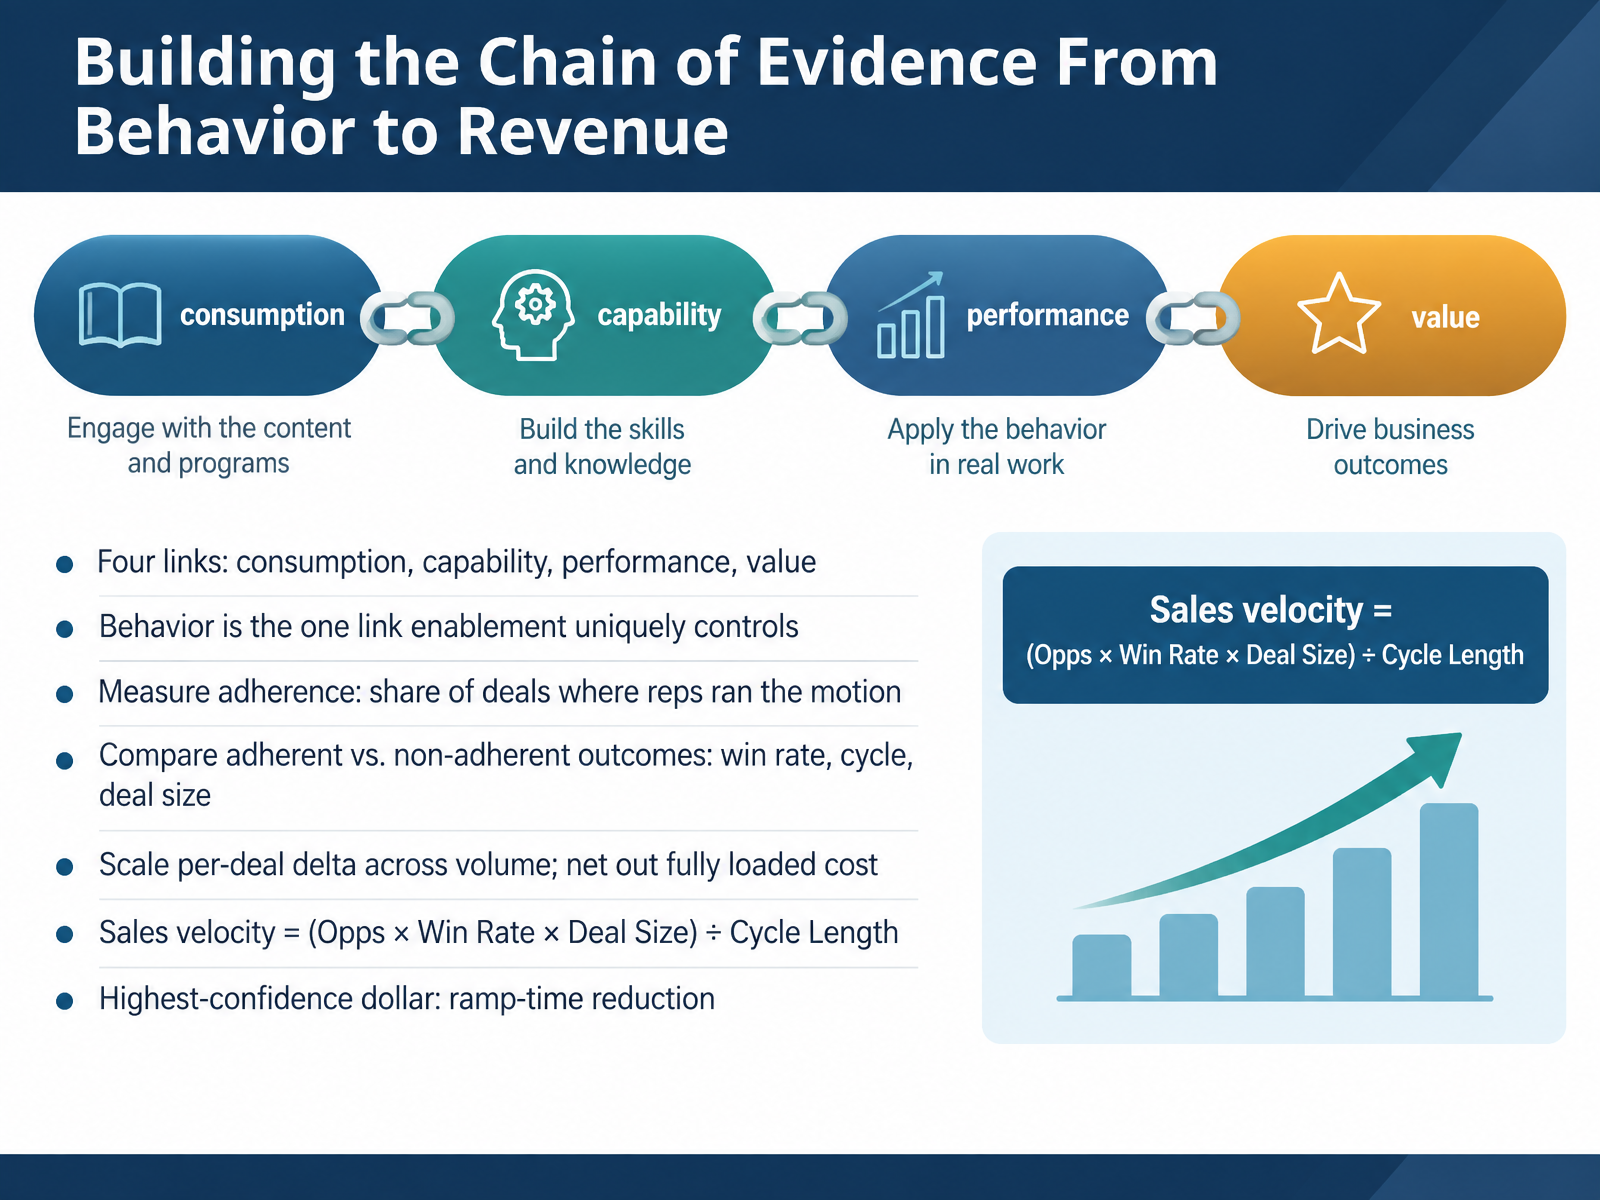
 - 07Building the Chain of Evidence From Behavior to RevenueNow let's build the chain of evidence, from behavior all the way to revenue. Four links. Consumption. Capability. Performance. Value. Consumption is a gate, not an outcome. The one link enablement uniquely controls is behavior. So measure adherence. That's the share of deals where reps actually ran the motion. Then compare adherent versus non-adherent deals on win rate, cycle length, and deal size. Both groups sell the same product at the same price, so the delta is the behavior's contribution. Scale that per-deal delta across volume, then net out fully loaded cost, including rep selling time. It all rolls up into sales velocity: opportunities times win rate times average deal size, divided by cycle length. Watch for two traps. Touched-revenue attribution, and celebrating a bottom-quintile bounce that's really just regression to the mean. One more thing. The highest-confidence dollar conversion is ramp-time reduction. It needs no attribution modeling at all, which is exactly why it survives finance review. Next, we'll look at Dashboards That Drive Decisions.
 accent-technologies.comsupered.iokaon.com+22 min
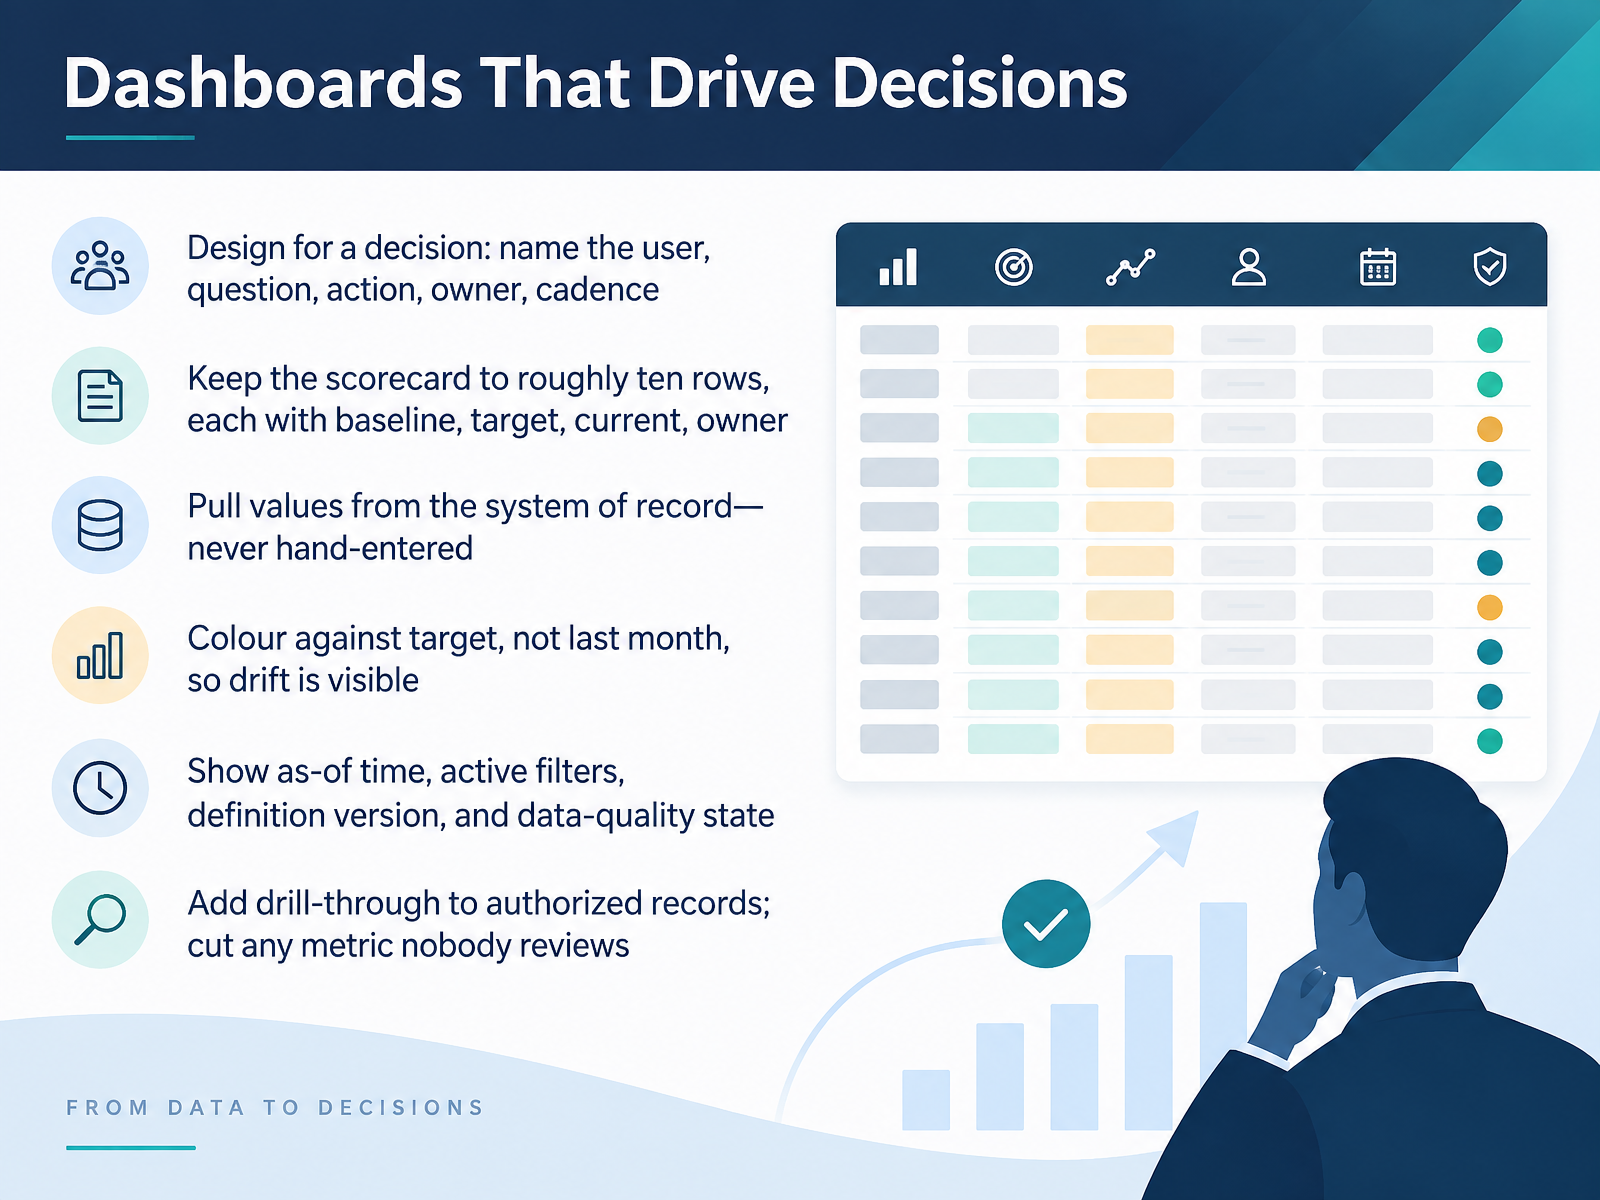
 - 08Dashboards That Drive DecisionsLet's turn to dashboards that actually drive decisions. Here's the core rule. Design every dashboard for one decision. Name the user, the question, the action, the owner, and the cadence. If you can't name the action, that metric doesn't belong on the page.
Keep your scorecard to roughly ten rows. Each row gets a baseline, a target, a current value, and an owner. This tells you where you started, where you're going, and who is accountable.
Pull every value from the system of record. Never hand-enter numbers. Manual entry is where trust in a dashboard dies.
Colour against target, not last month. If you compare to last month, a slow drift toward missing the number stays invisible until it's too late.
Always show the as-of time, the active filters, the definition version, and the data-quality state. That tells you when the number is safe to act on.
And add drill-through to the authorized records behind each number. Then cut any metric nobody actually reviews.
Next, we'll look at the operating cadence that keeps this working: weekly, monthly, and quarterly reviews.
 revenuetools.iosendnow.liveman.digital+22 min
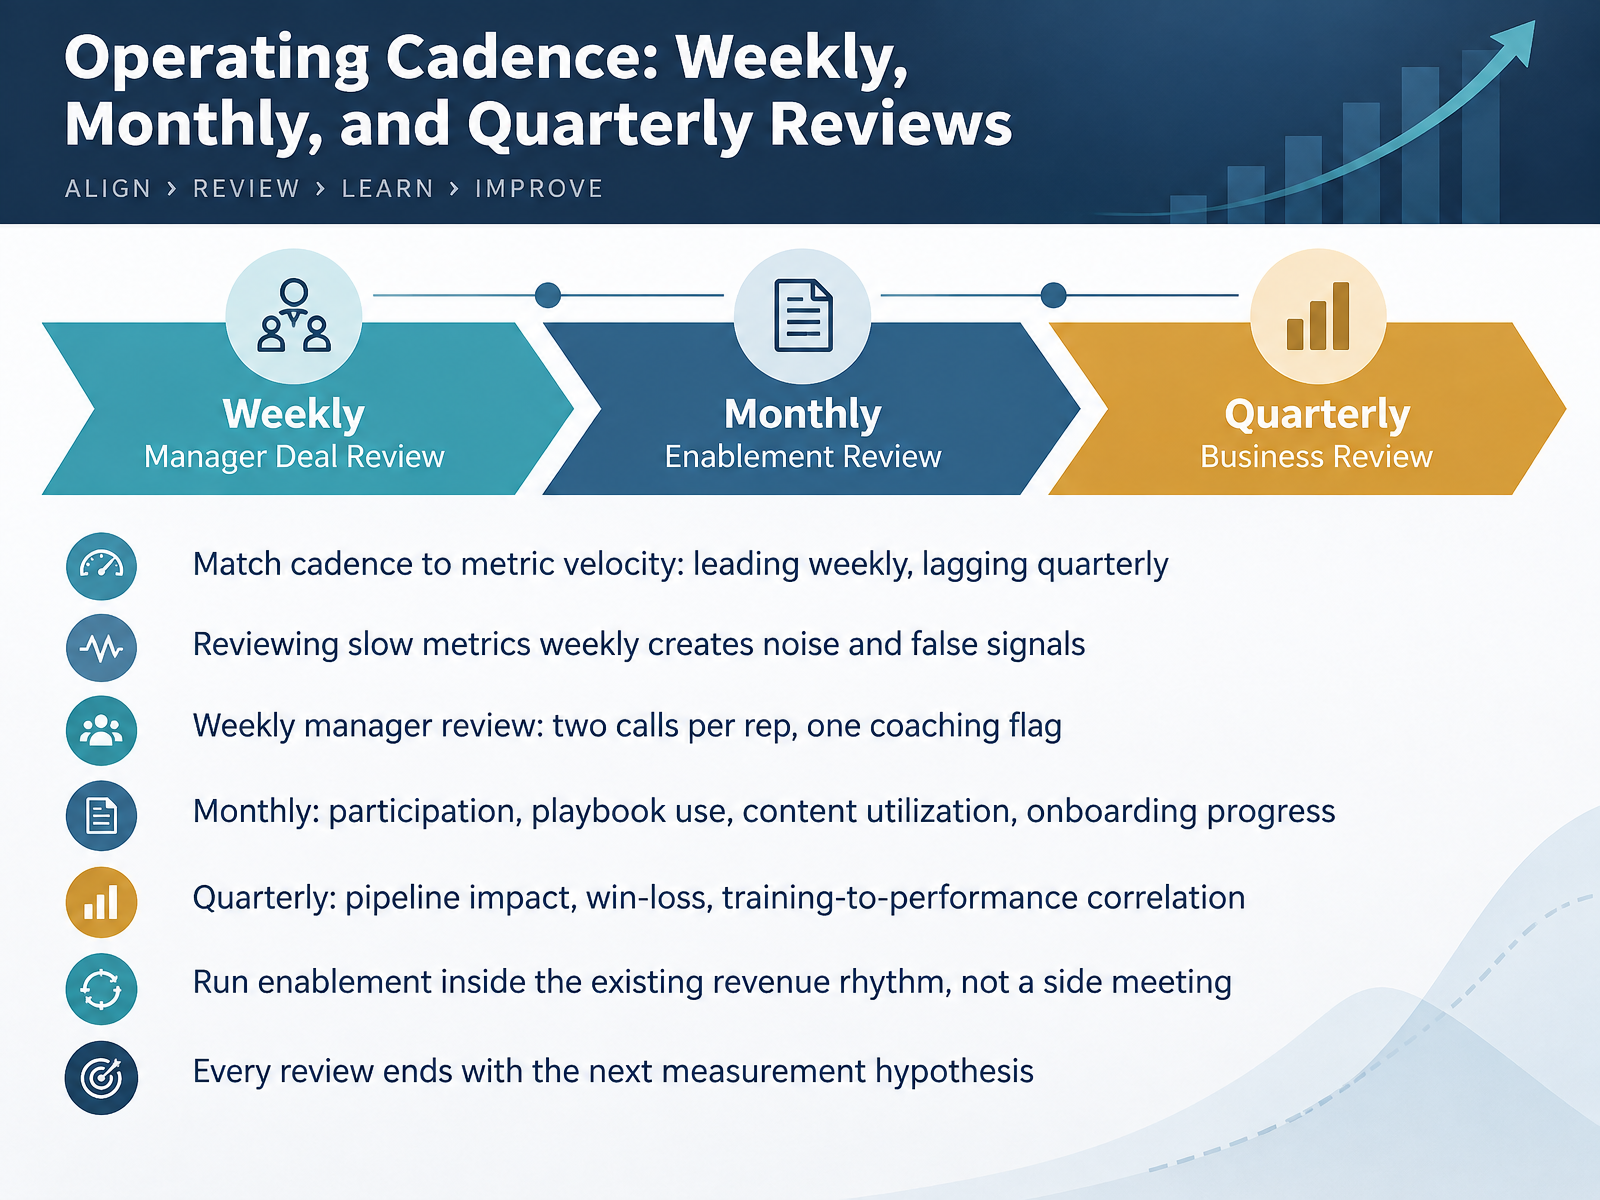
 - 09Operating Cadence: Weekly, Monthly, and Quarterly ReviewsNow, let's talk about the operating cadence that makes these metrics usable. The core rule is simple. Match the cadence to the metric's velocity. Leading indicators move weekly. Lagging indicators move quarterly. If you review win rate every week, you are not measuring enablement. You are measuring noise. So, what does a practical rhythm look like? Weekly, managers review two calls per rep and flag one coaching behavior. That is it. One flag, act on it. Monthly, you review program-level signals. Participation, playbook use, content utilization, and onboarding progress. This tells you whether the system is reaching the field. Quarterly, you look at pipeline impact, win-loss, and the correlation between training and performance. Watch for this. A weak week does not mean enablement is failing. It means you had a weak week. Run this cadence inside your existing revenue rhythm, not as a separate side meeting. Then end every review with the next measurement hypothesis. That keeps the loop honest and moving forward. From Insight to Action: Turning Metrics Into Interventions.
 revenuetools.iosendnow.liveman.digital+22 min
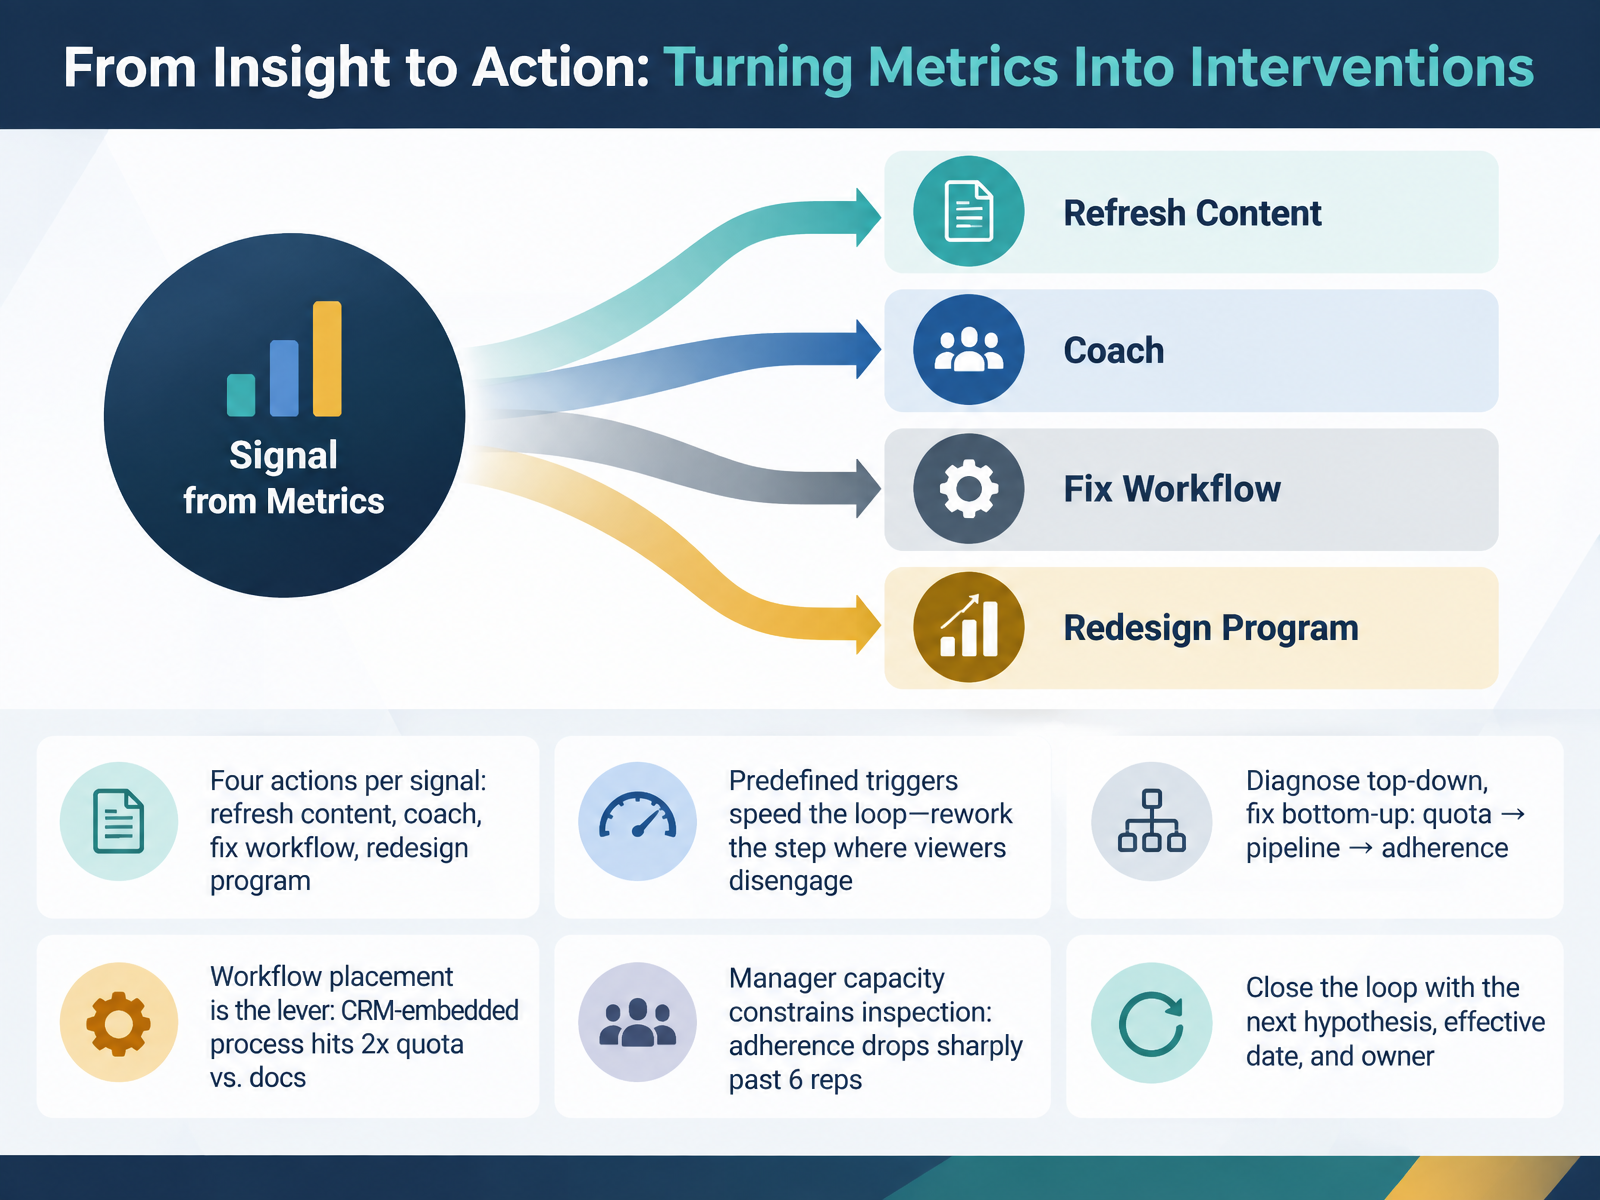
 - 10From Insight to Action: Turning Metrics Into InterventionsNow, turning insight into action. For every signal you see, there are four moves: refresh the content, coach the rep, fix the workflow, or redesign the program. Predefined triggers speed up that loop. Know ahead of time what metric value kicks off which action, so you are not debating it in the moment. Diagnose top-down, but fix bottom-up. Start with quota, walk back to pipeline, then to adherence. Here is the lever most teams miss. When your process lives inside the C R M, teams hit quota at roughly twice the rate of those relying on docs and wikis. Same process, different home. Watch your manager capacity too. Adherence drops sharply past six reps per manager, because inspection simply cannot scale. So always close the loop with three things: the next hypothesis, an effective date, and a named owner. That is what turns a metric into a real intervention. Next, we look at estimating return on investment defensibly.
 index.sbigrowth.comrevenuetools.iosendnow.live+22 min
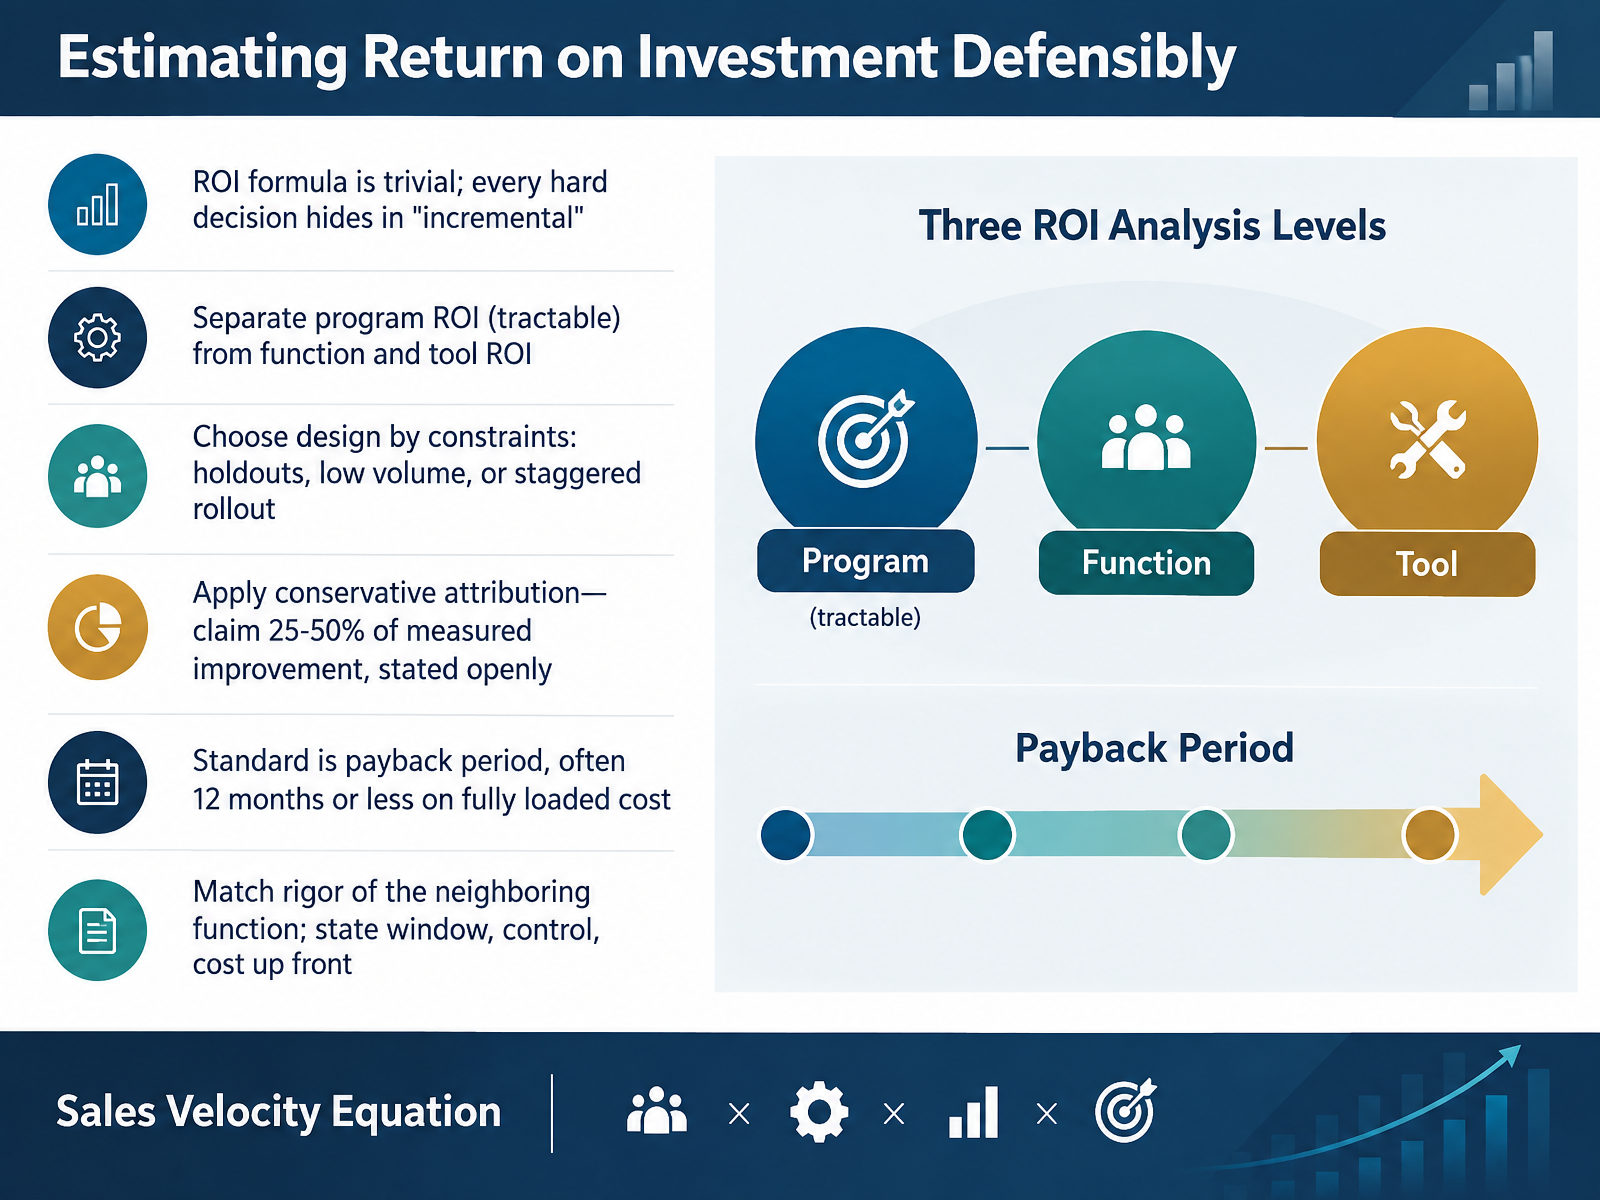
 - 11Estimating Return on Investment DefensiblyNow let's tackle the number every executive eventually asks for: return on investment. The formula itself is trivial. Incremental gain minus cost, divided by cost. Every hard decision hides inside the word incremental. So how do you estimate it defensibly? First, separate program ROI from function and tool ROI. Programs are tractable. The function as a whole is not. Next, choose your design based on constraints: a holdout cohort, low-volume measurement, or a staggered rollout. Then apply conservative attribution. Claim twenty-five to fifty percent of measured improvement, and state that openly. Watch for full-credit claims. They invite finance to discount everything you present. The standard executives trust is payback period, often twelve months or less on fully loaded cost. That cost includes rep selling time, which most teams forget. Finally, match the rigor of the neighboring function. State the window, the control, and the cost up front, before anyone sees the results. That is what makes the number survive scrutiny. Let's look next at communicating enablement impact to executives.
 accent-technologies.comsupered.iokaon.com+22 min
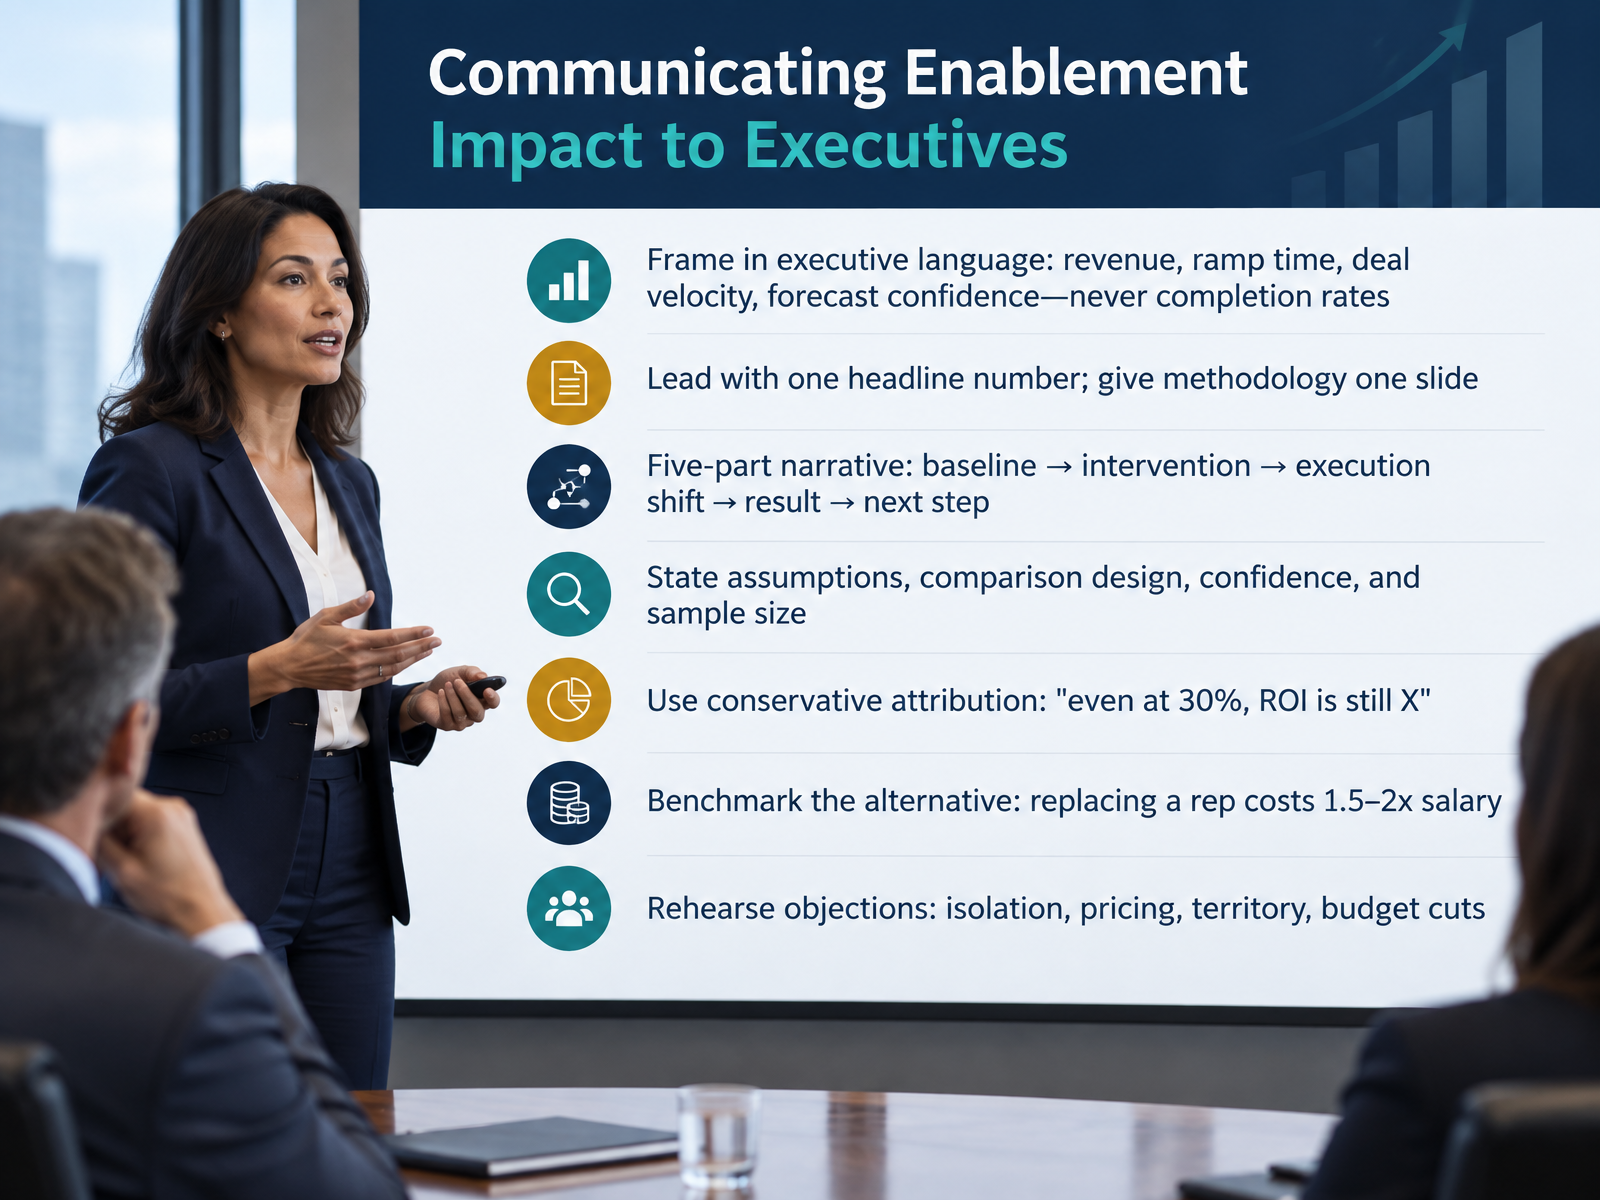
 - 12Communicating Enablement Impact to ExecutivesNow, let's talk about how you actually communicate enablement impact to executives. Start with one rule. Speak in their language. Revenue, ramp time, deal velocity, forecast confidence. Never lead with completion rates. Open with one headline number, and give methodology just one slide. This tells you the money moved. Build a five-part narrative. Baseline, intervention, execution shift, result, next step. State your assumptions, comparison design, confidence, and sample size. Then use conservative attribution. Say something like, even at thirty percent attribution, the return is still this figure. That preempts the correlation objection before it lands. Benchmark the alternative. Replacing a rep costs one and a half to two times salary, so cost avoidance alone often justifies the investment. Finally, rehearse the objections. Isolation, pricing, territory, budget cuts. Answer them before they are asked. Next, we look at Measurement Maturity: Assessing and Advancing Your Practice.
 accent-technologies.comsupered.iokaon.com+21 min
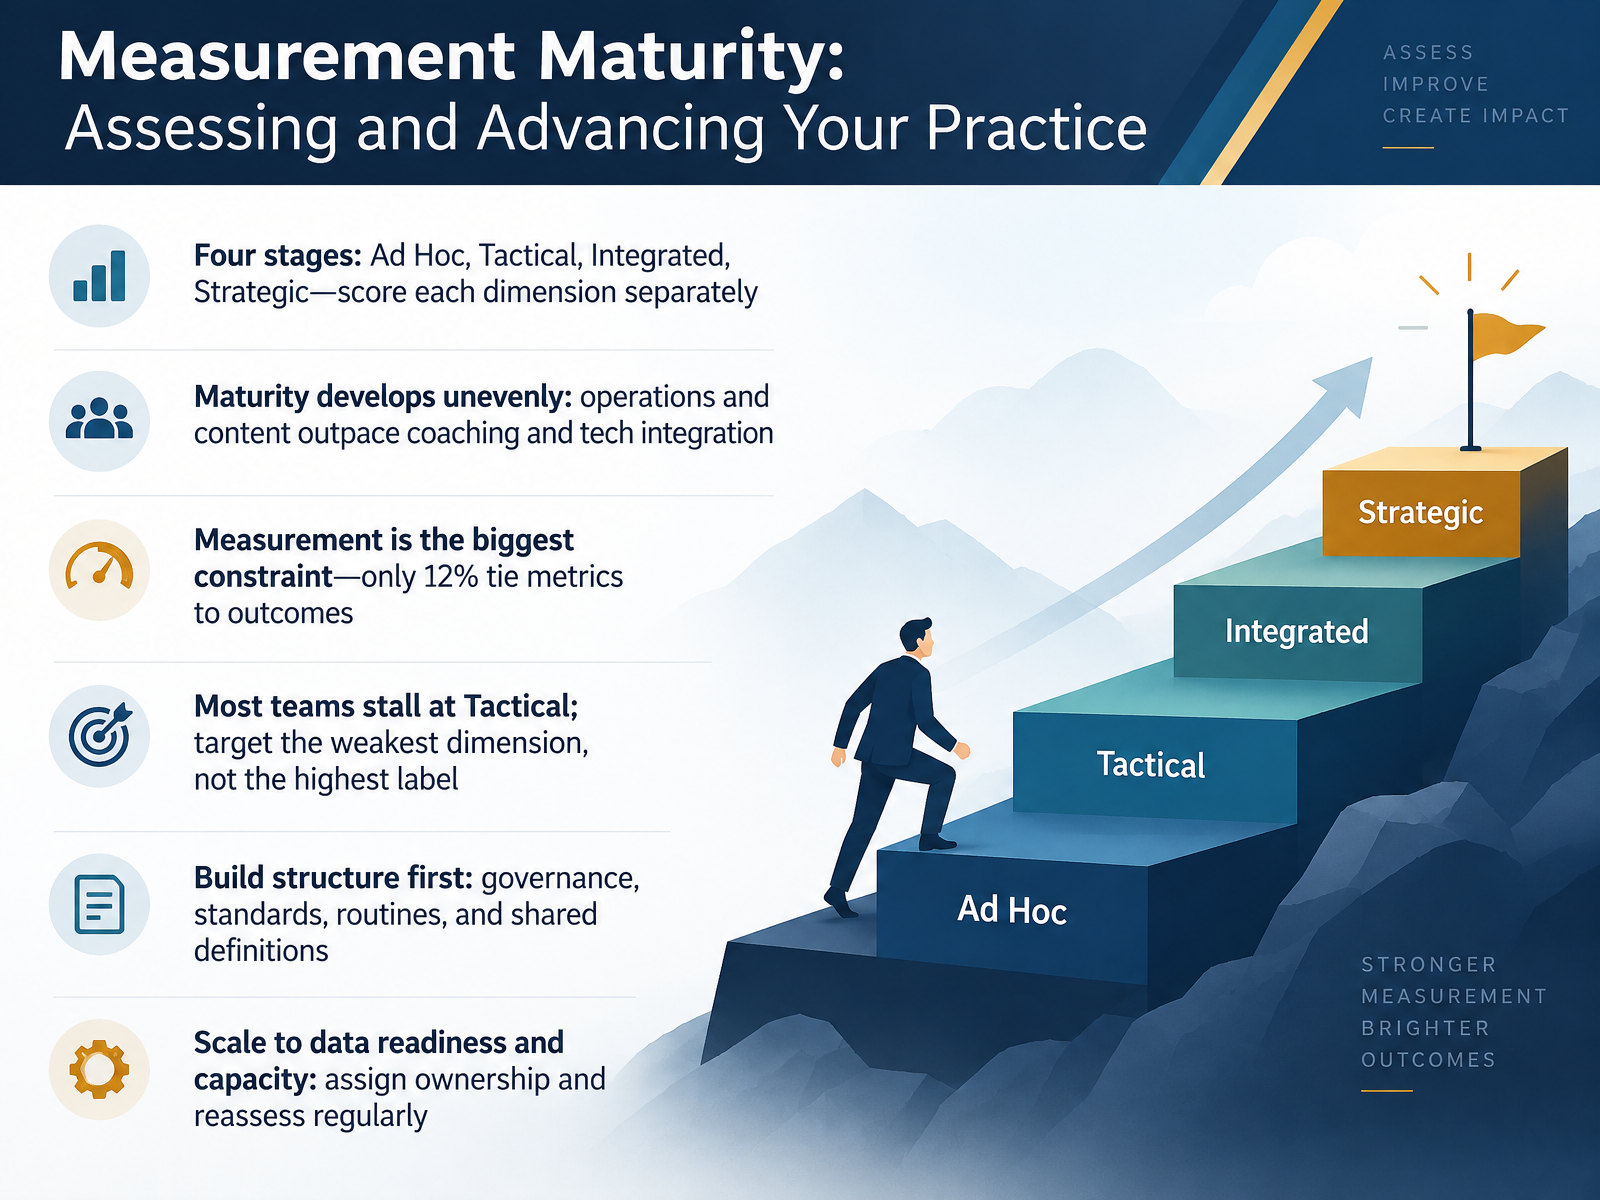
 - 13Measurement Maturity: Assessing and Advancing Your PracticeLet's talk about measurement maturity, and how to assess and advance your own practice. Think in four stages: Ad Hoc, Tactical, Integrated, and Strategic. Score each dimension separately, because they do not move together. Operations and content tend to outpace coaching and tech integration. This tells you maturity develops unevenly. Measurement is the biggest constraint, with only twelve percent of teams consistently tying metrics to outcomes. Most teams stall at Tactical. So watch for this: target your weakest dimension, not the highest label. Build structure first. Governance, standards, routines, shared definitions. Then scale to your data readiness and capacity. Assign ownership, and reassess regularly. Next, a ninety day plan to improve enablement measurement.
 index.sbigrowth.comrevenuetools.iosendnow.live+12 min
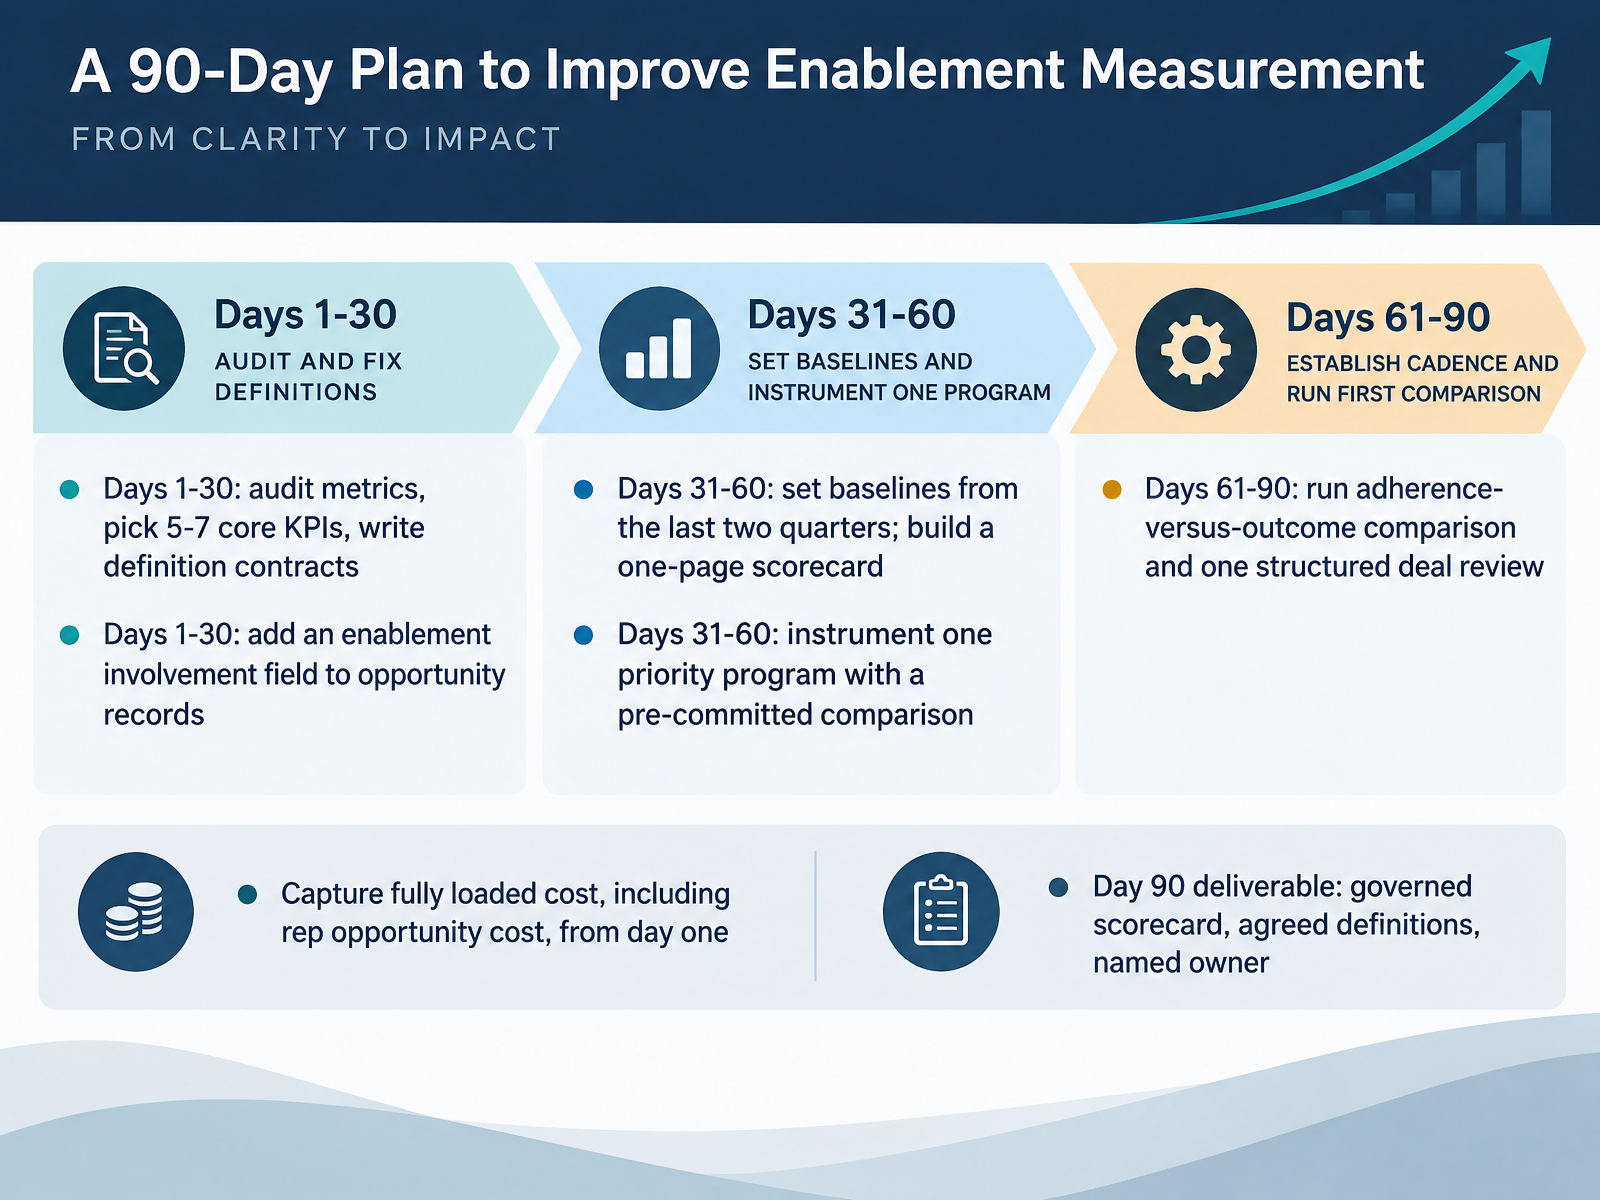
 - 14A 90-Day Plan to Improve Enablement MeasurementLet's make this actionable with a ninety day plan. Days one through thirty, audit your metrics and pick five to seven core K P Is. Write definition contracts, because a metric name is not a definition. Add an enablement involvement field to opportunity records now. This tells you which deals had enablement support, so you can eventually compare enabled and non-enabled outcomes. Days thirty one through sixty, set baselines from the last two quarters, then build a one-page scorecard. Watch for scope creep here. Instrument just one priority program with a pre-committed comparison group. Days sixty one through ninety, run your adherence versus outcome comparison, and hold one structured deal review using a template. Capture fully loaded cost from day one, including rep opportunity cost. Your day ninety deliverable is a governed scorecard, agreed definitions, and a named owner. Now let's test your application with a knowledge check and real scenarios.
 index.sbigrowth.comrevenuetools.iosendnow.live+22 min
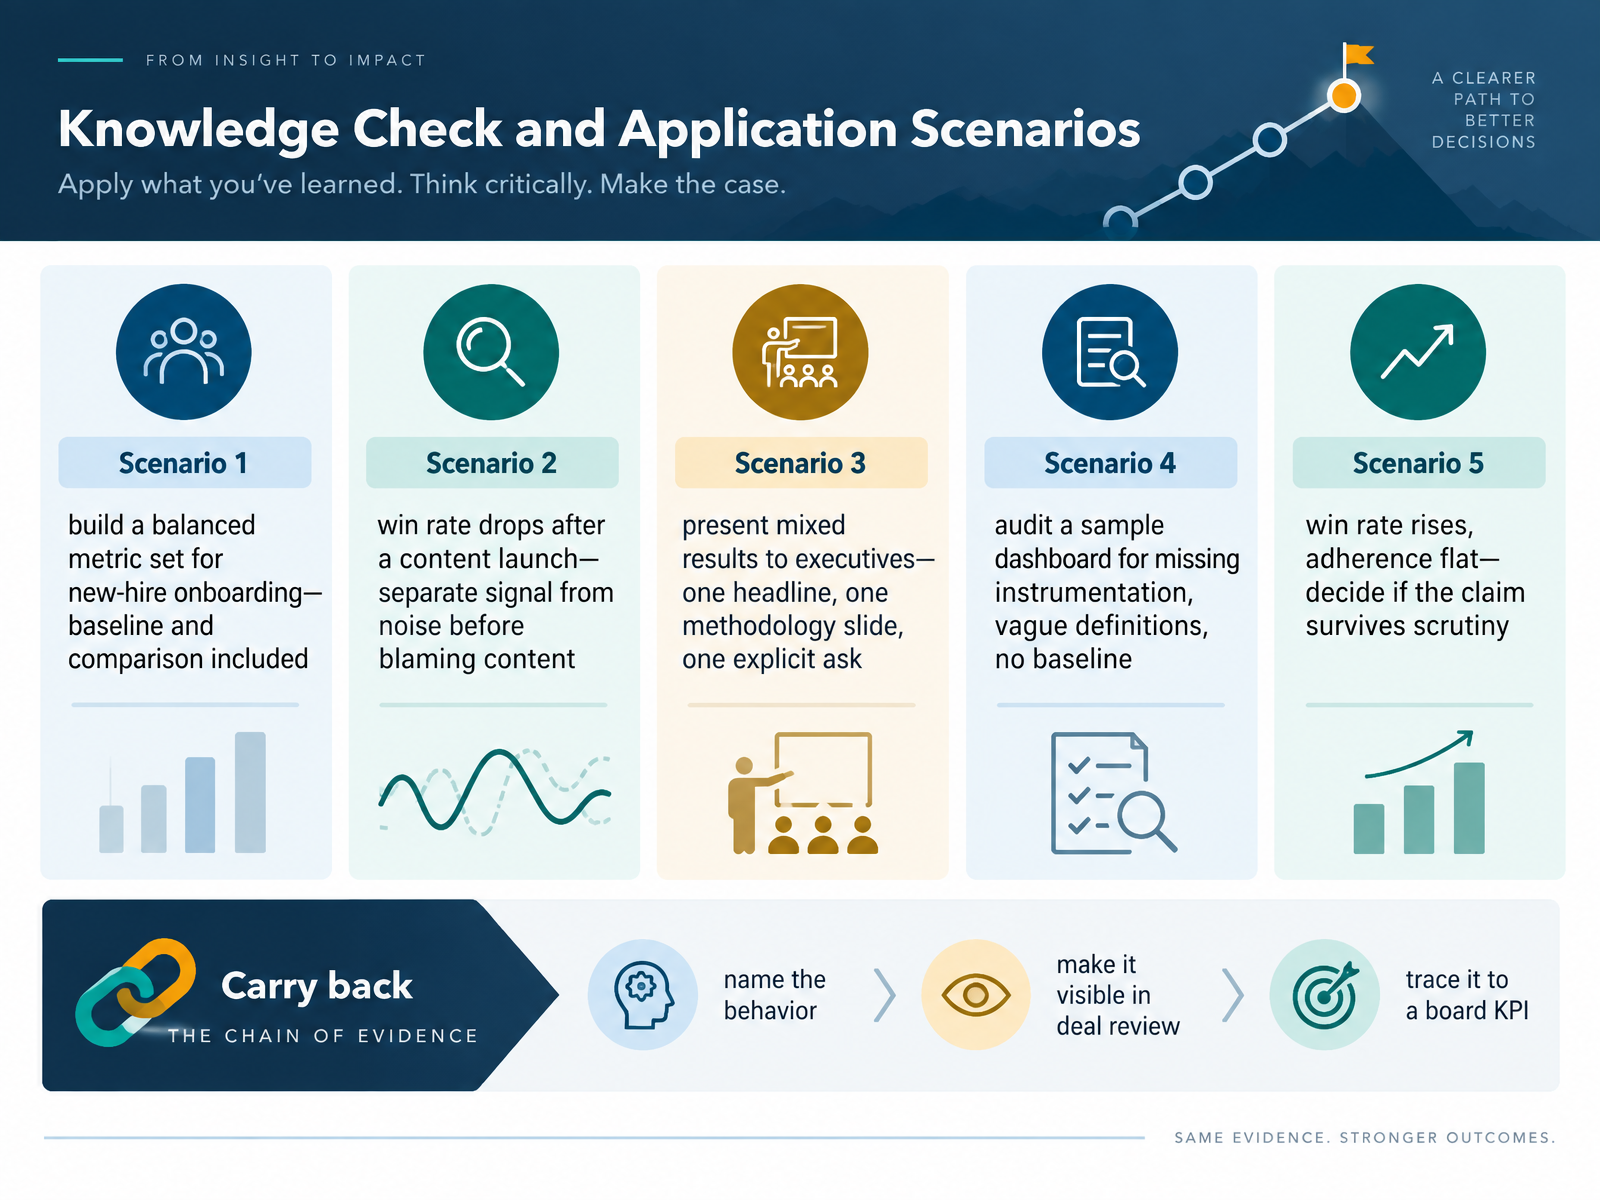
 - 15Knowledge Check and Application ScenariosLet's put it all to work. Run through these five scenarios as a self-check. One: build a balanced metric set for new-hire onboarding, and include both a baseline and a comparison cohort. Two: win rate drops after a content launch. Before you blame the content, separate signal from noise. Three: you are presenting mixed results to executives. Bring one headline, one methodology slide, and one explicit ask. Four: audit a sample dashboard. Look for missing instrumentation, vague definitions, and no baseline. Five: win rate rises but adherence stays flat. Ask yourself whether that claim survives scrutiny. Here is your carry-back. Name the behavior. Make it visible in deal review. Trace it to a board KPI. That chain is what makes enablement credible. Thank you for working through this course with me. You now have the framework. Go build the chain, and defend it with confidence.
 accent-technologies.comindex.sbigrowth.comcommunity.highspot.com+22 min
Take the deck with you
Download this course as a file — free, no sign-up needed.
- PDF handoutEvery slide page, ready to print or share.16 pages · 3.6 MBDownload
- Narrated PowerPointThe deck that presents itself — every slide carries the digital human's narration video.16 pages · 14.4 MBDownload
- PowerPoint slidesThe full deck as a .pptx — open it in PowerPoint, Keynote, or Google Slides.16 pages · 3.5 MBDownload
Free to use in your own training — please keep the PersonWise credit page at the end.
Have your own deck? Turn it into a course
Sources consulted
Web sources consulted while building this course.
- Ultimate Guide to Sales Enablement Success in 2026 | Seismic — seismic.com
- What Is Sales Enablement? A 2026 Definition & Guide — salesassembly.com
- What Is Sales Enablement? Definition, Tools, ROI (2026) | Apollo — apollo.io
- What is Sales Enablement? (A Comprehensive Guide) — salesenablementcollective.com
- Decoding "What is Sales Enablement?" (2026 Handbook) — federicopresicci.com
- ANALYTICS REPORT — community.highspot.com
- How to Measure Sales Enablement ROI: A 2026 Framework for Revenue Leaders — accent-technologies.com
- Measuring Sales Enablement ROI: Why Attribution Design Is the Key to Justifying Investment in 2026 — kaon.com
- How to Measure the ROI of Revenue Enablement - AccountAim — accountaim.com
- Sales Enablement ROI: Inspect Adherence First — supered.io
- Sales Enablement Strategy Map | KPI Depot — kpidepot.com
- Definitive Guide to Sales Enablement KPIs | Free Download | KPI Depot | KPI Depot — kpidepot.com
- 25 sales enablement metrics: how to measure SE success - Guideflow Blog — guideflow.com
- Revenue [Checklist] — readinessresources.mindtickle.com
- Sales enablement data: metrics, failure modes, and what to trust | Datalane Blog — datalane.com
- Salesloft Metrics Glossary — help.salesloft.com
- Modern Enablement Benchmarks Report — index.sbigrowth.com
- Sales Enablement for RevOps: Aligning Content, Training, and Tools to the Buyer Journey - RevenueTools Blog | RevenueTools — revenuetools.io
- Sales Enablement KPIs Every Revenue Team Should Track — SendNow Blog — sendnow.live
- Sales Enablement in 2026: The Playbook | MAN Digital — man.digital