SEO Metrics Measurement and Interpretation
Begin
14 pages · ~28 min
SEO Metrics Measurement and Interpretation
Learn to track, analyze, and interpret key SEO metrics to measure performance, identify optimization opportunities, and drive data-informed decisions.
What you’ll learn
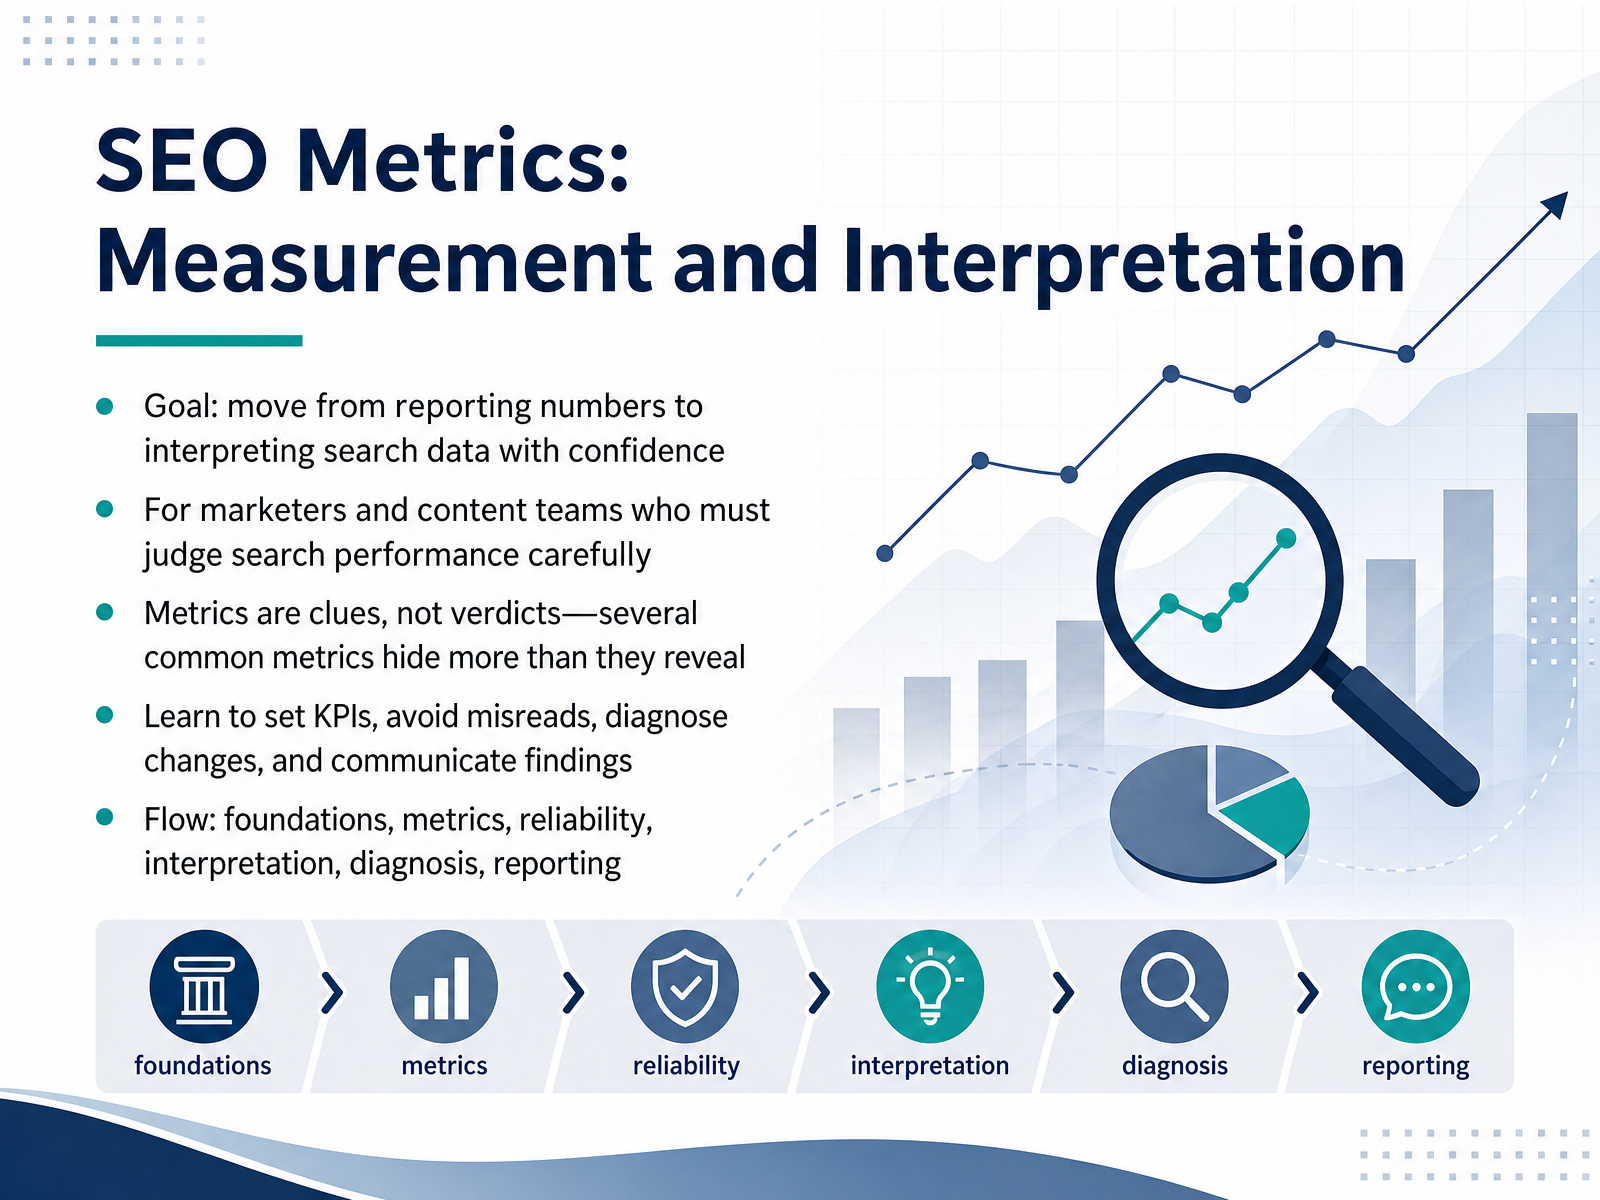
- 01SEO Metrics: Measurement and InterpretationWelcome. If you are responsible for interpreting search performance data, you already know that a dashboard full of numbers can be more confusing than helpful. This course is about moving from reporting those numbers to actually interpreting them with confidence. We will treat metrics as clues for diagnosis, not trophies to display. Many common metrics hide more than they reveal, so we will focus on the discipline of setting the right KPIs, avoiding the classic misreads, and diagnosing what a change in the data might actually mean. Over the next several lessons, we will cover the foundations, the reliability of your data sources, and how to communicate your findings so they lead to sound decisions. Let us begin by looking at why the data you rely on can sometimes lead you astray.searchengineland.comclickrank.aiseo-catalog.com+21 min
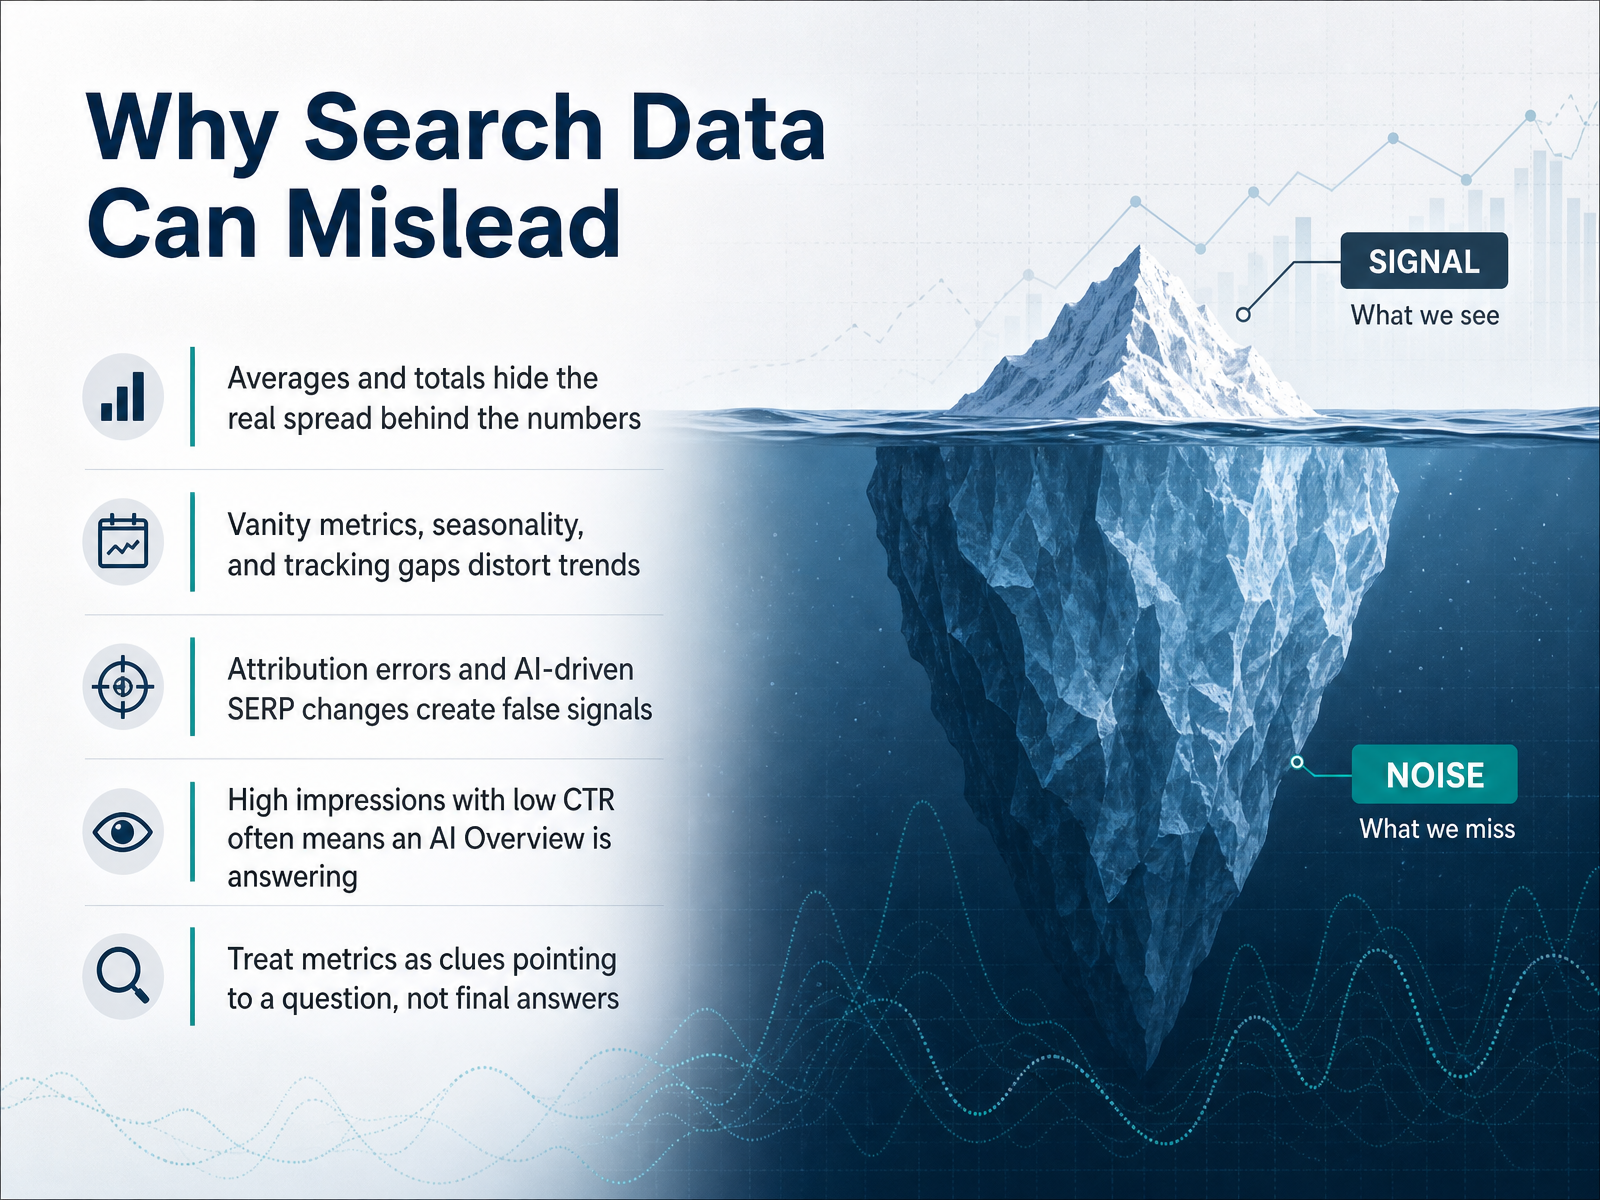
- 02Why Search Data Can MisleadLet’s start with a caution. Search data is easy to collect and hard to read honestly. Averages and totals hide the real spread behind the numbers. A page ranking second for one query and forty-fifth for another does not average to twenty-three in any way that helps you. Also, watch out for vanity metrics, seasonality, and tracking gaps that distort trends. Attribution errors and AI-driven search results changes create false signals. A classic one: high impressions with low CTR often means an AI Overview is answering the question before users ever reach your result. So, treat every metric as a clue pointing to a question, not as a final answer. A position is a trend indicator, not an absolute truth. Always ask what the number is actually measuring before you decide what it means. Next, we’ll look at the core metrics and their honest limits.
 quickseo.aiqueryscope.devyositeup.com+22 min
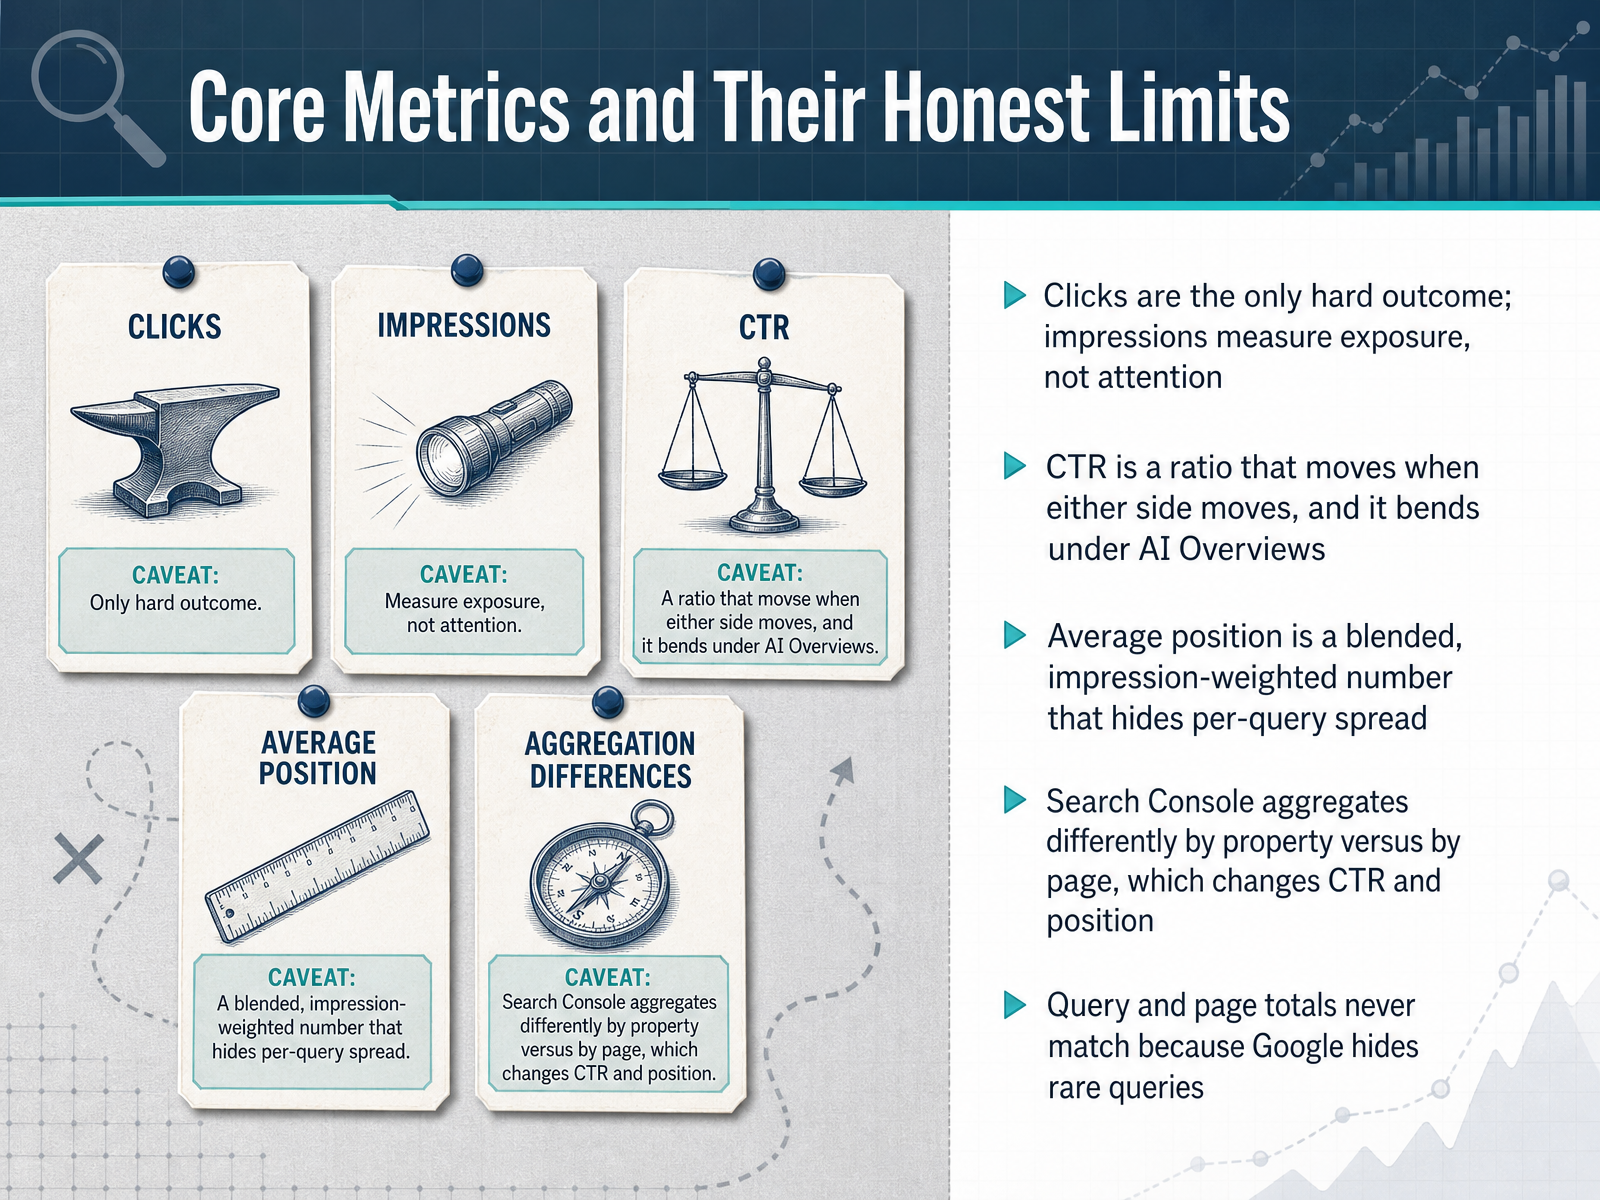
 - 03Core Metrics and Their Honest LimitsLet's look at the four core metrics and what they honestly can and cannot tell you. Clicks are the only hard outcome here. An impression just means your link appeared, even if no one scrolled down far enough to see it, so treat impressions as exposure, not attention. CTR is a ratio, and remember it moves when either side moves. So a drop in CTR could mean fewer clicks, or it could mean more impressions from queries where you rank lower. It also bends under AI Overviews, which can absorb clicks even when you hold position one. Average position is a blended, impression-weighted number. It only records the topmost result, and it averages across every query, so it hides the per-query spread that actually matters. There is a big difference between ranking second for one query and forty-fifth for another, and the average buries that. You also need to know that Search Console aggregates by property differently than by page, which changes both CTR and position. Grouping by property only counts the topmost URL. And finally, query and page totals never match, because Google hides rare queries to protect privacy. So do not sum the query table, read totals from the page view. Now, this brings us directly to why rankings alone are a weak signal in this landscape.
 support.google.comsupport.google.comsupport.google.com+21 min
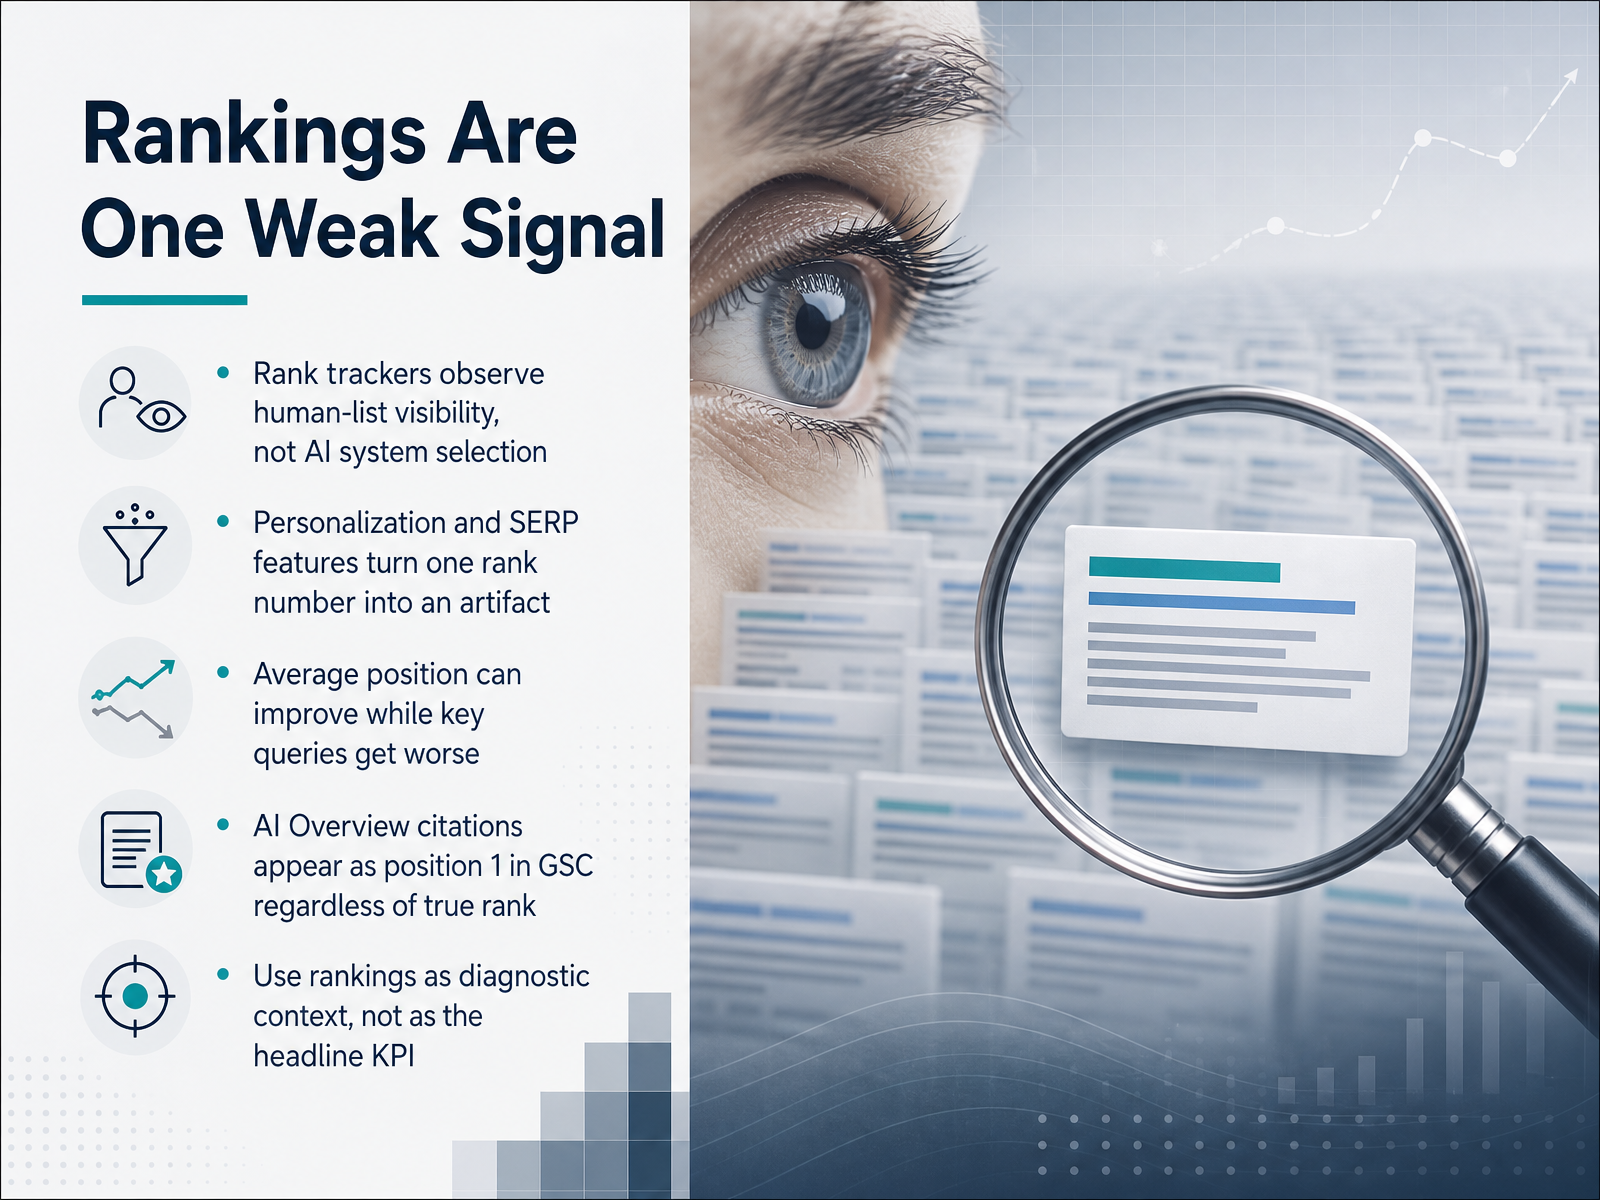
 - 04Rankings Are One Weak SignalNow let’s talk about why rankings are only one weak signal. Rank trackers essentially observe the list as a human might see it, not what an AI system actually selects. And because of personalization, location, and device, that single rank number is really an artifact. It’s an average of many different realities — which means it can lie. For instance, your average position can improve while your most important queries quietly get worse. That happens when you pick up easy long-tail terms, while your money pages slip in the background. Even worse, in Google Search Console, an AI Overview citation is recorded as position one, regardless of your true organic rank. So your dashboard may look healthy while clicks are actually flat. The discipline here is simple: use rankings as diagnostic context, not as the headline KPI. Treat them as a starting point for investigation, not as proof of success. And next, we’ll look at how to choose KPIs that actually map to your business goals.
 similarweb.comvantacron.compolymathdesk.com+22 min
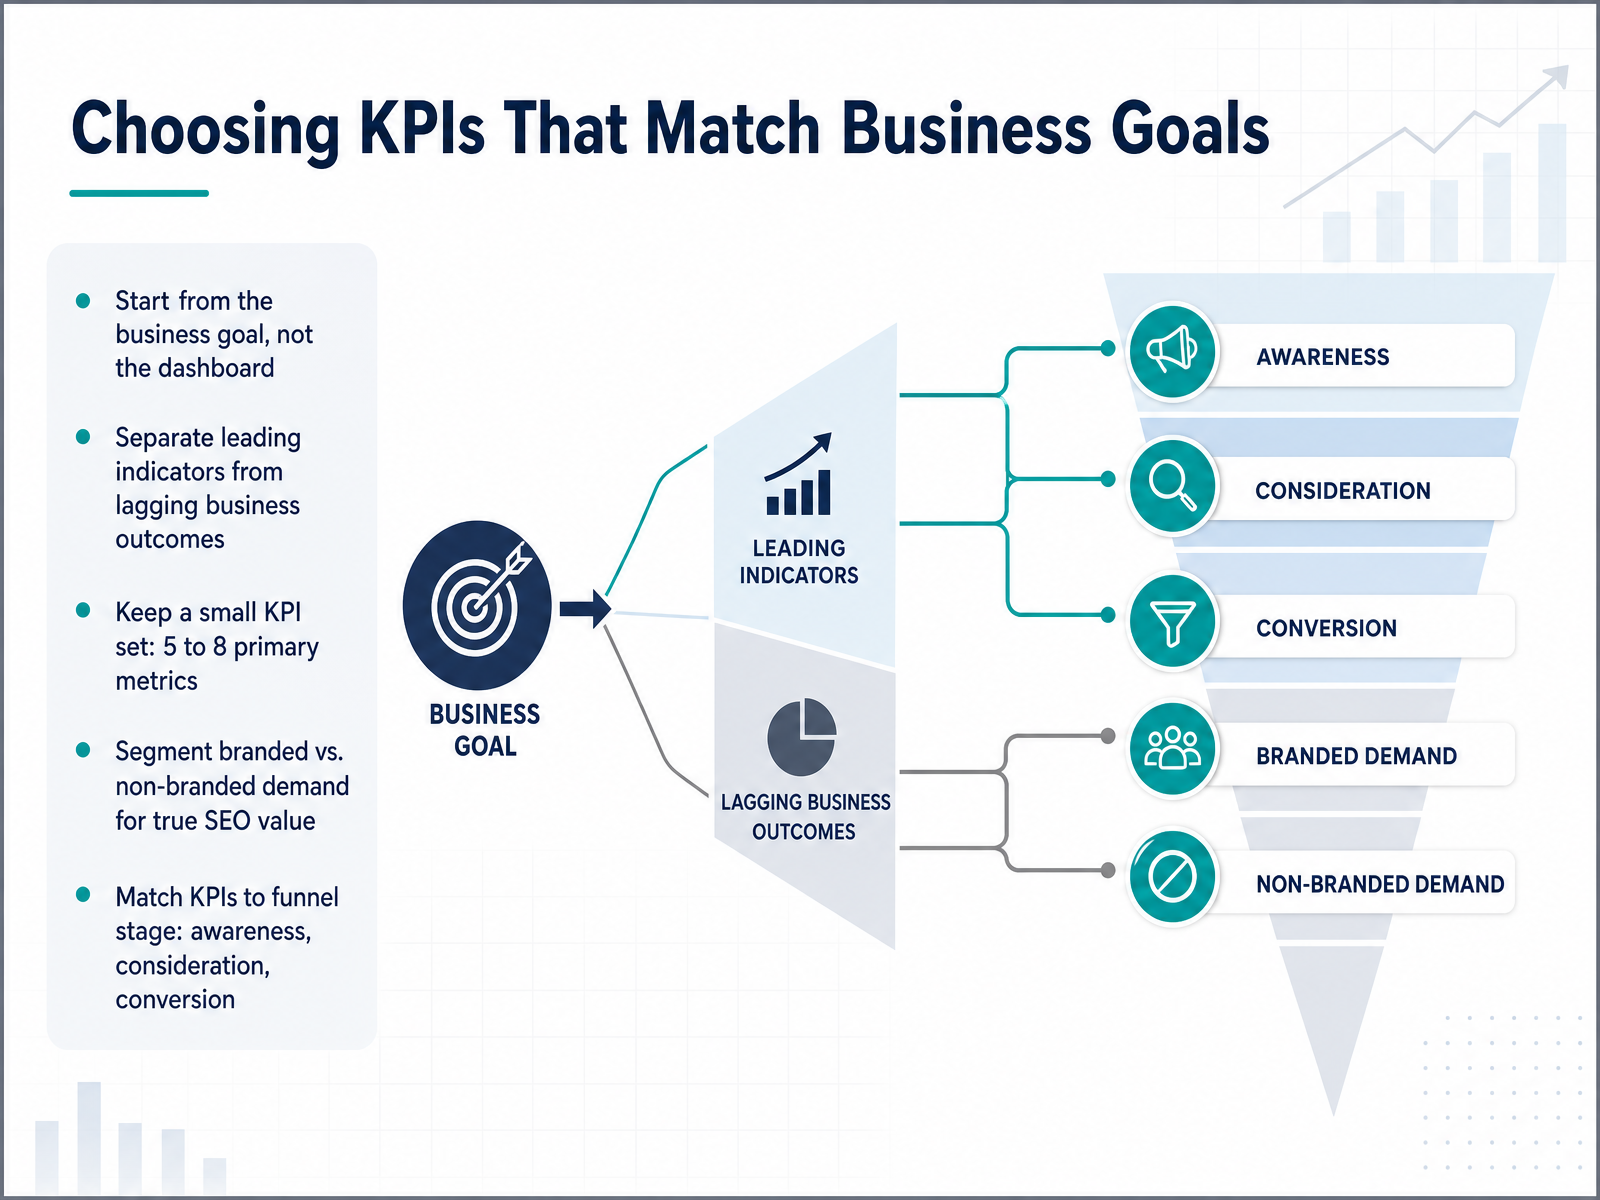
 - 05Choosing KPIs That Match Business GoalsNow, let’s talk about choosing the k-p-is that actually match business goals. The most common failure here is starting from the dashboard, because it shows what’s easy to track. Instead, start from the business goal itself. If your company needs revenue, pick metrics that lead to revenue. If it needs leads, focus on lead generation. Then, separate leading indicators like rankings and impressions, which signal future performance, from lagging outcomes like conversions and revenue, which confirm results. Keep the K-P-I set small, around five to eight primary metrics, to avoid scattered focus. Critically, segment branded from non-branded demand. Branded growth can come from other channels and will flatter your numbers, hiding true S-E-O value. Finally, match metrics to funnel stage. Awareness metrics, impressions and visibility; consideration, engagement and click-through; conversion, leads and revenue. Assigning the right metric to each stage prevents misreading the data. Next, we’ll look at data quality before interpretation.
 blog.hubspot.comsearchengineland.comclickrank.ai+22 min
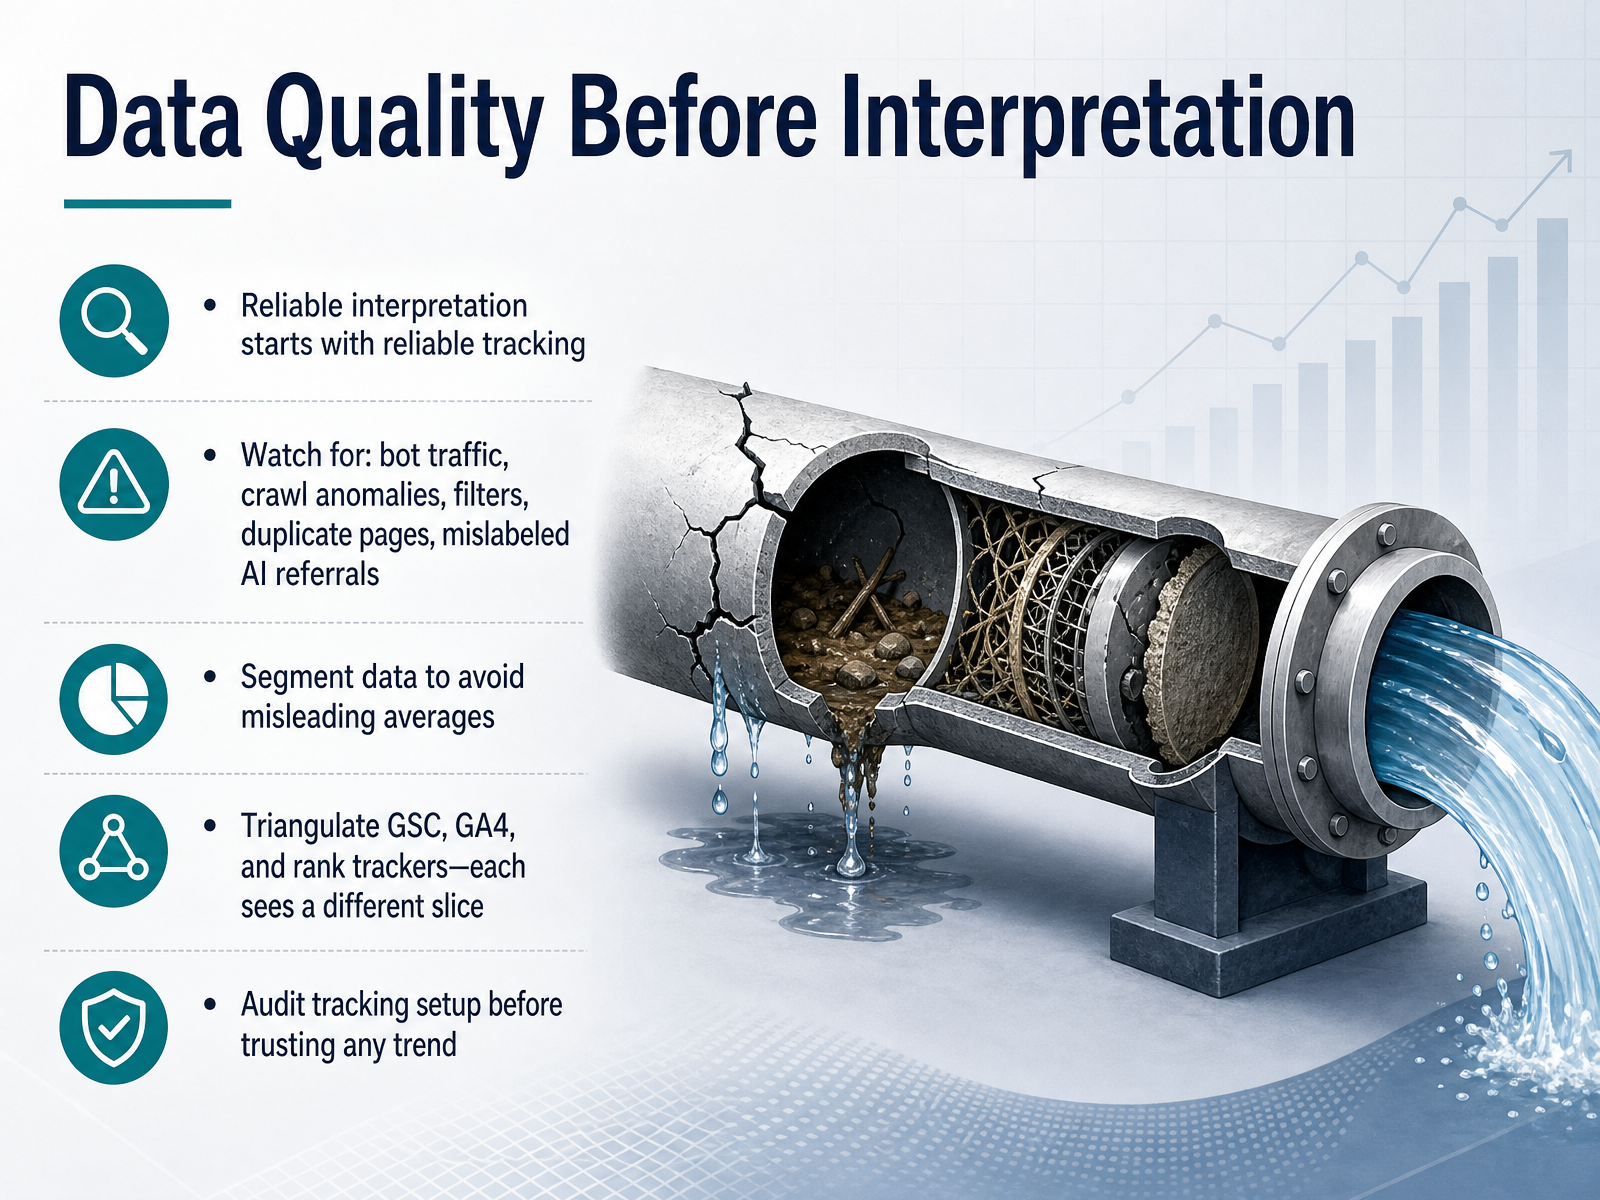
 - 06Data Quality Before InterpretationBefore we interpret any trend, we need to confirm the data is trustworthy. Reliable interpretation starts with reliable tracking. Watch for the usual suspects: bot traffic, crawl anomalies, misapplied filters, duplicate pages, and AI referrals that might be mislabeled in your reports. Segment your data, because a site-wide average can hide what is happening on your money pages. And remember to triangulate. Search Console, Google Analytics, and your rank tracker each see a different slice of reality. So audit your tracking setup before you trust any trend. Once the data is clean, we can look at interpreting trends without overreacting.
 support.google.comsupport.google.comsupport.google.com+21 min
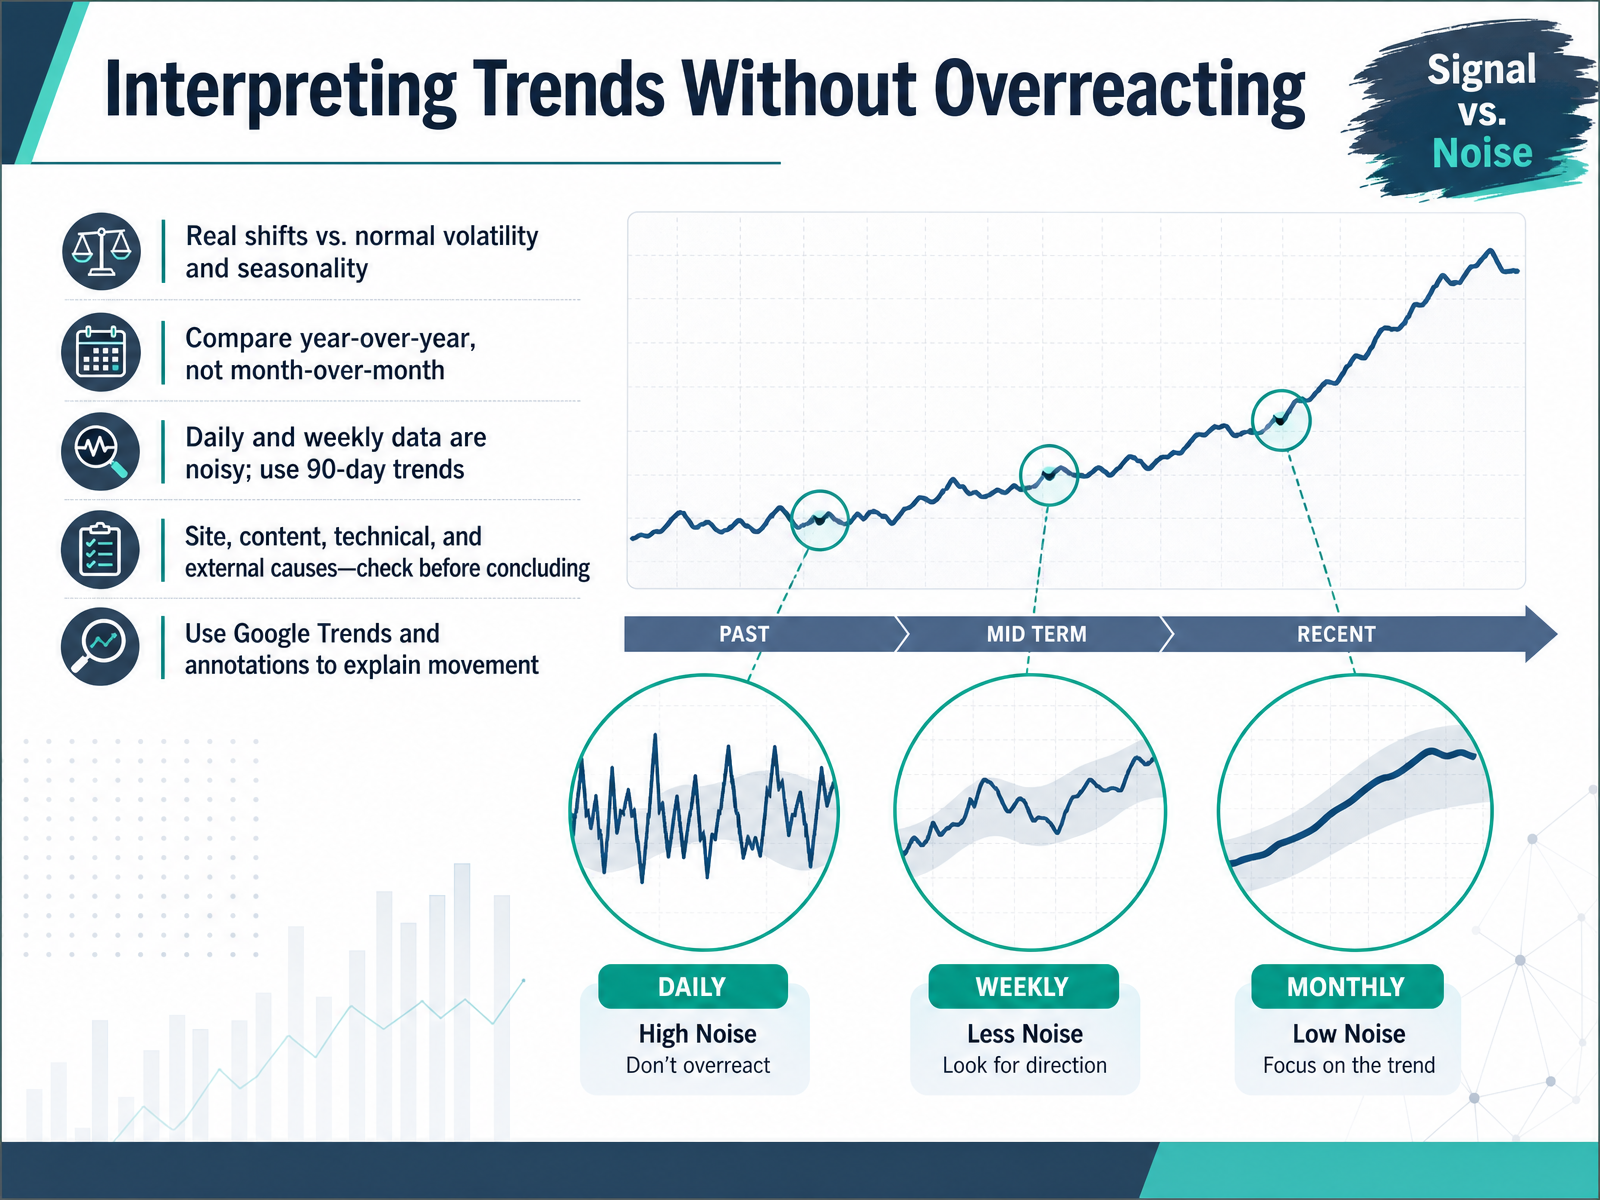
 - 07Interpreting Trends Without OverreactingNow let's talk about interpreting trends without overreacting. The most common mistake is treating every dip as a crisis. Real shifts are rare; most movements are just normal volatility or seasonality. So before you panic, compare year over year, not month over month. That single change dissolves most false alarms. Daily and weekly data are noisy, so use a 90-day trend to see the actual pattern. When you do see a sustained change, work through the causes in order. Site-level issues like a template change, content-level shifts like a lost featured snippet, technical problems like an accidental noindex, and external factors like a competitor gaining ground or an algorithm update. Check each before concluding anything. And use Google Trends to see if the drop is industry-wide, and annotate your charts with launches, updates, and holidays so future you knows what happened. The takeaway: don't react to noise, respond to signals. Now let's move to a diagnostic framework for traffic changes.
 quickseo.aiqueryscope.devyositeup.com+21 min
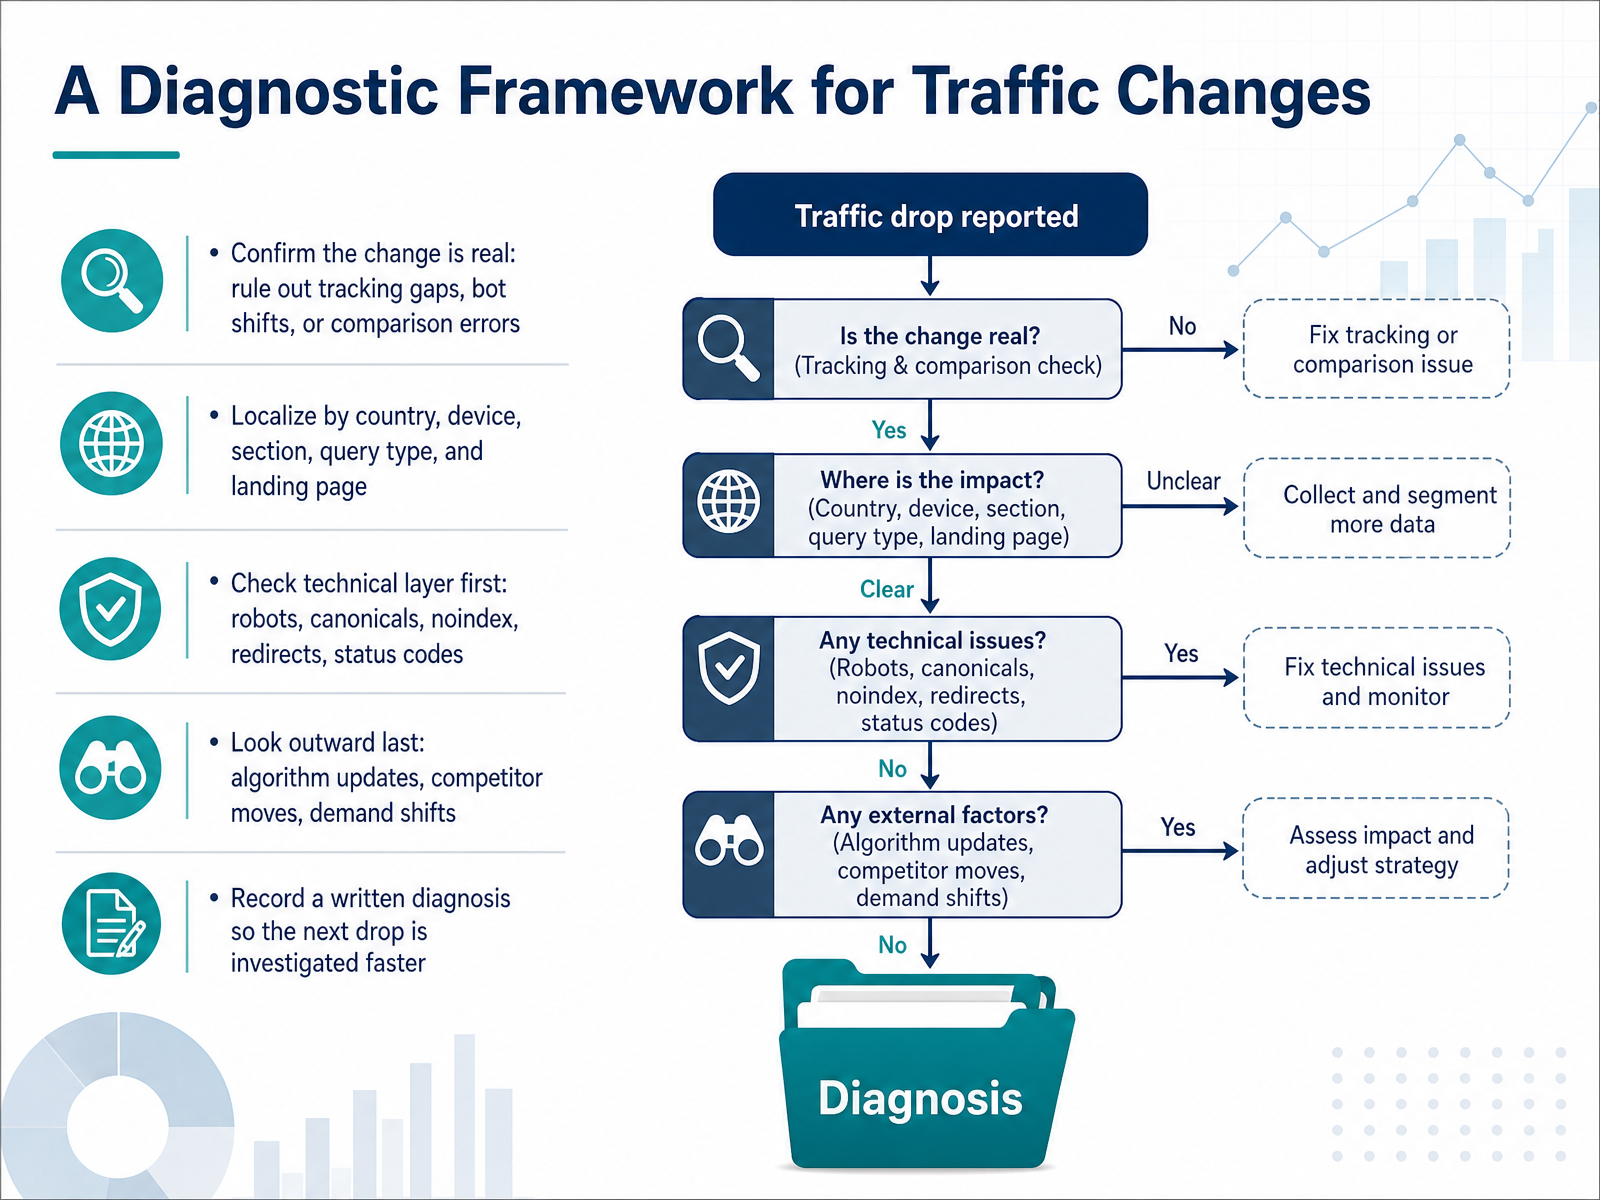
 - 08A Diagnostic Framework for Traffic ChangesNow let's put this into a workable framework. When traffic changes, work through five layers in order, and stop once the evidence is clear. First, confirm the change is real. Rule out tracking gaps, bot shifts, or comparison errors. Cross-check Search Console clicks against analytics sessions. A year-over-year comparison often dissolves a panic that month-over-month created. Second, localize the change. Segment by country, device, section, query type, and landing page. A drop in one segment needs a different diagnosis than a drop everywhere. Third, check the technical layer before anything else. Look at robots, canonicals, accidental noindex, redirects, and status codes. Recent deploys are the prime suspect, so line their dates up against the change date. Fourth, look outward only if the first three don't explain it. Check the algorithm update calendar, competitor moves, and demand shifts. And fifth, record a written diagnosis. A one-page incident document prevents your team from drifting back to the wrong cause mid-sprint, and it makes the next drop faster to investigate. Remember, correlation is not the mechanism. A deploy and a drop on the same day is a clue, not proof. Now, once you've localized the change, the next step is to identify which of four traffic patterns you're actually seeing, because each one needs a different fix.
 2 min
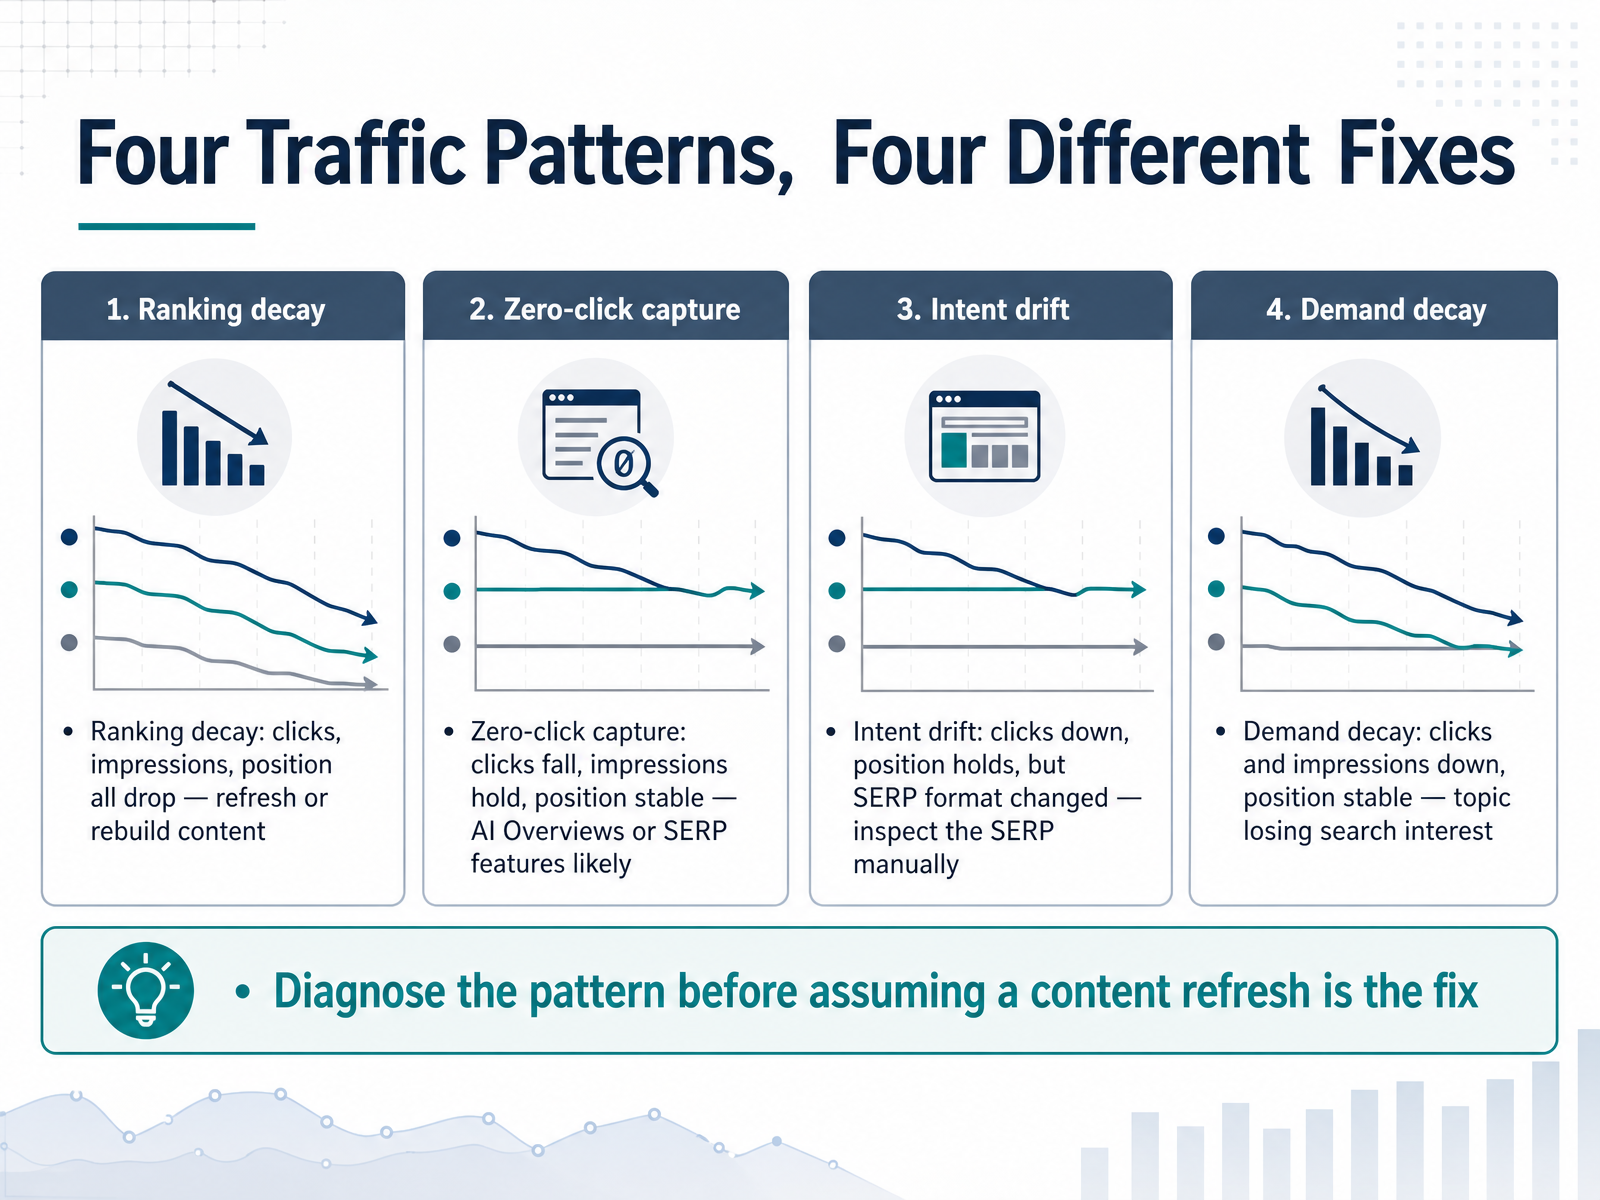
2 min - 09Four Traffic Patterns, Four Different FixesNow, the most important part: reading the pattern before you touch a single page. When traffic drops, the fix depends entirely on which of four patterns you're seeing. First: ranking decay. Clicks drop, impressions drop, and average position worsens. That's the classic hit — your page lost ground. This is the only pattern where refreshing content reliably helps. Second: zero-click capture. Clicks fall, but impressions hold steady and position stays stable. You're still ranking, often higher than before, but losing clicks anyway. That's AI Overviews or SERP features absorbing the click. Content updates won't recover this. Third: intent drift. Clicks go down, position holds, but the SERP format changed. Google re-interpreted the query and now surfaces videos or comparison tables. Metrics alone miss this — inspect the SERP manually. Fourth: demand decay. Clicks and impressions both drop, while position holds or improves. The topic itself is losing search interest. This one fools teams into refreshing a page that was never coming back. So diagnose the pattern first. The correct answer can be a rewrite, a structural change, or doing nothing at all. That distinction is exactly what turns raw metrics into actionable decisions.
 quickseo.aiqueryscope.devyositeup.com+21 min
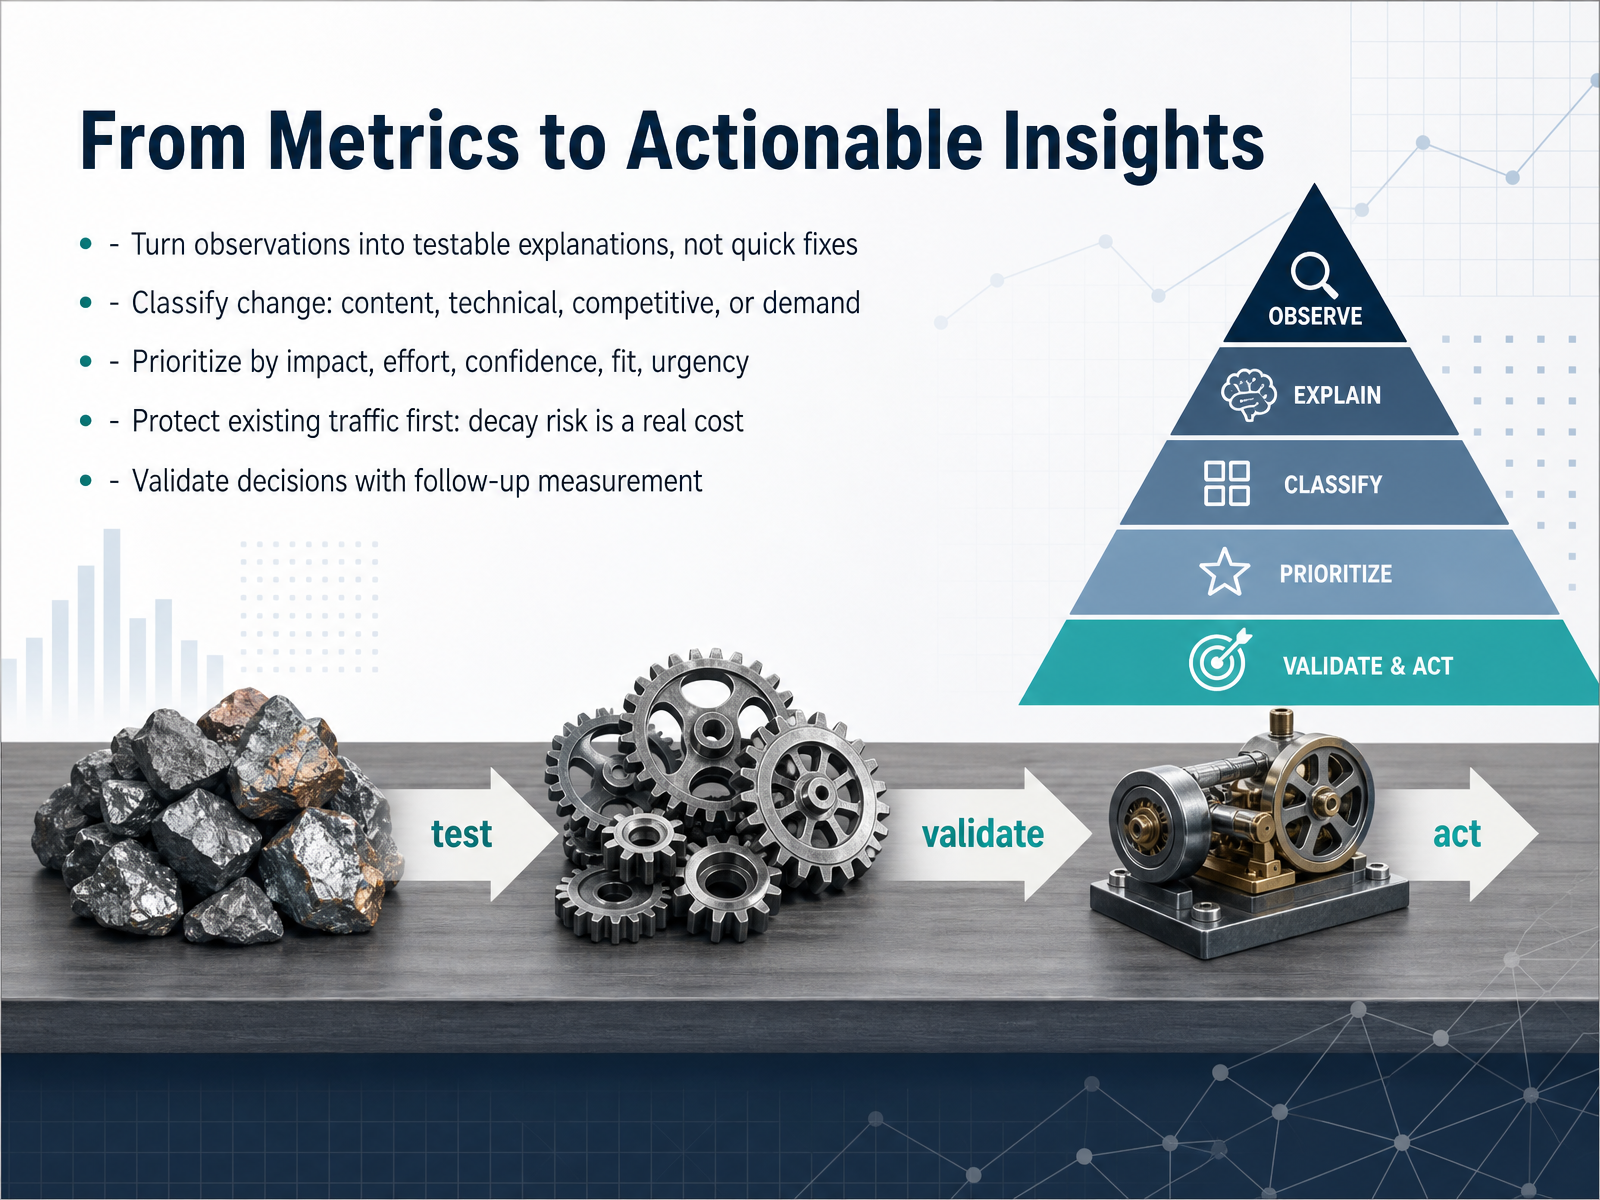
 - 10From Metrics to Actionable InsightsSo we've looked at the pattern recognition and the traffic diagnosis framework. Now it's time to move from observations to the roadmap. This is the point where we turn data into decisions, not just more theory. First, resist the urge for quick fixes. Instead of asking what tactic to deploy, ask what hypothesis explains what you see. Next, classify the change itself. Is it content-driven, a technical regression, a competitive shift, or a change in user demand? Each has a distinct remedy. Then, prioritize. Score each initiative by impact, effort, confidence, business fit, and urgency. A task with high impact but low confidence is a test, not a commitment. Also, remember to protect existing traffic first. A decaying page is a real cost, often more urgent than a new opportunity. Finally, validate your decision with follow-up measurement. Treat every action as an experiment. This discipline keeps your roadmap honest and your priorities clear. Now let's talk about reading reports with an AI-Search lens.
 blog.hubspot.com2 min
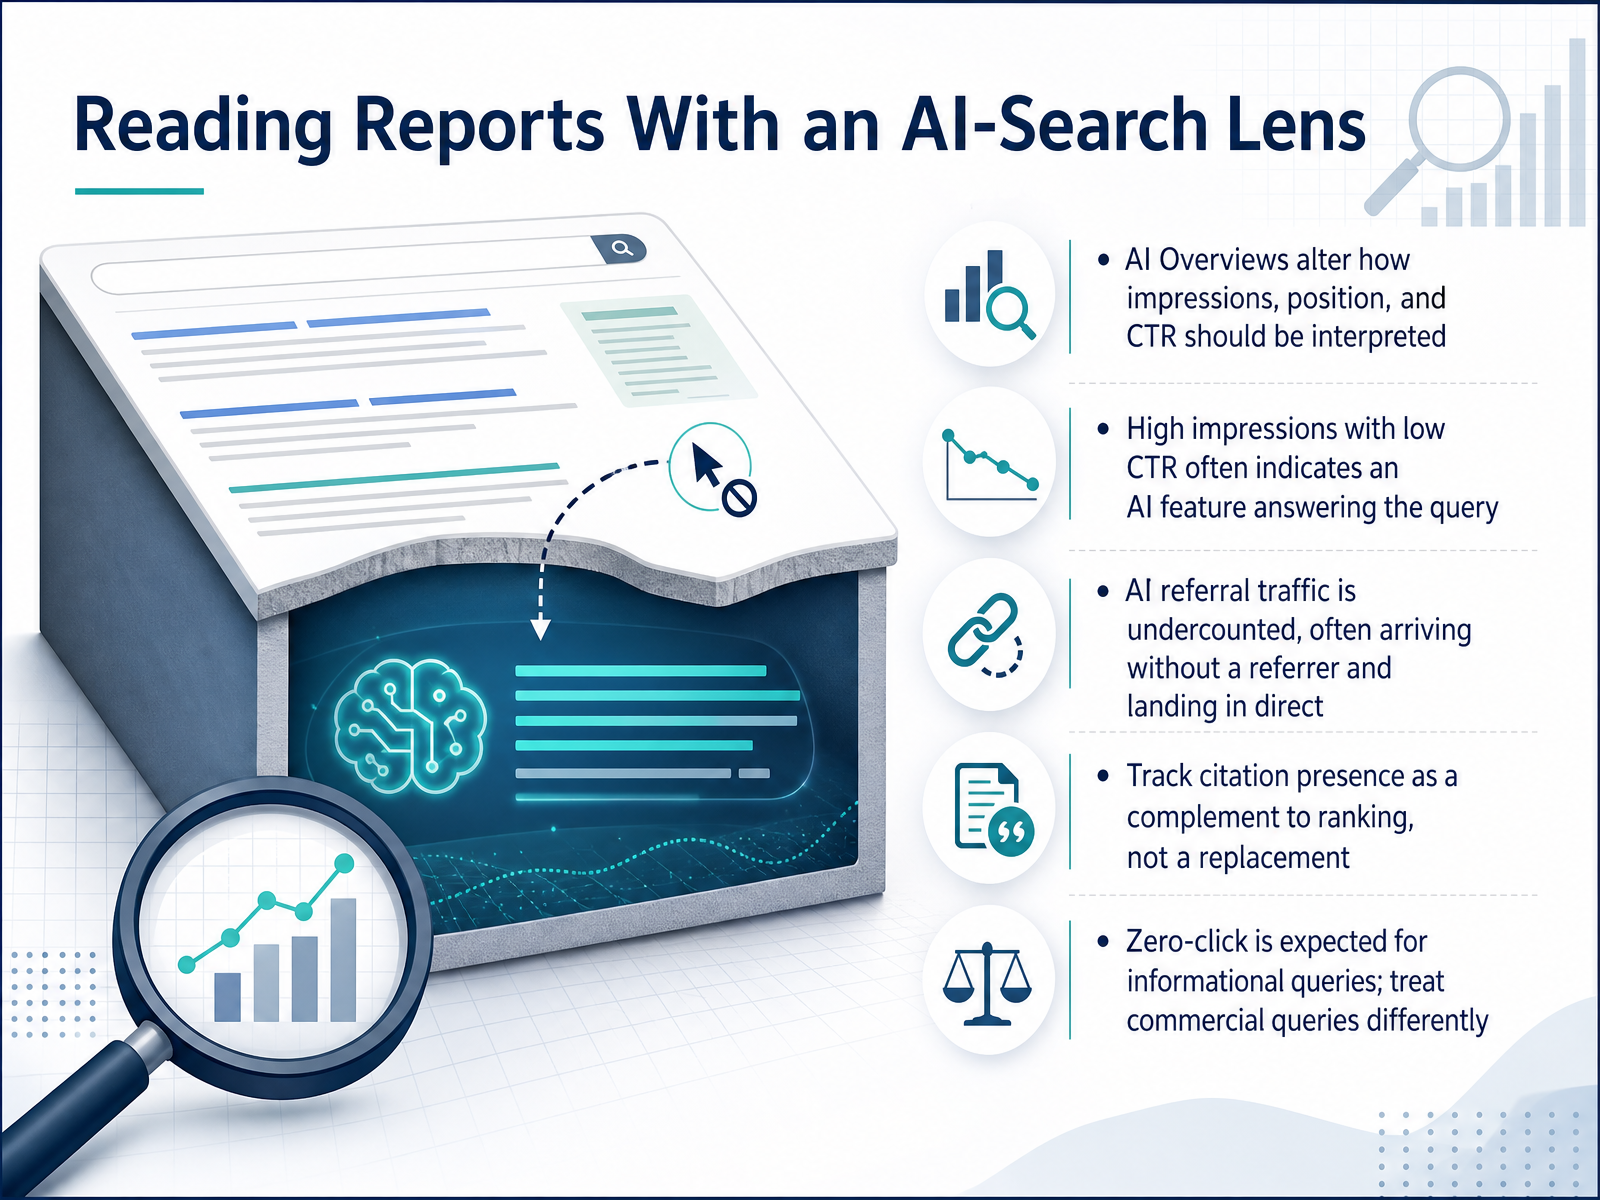
 - 11Reading Reports With an AI-Search LensLet's apply the AI-Search lens to the reports we already have. First, reconsider impressions, position, and click-through rate. When a query triggers an AI Overview, your site can receive an impression and a position one citation even if your organic ranking is much lower. That's why high impressions with a very low click-through rate often means the AI feature is already answering the question. Users are satisfied without clicking. Second, remember that AI referral traffic is undercounted. Much of it arrives without a referrer and lands in the direct bucket, so a spike in direct traffic that outpaces your branded search is a strong clue that AI is sending you visitors you can't see. Because of this, treat citation presence in AI answers as a complement to ranking, not a replacement. It's a separate layer of visibility. Finally, apply zero-click expectations by intent. Zero-click is normal for informational queries where the AI resolves the need. But for commercial queries, a zero-click result is a problem worth investigating. Which brings us to how we communicate this nuance to stakeholders.
 quickseo.aiqueryscope.devyositeup.com+22 min
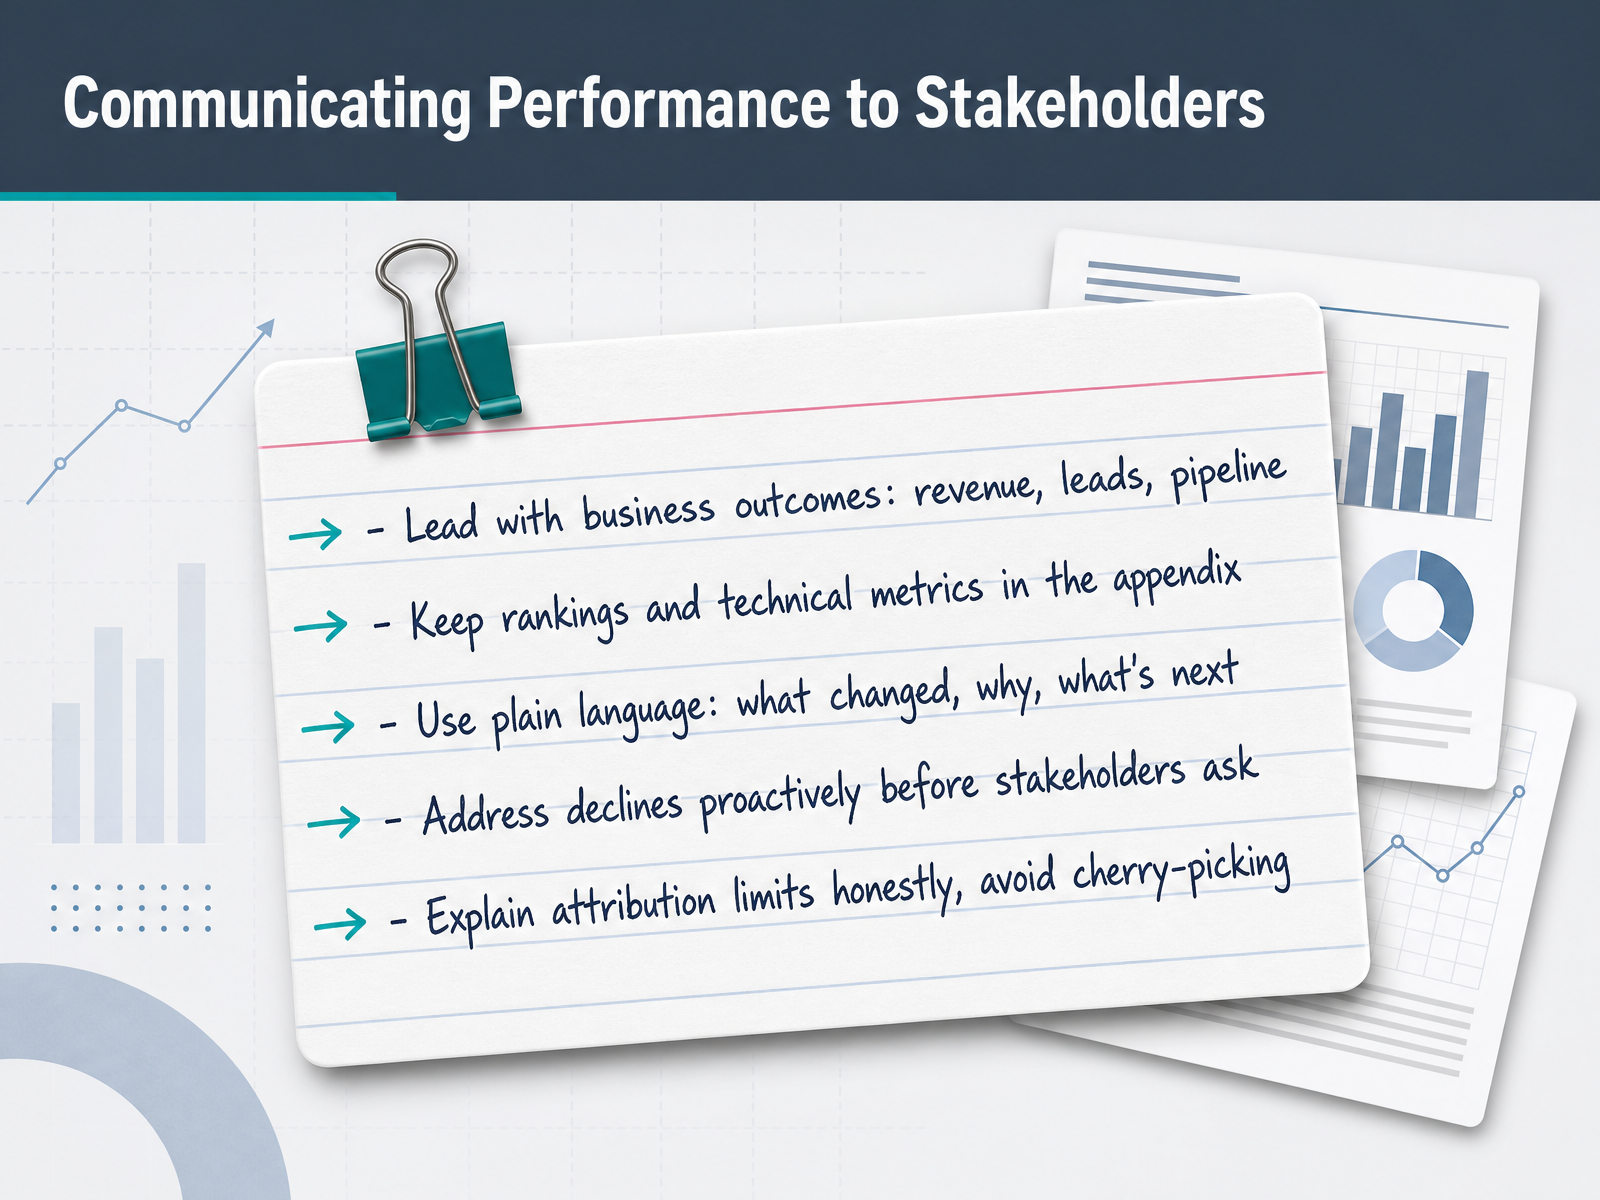
 - 12Communicating Performance to StakeholdersNow, let's talk about how to communicate all of this to stakeholders. Your reports should lead with business outcomes: revenue, qualified leads, and pipeline contribution. That's the language your executives speak. Keep rankings and technical health metrics in the appendix. They're useful for diagnosis, not for headline numbers. Use plain language that answers three questions: what changed, why did it change, and what do we do next. And here's where you need to be proactive. If organic traffic is down, flag it before your stakeholders discover it themselves. Waiting for someone else to find the decline erodes trust faster than the decline itself. Finally, be honest about attribution limits. Don't cherry-pick the most favorable model, and don't overstate causality. A well-explained estimate that ties back to revenue is more useful than a precise figure nobody can interpret. Remember, a good report ends with a decision, not a data dump. Next, we'll work through a real scenario: diagnosing a traffic drop after a migration.
 searchengineland.comclickrank.aiseo-catalog.com+22 min
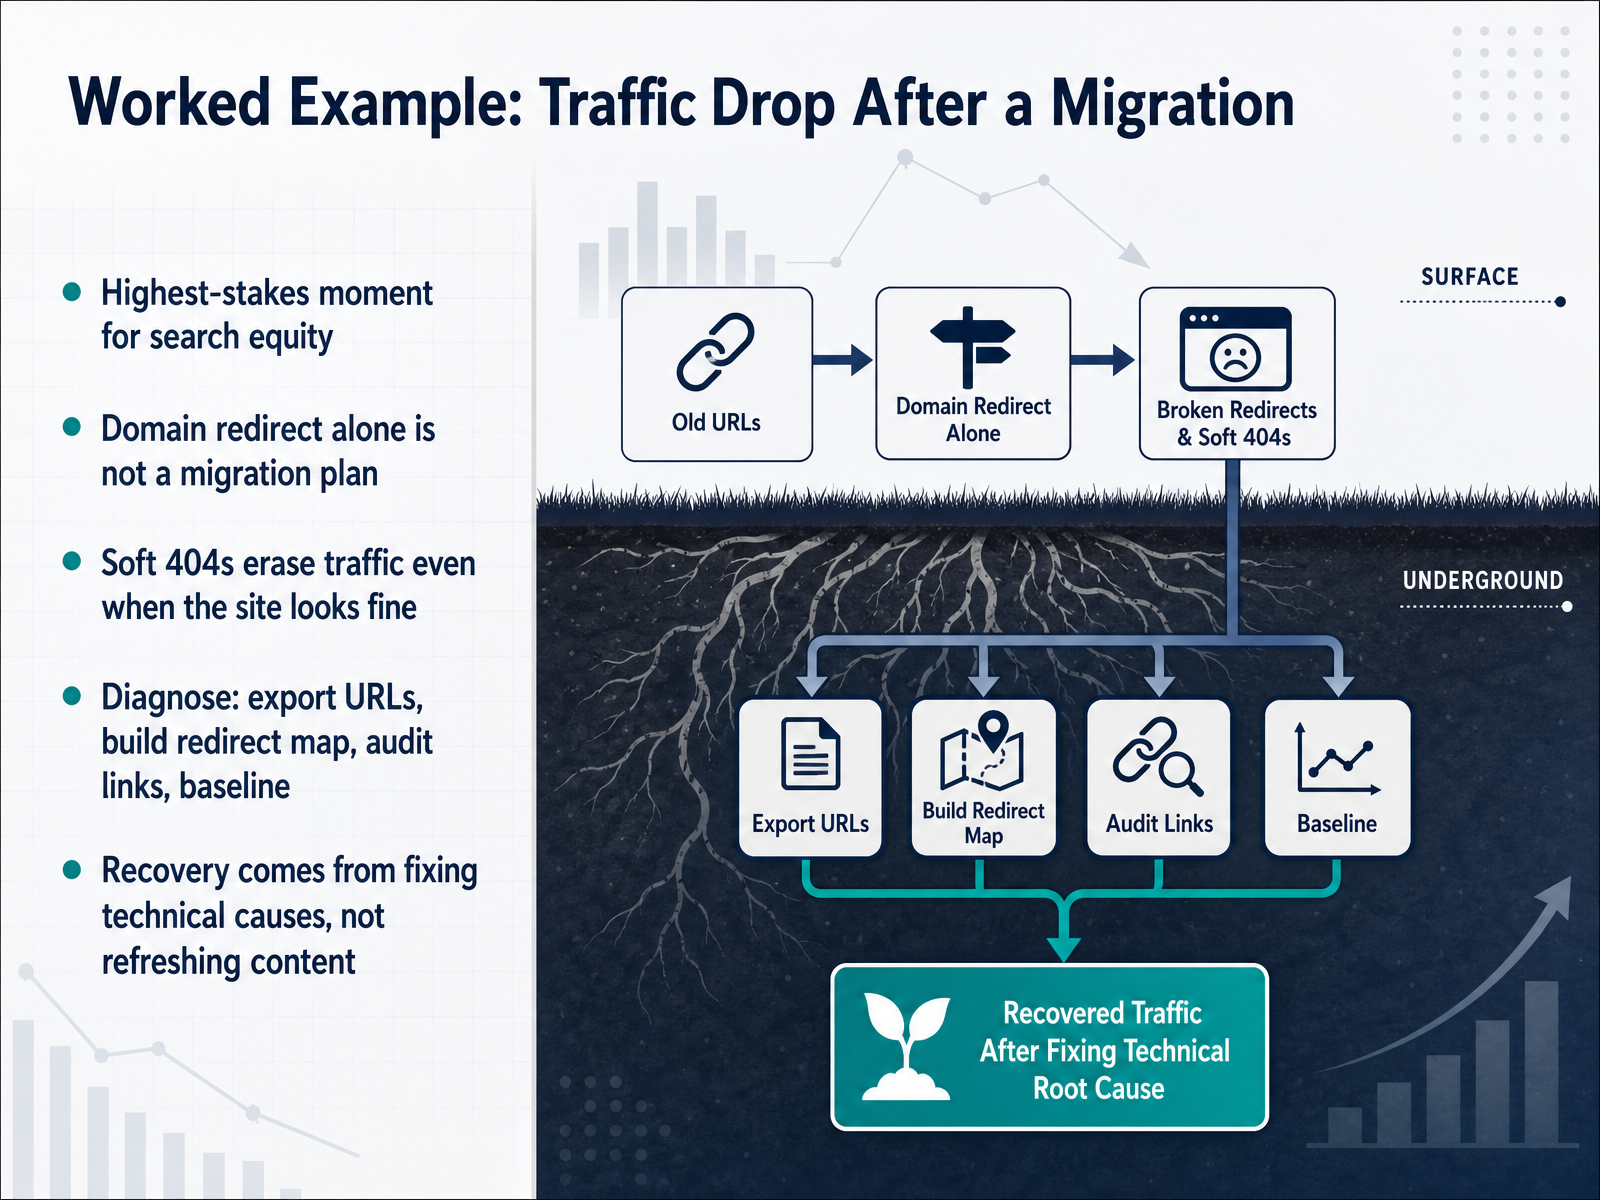
 - 13Worked Example: Traffic Drop After a MigrationNow let's walk through the highest-stakes moment in search: a migration. Here's the blunt truth from real cases: a domain redirect alone is not a migration plan. A publisher moved domains and a year later, daily clicks had collapsed by about ninety percent. The site looked fine in a browser, but Google was seeing soft 404s at scale — pages returning success codes while serving no real content. The damage is invisible until you check the crawl reports. So, how do you diagnose it? Export every URL that earned clicks in the last year. That list is your baseline. Build a page-level redirect map before the move, not after. Audit your internal links, because a slimmer navigation is also an authority decision. And baseline positions, clicks, and conversions the week before. Recovery doesn't come from refreshing content — it comes from fixing the technical causes: correct status codes, cleaning up thin pages, and re-submitting sitemaps. Expect four to eight weeks of re-crawling before you see movement. Treat every fix as a testable hypothesis, and measure the recovery against the original drop, not your all-time high. That brings us to putting it together: a responsible interpretation routine.
 2 min
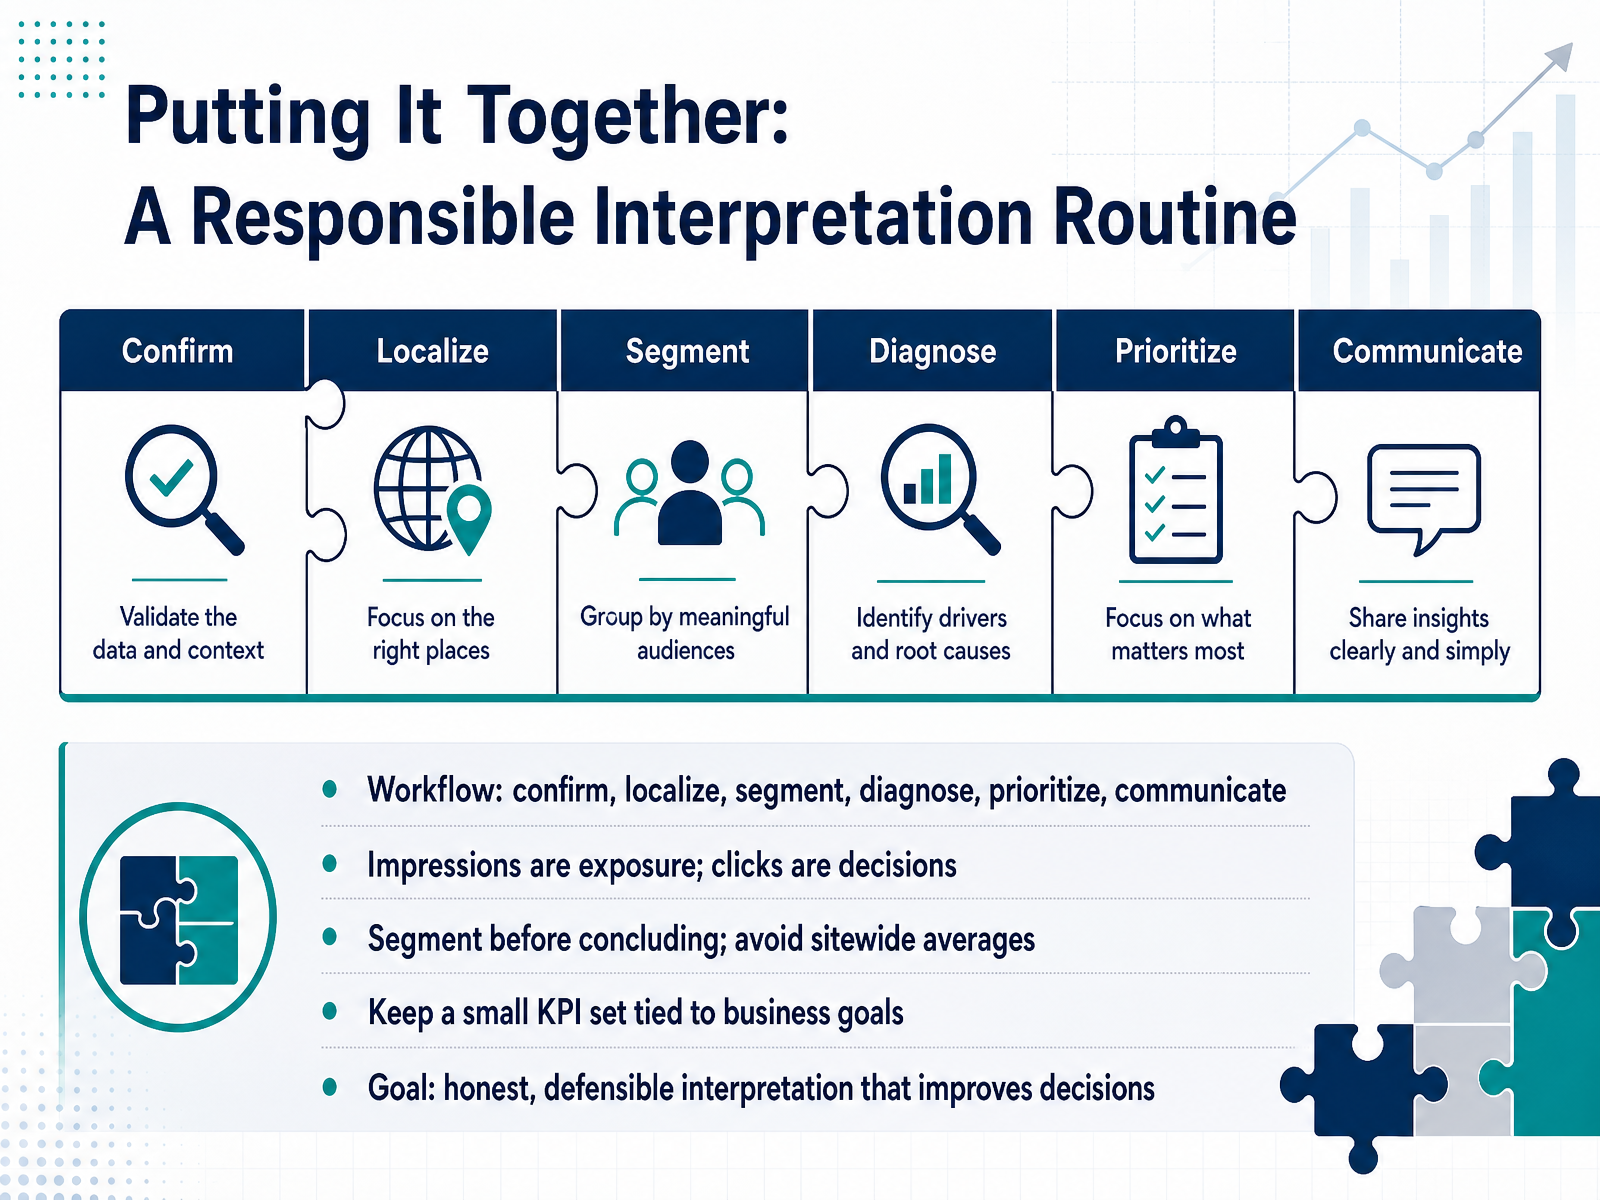
2 min - 14Putting It Together: A Responsible Interpretation RoutineLet's pull everything together into a routine you can actually use. Start by confirming the data is clean. Then localize the change to specific pages or queries. Segment before you conclude, because sitewide averages hide more than they reveal. Diagnose the likely cause, prioritize what matters, and communicate it clearly. Remember, impressions are exposure, but clicks are decisions. The gap between them often tells you more than either number alone. Keep your KPI set small and tied to real business goals. A handful of metrics that support decisions beats a dashboard full of numbers that just sit there. The goal here is honest, defensible interpretation that improves your next decision. Not certainty, just better judgment. Thanks for working through this with me. You have the framework now, so go apply it, question the data, and let the numbers earn their place in your next report.
 searchengineland.comclickrank.aiseo-catalog.com+21 min
Take the deck with you
Download this course as a file — free, no sign-up needed.
- PDF handoutEvery slide page, ready to print or share.15 pages · 3.8 MBDownload
- Narrated PowerPointThe deck that presents itself — every slide carries the digital human's narration video.15 pages · 13.8 MBDownload
- PowerPoint slidesThe full deck as a .pptx — open it in PowerPoint, Keynote, or Google Slides.15 pages · 3.7 MBDownload
Free to use in your own training — please keep the PersonWise credit page at the end.
Have your own deck? Turn it into a course
Sources consulted
Web sources consulted while building this course.
- The new SEO KPIs you are missing: Measuring SEO beyond clicks — searchengineland.com
- SEO Performance & Measurement Framework Guide in 2026 — clickrank.ai
- SEO Reporting Metrics That Matter — seo-catalog.com
- How to Measure SEO Success in 2026: The KPIs That Matter — autimark.com
- SEO Dashboard Metrics: The Complete 2026 Guide — quickseo.ai
- GSC Data Interpretation: The Complete 2026 Guide to Turning Search Console Numbers Into SEO Wins — quickseo.ai
- Google Search Console metrics explained · QueryScope — queryscope.dev
- Google Search Console AI Overview: Why Your Data Misleads — yositeup.com
- SEO metrics that mislead teams: Search volume, click-through rate, difficulty, and forecasting — siteimprove.com
- Deep Dive: Understanding the Search Console Performance Reports | Demand Signals — demandsignals.co
- What are impressions, position, and clicks? - Search Console Help — support.google.com
- Performance report (Search results): About the data - Search Console Help — support.google.com
- Performance report (Search results): Overview and basic setup - Search Console Help — support.google.com
- Measure your performance on Google - Search Console Help — support.google.com
- Keyword Rank Tracking in 2026: The Full Guide | Similarweb — similarweb.com
- Google Just Broke Your Rank Tracker: The &num=100 Removal Explained | Vantacron Blog — vantacron.com
- Google ranking API in 2026 - why rank tracking is harder than it looks - PolymathDesk — polymathdesk.com
- Why Traditional Rank Tracking Is No Longer Enough — ranktracker.com
- Your rank tracker is lying to you about AI search - MLforSEO — mlforseo.com
- KPI in SEO: The Metrics That Actually Matter in 2026 — blog.hubspot.com