Begin
14 pages · ~28 min
Machine Learning for Business Intelligence
This training introduces business intelligence professionals to machine learning concepts and applications, enabling them to derive deeper insights and make data-driven decisions.
A digital instructor presents all 14 pages. Hold “Ask” at any point and ask out loud — the answer comes from this course. No sign-up needed.
What you’ll learn
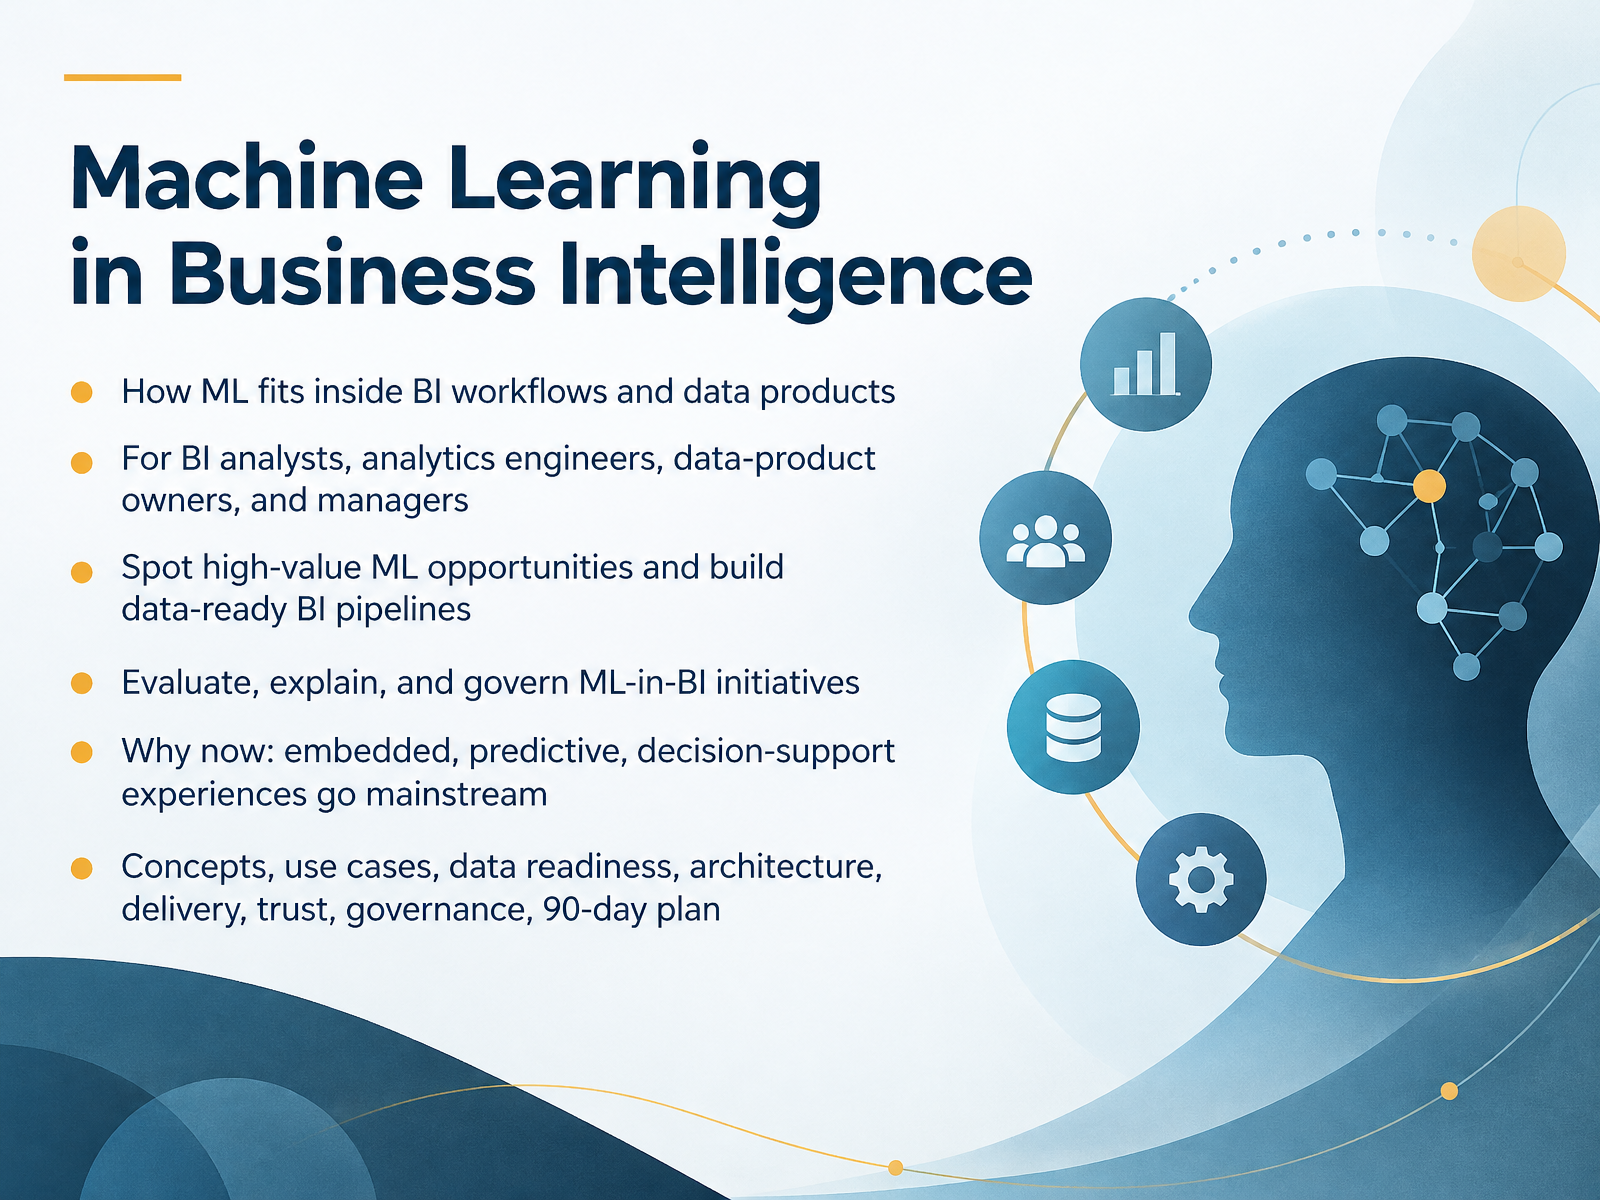
- 01Machine Learning in Business IntelligenceWelcome. This course is about putting machine learning to work inside business intelligence, not beside it. You already own the dashboards, the pipelines, and the metric definitions, so we will skip the fundamentals and focus on decisions you make every week. Together we will cover how ML fits into BI workflows and data products, how to spot high-value opportunities, and how to build BI pipelines that are data-ready for models. We will also work through evaluating, explaining, and governing ML-in-BI initiatives so the outputs earn trust. Why now? Embedded, predictive, decision-support experiences have gone mainstream. Buyers expect analytics inside the workflow, and Gartner's twenty twenty twenty-six planning guidance points to modular architectures and robust governance as the way to keep those experiences reliable. Across the course you will get concepts, use cases, data readiness, architecture, delivery, trust and governance, and a ninety-day plan you can act on. Here is the takeaway for this slide: treat ML as a governed extension of your semantic layer, not a separate science project. Let's start by looking at how analytics moves from dashboards to embedded intelligence.doi.orgcloud.google.comomni.co+22 min
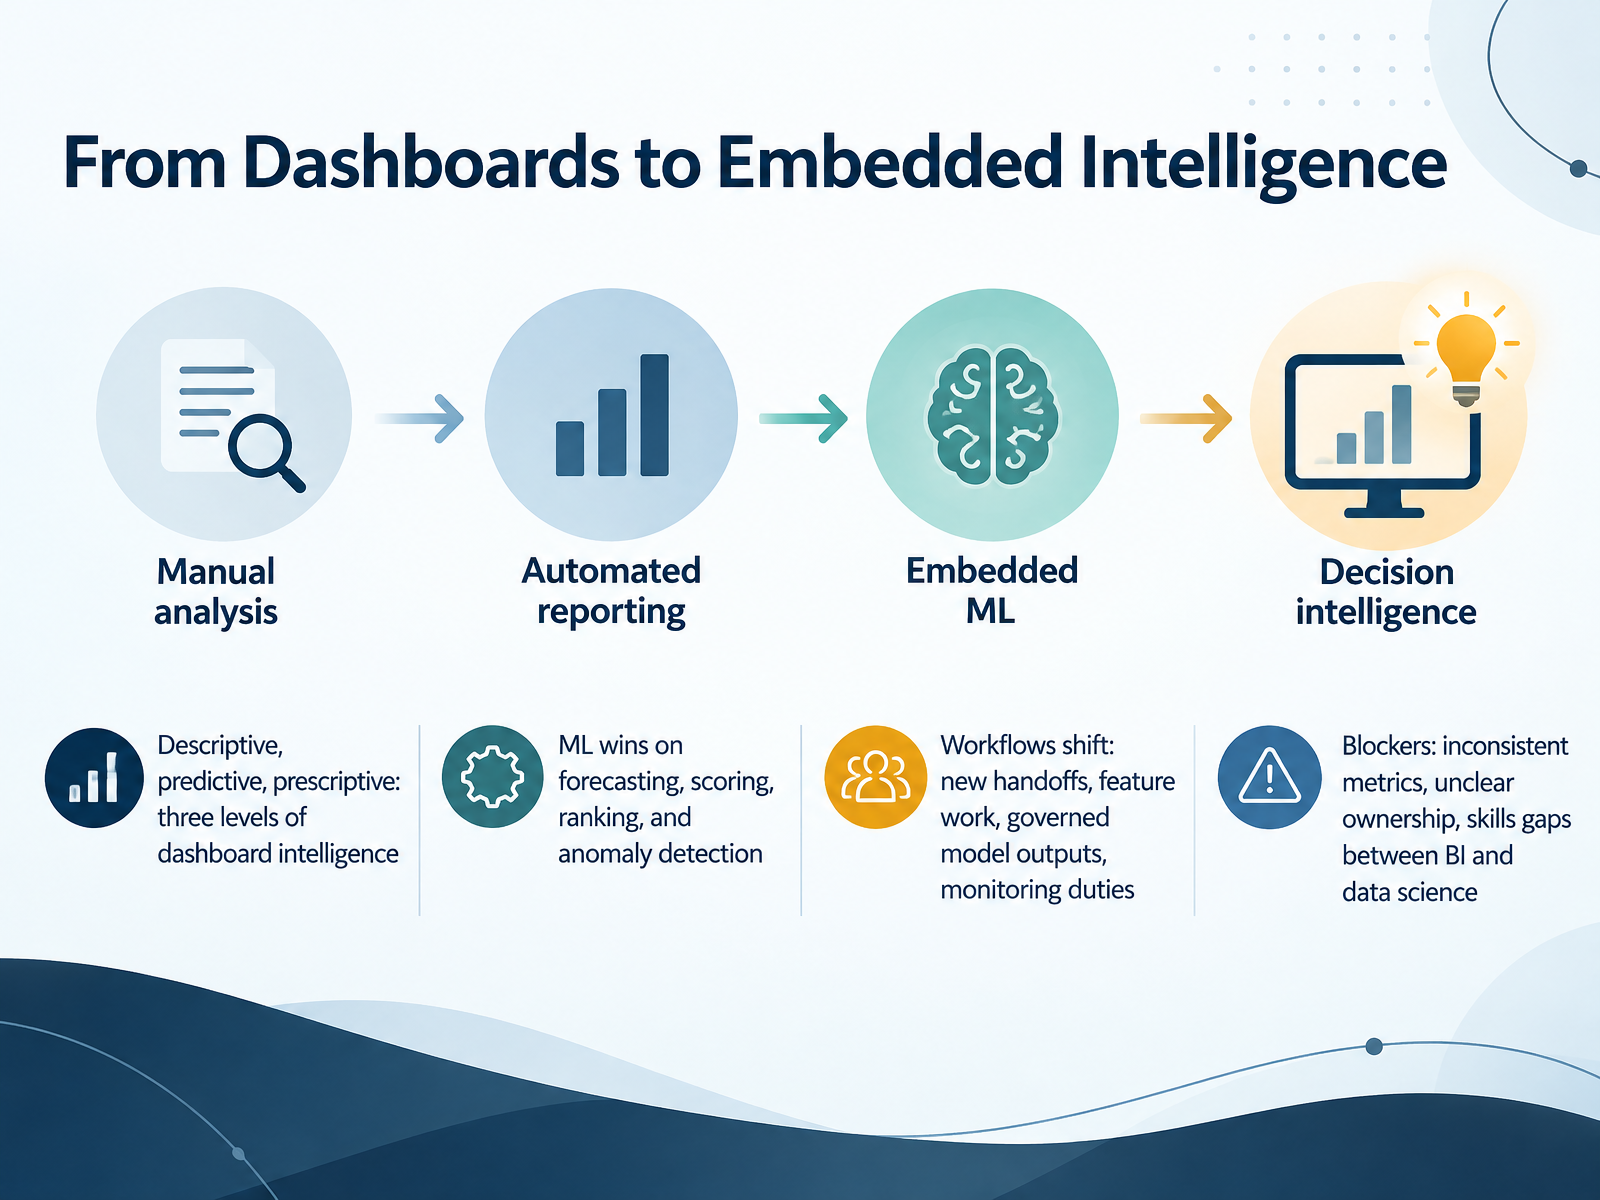
- 02From Dashboards to Embedded IntelligenceLet's look at what actually changes when intelligence moves into the dashboard. You already work across three levels: descriptive, which reports what happened; predictive, which forecasts and scores; and prescriptive, which recommends an action. Machine learning earns its place mainly on forecasting, scoring, ranking, and anomaly detection. The realistic path runs manual analysis, then automated reporting, then embedded ML, then decision intelligence. That shift rewrites your workflow. Feature work lands in your backlog, model outputs need governance, and someone owns monitoring for drift and data quality. Expect three blockers: inconsistent metric definitions, unclear ownership, and skills gaps between BI and data science. Pick your highest-value use case, validate the metric before shipping the model, and name one owner for each output. Next, we translate core ML concepts into BI language.
 emt.gartnerweb.comsisense.compages.barc.de+21 min
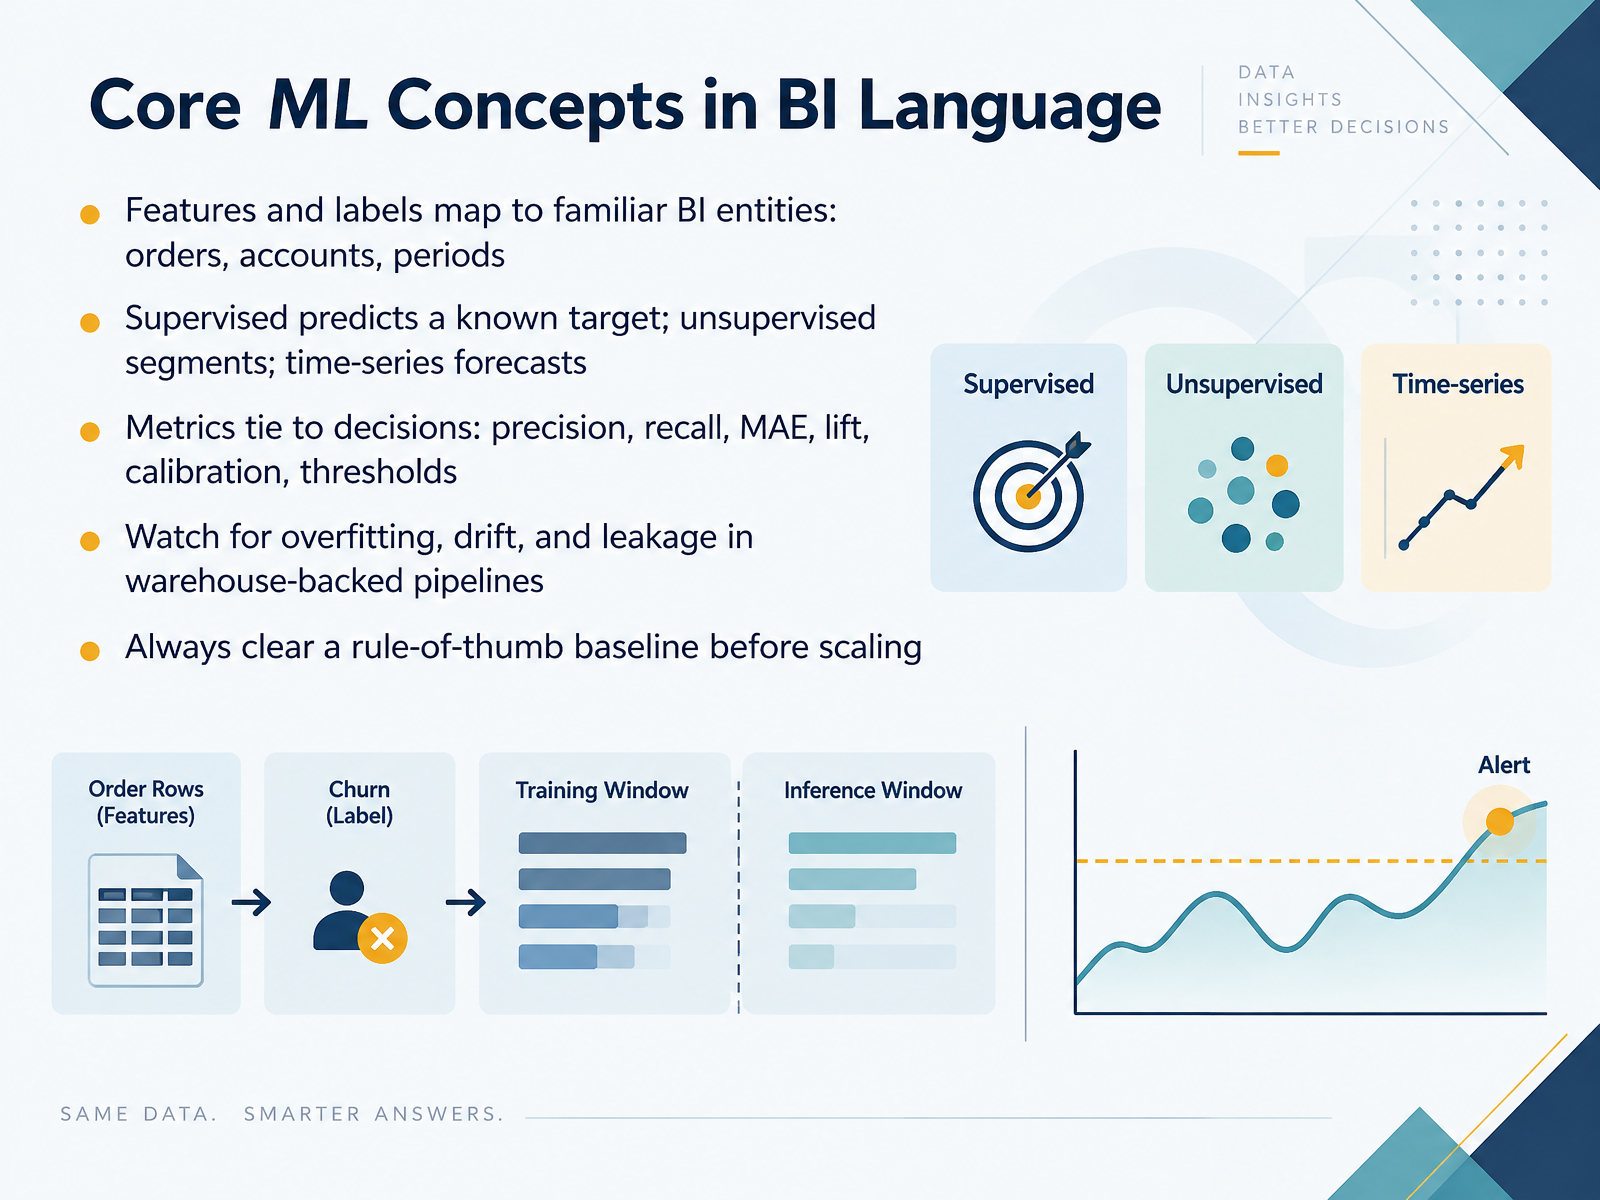
- 03Core ML Concepts in BI LanguageNow let's translate core machine learning concepts into the language you already work in. Features and labels map to familiar BI entities: orders, accounts, and periods. Features are your columns and attributes; the label is the target you want to predict. Supervised learning predicts a known target, unsupervised learning segments, and time-series models forecast.
What matters most is tying metrics to decisions. Precision, recall, mean absolute error, lift, calibration, and thresholds each drive a different choice, so pick the one that matches the cost of being wrong. On warehouse-backed pipelines, watch for overfitting, drift, and leakage. Validate those risks before shipping the model.
And always clear a simple rule-of-thumb baseline before you scale. If the model can't beat the baseline, fix the data first. Next, high-value use cases by function.
 teradata.comdataiku.comaws.amazon.com+21 min
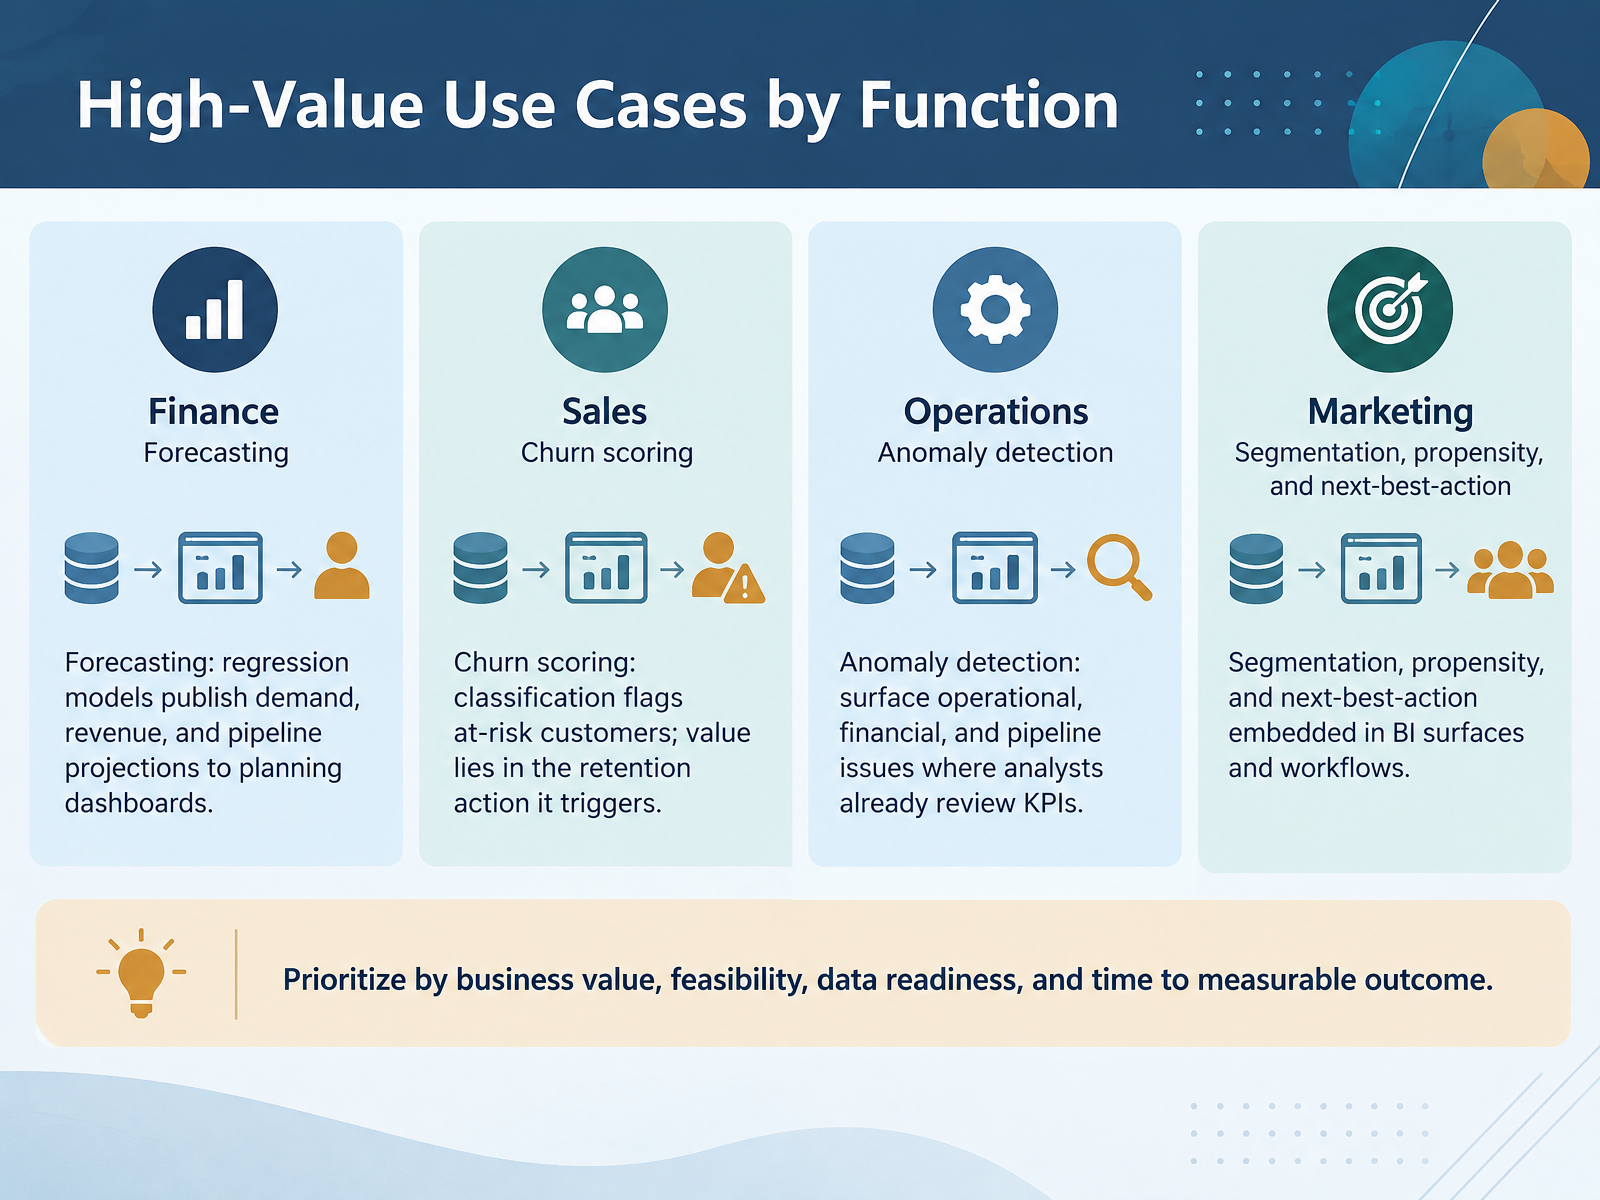
- 04High-Value Use Cases by FunctionLet's map the use cases to functions, and to the decisions you already own. Forecasting leads the list: regression models publish demand, revenue, and pipeline projections straight into your planning dashboards. Reliability beats raw accuracy here, since a consistently available forecast at eighty-five percent accuracy outperforms a ninety-two percent model that fails unpredictably. Churn scoring comes next. Classification flags at-risk customers, but the value is the retention action it triggers. MasterControl flagged accounts ninety days early at eighty-five percent accuracy, and the top twenty percent of flagged accounts churned at three times the base rate. Anomaly detection should live where analysts already review KPIs, so pipeline and financial issues surface in the same interface, not a separate tool. Then segmentation, propensity, and next-best-action, embedded in BI surfaces and workflows. Sixty-five percent of BI customers already use embedded analytics, so treat this as a core expectation. Prioritize by business value, feasibility, data readiness, and time to measurable outcome. We turn now to the foundation under all of it: Data Readiness and the Semantic Layer.
 teradata.comdataiku.comaws.amazon.com+22 min
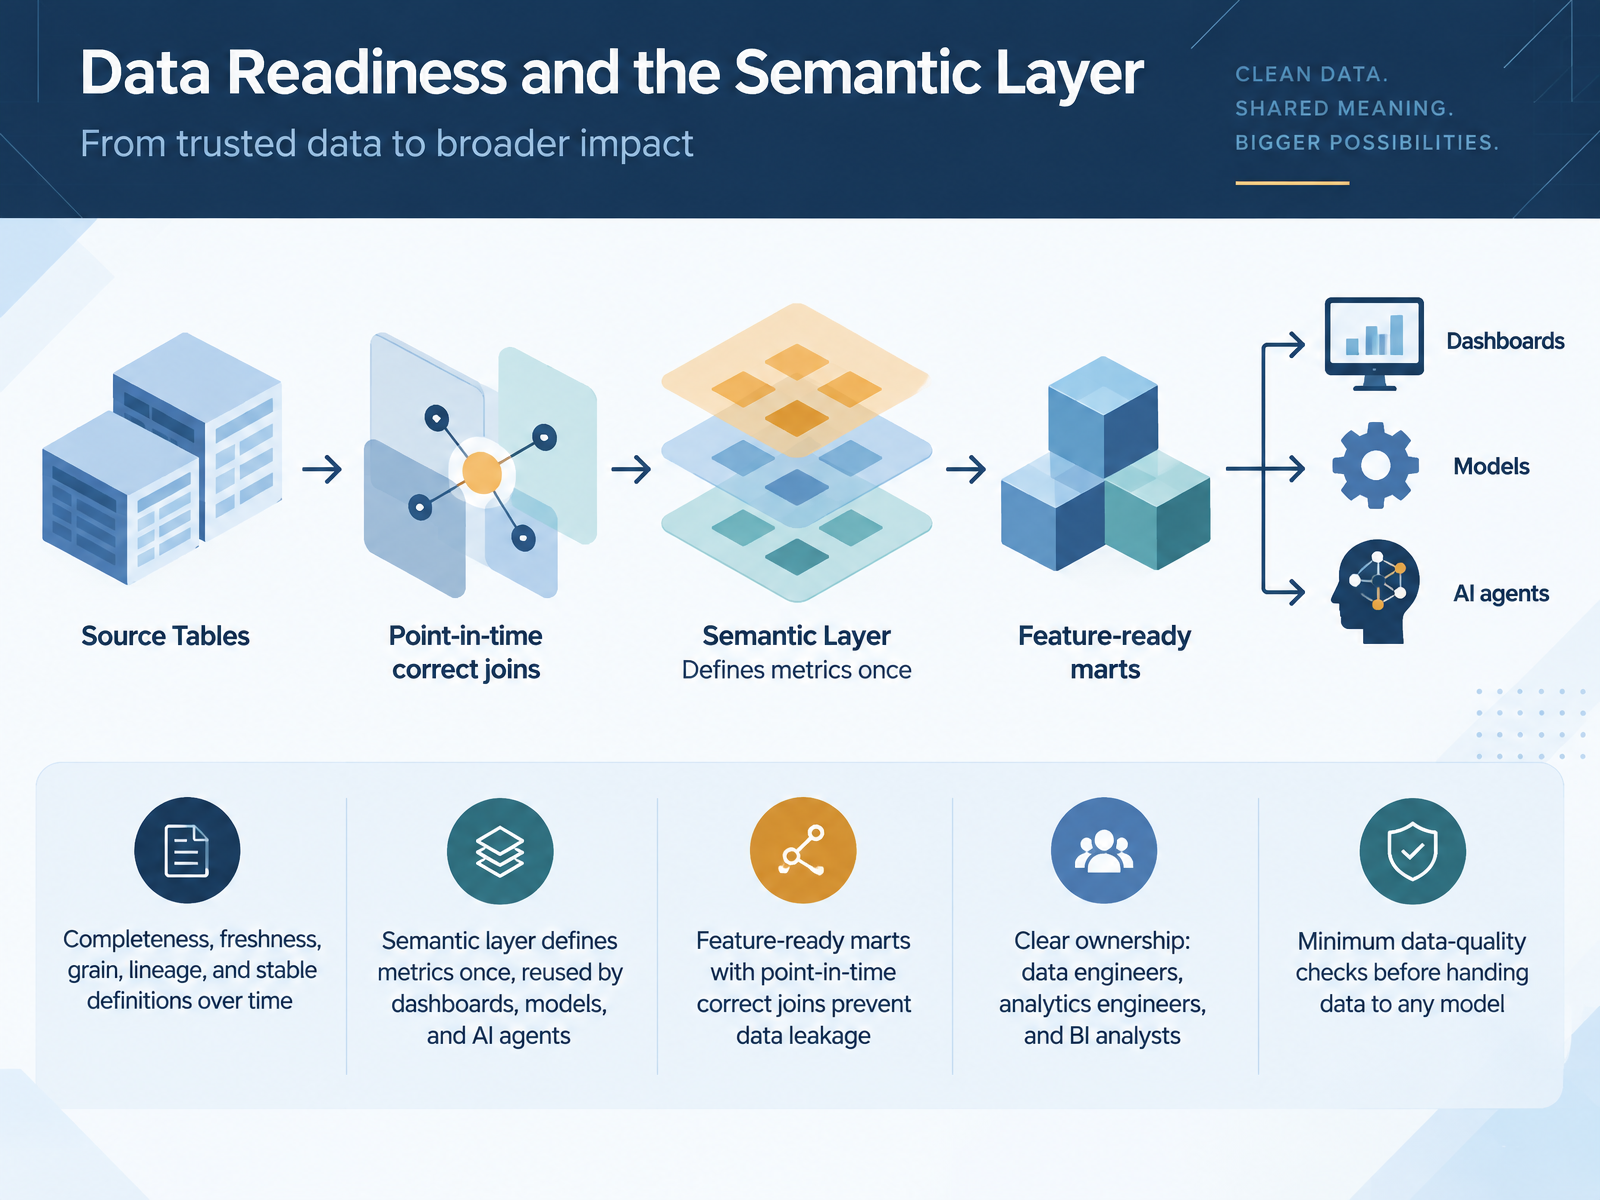
- 05Data Readiness and the Semantic LayerBefore any model learns from your data, you have to decide whether that data is trustworthy. Here is the checklist: completeness, freshness, grain, lineage, and stable definitions over time. What does this mean for your weekly reporting? If revenue means three different things in three dashboards, your model inherits that ambiguity. The semantic layer solves this. Define metrics once, and let dashboards, models, and AI agents query the same governed definitions. Then build feature-ready marts with point-in-time correct joins. That one practice prevents leakage, where a feature secretly contains information from the future. Assign clear ownership across data engineers, analytics engineers, and BI analysts. And run minimum data-quality checks before handing any dataset to a model. Validate the metric before you ship the model. Next, we look at the tooling landscape and architecture patterns that put this into practice.
 doi.orgcloud.google.comomni.co+22 min
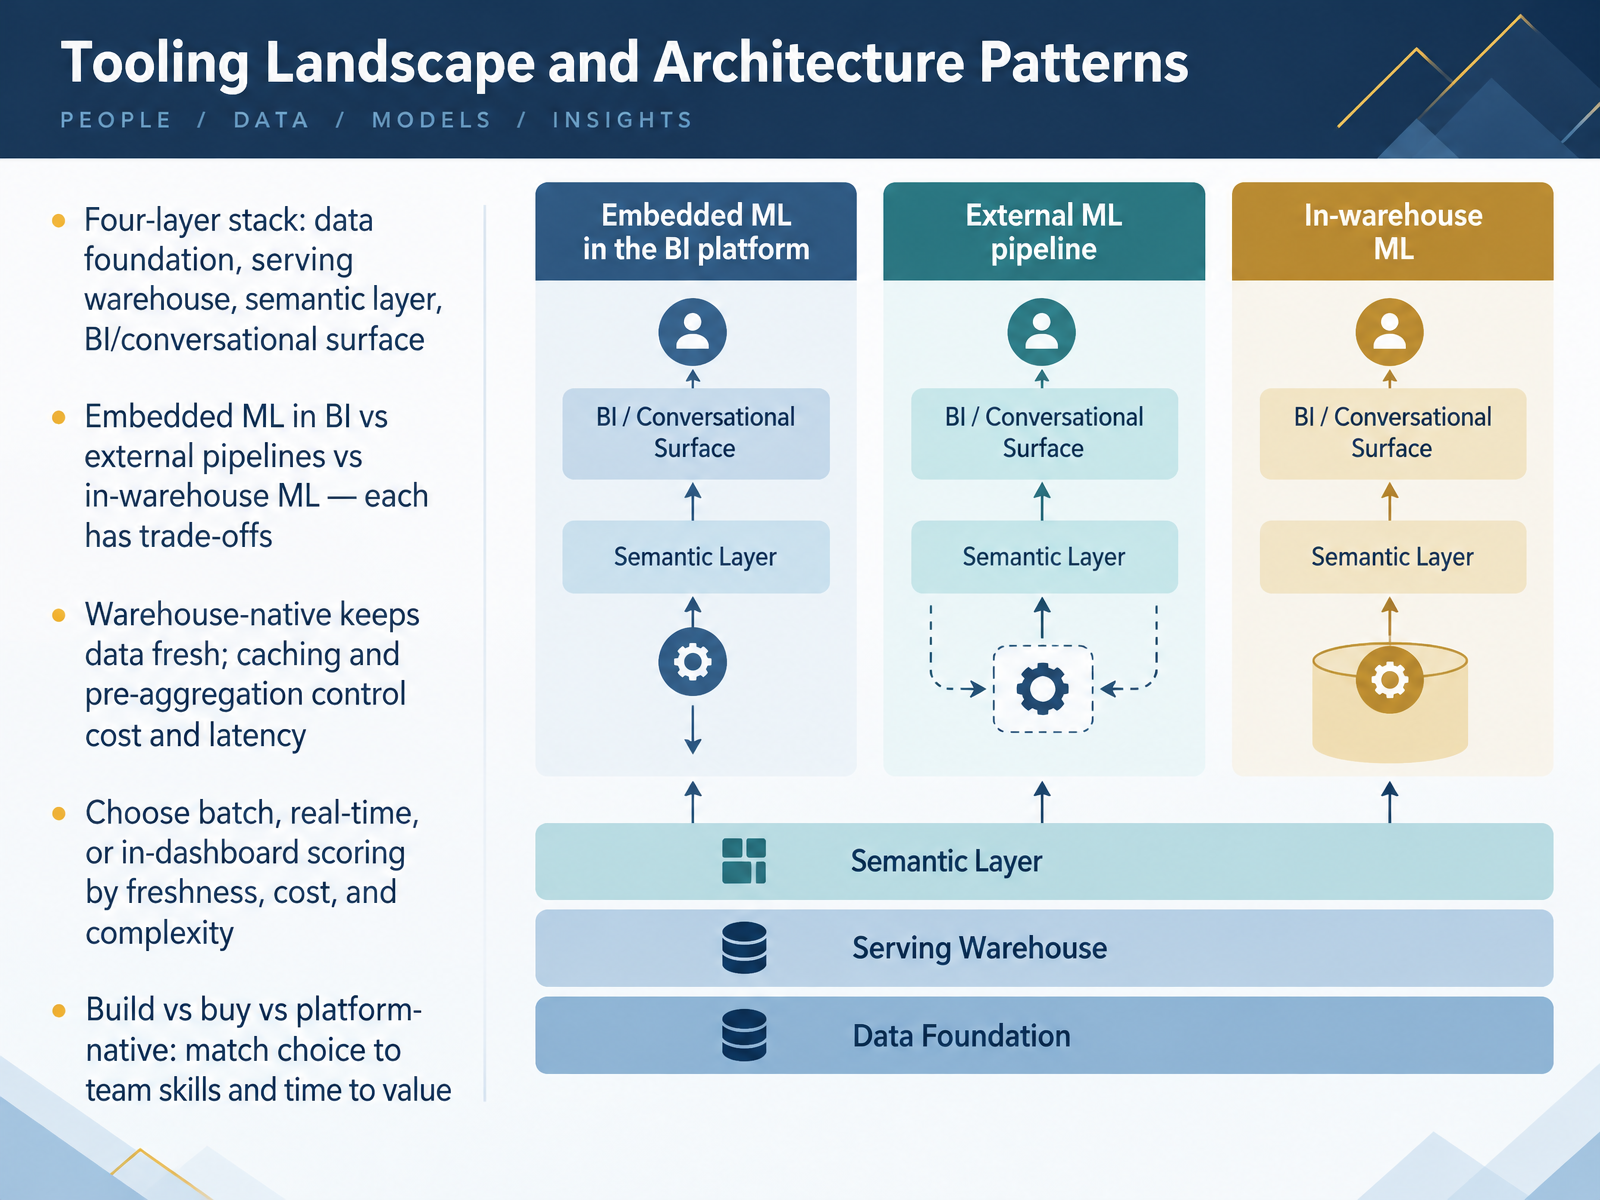
- 06Tooling Landscape and Architecture PatternsLet's turn to the tooling landscape and the architecture patterns that hold it together. Think in four layers: the data foundation, the serving warehouse, the semantic layer, and the BI or conversational surface on top. The semantic layer is where your metric definitions live, and it's the hardest layer to retrofit later. Now, where does the model run? You have three options: embedded ML inside the BI tool, external pipelines, or in-warehouse ML. Each carries trade-offs in governance, latency, and maintenance. Warehouse-native architecture keeps data fresh and avoids a second copy of tenant data, but warehouse compute scales with query volume, so you need multi-layer caching and pre-aggregation to control cost and latency. Then choose your scoring cadence by freshness, cost, and complexity: batch, real time, or in-dashboard. Finally, build versus buy versus platform-native comes down to team skills and time to value. Platform deployments take weeks; in-house builds run six to eighteen months, and maintenance is routinely underestimated. So validate the metric, then pick the simplest pattern that meets your freshness requirement. Next, we walk through the delivery workflow, from question to model to dashboard.
 doi.orgcloud.google.comomni.co+22 min
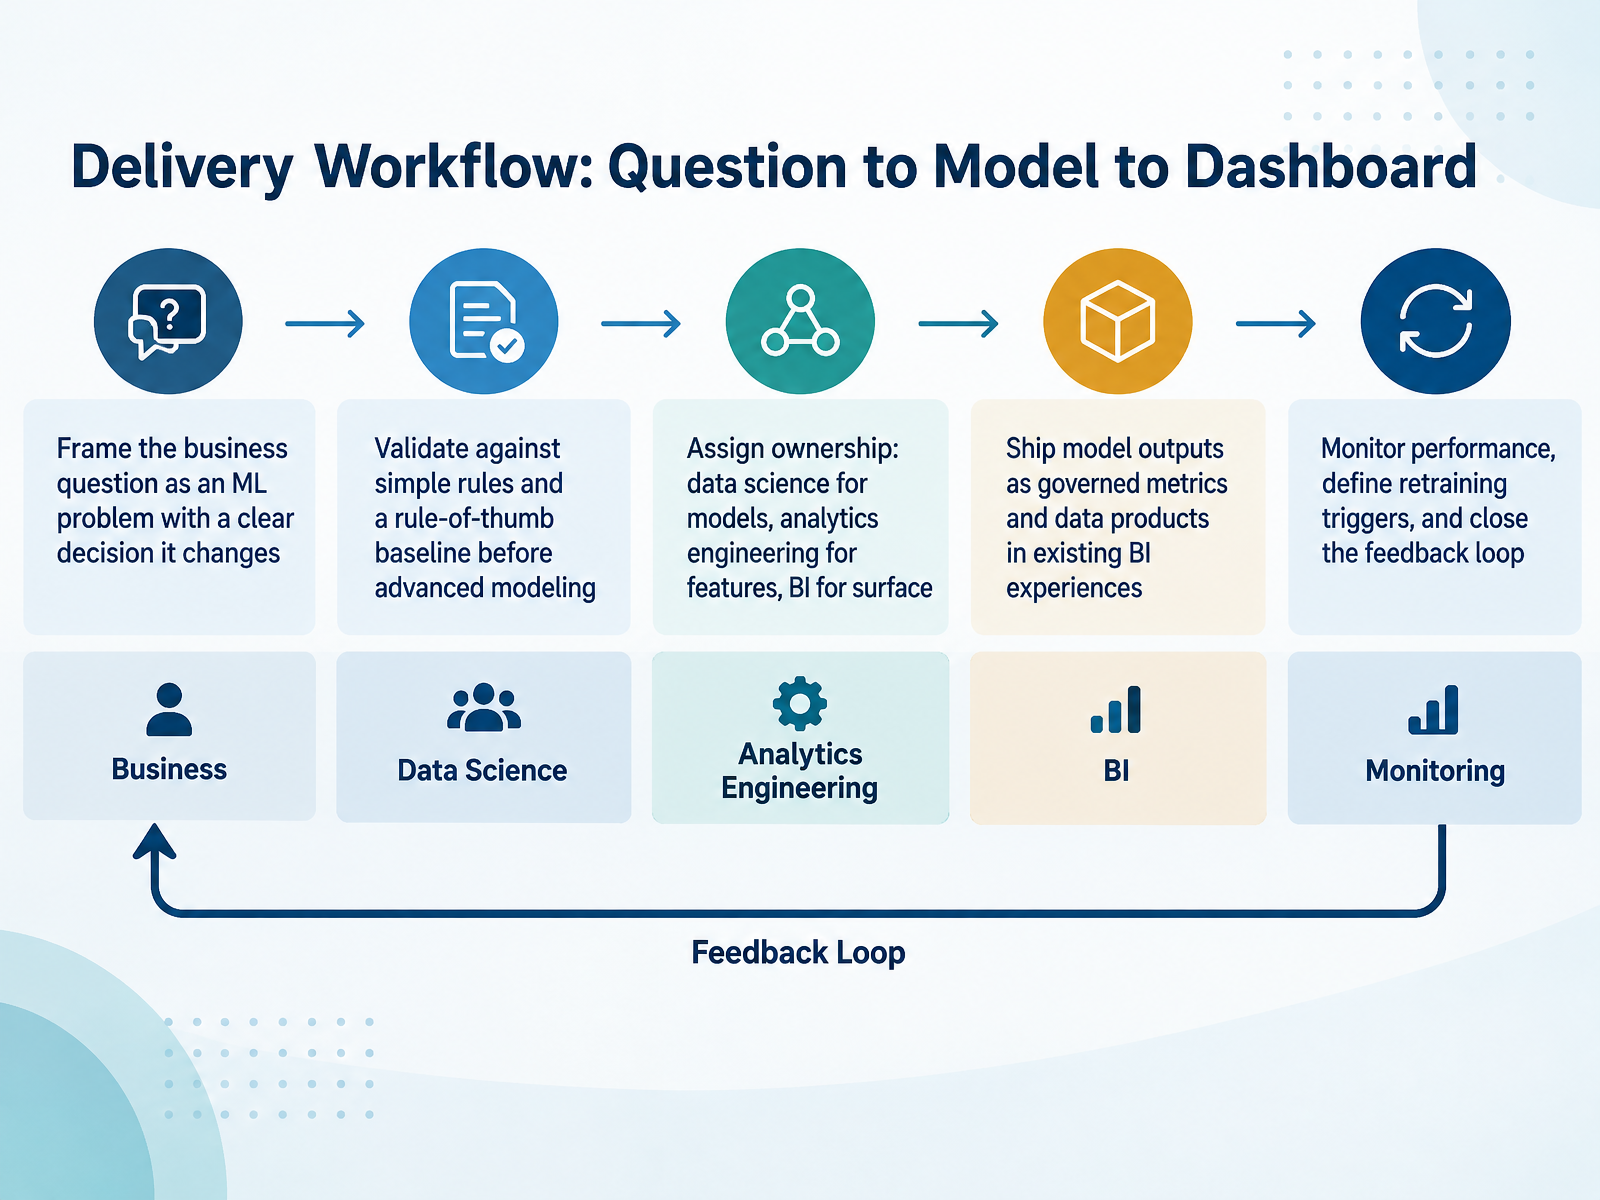
- 07Delivery Workflow: Question to Model to DashboardLet's walk through the delivery workflow, from business question to model to dashboard. Start by framing the question as an ML problem with a clear decision it changes. A churn score that routes your top five hundred at-risk accounts to outreach is a decision. A score nobody acts on is a science project. Next, validate against simple rules and a rule-of-thumb baseline before you reach for advanced modeling. If a threshold rule gets you most of the way, you now know what the model has to beat. Then assign ownership explicitly. Data science owns the models, analytics engineering owns the features, and BI owns the surface where people see the numbers. Ship model outputs as governed metrics and data products inside the BI experiences your teams already use. Anomaly scores belong on the same dashboard as your KPIs, not in a separate tool. Finally, monitor performance, define retraining triggers, and close the feedback loop with the teams acting on the scores. That feedback is what keeps the model honest. Next, we look at evaluation and business alignment.
 teradata.comdataiku.comaws.amazon.com+22 min
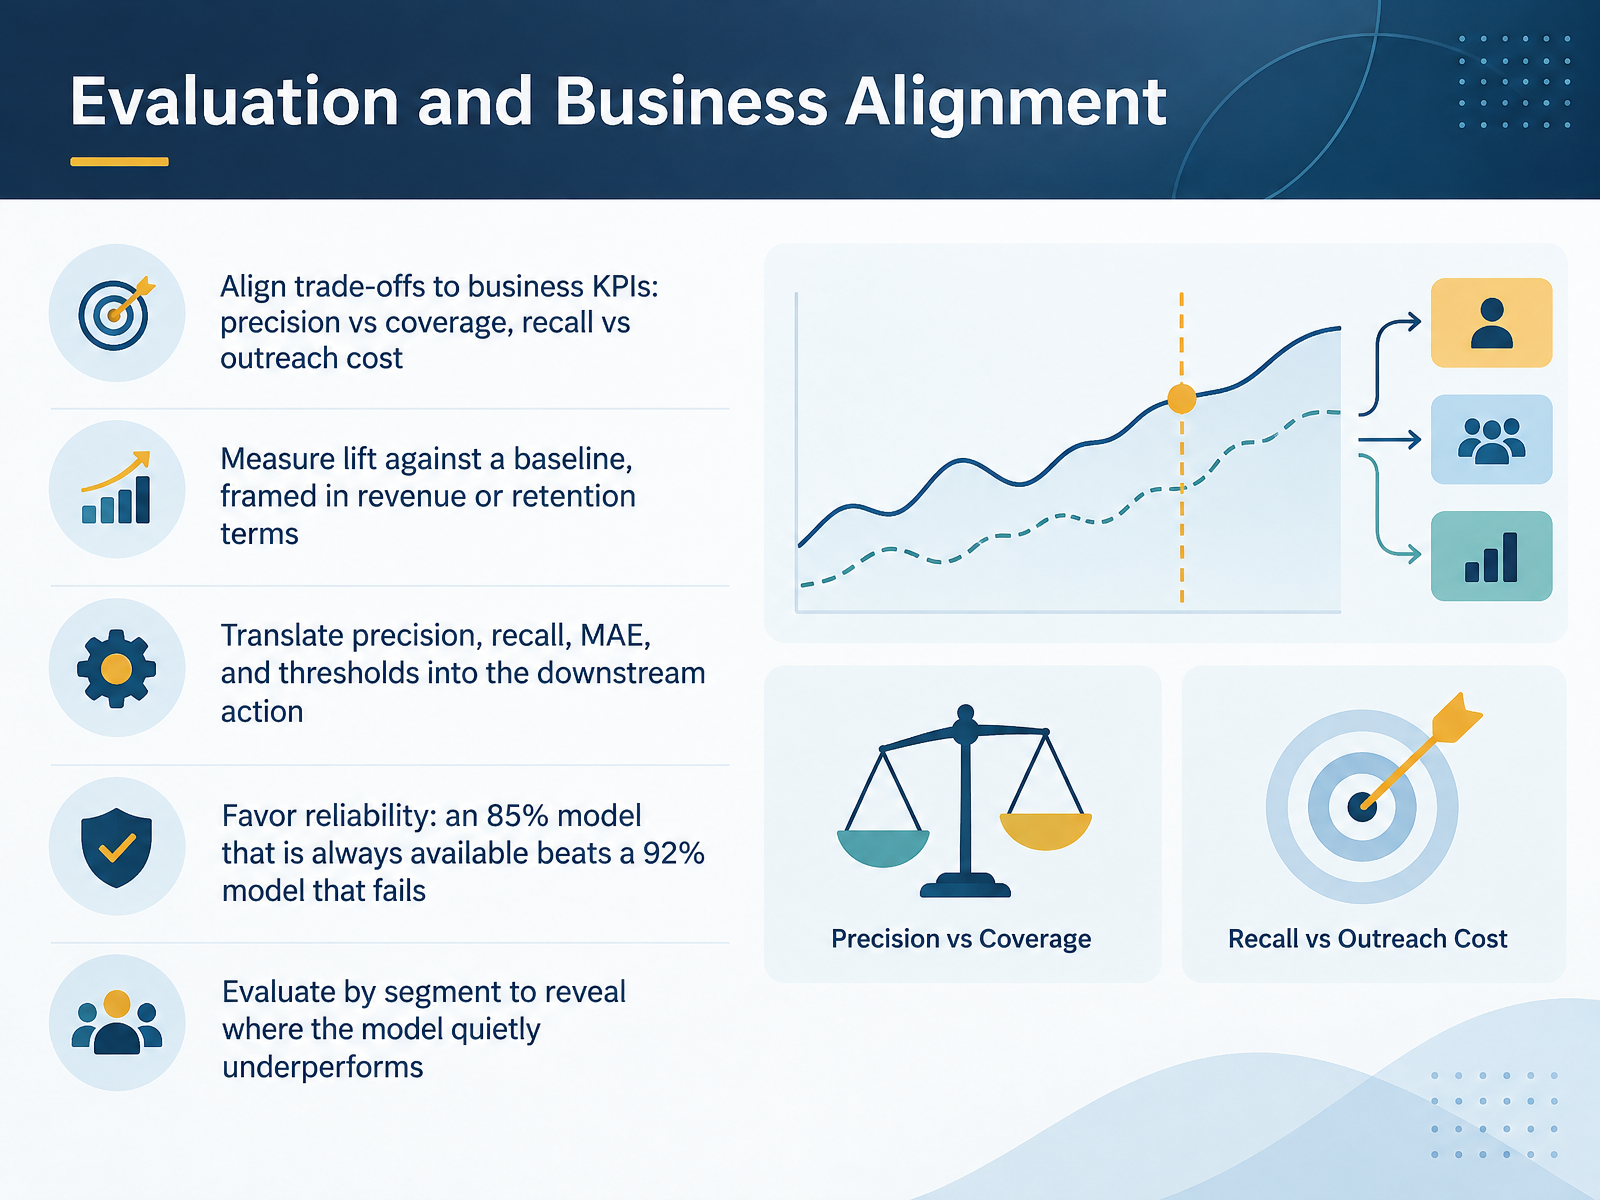
- 08Evaluation and Business AlignmentSo how do you know a model is actually worth shipping? You evaluate it against the business, not just the benchmark. Start by choosing the trade-off your KPI cares about. Precision versus coverage, or recall versus outreach cost. Then measure lift over your existing baseline, and frame that lift in revenue or retention terms, not in accuracy points. Translate precision, recall, mean absolute error, and thresholds into the downstream action. If you flag a churn risk, who calls that account, and what does the call cost? Favor reliability: an eighty-five percent model that is always available beats a ninety-two percent model that fails unpredictably. One more step that often gets skipped: evaluate by segment. Slice by cohort, region, or customer tier, because that is where a model quietly underperforms while the aggregate looks healthy. That brings us to explainability and communicating uncertainty.
 teradata.comdataiku.comaws.amazon.com+21 min
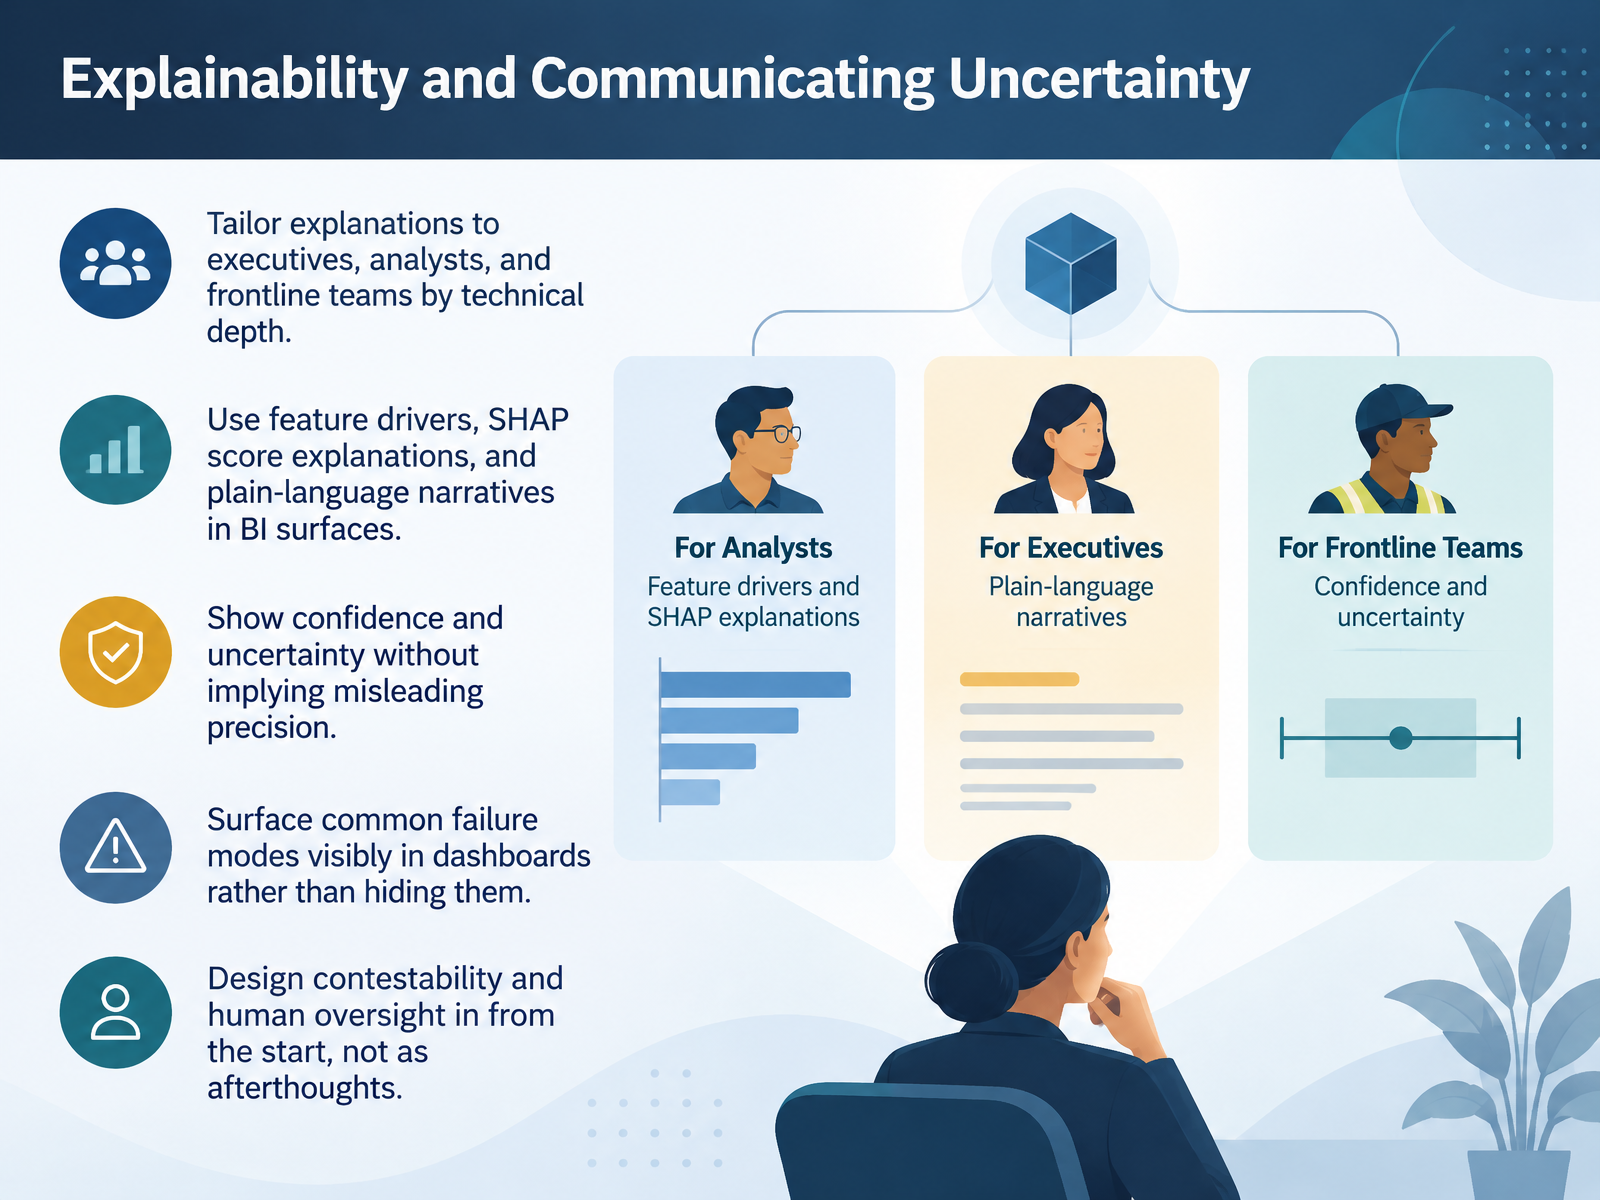
- 09Explainability and Communicating UncertaintyNext, explainability and communicating uncertainty. An explanation is only useful if it fits the audience. Give executives the two or three feature drivers behind a score. Give analysts the SHAP detail they need to validate it. Give frontline teams a plain-language narrative attached to the next best action. What does this mean for your weekly reporting? Put confidence intervals and uncertainty bands directly in the BI surface, so nobody reads a point estimate as precision it doesn't have. Surface common failure modes visibly in the dashboard instead of hiding them behind a clean score. And design contestability and human oversight in from the start. The Financial Stability Board names explainability and human oversight as sound practices, not optional extras. Build the override path before you ship. That human feedback is also your best model monitoring. That naturally leads into governance, risk, and responsible ML.
 teradata.comdataiku.comaws.amazon.com+21 min
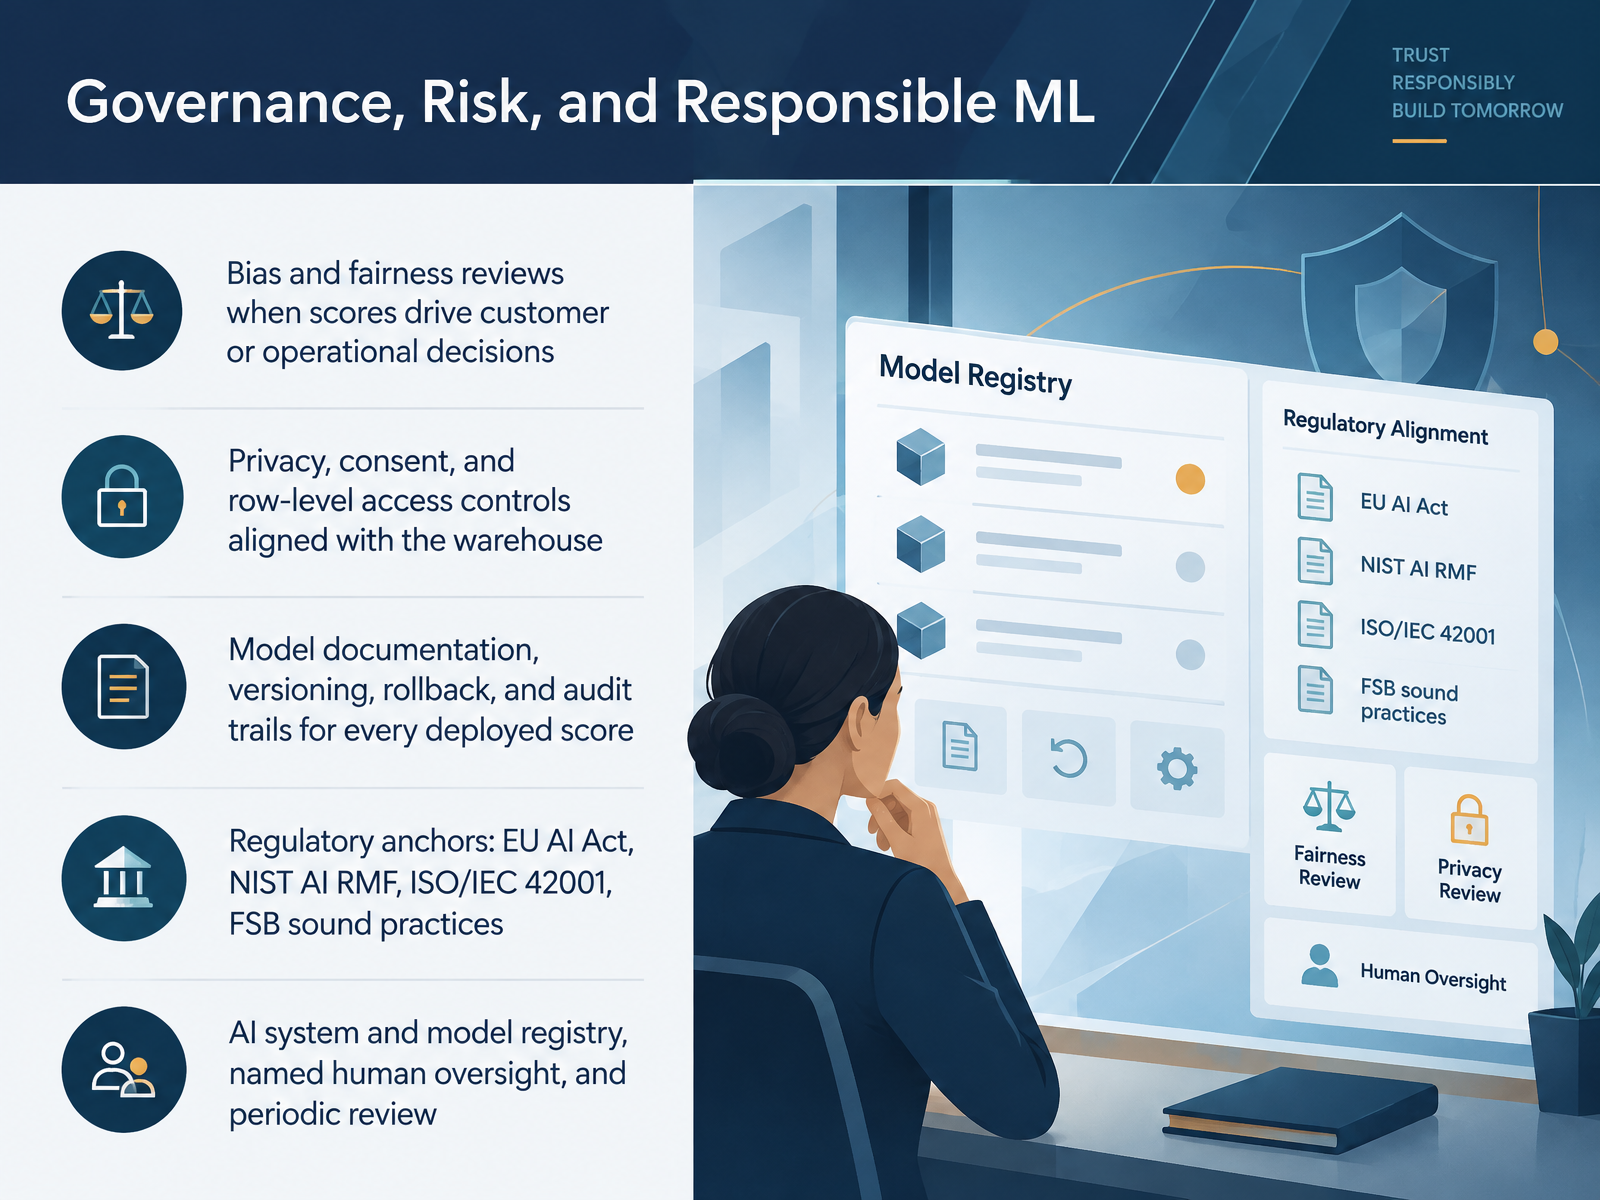
- 10Governance, Risk, and Responsible MLLet's turn to governance, risk, and responsible ML. Once a score drives a customer or operational decision, you own the controls around it. First, run bias and fairness reviews before the score influences decisions, and review again after drift appears. Second, align privacy, consent, and row-level access controls with the warehouse, so the same permissions that protect the tables protect the features. Third, document, version, and log every deployed model, and confirm rollback works before you need it. Anchor this work in the EU AI Act, the NIST AI Risk Management Framework, ISO/IEC 42001, and the FSB's twelve sound practices. Register each model in an AI system registry, name a human owner, and schedule periodic review. What does this mean for your weekly reporting? Add model status and open review items to the dashboard, so risk stays visible. Next, we look at team roles, skills, and RACI.
 fsb.orgcltc.berkeley.eduar5iv.labs.arxiv.org+22 min
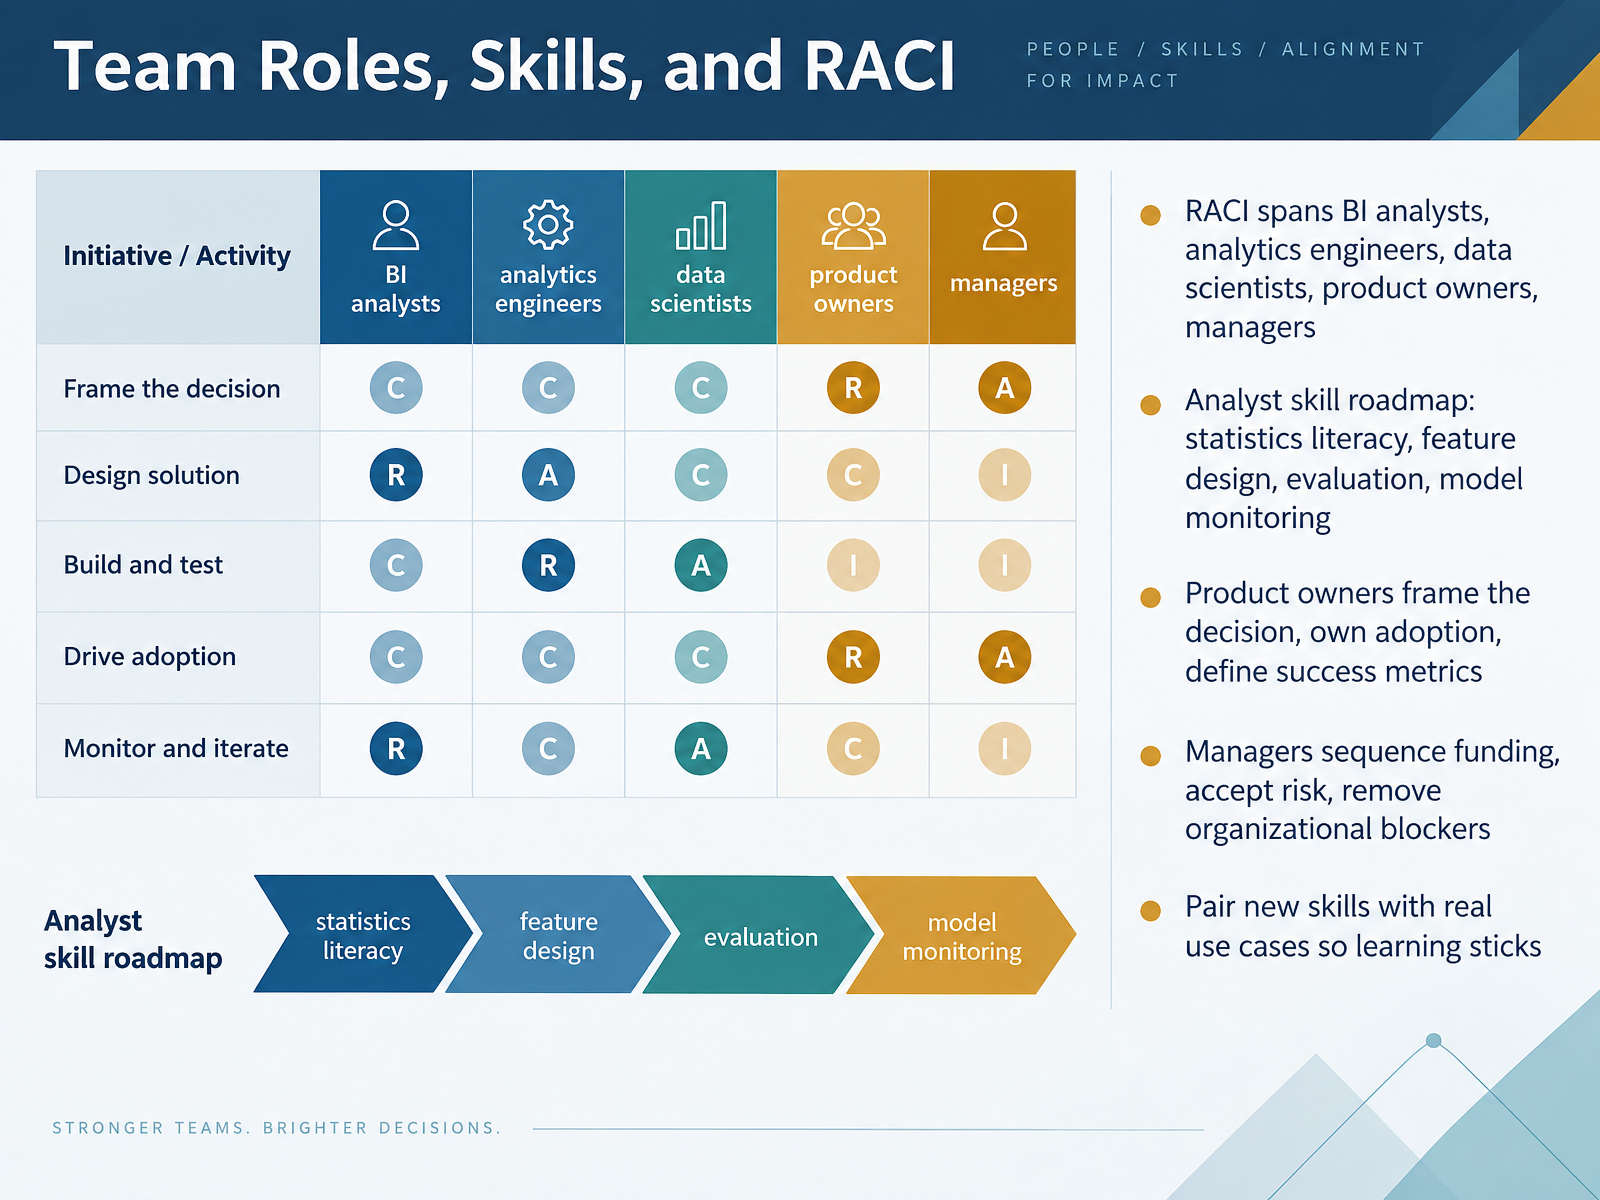
- 11Team Roles, Skills, and RACINow let's make the work assignable. Responsibility for machine learning in business intelligence spans five groups: BI analysts, analytics engineers, data scientists, product owners, and managers. Use a RACI to make decision rights explicit, so the model owner and the metric owner are never the same unnamed person. For analysts, build a concrete skill roadmap: statistical literacy, feature design, evaluation, and model monitoring. Validate the metric before shipping the model, and re-check it in production. Analytics engineers keep the pipelines and semantic layer that feed features and scoring consistent. Product owners frame the decision the model supports, own adoption, and define the success metric. Managers sequence funding, accept documented risk, and remove organizational blockers. Pair each new skill with a real use case, so learning sticks. Next, Measuring Adoption and Business Impact.
 doi.orgcloud.google.comomni.co+22 min
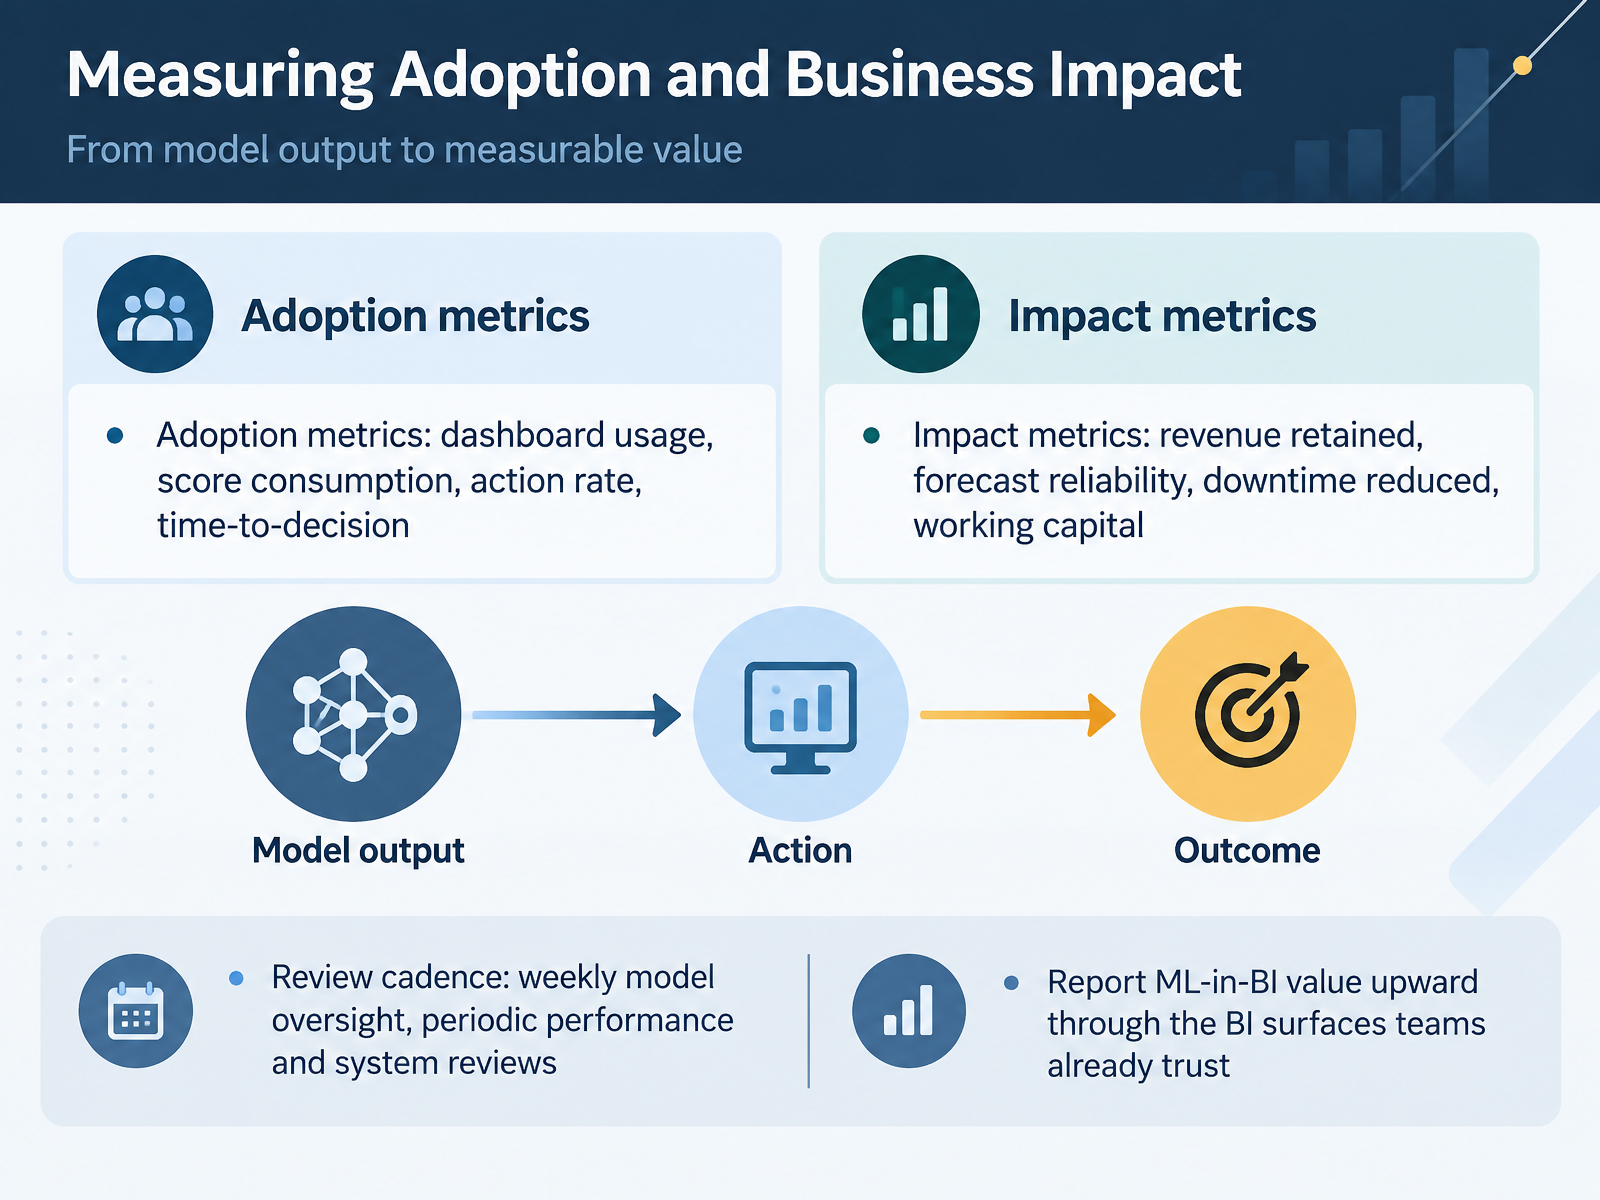
- 12Measuring Adoption and Business ImpactLet's move on to measuring adoption and business impact. A model in production is not the finish line. Your adoption metrics tell you whether people use it: dashboard usage, score consumption, action rate, and time to decision. Your impact metrics tell you whether it matters: revenue retained, forecast reliability, downtime reduced, and working capital. Here is the discipline that makes this work. Tie every model output to the action it triggers, so return on investment is attributable. A churn score routed to the top five hundred at-risk accounts is measurable. A score nobody acts on is not. Set your review cadence deliberately: weekly model oversight, plus periodic performance and system reviews. Then report ML-in-BI value upward through the BI surfaces your teams already trust, not a separate slide deck. That keeps adoption and impact in one governed view. Next, we turn this into a ninety-day action plan and playbook.
 teradata.comdataiku.comaws.amazon.com+21 min
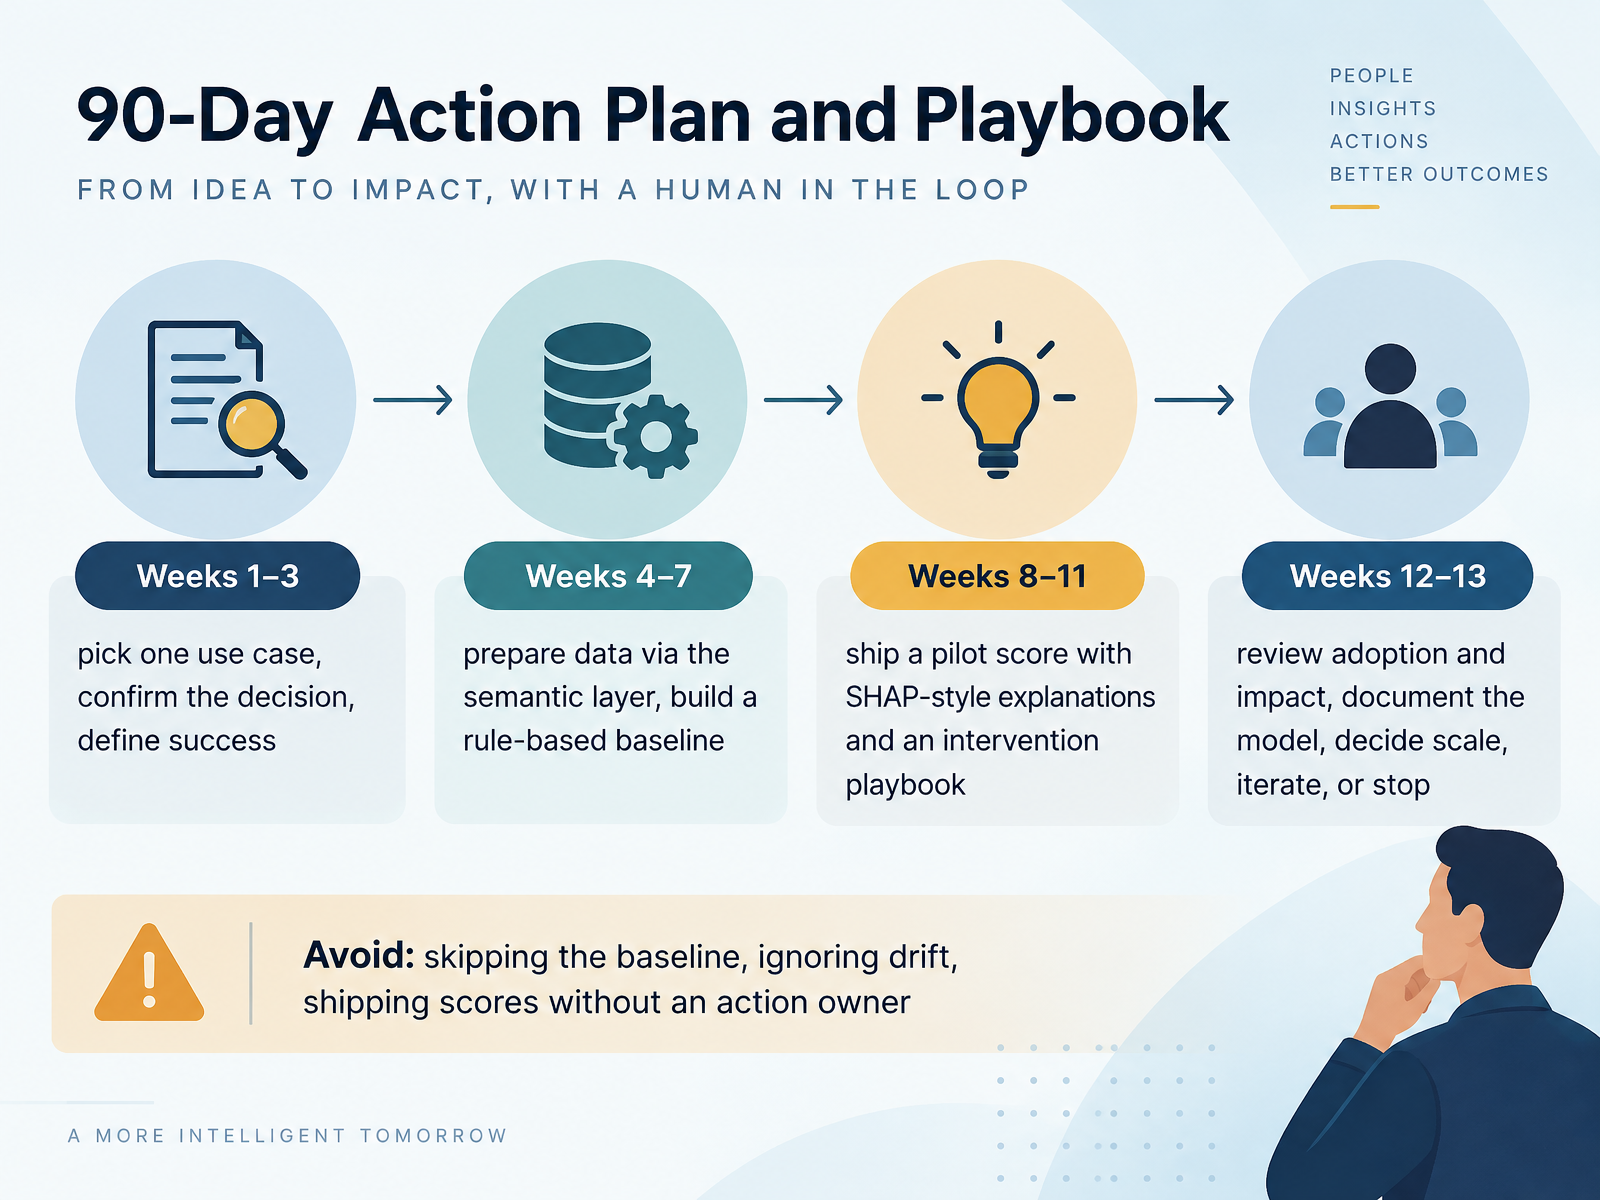
- 1390-Day Action Plan and PlaybookSo how do you put this into practice? Here is a ninety-day plan you can run with the team you already have. In weeks one through three, pick exactly one use case, confirm the decision it informs, and define what success looks like in your currency. Weeks four through seven are about data. Prepare it through your semantic layer so metrics stay governed, and build a rule-based baseline first. That baseline is your comparison point, so build it before anything else. In weeks eight through eleven, ship a pilot score with SHAP-style explanations and an intervention playbook, and name the action owner before launch. The model's business value isn't the prediction itself. It's the retention or intervention action the prediction triggers. Weeks twelve and thirteen are the review: check adoption and impact, document the model, and decide to scale, iterate, or stop. Three things to avoid: skipping the baseline, ignoring drift on things like null rates or schema changes, and shipping scores without an action owner. Those are the failure modes we see most often. Let's close with the key takeaways and discussion.
 doi.orgcloud.google.comomni.co+22 min
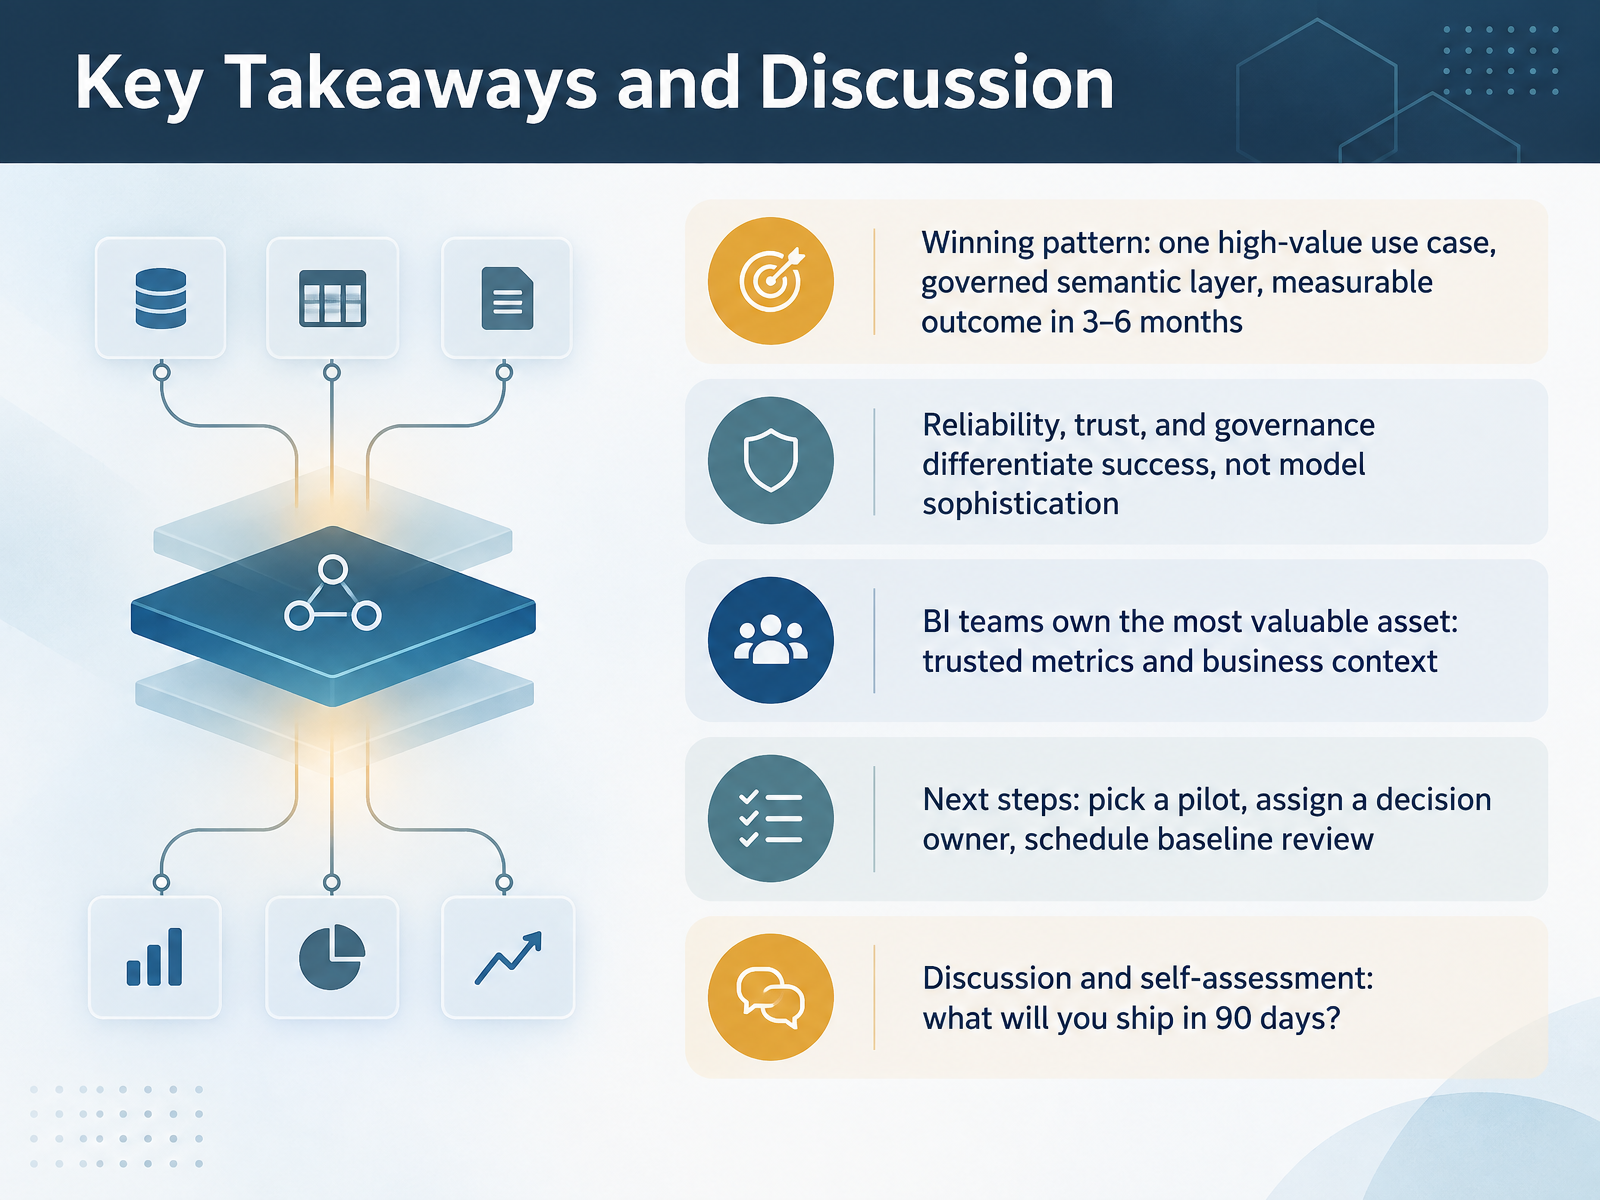
- 14Key Takeaways and DiscussionLet's pull the course together into takeaways you can act on. The winning pattern is narrow: one high-value use case, a governed semantic layer behind it, and a measurable outcome in three to six months. Reliability and trust are what differentiate success, not model sophistication. A forecast at eighty-five percent accuracy that is consistently available beats a ninety-two percent model that fails unpredictably. Here's the part that matters most for you. BI teams own the most valuable asset in this stack: trusted metrics and business context. As foundation models commoditize, the depth of that context determines whether the output is enterprise-specific or generic. So your next steps are concrete. Pick one pilot. Assign a single decision owner. Schedule the baseline review before you build, not after, so the outcome is measured against a number you agreed on in advance. Then ask yourself honestly: what will you ship in ninety days? Thank you for the work you brought to this course. You already hold the hardest part, the trusted metrics. Ship one, measure it, and let that result fund the next.
 doi.orgcloud.google.comomni.co+21 min
Take the deck with you
Download this course as a file — free, no sign-up needed.
- PDF handoutEvery slide page, ready to print or share.15 pages · 3.1 MBDownload
- Narrated PowerPointThe deck that presents itself — every slide carries the digital human's narration video.15 pages · 13.2 MBDownload
- PowerPoint slidesThe full deck as a .pptx — open it in PowerPoint, Keynote, or Google Slides.15 pages · 3.0 MBDownload
Free to use in your own training — please keep the PersonWise credit page at the end.
Have your own deck? Turn it into a course
Sources consulted
Web sources consulted while building this course.
- Architecting Applied AI–Driven Enterprise Analytics Platforms on Modern Data Warehouses — doi.org
- Looker: AI Business Intelligence & Embedded Analytics | Google Cloud — cloud.google.com
- Architecting Embedded Analytics for Performance (2026) - Omni Analytics — omni.co
- Building the agentic analytics stack: Fabric Analytics at Build 2026 | Microsoft Fabric Community — community.fabric.microsoft.com
- Modern Data Platforms: A Primer for Leaders | Bain & Company — bain.com
- 2026 Planning Guide for Analytics and Artificial Intelligence — emt.gartnerweb.com
- What analytics teams build, what end users need, and how AI is reshaping both — sisense.com
- Data, BI and Analytics Trend Monitor 2026 — pages.barc.de
- The future of analytics in the era of AI — capco.com
- Data Landscape 2026 Report: Data, AI & Analytics Trends You Can’t Miss — landing.bismart.com
- Machine Learning for Business Intelligence — teradata.com
- Zayo: Driving operational efficiency with analytics & AI — dataiku.com
- How Dialog Axiata used Amazon SageMaker to scale ML models in production with AI Factory and reduced customer churn within 3 months | Artificial Intelligence — aws.amazon.com
- SK Shieldus scales proactive security to protect client loyalty | Databricks — databricks.com
- A Tale of Two AIs: Using GenAI to Fuel Machine Learning Churn Models at Blend360 | CaseWorks — caseworks.business.columbia.edu
- FSB finalises sound practices for the responsible adoption of artificial intelligence (AI) - Financial Stability Board — fsb.org
- Agentic AI Risk-Management — cltc.berkeley.edu
- [2604.13767] Making AI Compliance Evidence Machine-Readable — ar5iv.labs.arxiv.org
- SP-045 AI Governance and Responsible AI — opensecurityarchitecture.org
- Model Governance/Ethics for GenAI Models – Practical Guide and Educational Handbook — soa.org