Statistics Software: Selection and Workflow
Begin
14 pages · ~28 min
Statistics Software: Selection and Workflow
This training helps data analysts and researchers select statistical software, define requirements, and build efficient analysis workflows.
What you’ll learn
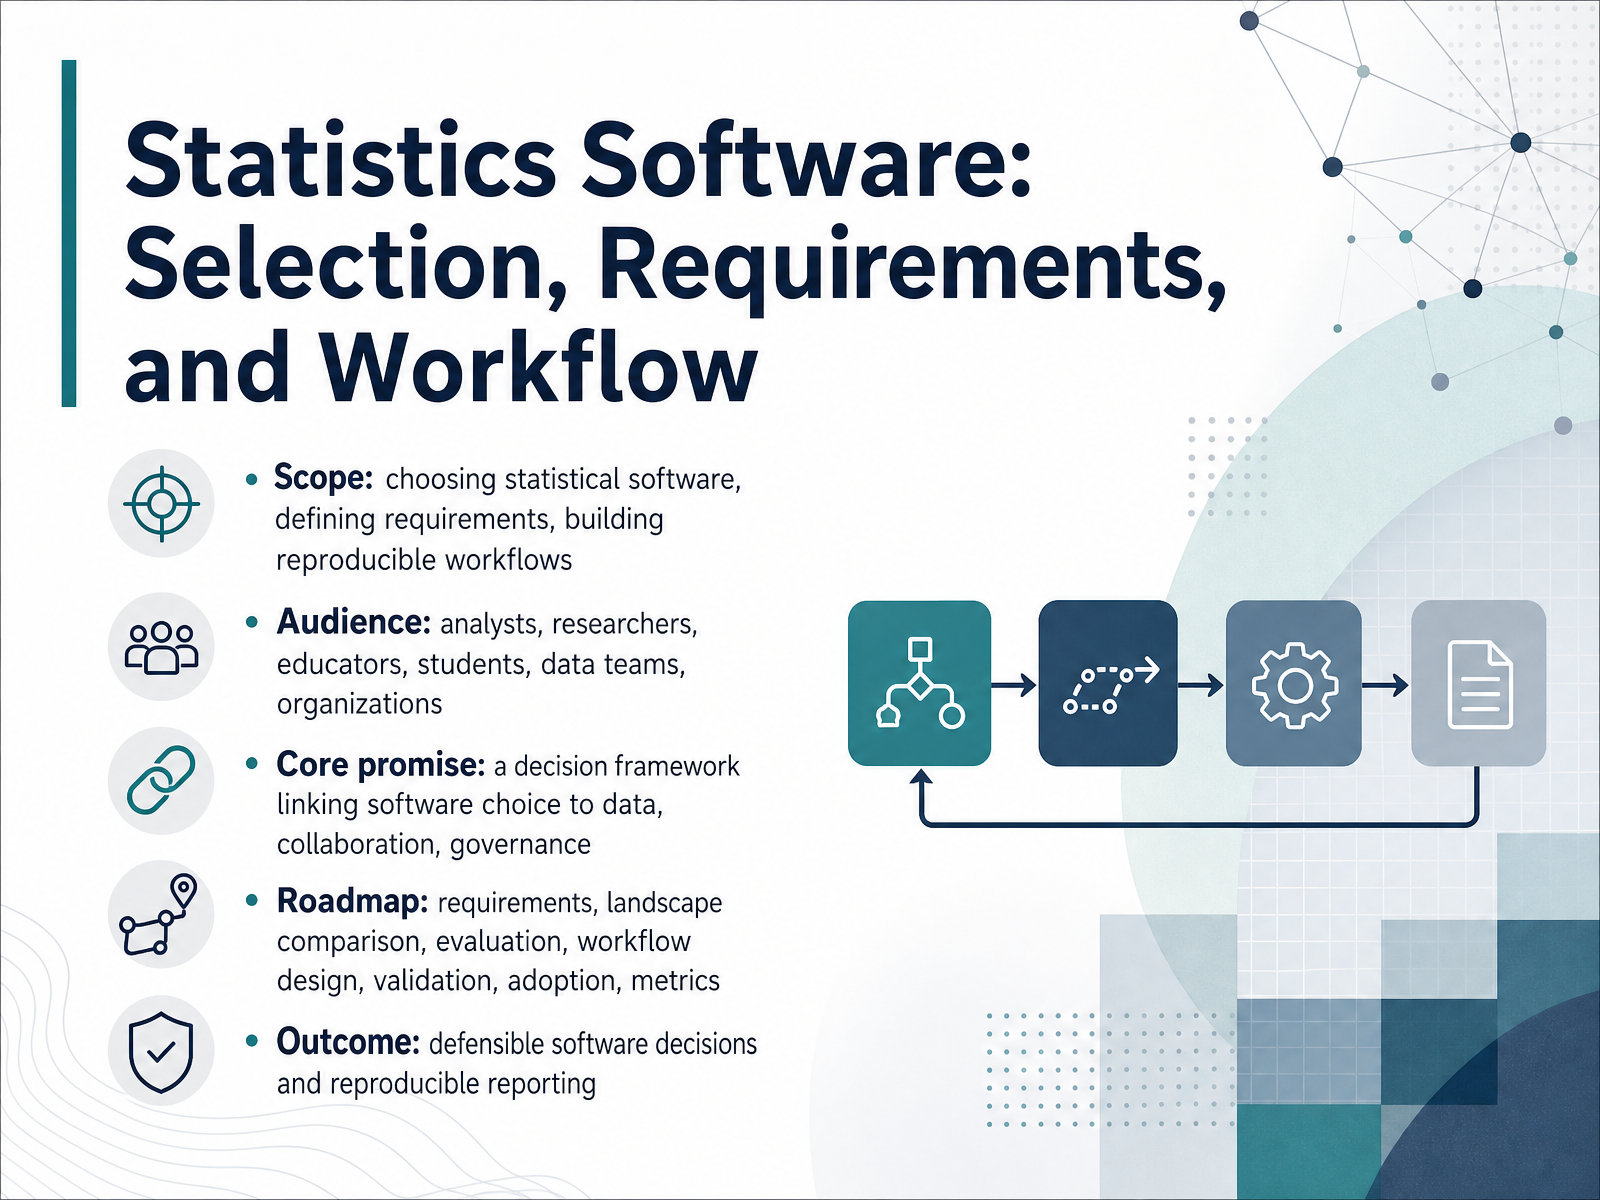
- 01Statistics Software: Selection, Requirements, and WorkflowWelcome. This course is about choosing statistical software, and about the requirements and workflows that make that choice hold up over time. Statistical software means any environment used to describe data, test hypotheses, and fit models. That includes open-source languages like R and Python, commercial packages like SPSS and SAS, and menu-driven tools in between. Our audience spans analysts, researchers, educators, students, data teams, and entire organizations. The core promise is a decision framework that links software choice to your data, your collaboration needs, and your governance rules. Over the next thirteen slides, we will move through requirements, compare the landscape, run an evaluation, design a reproducible workflow, then cover validation, adoption, and metrics. The outcome is defensible software decisions and reporting others can reproduce. A quick example: two packages can return the same result but differ in cost, skill required, and audit support. So we choose on fit, not habit. Start with Requirements, Not Feature Lists.querio.aidomystats.cominfinisynapse.com+22 min
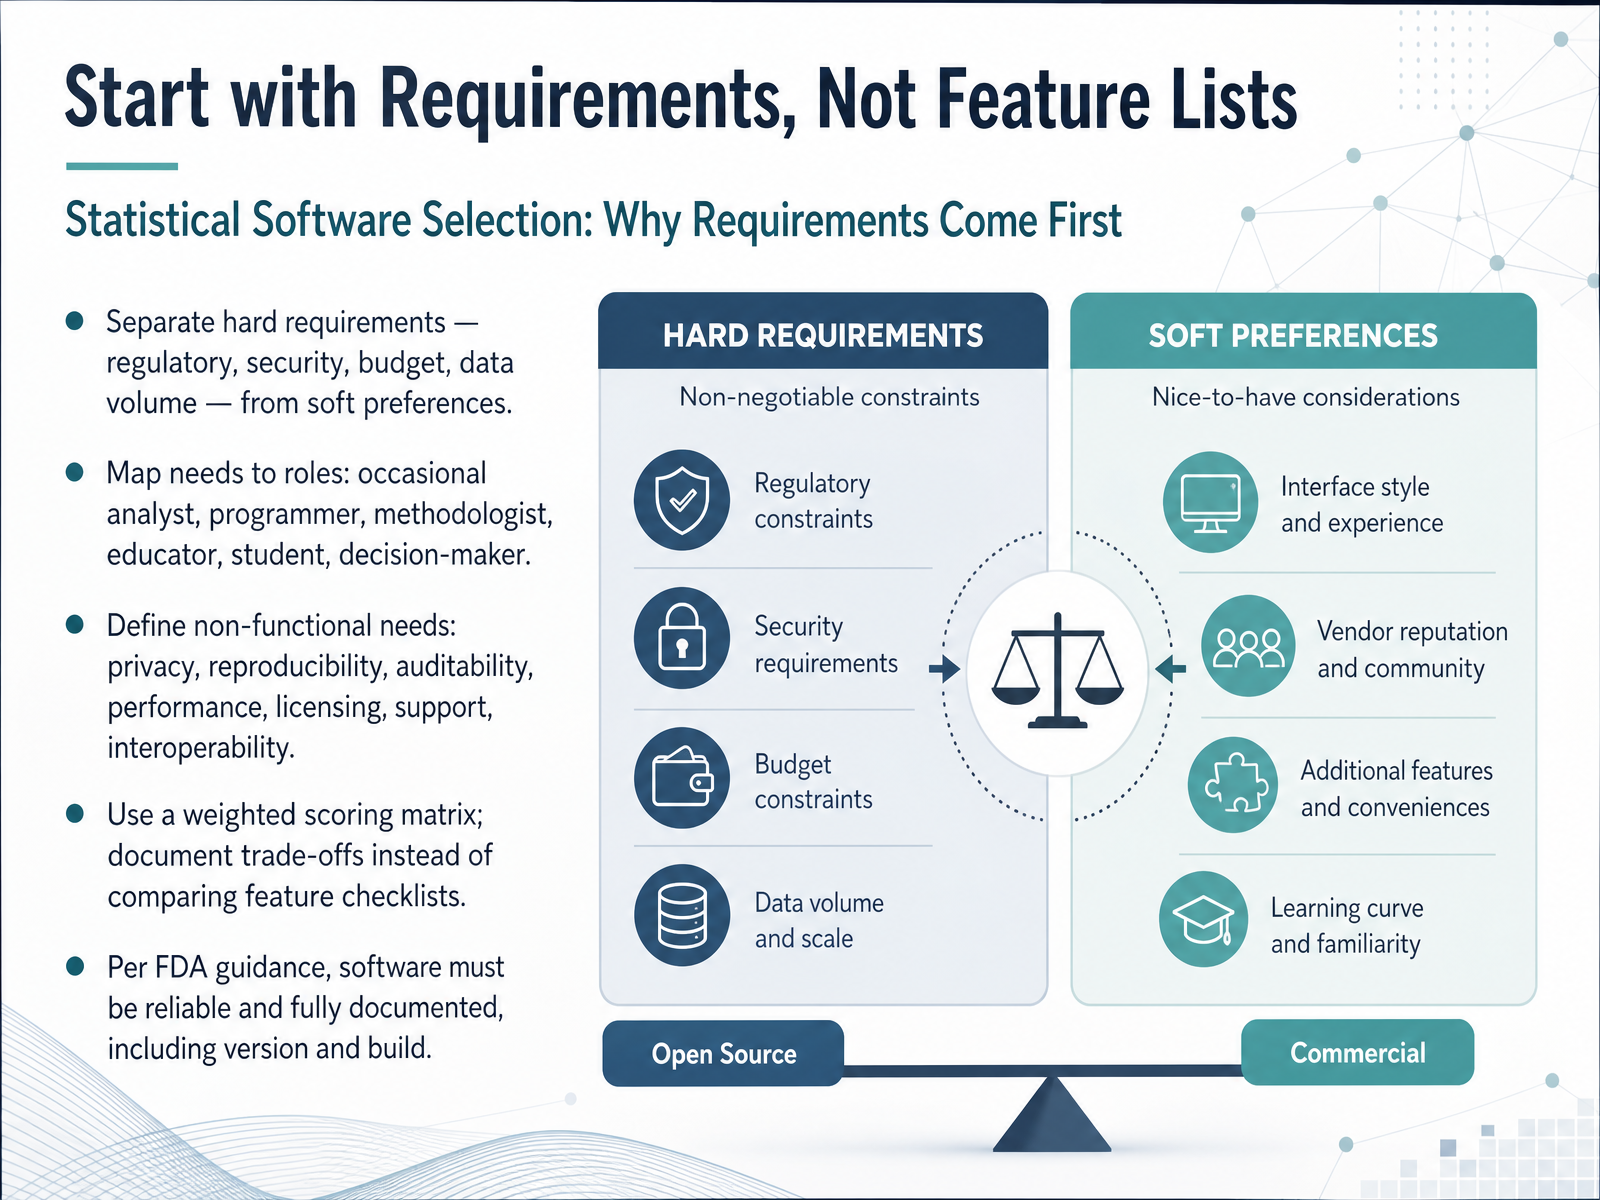
- 02Start with Requirements, Not Feature ListsLet's move on to the foundation of the whole selection process. Start with requirements, not feature lists. Before you compare tools, sort your needs into two groups. Hard requirements, such as regulatory, security, budget, or data volume limits, are non-negotiable. Soft preferences are nice to have. Next, map needs to roles. An occasional analyst needs something different from a programmer, a methodologist, an educator, a student, or a decision-maker. Then define your non-functional needs, like privacy, reproducibility, auditability, performance, licensing, support, and interoperability. A weighted scoring matrix works better here than a checklist, because it forces you to document trade-offs. One regulatory note worth remembering. Under FDA guidance, statistical software must be reliable and fully documented, including the version and build. So write requirements down early, and let them drive the decision. That naturally leads us into a decision framework for software selection.
 r-project.orgr-consortium.orgpharmasug.org+22 min
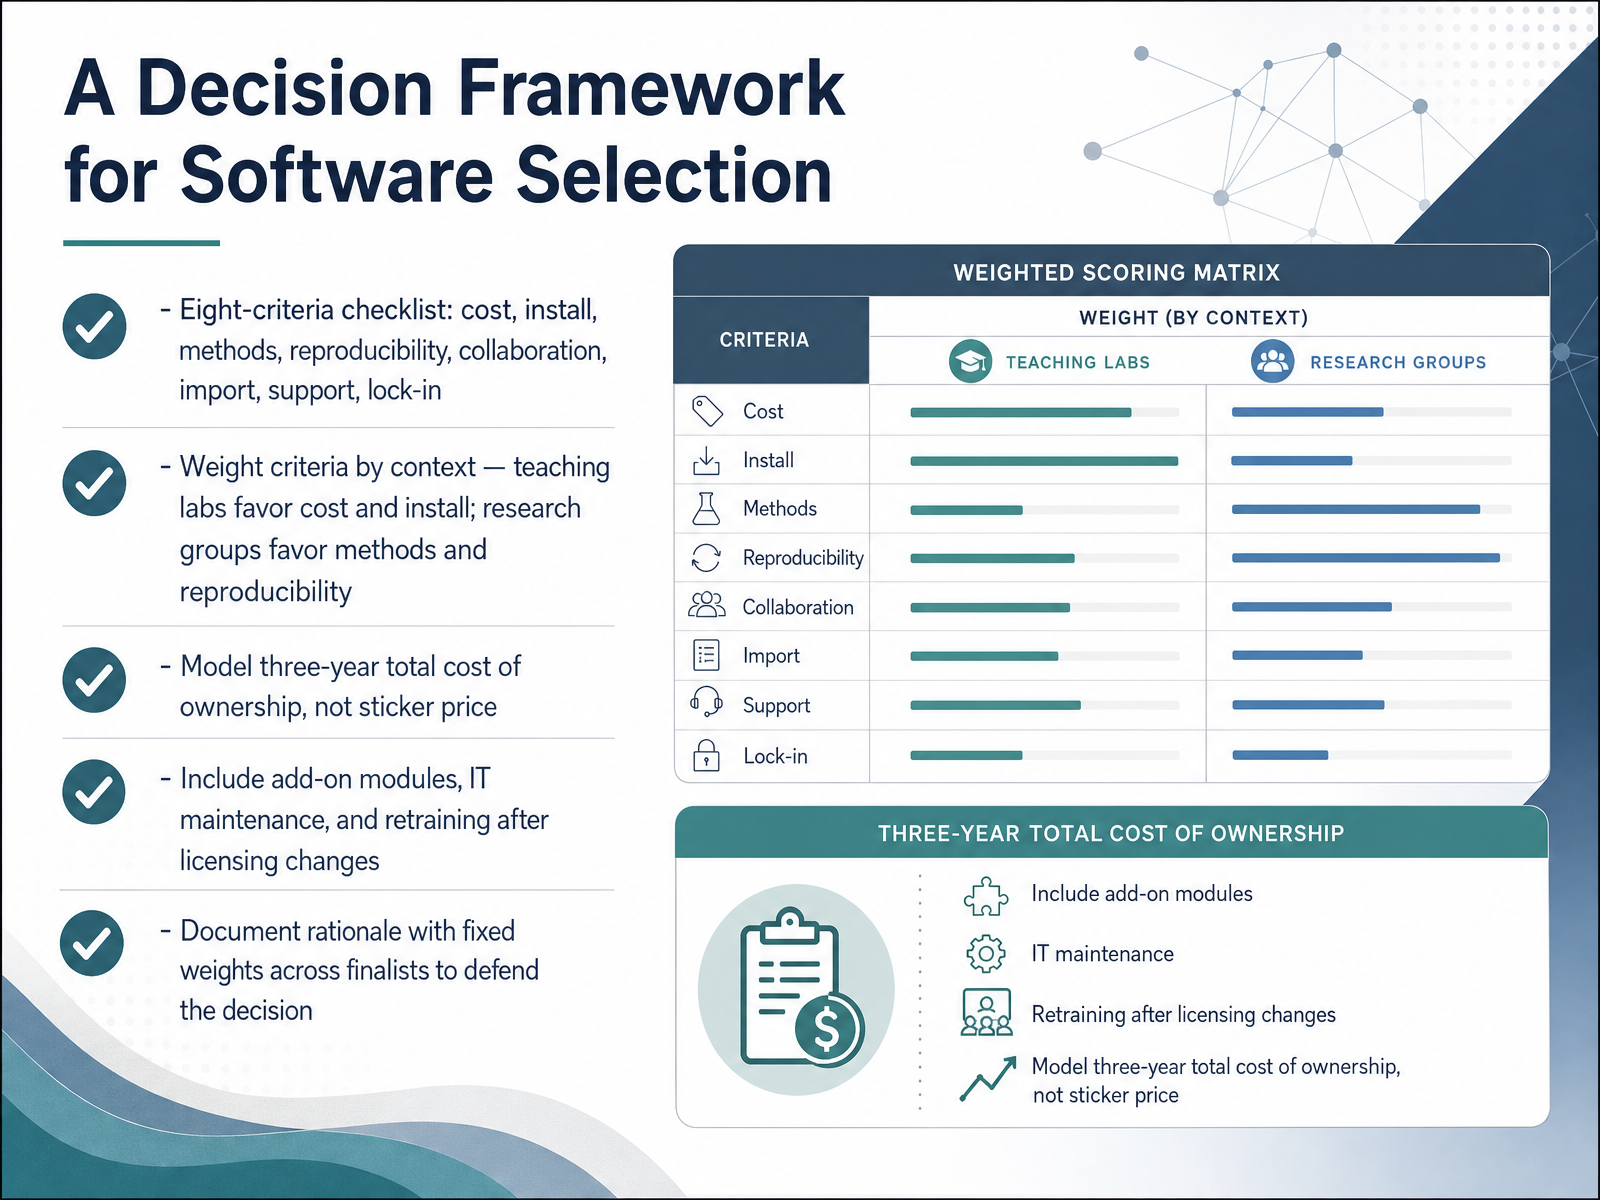
 - 03A Decision Framework for Software SelectionLet's turn to a decision framework for software selection. Start with a checklist of eight criteria. They are cost, install, methods, reproducibility, collaboration, data import, support, and lock-in. Lock-in means how easily you can export your data and results and leave. Next, weight each criterion for your context. A teaching lab should weigh cost and install heavily, while a research group should weigh methods and reproducibility. Keep the weights consistent for every finalist. Then model three-year total cost of ownership, not just the sticker price. Include add-on modules, IT maintenance hours, and retraining costs after licensing changes. Finally, document your rationale with fixed weights across all finalists. That written record is what defends the decision when a reviewer or budget owner asks why. Write down your weights before you score anything. That way the comparison stays honest and reproducible. Now let's look at the general-purpose statistical environments available to you.
 metricgate.comstatology.orgguideflow.com+21 min
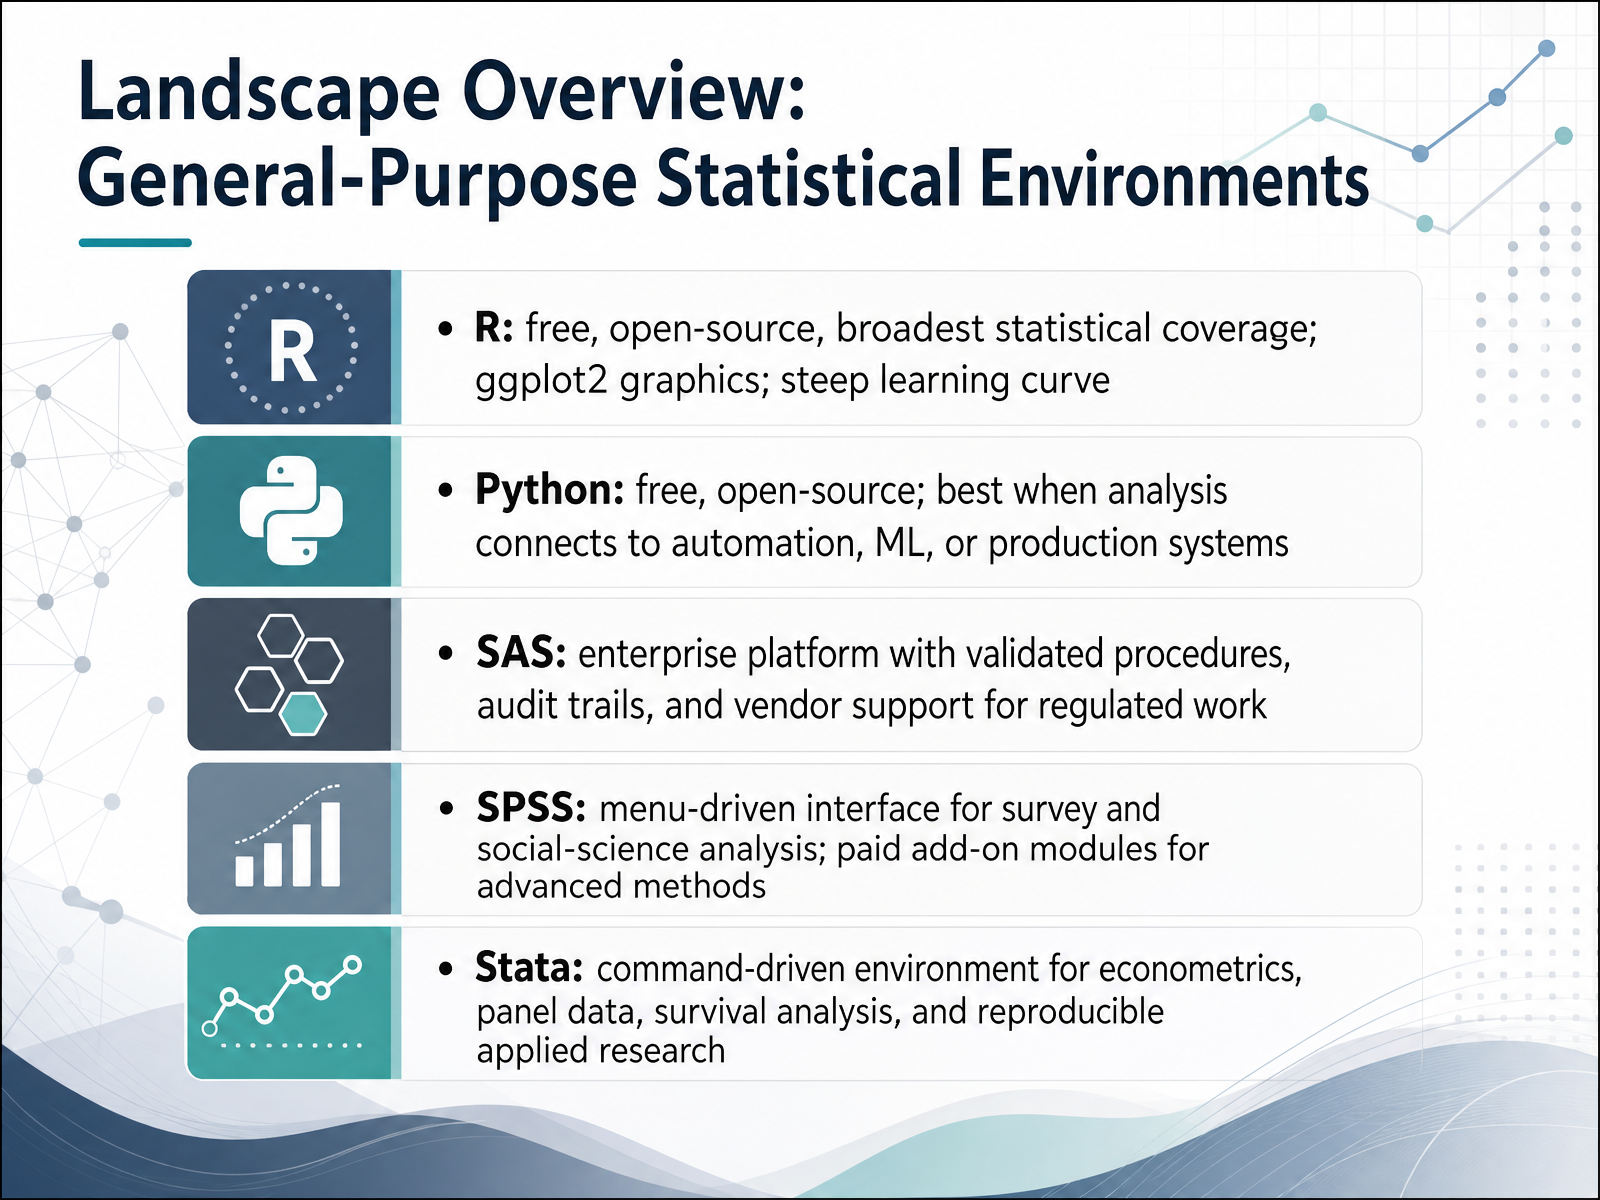
 - 04Landscape Overview: General-Purpose Statistical EnvironmentsLet's look at the landscape of general-purpose statistical environments. R is free and open-source, with the broadest statistical coverage of the group. Its ggplot2 package produces publication-quality graphics, but expect a steep learning curve. Python is also free and open-source. Choose it when your analysis connects to automation, machine learning, or production systems. SAS is an enterprise platform built around validated procedures, audit trails, and vendor support, which suits regulated work. SPSS offers a menu-driven interface for survey and social-science analysis, though advanced methods sit in paid add-on modules. Stata is command-driven, and it is a strong fit for econometrics, panel data, survival analysis, and reproducible applied research. So, the pattern to notice is this: R and Python trade a learning curve for flexibility and no license cost, while SAS, SPSS, and Stata trade license fees for structure, support, and established conventions. That pattern continues as we narrow in. Next, we examine specialized and GUI-first tools by analysis need.
 querio.aidomystats.cominfinisynapse.com+21 min
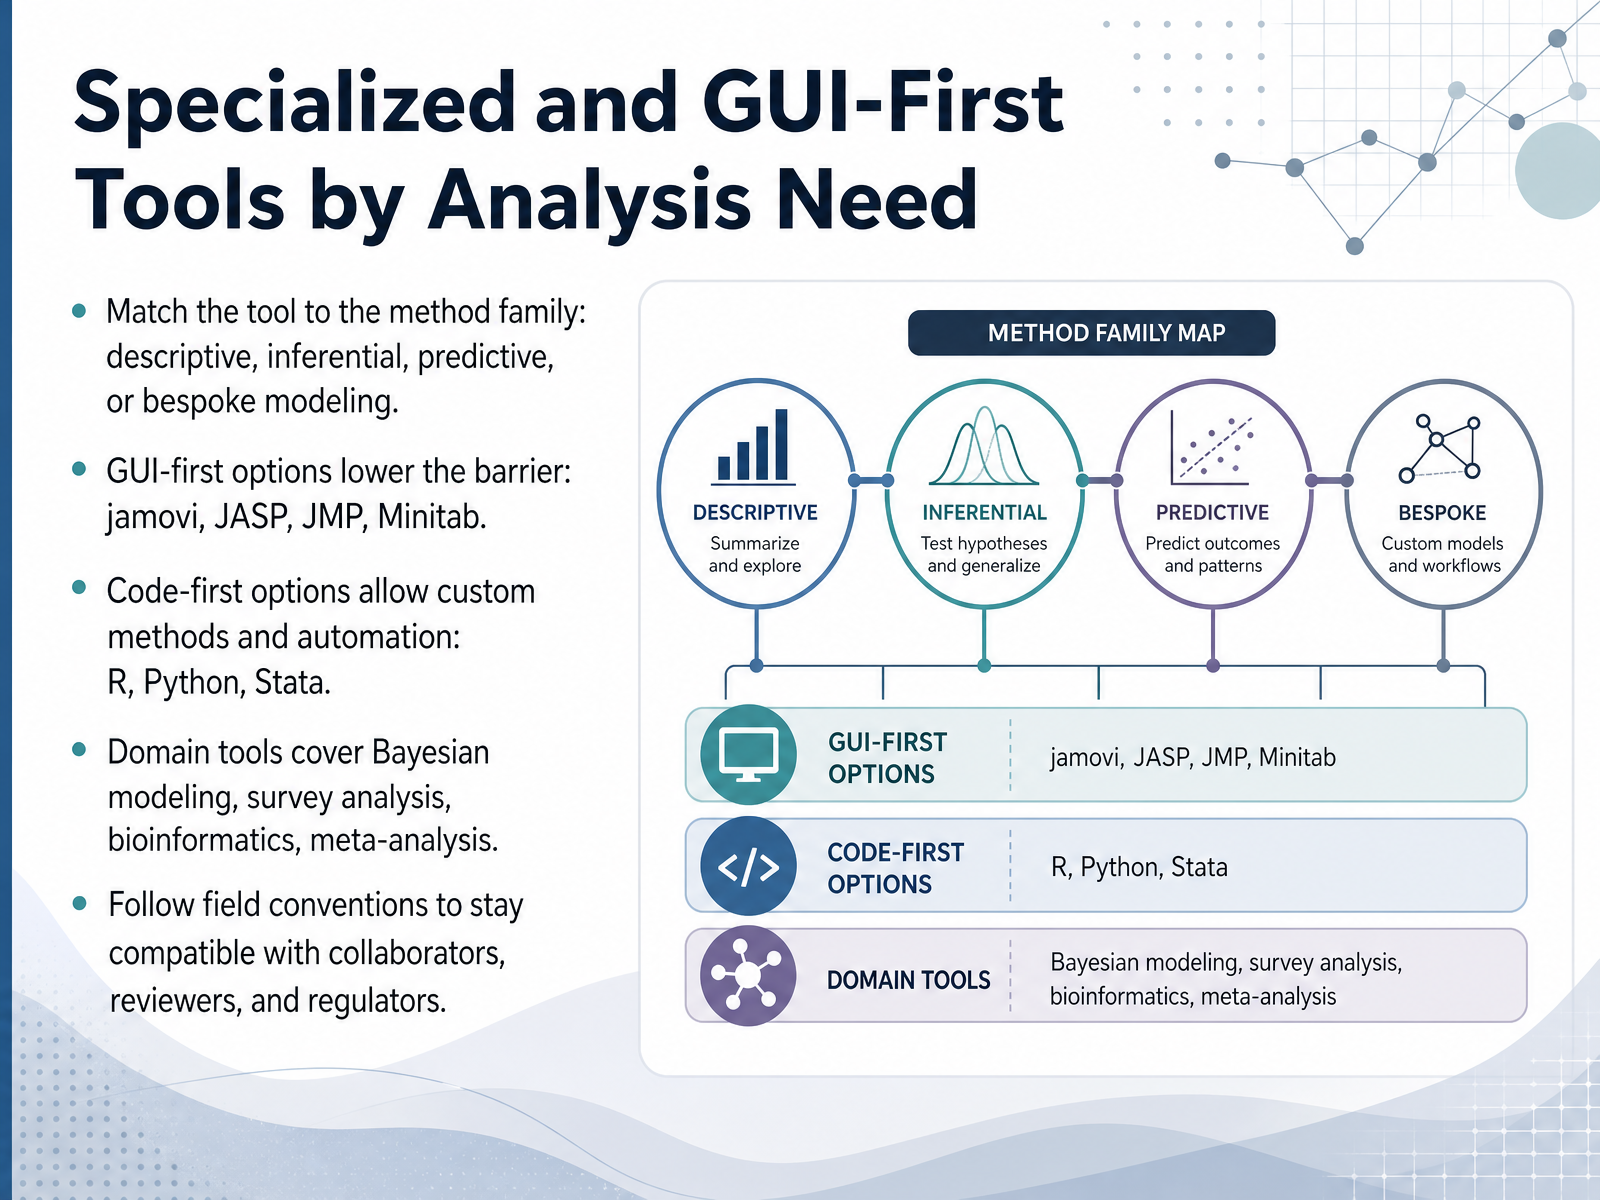
 - 05Specialized and GUI-First Tools by Analysis NeedNow, let's move from general selection criteria to specialized and GUI-first tools, grouped by the kind of analysis you actually need. First, match the tool to the method family. Descriptive work summarizes what happened. Inferential work tests whether a pattern is real or just chance. Predictive work forecasts what happens next. Bespoke modeling covers custom or novel methods. Next, consider interface. GUI-first options lower the barrier because you work through menus rather than code. Examples include jamovi, JASP, JMP, and Minitab. They are fast to learn, and some record your menu clicks as runnable syntax, which supports reproducibility. Code-first options, such as R, Python, and Stata, allow custom methods and automation, but they require programming skill. Then there are domain tools. Specialized packages cover Bayesian modeling, survey analysis, bioinformatics, and meta-analysis. Here is a practical example. In genomics, R with Bioconductor is a common convention. In survey research, Stata or R survey packages are widely used. Finally, follow your field's conventions. That keeps your work compatible with collaborators, reviewers, and regulators. As a takeaway, choose the interface that fits your team's skills, but let the method family and field standards drive the final decision. Next, we will look at open source versus commercial trade-offs.
 querio.aidomystats.cominfinisynapse.com+22 min
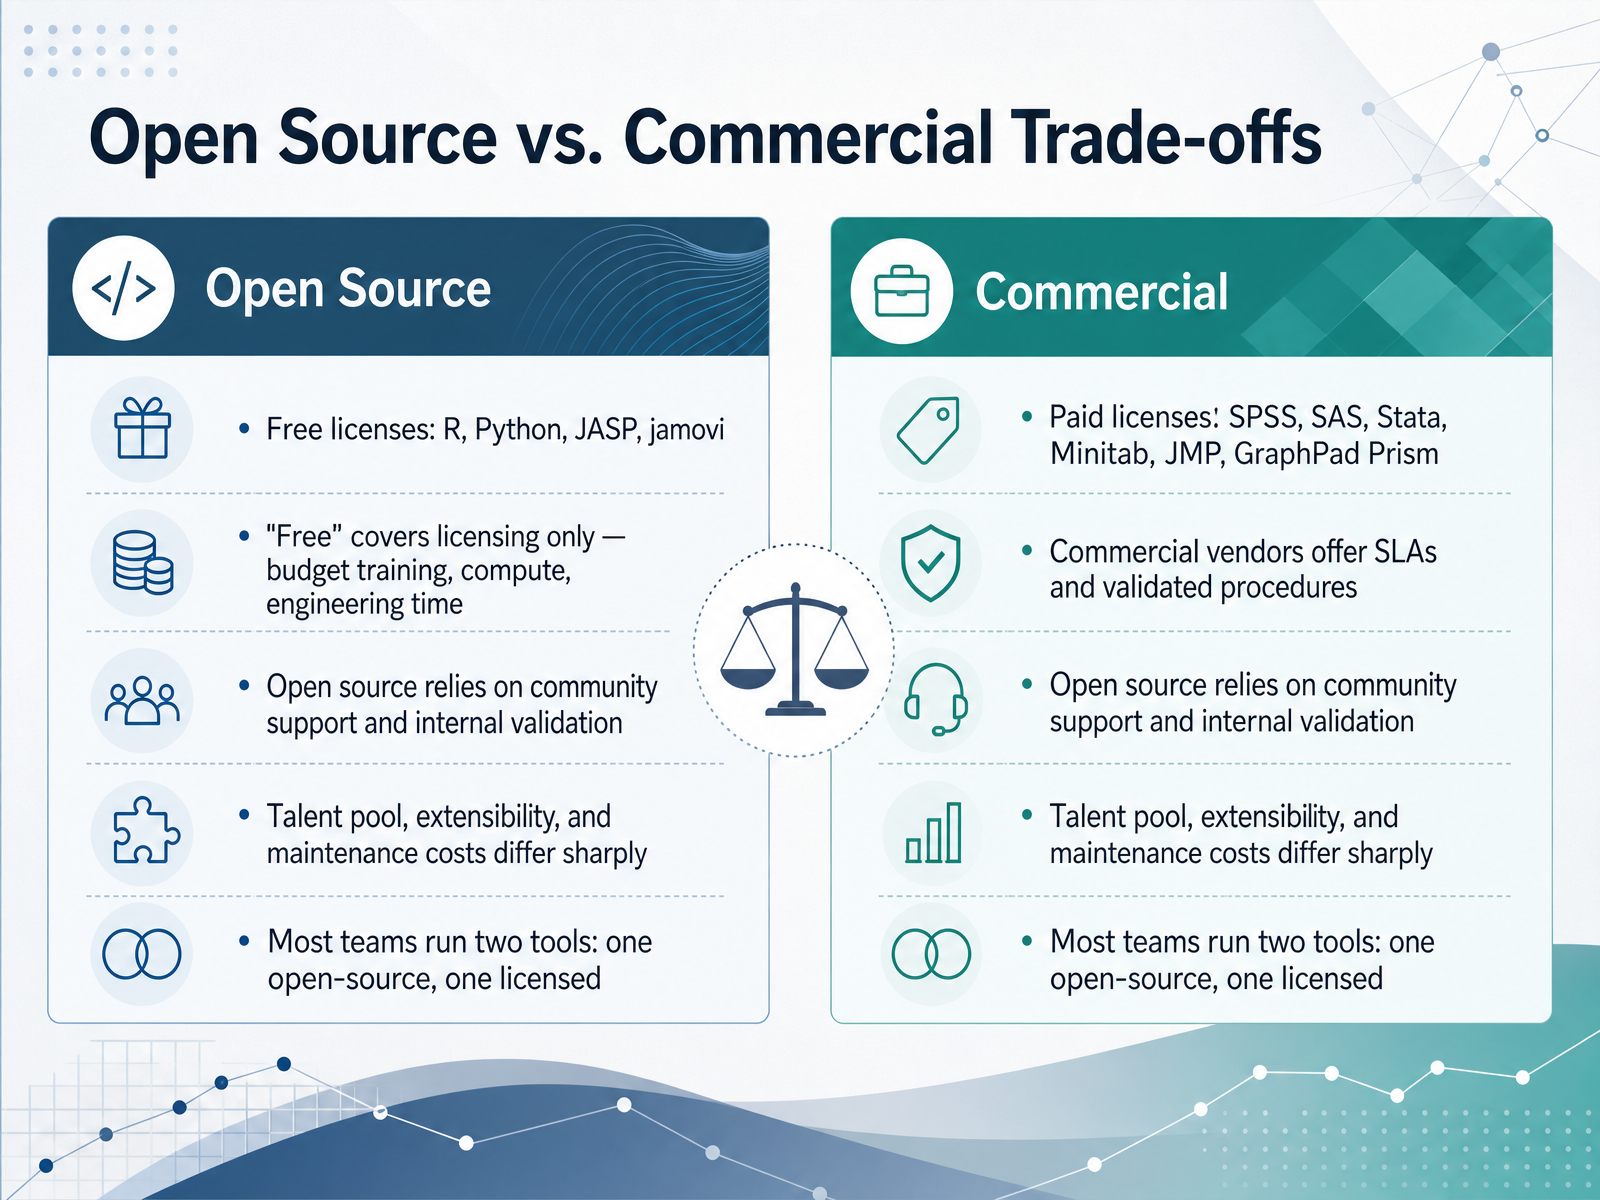
 - 06Open Source vs. Commercial Trade-offsNow let's weigh open source against commercial statistical software. Open source tools such as R, Python, JASP, and jamovi are free to license. Paid options include SPSS, SAS, Stata, Minitab, JMP, and GraphPad Prism. But here is the key distinction. Free refers to licensing only. You still budget for training, computing power, and engineering time. Commercial vendors typically offer service-level agreements and validated procedures, which matters in regulated work. Open source depends on community support and your own internal validation. Before choosing, compare the talent pool, extensibility, and maintenance cost. In practice, most teams run two tools: one open source for flexibility, one licensed for support.
 1 min
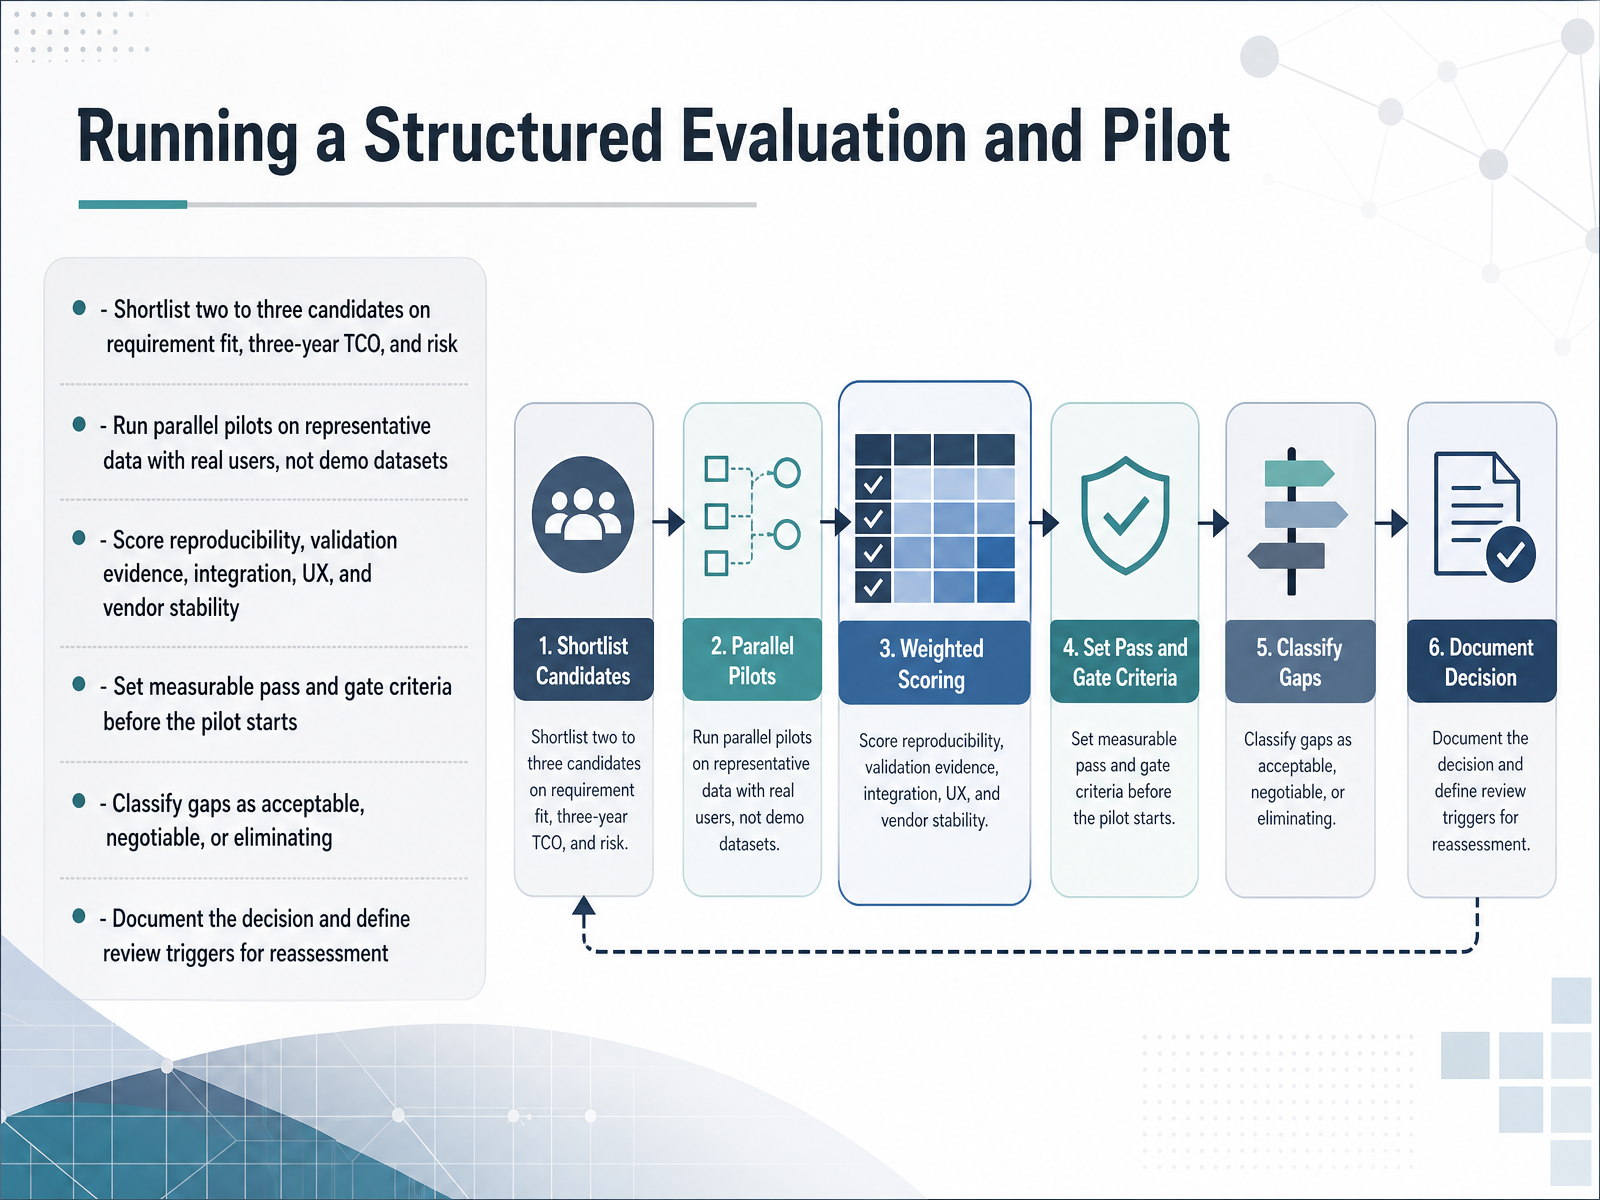
1 min - 07Running a Structured Evaluation and PilotNow let's walk through running a structured evaluation and pilot. Start by shortlisting two to three candidates. Judge them on three things: how well they fit your stated requirements, the total cost of ownership over three years, and overall risk. Next, run parallel pilots. That means testing each candidate at the same time, on your own representative data, with the real users who will use the tool day to day. Not vendor demo datasets. As you pilot, score each option on reproducibility, validation evidence, integration, user experience, and vendor stability. Before the pilot starts, set measurable pass and gate criteria. A gate is a non-negotiable threshold. If a gate fails, the vendor is out. Then classify any gaps into three buckets: acceptable, negotiable, or eliminating. Finally, document the decision and define review triggers, so you know when to reassess. That gives you a defensible, evidence-based choice. Let's move on to validation and regulatory considerations.
 databricks.comdataarchitect.coumbrex.com+22 min
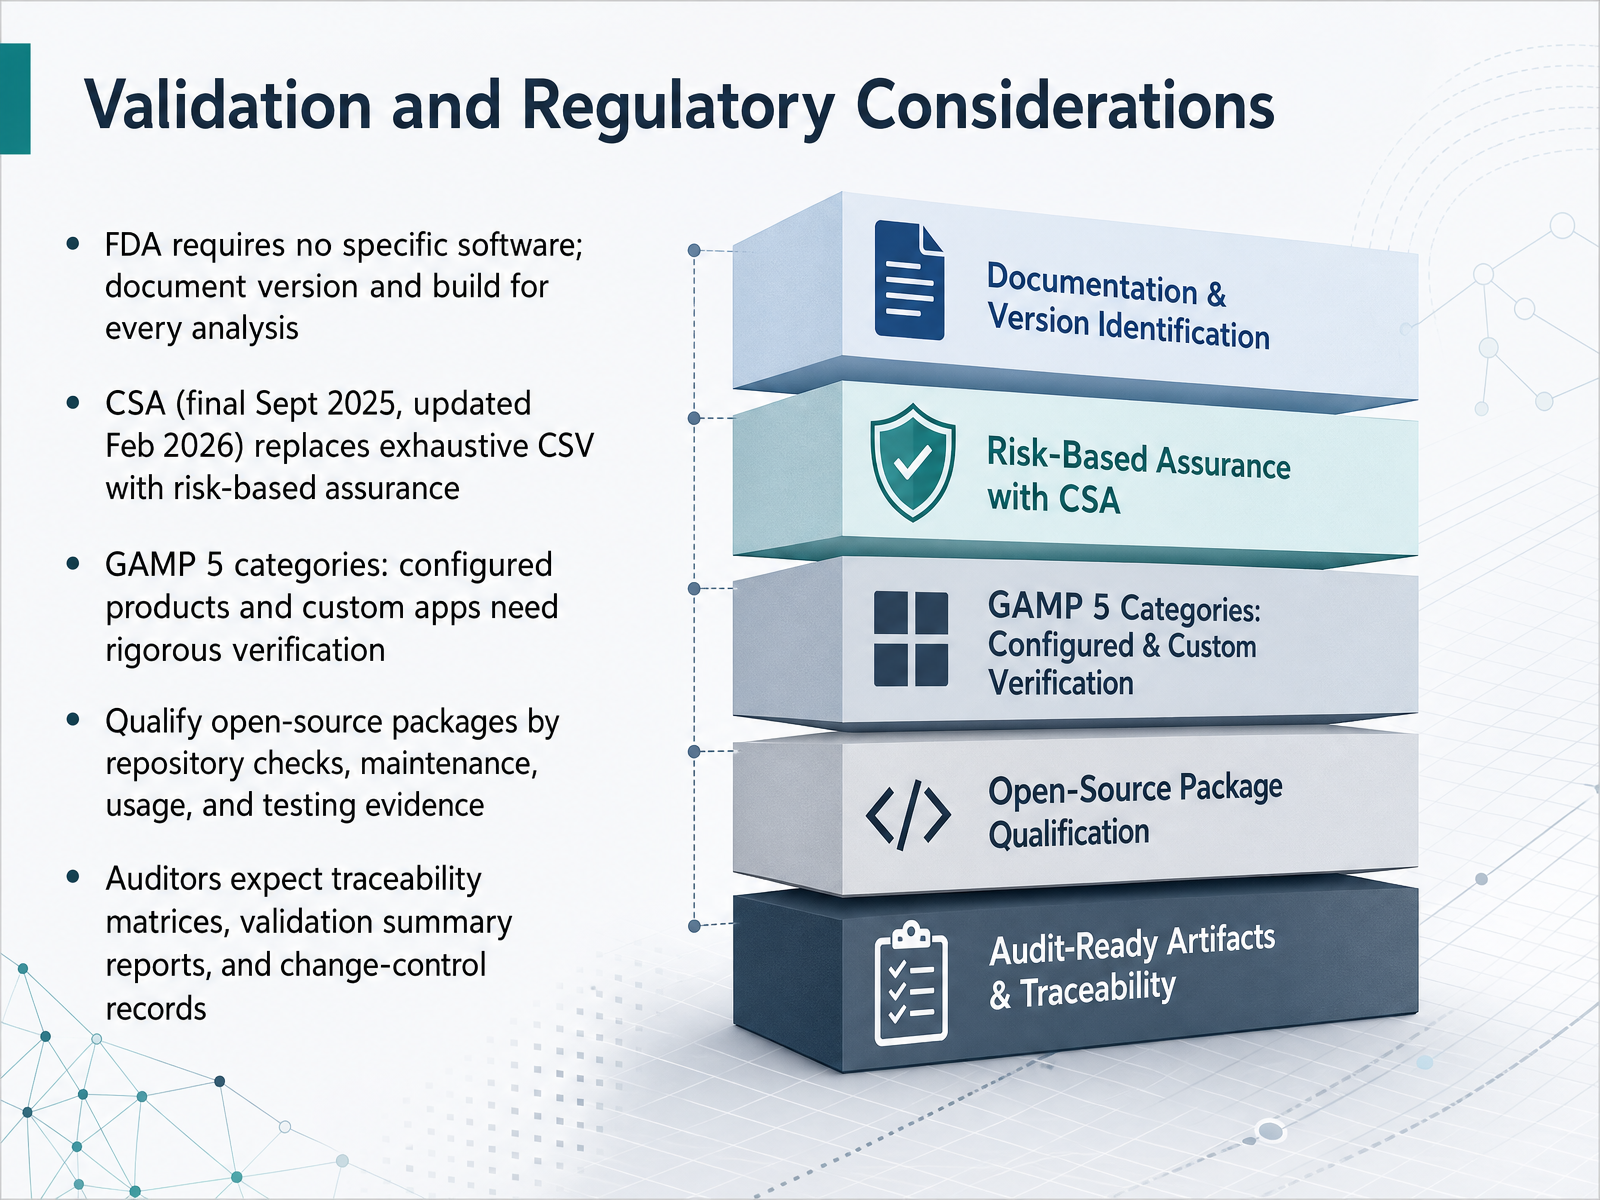
 - 08Validation and Regulatory ConsiderationsNow let us look at validation and regulatory considerations, and what they require of your software choices. First, the FDA does not require any specific statistical software. But you must fully document the package, including version and build identification, for every analysis. Second, Computer Software Assurance, or CSA, finalized in September 2025 and updated in February 2026, replaces exhaustive documentation with risk-based assurance. In plain terms, you focus your testing where failure could affect product quality, patient safety, or data integrity. Third, GAMP 5 categories matter. Configured products and custom applications need rigorous verification, while infrastructure and standard components need less. Fourth, open-source packages must be qualified. Check the repository, maintenance activity, usage, and testing evidence. Finally, be ready for audits. Auditors expect traceability matrices, validation summary reports, and change-control records. The takeaway is simple: match your validation effort to the risk, and keep the evidence. Next, we turn to Workflow Pattern: Project Structure and Reproducible Reporting.
 r-project.orgr-consortium.orgpharmasug.org+22 min
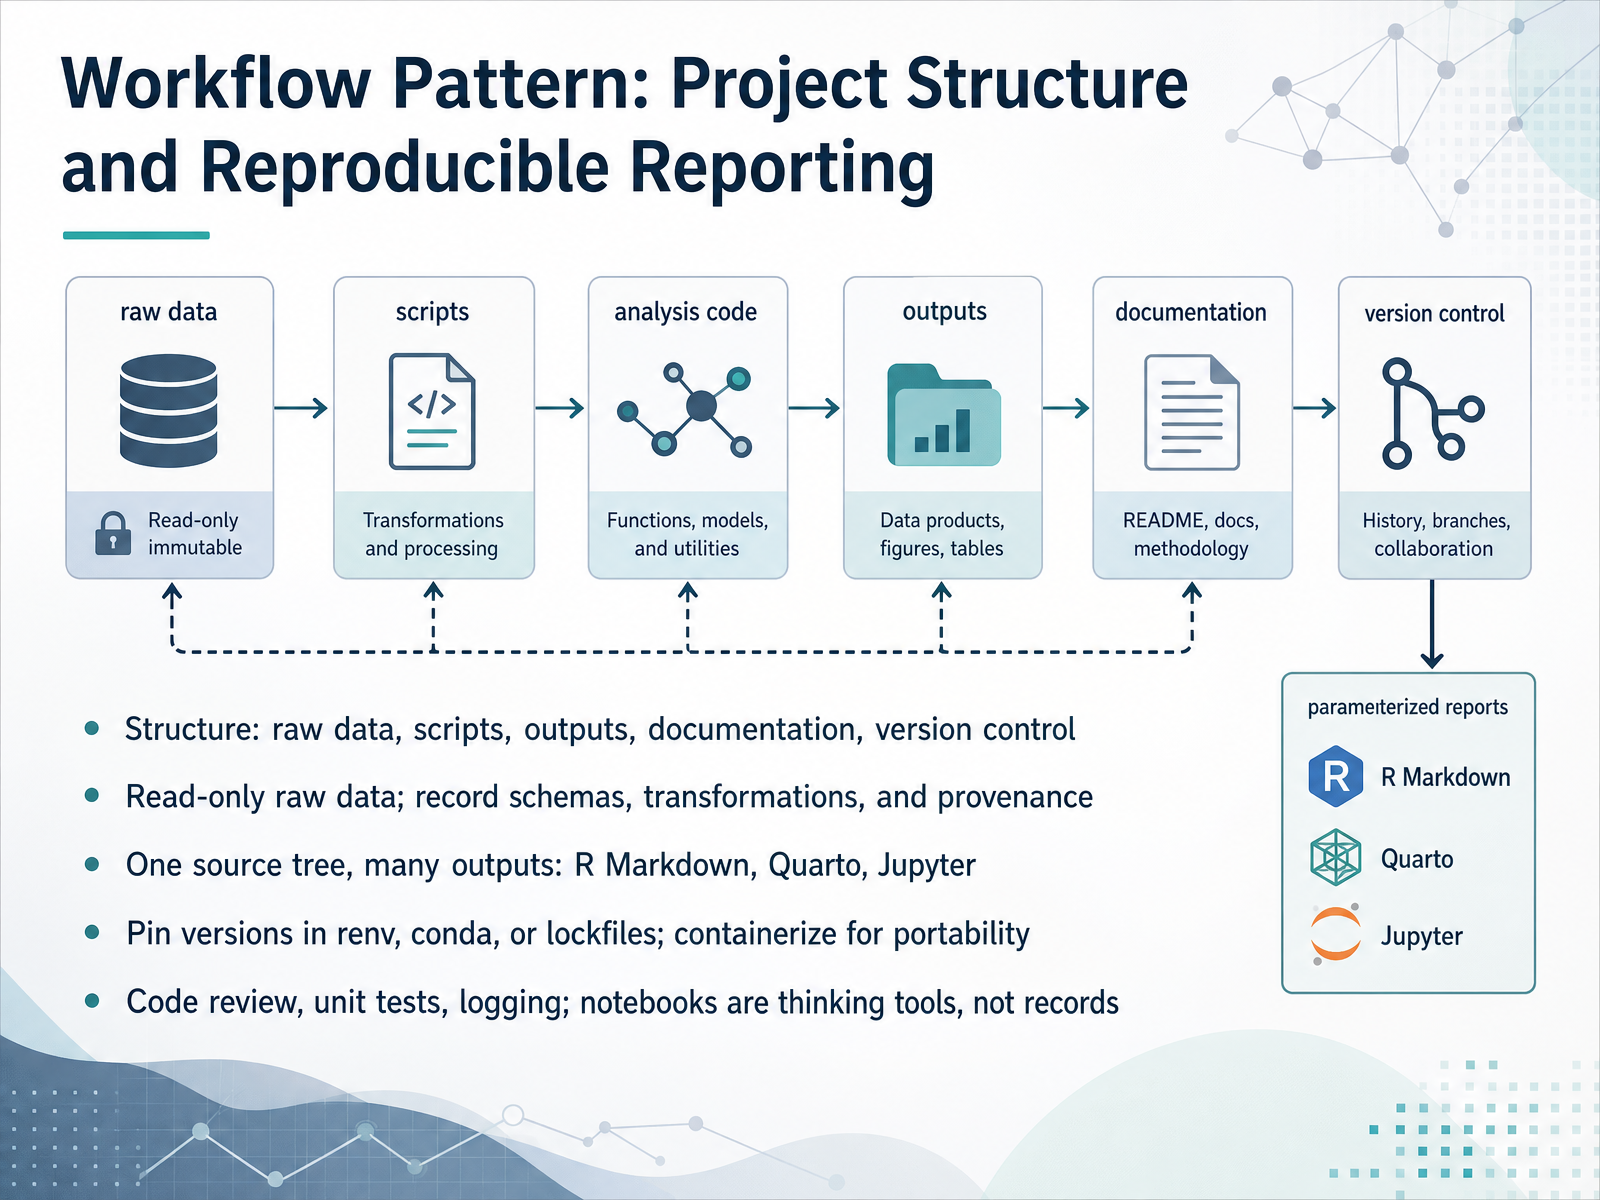
 - 09Workflow Pattern: Project Structure and Reproducible ReportingLet's look at a concrete workflow pattern for project structure and reproducible reporting. Start with five parts: raw data, scripts, outputs, documentation, and version control. Within that structure, treat raw data as read-only. Never edit it by hand. Instead, record schemas, transformations, and provenance, meaning where each dataset came from and what was done to it. Next, keep one source tree that produces many outputs. R Markdown, Quarto, and Jupyter all let you generate reports from the same underlying code. To protect that code over time, pin exact versions with renv, conda, or a lockfile, and containerize for portability. Version pinning means writing down the exact package versions your analysis used, so it behaves the same next year. Finally, require code review, unit tests, and logging. Treat notebooks as thinking tools, not as your system of record. That structure is what makes results repeatable. Next, we go deeper into reproducibility infrastructure: environment, data, and provenance.
 2 min
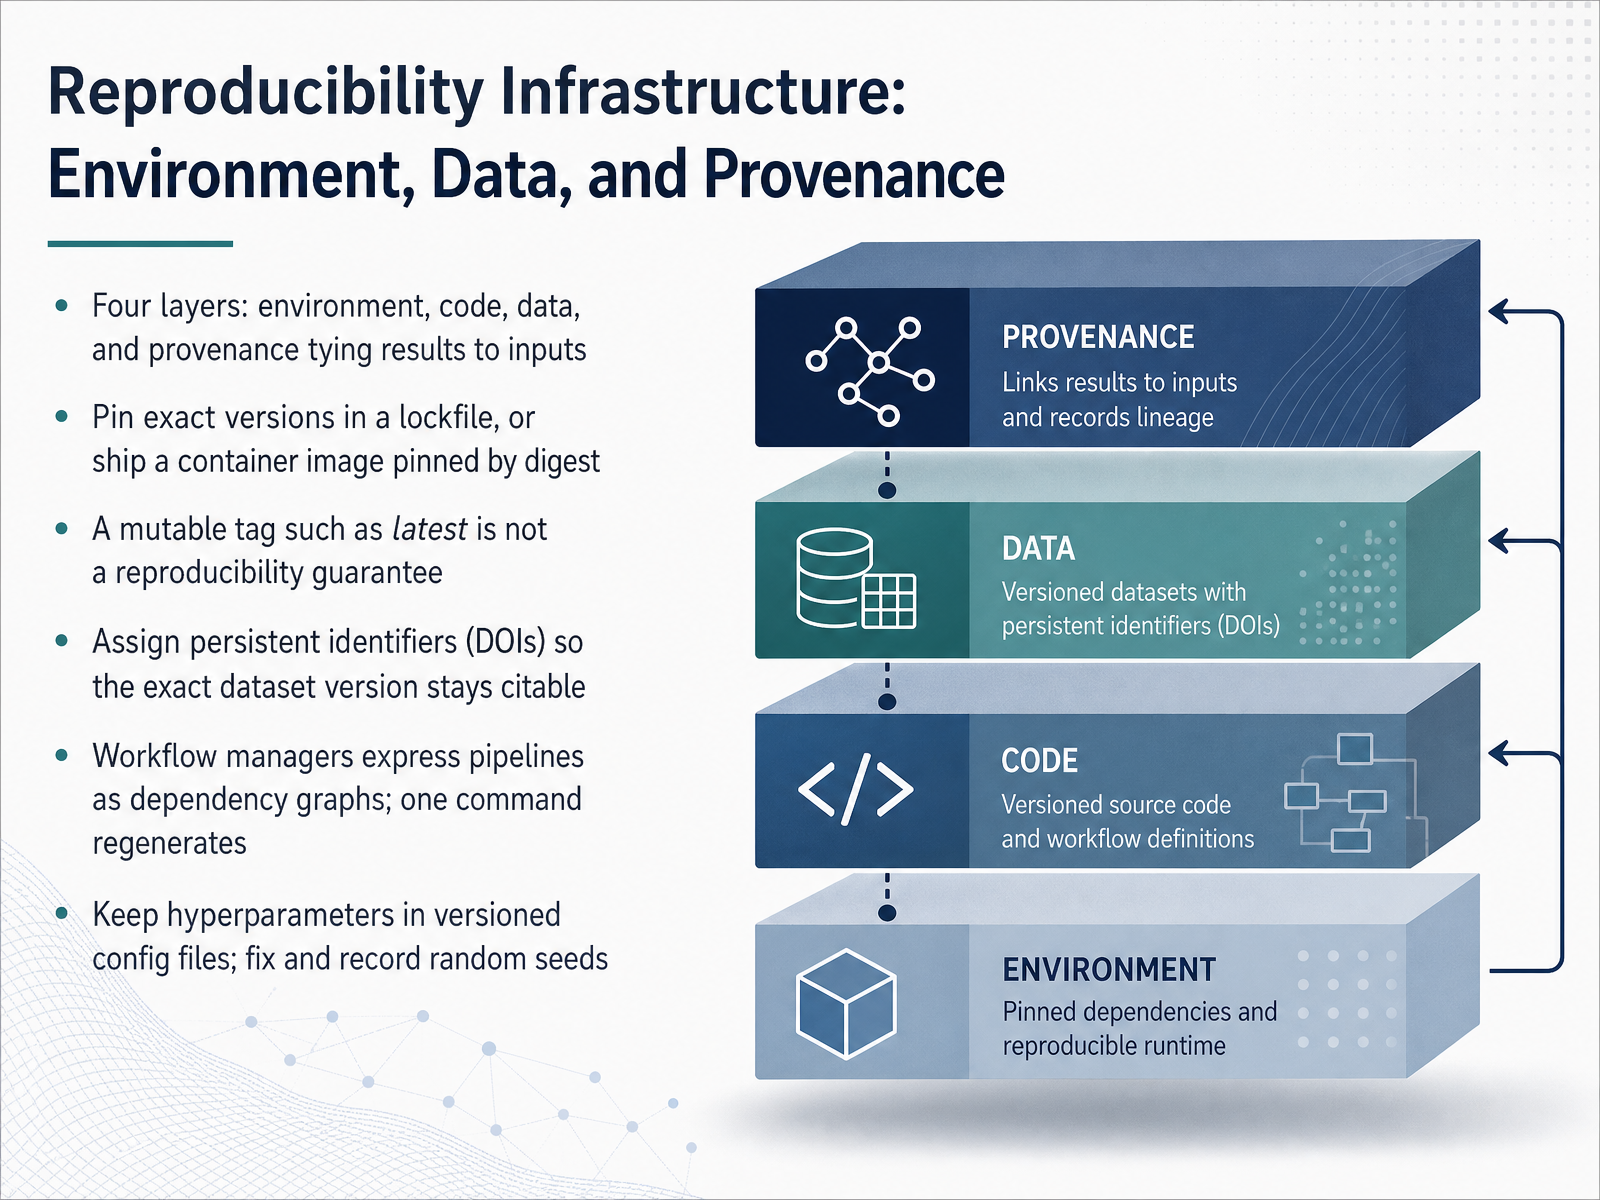
2 min - 10Reproducibility Infrastructure: Environment, Data, and ProvenanceNow let's look at what makes reproducibility infrastructure hold together. Think of it as four layers: the environment, the code, the data, and provenance. Provenance means the record that ties a specific result back to the exact inputs that produced it.
Start with the environment. Pin exact versions in a lockfile, or ship a container image pinned by content digest. A mutable tag such as latest is not a reproducibility guarantee, because it can be repointed later. If you need a plain example, a lockfile says version two point three point one, not version two or later.
Next, data. Assign persistent identifiers, such as DOIs, so the exact dataset version stays citable long after the project ends. Then, automate the pipeline. Workflow managers express your pipeline as a dependency graph, so one command regenerates results from raw inputs.
Finally, control the settings. Keep hyperparameters in versioned config files, and fix and record your random seeds. Together, these layers turn a one-time result into something another analyst can rebuild with confidence.
Next, we move on to collaboration, governance, and scaling.
 2 min
2 min - 11Collaboration, Governance, and ScalingNow let's look at collaboration, governance, and scaling. These are the requirements that decide whether a working analysis survives contact with a real organization.
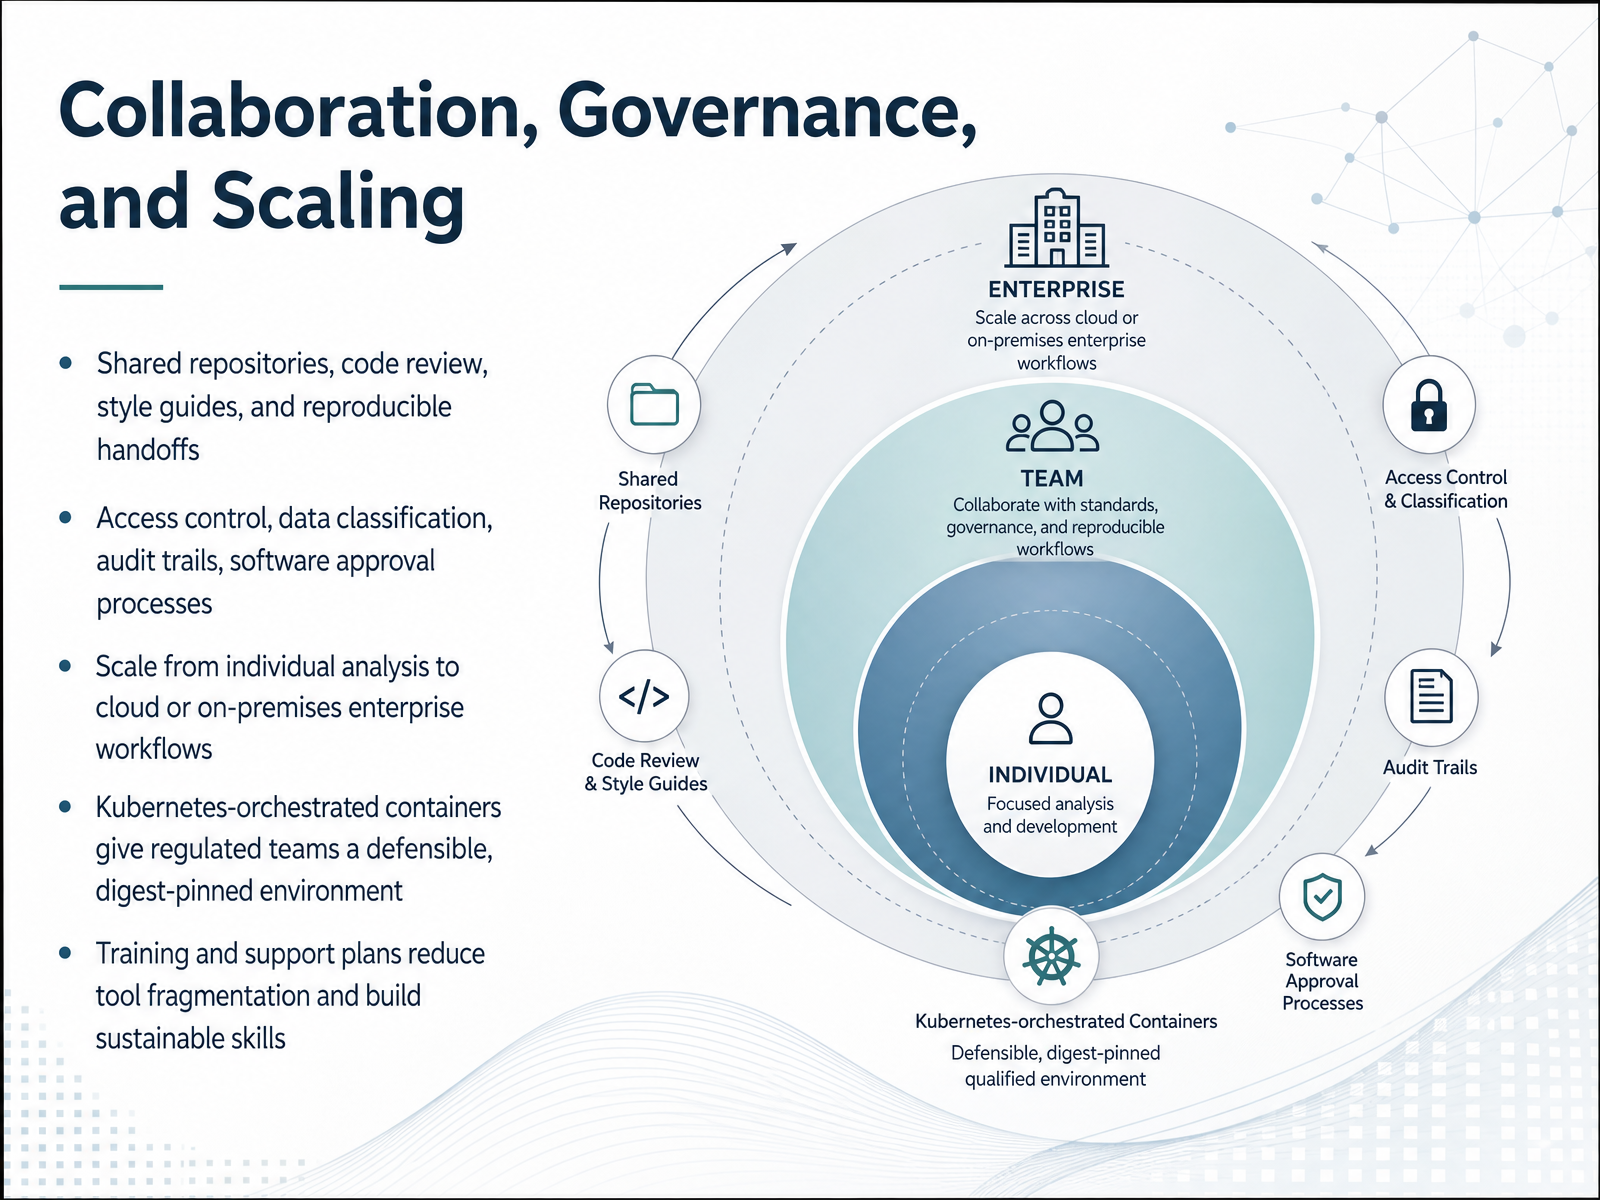
Start with collaboration. Shared repositories hold the code, and code review means a second person reads it before it becomes official. Style guides keep that review focused on logic rather than formatting. The goal is a reproducible handoff: a colleague can rerun your analysis and get the same numbers.
Governance covers access control, data classification, and audit trails. Simply put, who may touch which data, how sensitive that data is, and a record of what was done. Software approval processes formalize this, so teams do not adopt tools informally.
Scaling follows the same logic. An individual analysis may run on a laptop. An enterprise workflow runs in the cloud or on premises. For regulated teams, Kubernetes-orchestrated containers add a defensible layer: image digests are pinned, so the environment that ran is the environment that was approved.
Finally, invest in training and support. They reduce tool fragmentation and build skills that last.
Next, we turn to adoption planning and measuring success.
 2 min
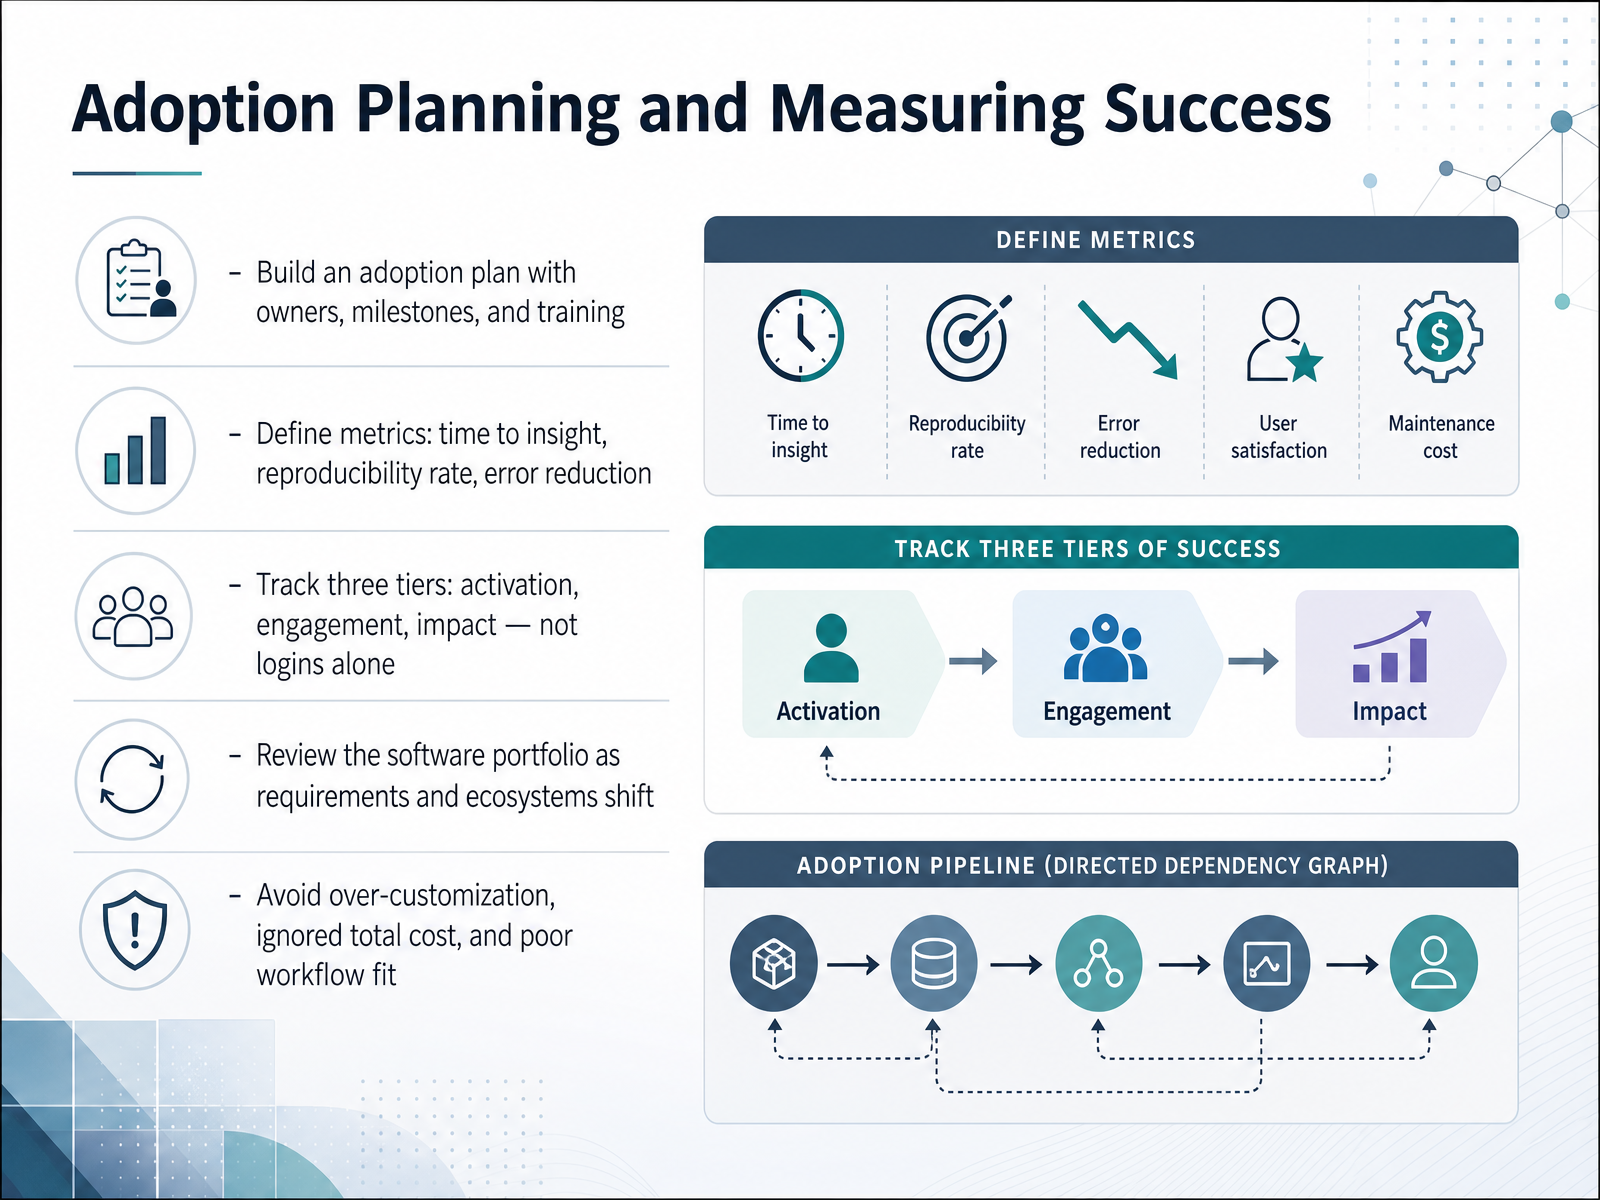
2 min - 12Adoption Planning and Measuring SuccessLet's turn now to adoption planning and measuring success. A plan needs owners, milestones, and training, not just a license purchase. Then define metrics that matter: time to insight, reproducibility rate, and error reduction. Track adoption in three tiers: activation, meaning users start; engagement, meaning they keep coming back; and impact, meaning decisions actually change. Logins alone tell you very little. Review the portfolio regularly, because requirements and ecosystems shift. And watch for three common pitfalls: over-customization, ignored total cost, and poor workflow fit. Next, we put it into practice. Practical Exercise: Requirements to Workflow.
 1 min
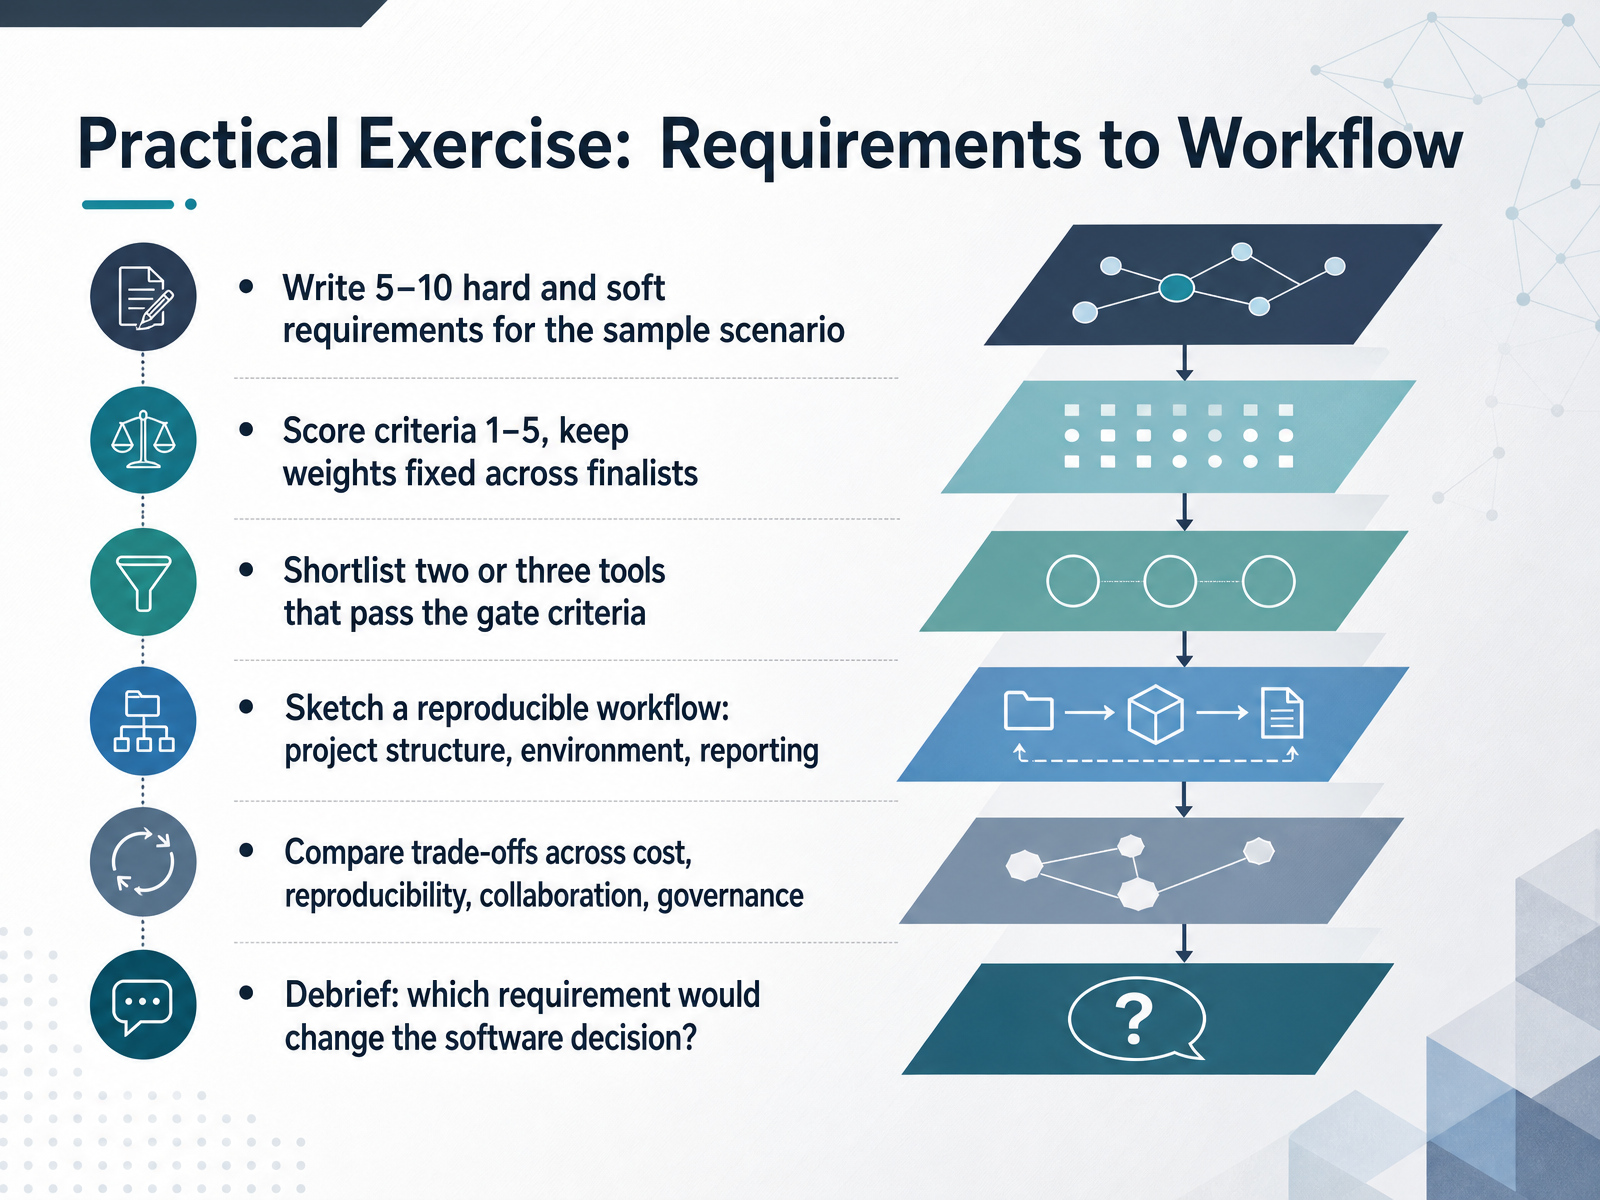
1 min - 13Practical Exercise: Requirements to WorkflowNow let us put the framework into practice. In this exercise, you turn requirements into a working workflow. Start by writing five to ten requirements for your sample scenario. Separate hard requirements, the gate criteria you cannot compromise on, from soft requirements, the ones you can trade off. Next, score each candidate from one to five on every criterion, and keep the weights fixed across all finalists. Write down why each weight was chosen, because that rationale protects your decision later. Then shortlist two or three tools that pass the gate criteria. With your shortlist ready, sketch a reproducible workflow. Cover three things: project structure, the environment, and reporting. For example, keep raw data read-only, pin your package versions, and generate tables and figures from a single script. Finally, compare trade-offs across cost, reproducibility, collaboration, and governance. Then debrief as a group: which single requirement, if it changed, would flip your software decision? That question reveals what truly drives your choice. In our final segment, we will pull these ideas together in Key Takeaways and Next Steps.
 metricgate.comstatology.orgguideflow.com+22 min
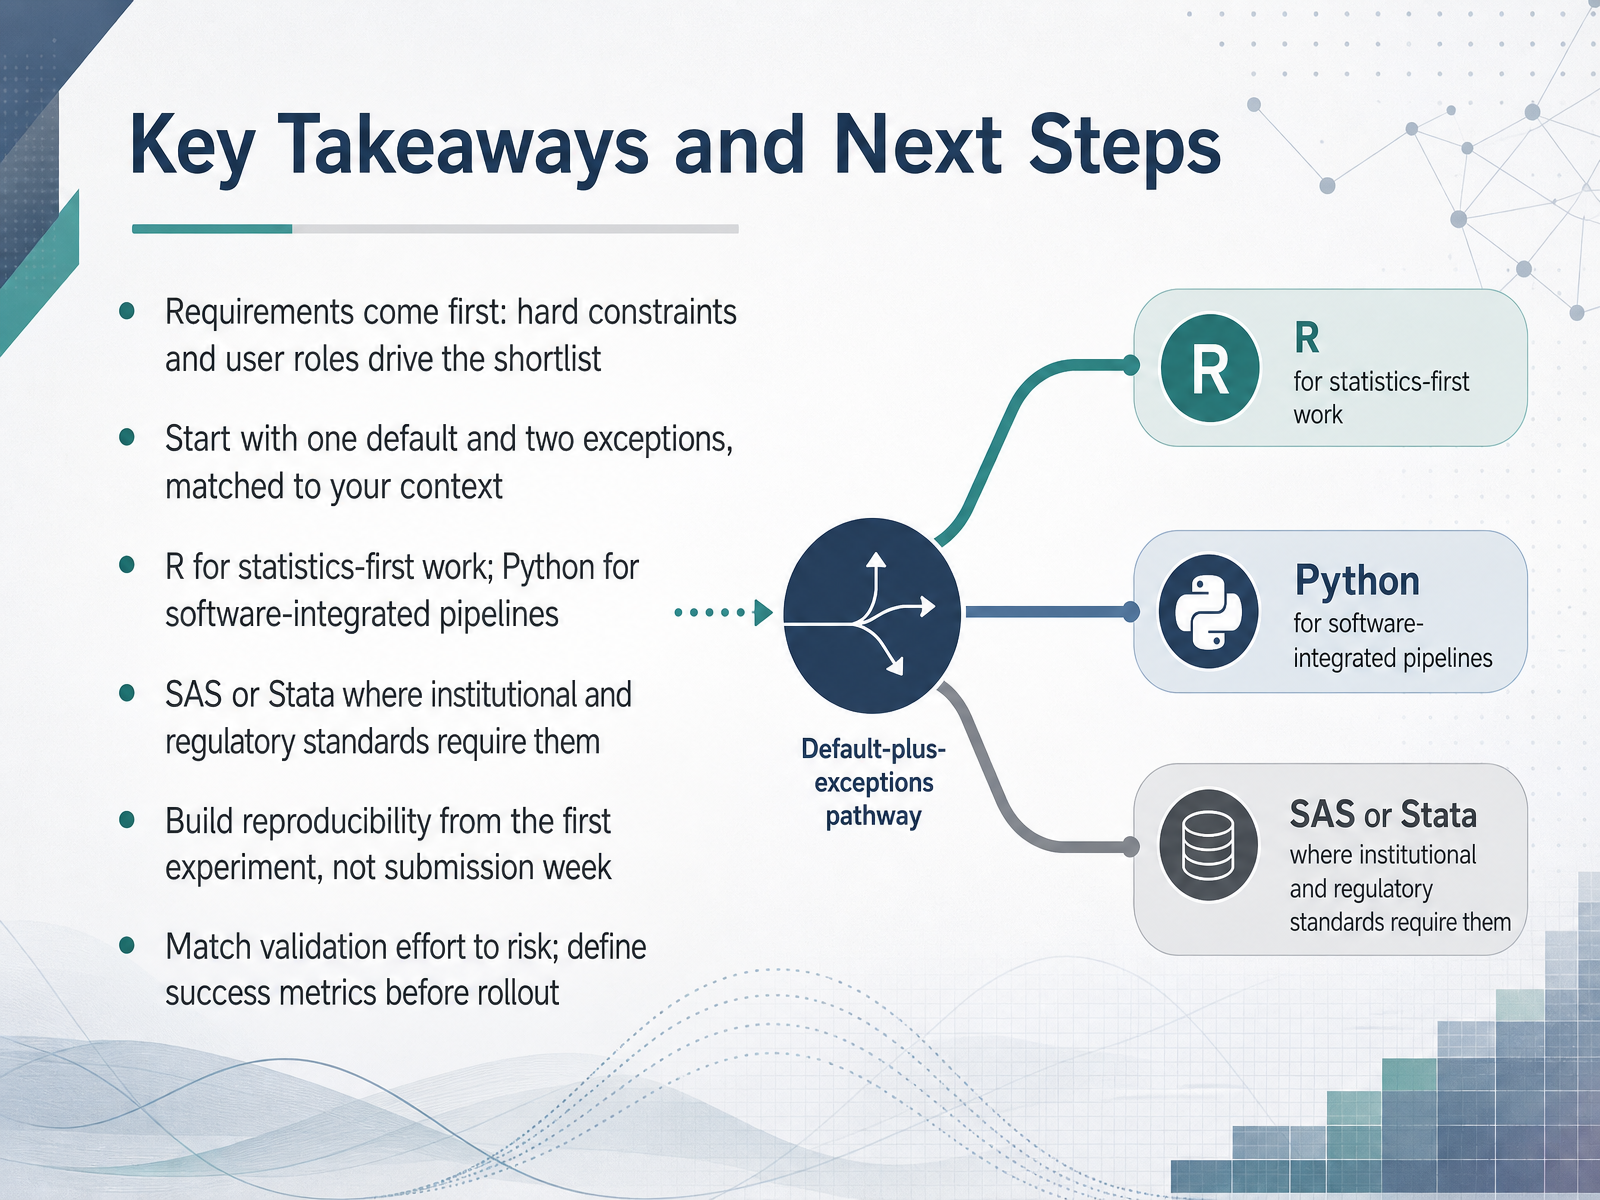
 - 14Key Takeaways and Next StepsLet's pull the key ideas together. First, requirements come before tools. List your hard constraints and the roles who will actually use the software. Those two things drive the shortlist. A practical starting pattern is one default and two exceptions, matched to your context. For statistics-first work, R is the strong default. When analysis has to live inside a software pipeline, Python fits better. Where institutional or regulatory standards require validation and audit trails, SAS or Stata is often the right exception. Two habits matter regardless of tool. Build reproducibility from the first experiment, not submission week, by pinning versions, keeping scripts in version control, and documenting your environment. And match validation effort to risk. Test the bespoke analysis code most, since that is where errors usually enter. Before rollout, define success metrics, such as active users and time saved per analysis, so you can judge adoption honestly. Thank you for working through this course. Take these criteria into your next tool decision, start small, and let your requirements lead.
 querio.aidomystats.cominfinisynapse.com+22 min
Take the deck with you
Download this course as a file — free, no sign-up needed.
- PDF handoutEvery slide page, ready to print or share.15 pages · 3.8 MBDownload
- Narrated PowerPointThe deck that presents itself — every slide carries the digital human's narration video.15 pages · 14.3 MBDownload
- PowerPoint slidesThe full deck as a .pptx — open it in PowerPoint, Keynote, or Google Slides.15 pages · 3.7 MBDownload
Free to use in your own training — please keep the PersonWise credit page at the end.
Have your own deck? Turn it into a course
Sources consulted
Web sources consulted while building this course.
- Statistical Tools for Data Analysis: When to Use R, Python, SPSS, or SAS — querio.ai
- Comparing Statistical Packages: SPSS, SAS, R, and Python - Do My Stats — domystats.com
- Analytical Tools for Data Analysis: 2026 Guide — infinisynapse.com
- Best Statistics Software Compared: R, Python, SPSS, Stata, and Excel — learnhowtoscience.com
- Best Tools for Statistical Data Analysis: R, Python, SAS & Stata — umatechnology.org
- March 12, 2026 — r-project.org
- Making R Submissions Reviewable for FDA – R Consortium — r-consortium.org
- Unleash the R-volution: A Blueprint for Building Package Validation Capabilities in our own organization — pharmasug.org
- Open-source software for regulatory submissions and regulatory environments. — lexjansen.com
- Determining a risk-proportionate approach to the validation of statistical programming for clinical trials — pmc.ncbi.nlm.nih.gov
- Statistics Software Evaluation Checklist for Buyers — metricgate.com
- Choosing the Right Statistical Software for Your Analysis: A Decision Tree Approach — statology.org
- Best 15 statistical analysis software programs for researchers and analysts in 2026 - Guideflow Blog — guideflow.com
- How to choose research software: Buyers guide for teams (2026) — lumivero.com
- Best Statistical Programming Software – 2026 Buyer's Guide — gitnux.org
- How to Evaluate an Enterprise Analytics Platform | Databricks Blog — databricks.com
- How to Select a BI Tool: The Evaluation Framework for Enterprise Analytics | DataArchitect.co — dataarchitect.co
- Enterprise Software Selection: Smart PoC/Pilot Plan — umbrex.com
- How to run a BI tool proof of concept (POC) | Basedash — basedash.com
- How to Choose a BI Tool in 2026: The Decision Framework for Growing Companies | Valiotti Data — valiotti.com