BI Analytics Software Selection and Workflow
Begin
14 pages · ~28 min
BI Analytics Software Selection and Workflow
Learn to select BI and analytics software, define requirements, and design effective workflows for data-driven decision-making.
What you’ll learn
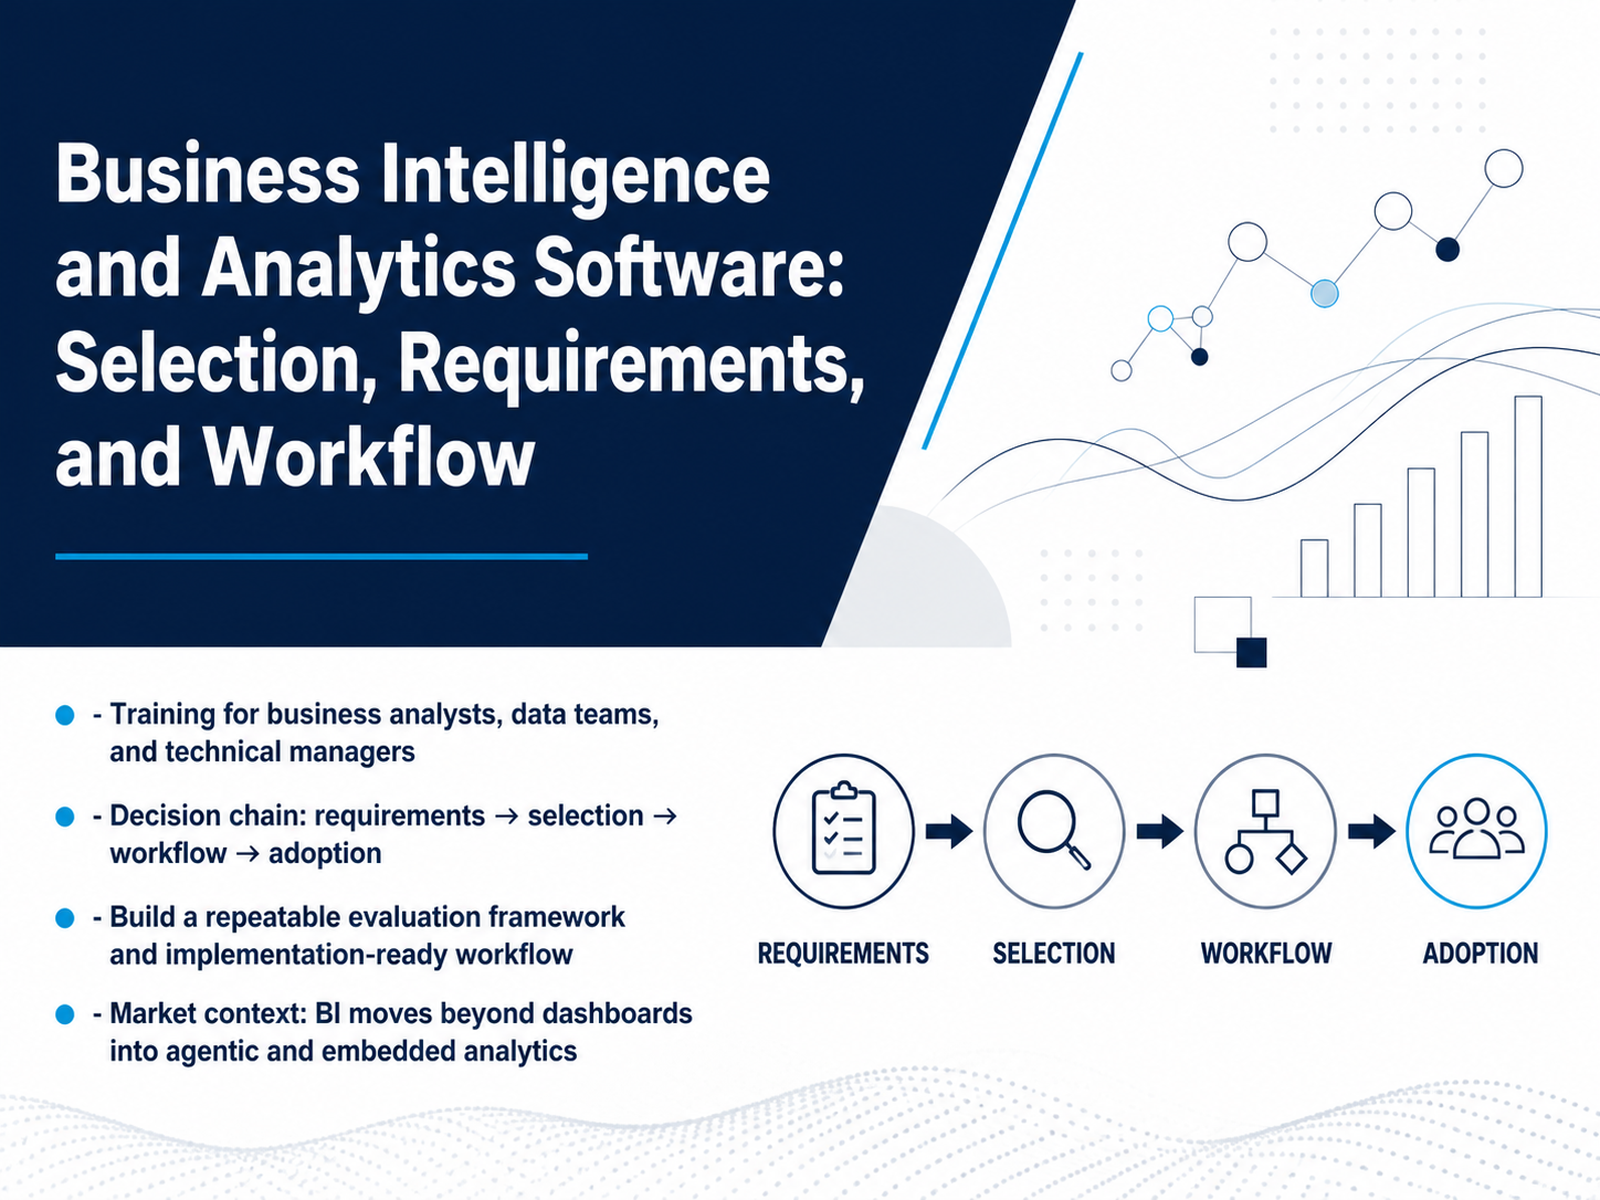
- 01Business Intelligence and Analytics Software: Selection, Requirements, and WorkflowWelcome, everyone. I'm glad you're here. Today, we're going to tackle something that often feels harder than it should be: choosing and rolling out the right business intelligence and analytics software. Whether you're a business analyst, a data team member, or a technical manager, you know the pain of a tool that looked great in the demo but didn't survive contact with your real workflows. So let's change that. We'll walk through the full decision chain, from requirements to selection, then into workflow and adoption. By the end, you'll have a repeatable framework for evaluating tools and a clear path to an implementation-ready plan. And here's the context we're operating in: BI has moved well beyond static dashboards. We're seeing embedded analytics and agentic capabilities become the new baseline. That changes what you should demand from any vendor. So let's start by looking at why BI tool selection still fails, and how we can avoid those pitfalls.2 min
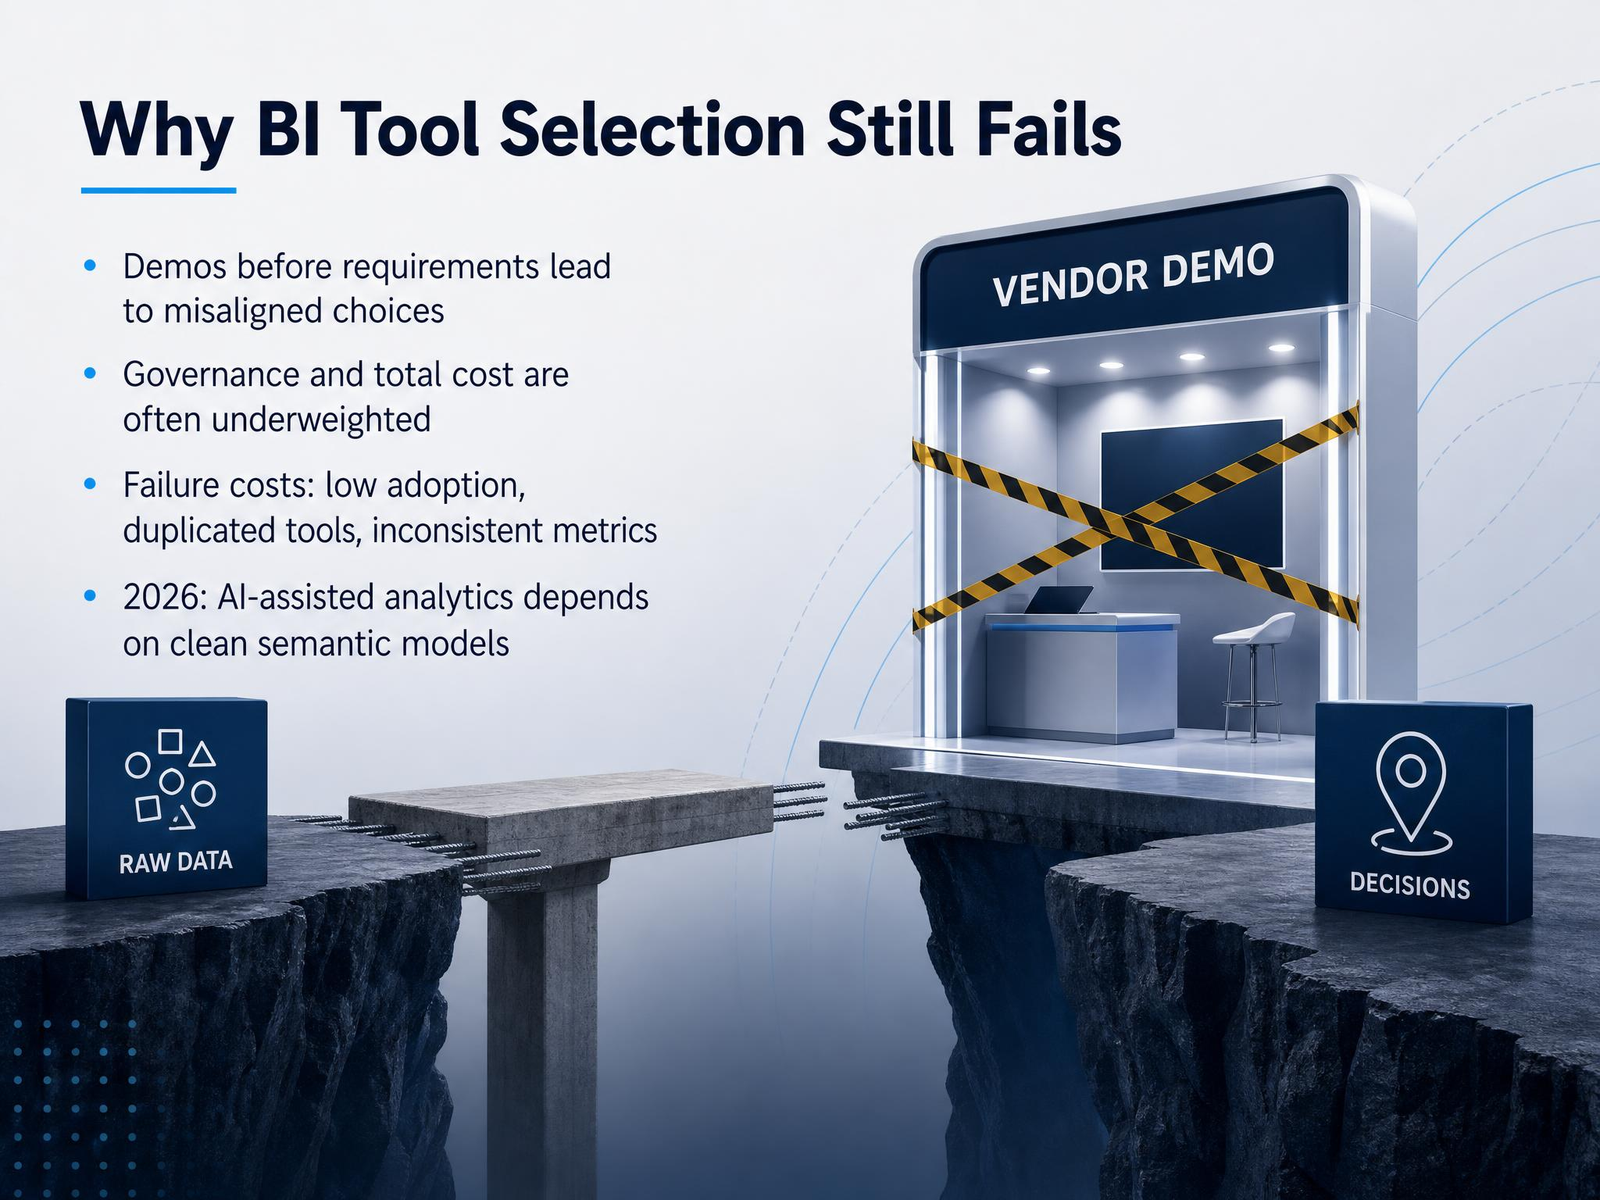
- 02Why BI Tool Selection Still FailsNow, let’s talk about why BI tool selection still fails. Too often, teams jump to vendor demos before they’ve nailed down their actual requirements. That’s like choosing a car based on the test drive before you know whether you need a pickup truck or a compact. The result? A tool that impresses in the demo but misses the mark in daily use. Governance and total cost are also frequently underweighted. Everyone focuses on the license price, but what about the hidden costs of training, integration, and ongoing maintenance? And if governance isn’t built in from the start, you end up with multiple tools, duplicated efforts, and metrics that never align. The real cost shows up in low adoption and inconsistent numbers that erode trust. And looking at 2026, AI-assisted analytics is becoming the norm, but it depends on clean, well-structured semantic models. If your data foundation is messy, no tool—regardless of how smart it claims to be—will fix that. So as we evaluate options, remember: requirements first, total cost in view, and semantic cleanliness as a non-negotiable. Next, we’ll survey the 2026 BI and analytics landscape to see how the market is evolving.
 1 min
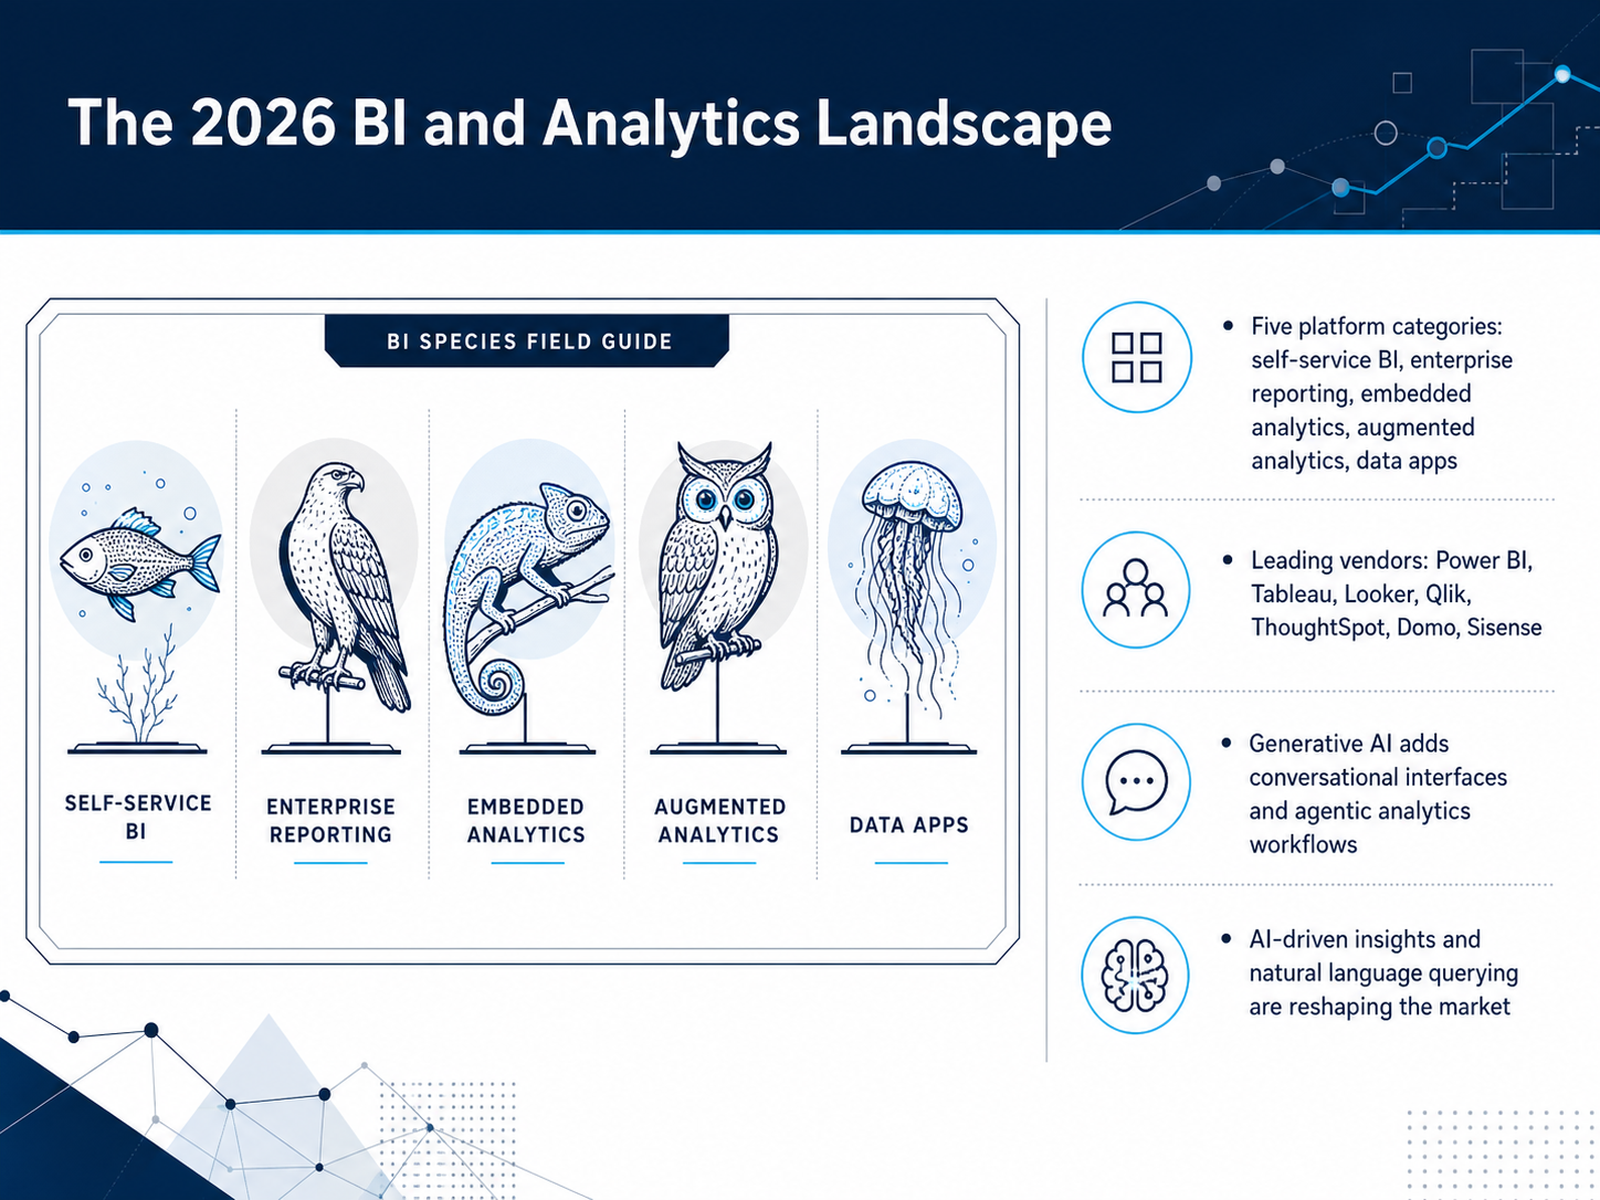
1 min - 03The 2026 BI and Analytics LandscapeNow let's step back and look at the 2026 BI and analytics landscape, because the choices you make this year will shape your team's capabilities for years to come. We're seeing five distinct platform categories: self-service BI for business users, enterprise reporting for governance-heavy needs, embedded analytics that put insights inside your own applications, augmented analytics that automate data preparation and discovery, and the newer data apps that combine analytics with operational workflows. The vendor space is active as ever, with Power BI, Tableau, Looker, Qlik, ThoughtSpot, Domo, and Sisense all competing on different strengths. But the real market shift is generative AI. It's adding conversational interfaces where users ask questions in plain language, and agentic analytics workflows that can proactively run analyses, detect anomalies, and even recommend actions. The result is that AI-driven insights are no longer a nice-to-have; they're becoming the baseline expectation. So as you evaluate tools, don't just compare dashboards and data connectors. Ask how each platform is integrating AI into the actual analytics process. That will be the key differentiator. With that in mind, let's turn to the market signals you should not ignore. These are the trends and buying patterns that tell you where the industry is heading and how to future-proof your stack.
 2 min
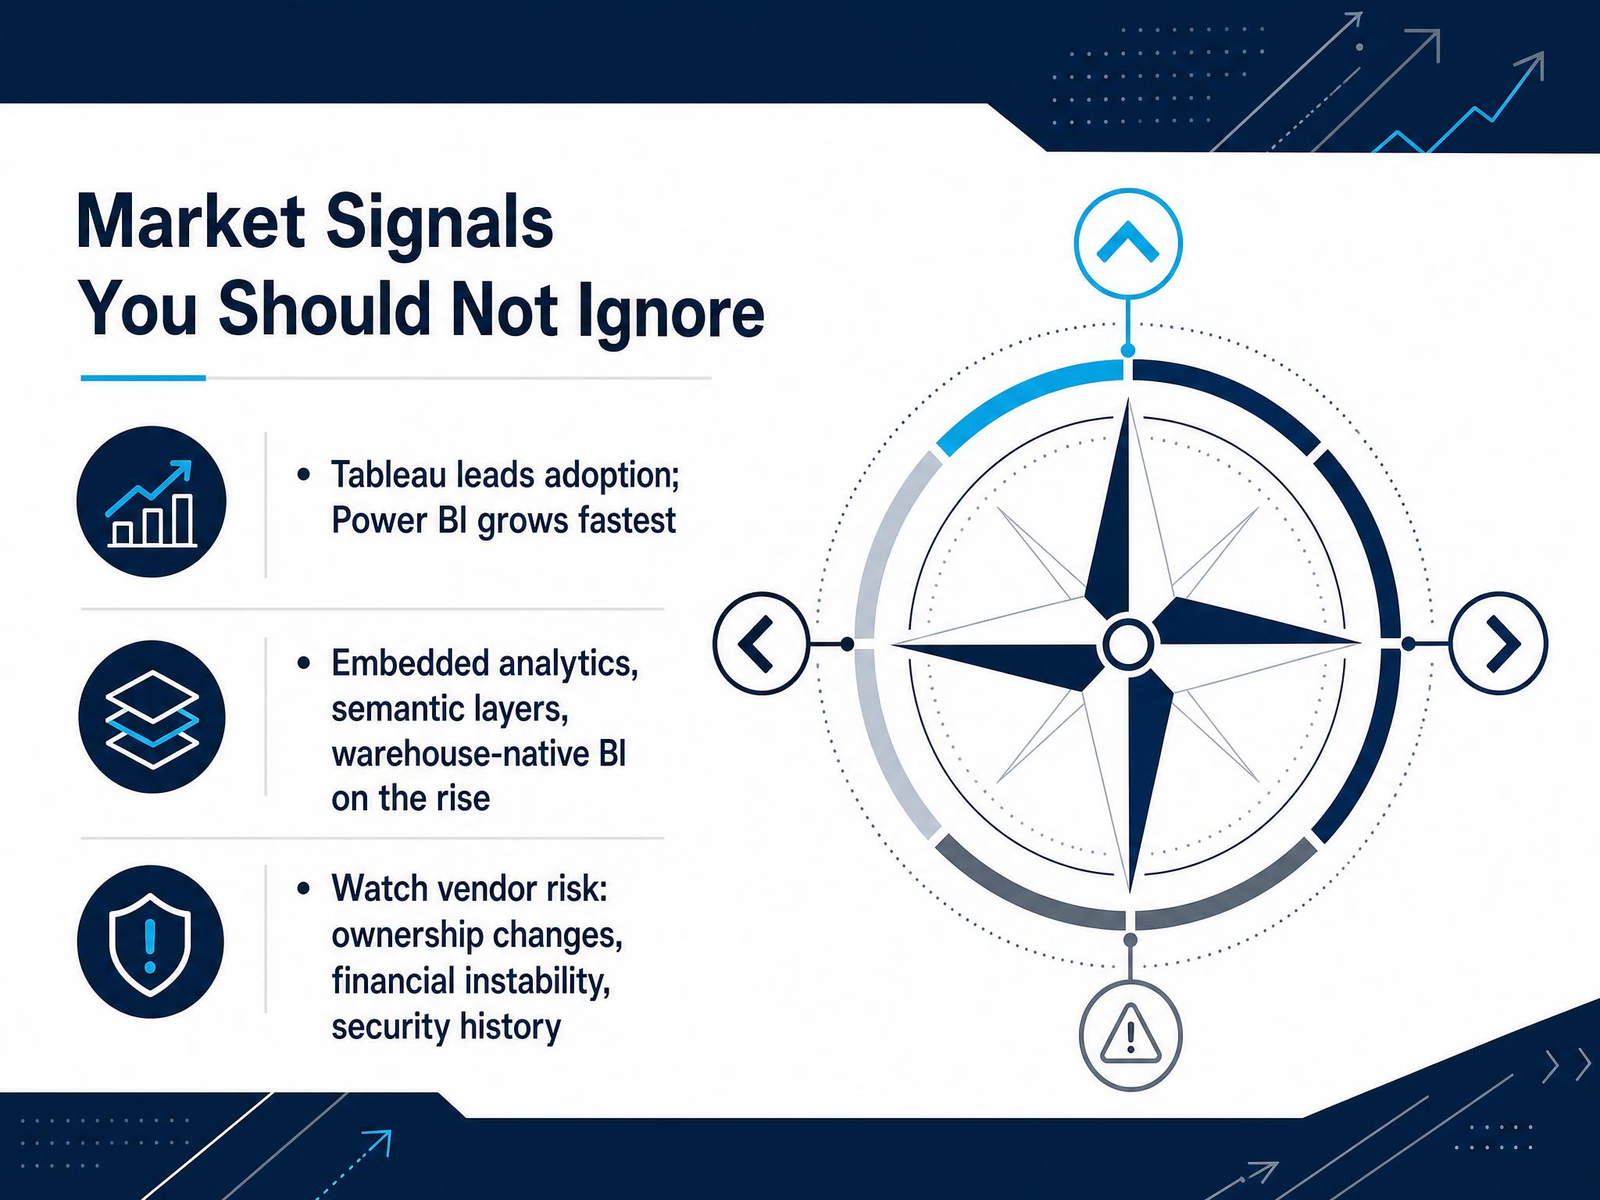
2 min - 04Market Signals You Should Not IgnoreLet's look at what the market is telling us right now, because these signals should shape your shortlist. Tableau still leads in overall adoption, but Power BI is growing faster than any other major tool. If you're starting fresh, that growth curve matters. It means more community resources, more third-party support, and more pressure on competitors to match its pricing. Beyond the two giants, three trends are gaining real momentum: embedded analytics, semantic layers, and warehouse-native BI. Embedded analytics means putting dashboards inside the tools your team already uses. Semantic layers give you one consistent definition of metrics across the company. And warehouse-native BI pushes computation down into your data platform, which usually means better performance and lower cost. Now, the part people tend to skip: vendor risk. Check the ownership history, the financial health, and the security track record. Tools get acquired, roadmaps shift, and pricing models change. A platform that looks great today can become a liability in eighteen months. So read the signals: growth, architecture trends, and vendor stability. They will help you filter out the noise and focus on tools that will actually serve you long term. Next, we'll talk about defining your requirements before you evaluate any tool in detail.
 1 min
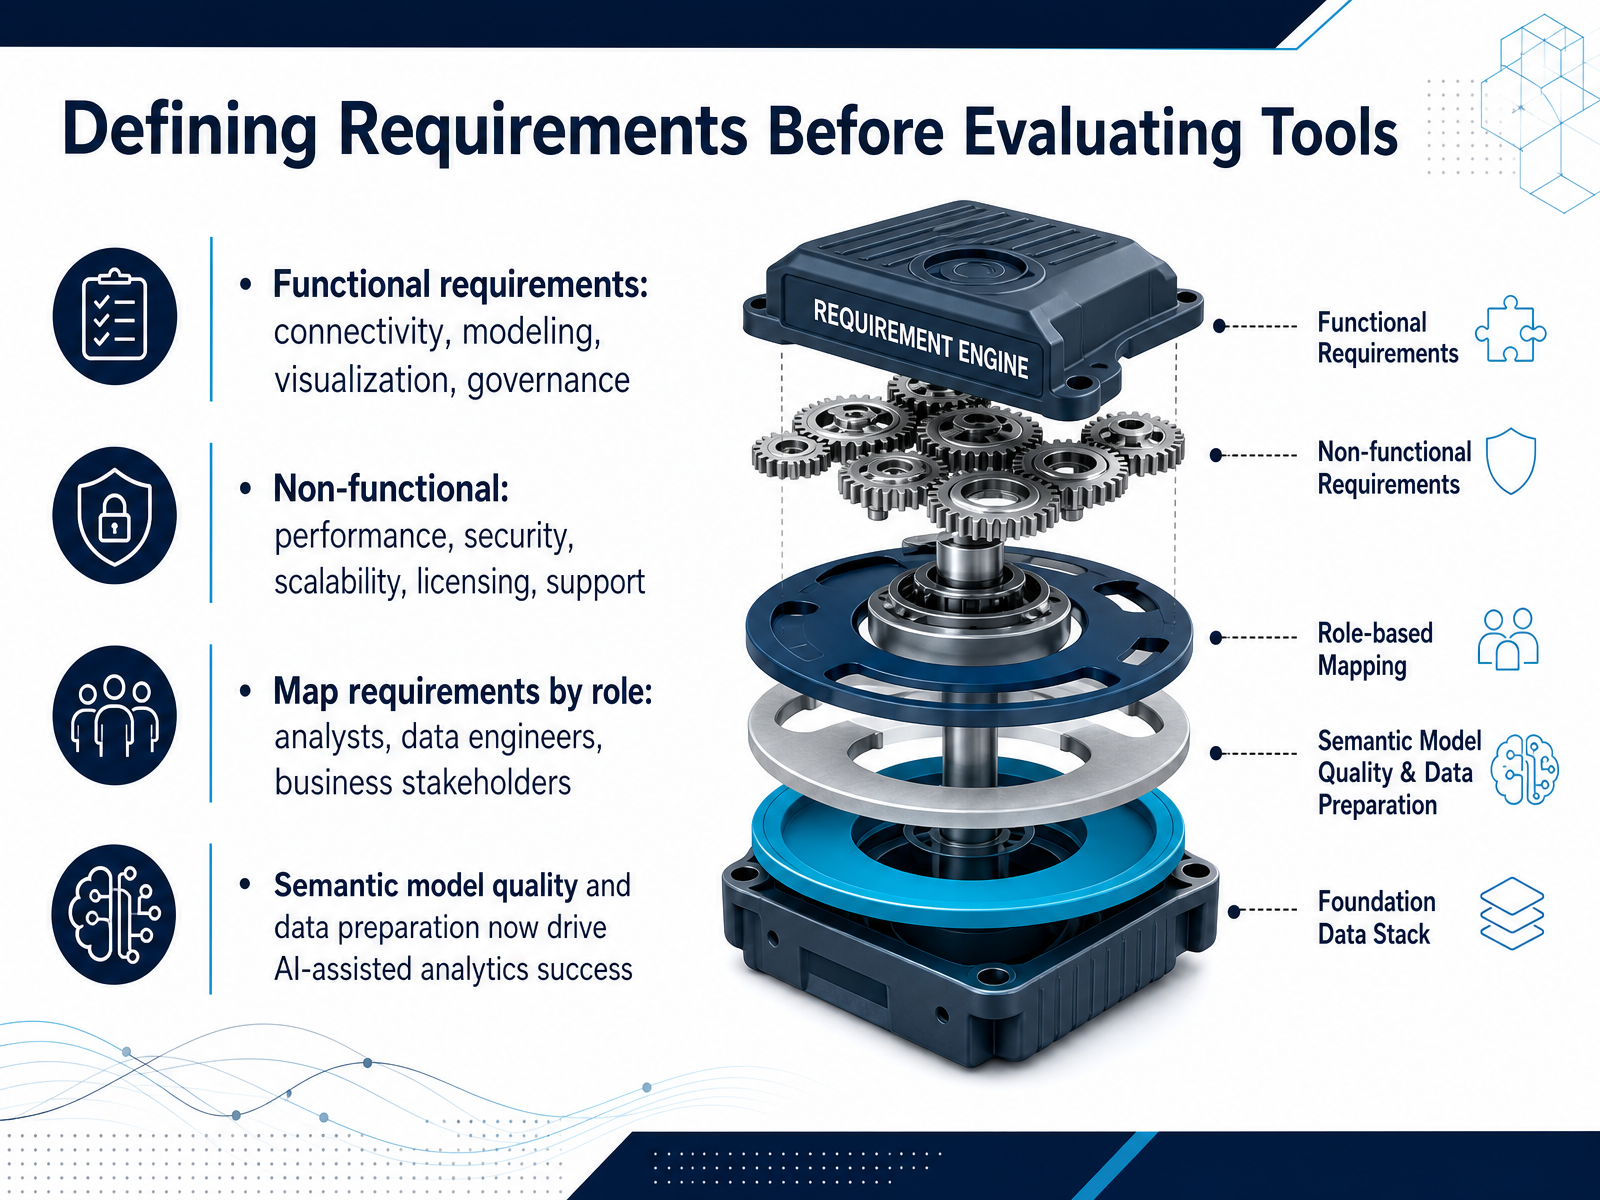
1 min - 05Defining Requirements Before Evaluating ToolsBefore you even start looking at vendor demos, you need to define your requirements clearly. Think of it this way: the quality of your selection depends entirely on the quality of your requirements. Start with functional needs. What data sources must the tool connect to? What level of modeling complexity do you need? How will your team build dashboards and visualizations? And critically, how will you enforce governance and data access controls? Now, the non-functional side is just as important, if not more so. Performance under load, security compliance, scalability as your data grows, licensing costs, and vendor support. These are the constraints that will make or break your implementation. Here's a practical tip: map requirements by role. Analysts care about self-service and visualization speed. Data engineers care about pipeline reliability and transformation options. Business stakeholders care about clarity and decision speed. If you don't capture requirements from all three perspectives, you'll end up with a tool that serves one group while frustrating the others. And one final thought. The quality of your semantic model and data preparation is no longer a nice to have. It now directly drives the success of AI assisted analytics. Garbage in, garbage out applies here more than ever. So define your requirements with that in mind. Once you have these documented, you're ready to move into building an evaluation and scoring framework.
 2 min
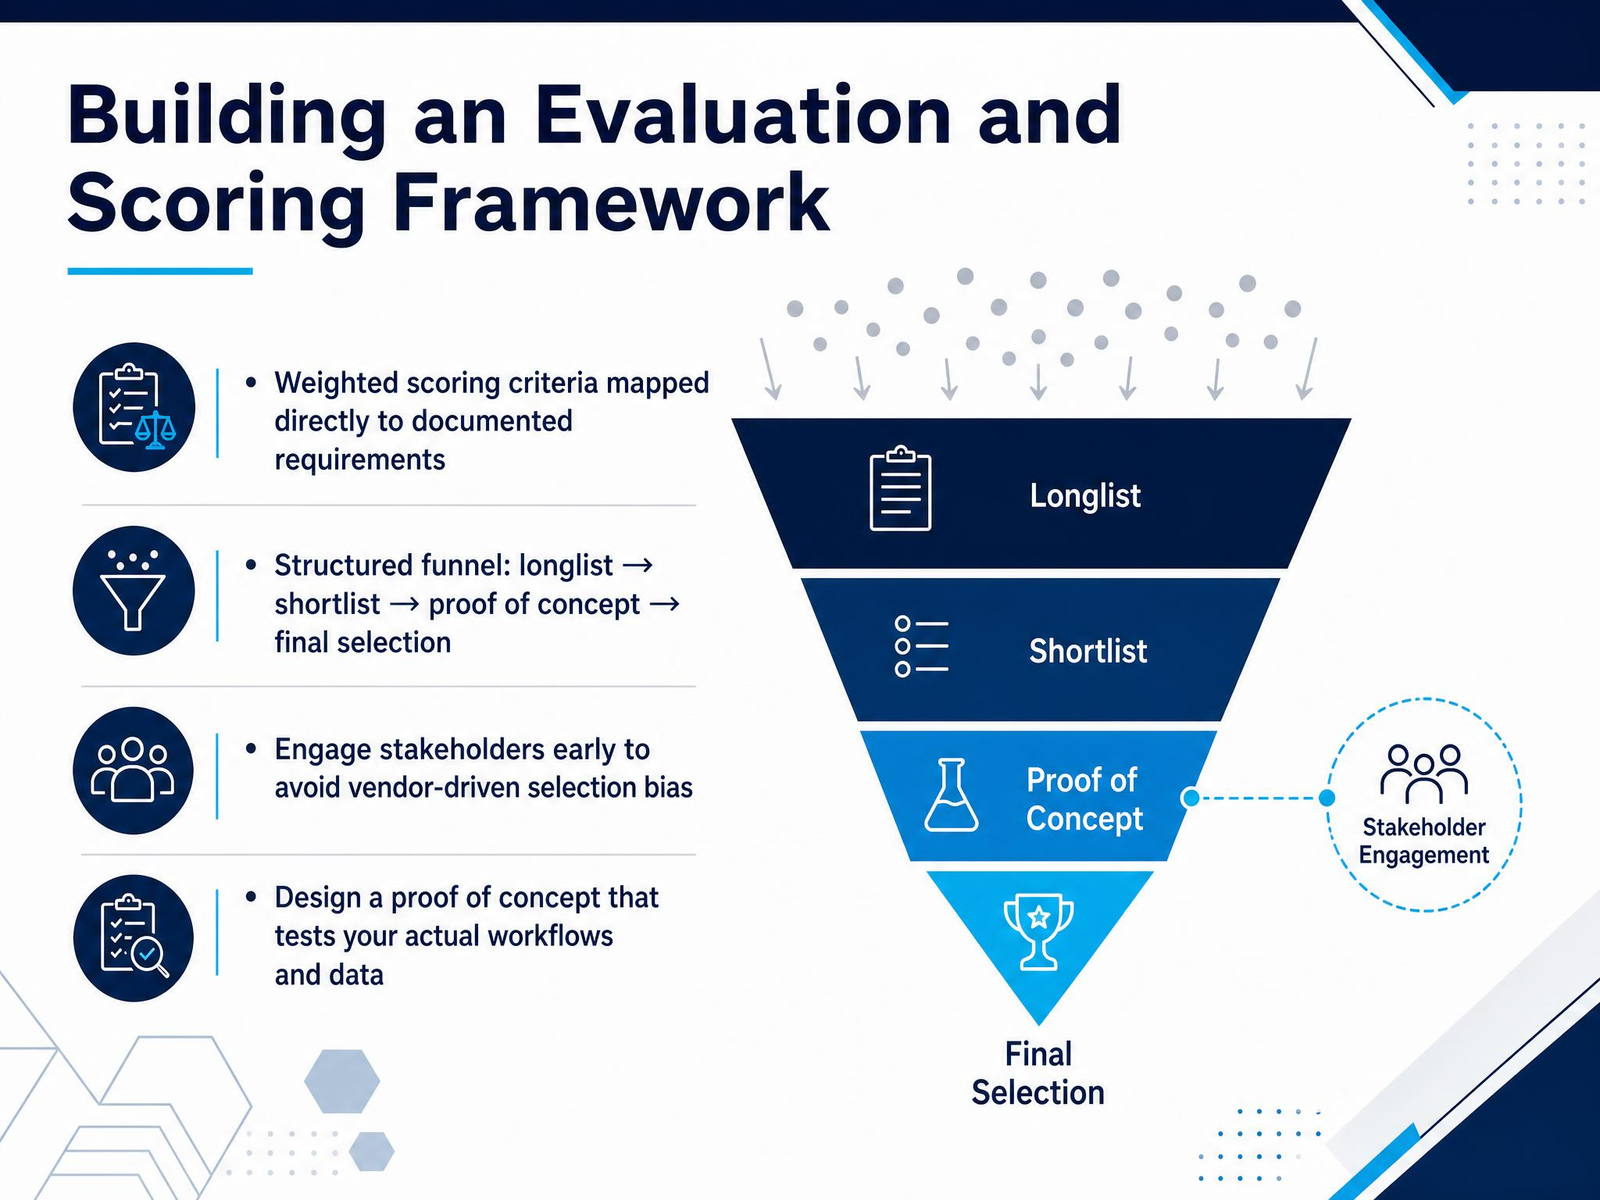
2 min - 06Building an Evaluation and Scoring FrameworkNow let’s turn this into an actual working framework you can defend in front of your stakeholders. Start by building weighted scoring criteria that map directly to the requirements you documented earlier. Every requirement gets a weight based on business impact, and every vendor gets scored against that same scale. This keeps the process objective and repeatable. Next, structure your funnel deliberately: longlist, shortlist, proof of concept, then final selection. Each stage narrows the field based on evidence, not gut feel. Engage your stakeholders early, ideally before vendors start pitching. If you don’t, you risk vendor-driven selection bias where the most persuasive sales team wins instead of the best fit. Finally, design a proof of concept that tests your actual workflows, not the vendor’s demo script. Give them real data, real edge cases, and real users. A proof of concept that mirrors your daily operations will surface integration issues and performance gaps that a polished demo will never reveal. The takeaway here is simple: a transparent, requirement-driven process protects you from guesswork. It also gives you the confidence to say no when a tool looks great on paper but fails under your conditions. Now, once you’ve scored your finalists, the next major factor is the total cost of ownership and how licensing models affect your budget over time.
 2 min
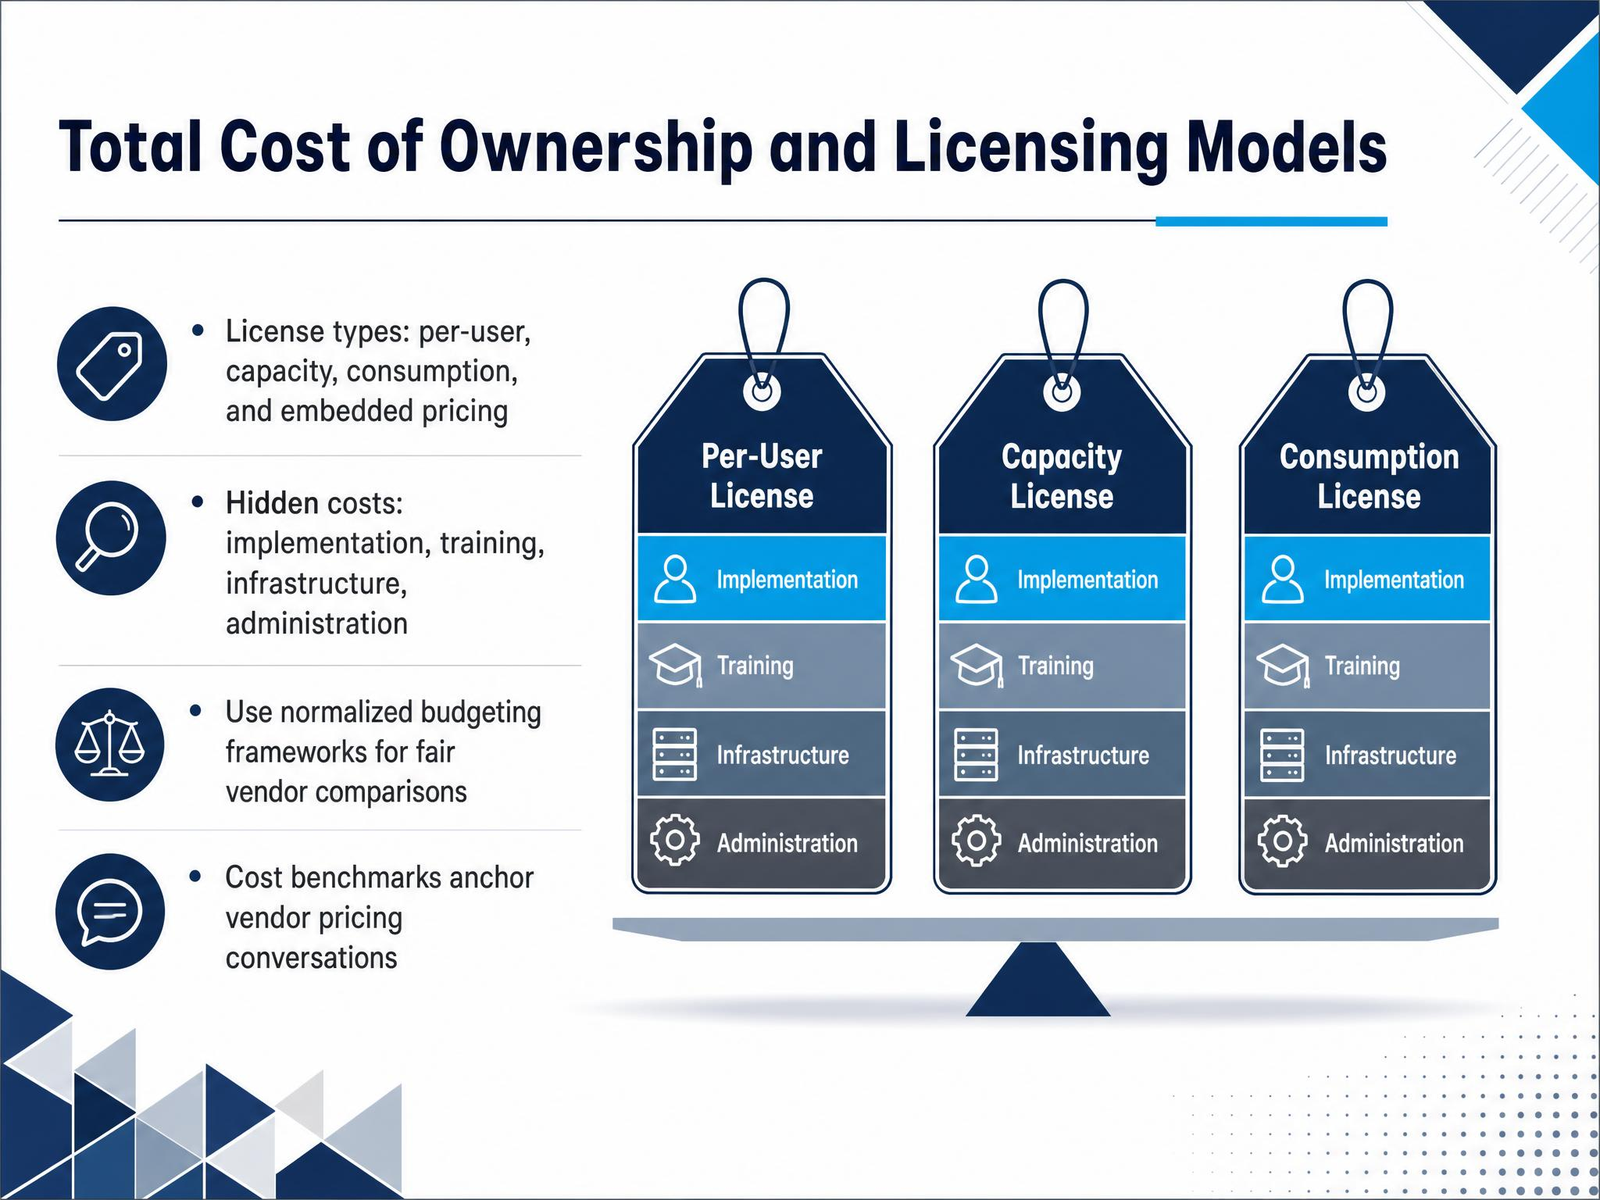
2 min - 07Total Cost of Ownership and Licensing ModelsNow let's talk about the total cost of ownership and licensing models. Because when you compare BI tools, the sticker price is rarely the real price. You'll see per-user, capacity-based, consumption-based, and even embedded pricing. Each shifts costs differently. Per-user is simple but can balloon as your team grows. Capacity and consumption scale with usage, which is great for variable workloads. Embedded pricing matters if you're building analytics into your own product. But don't stop at the license. Factor in implementation, training, infrastructure, and ongoing administration. Those hidden costs often exceed the software itself. To compare fairly, build a normalized budget framework that covers a three-year horizon across all vendors. Then use those benchmarks to anchor your pricing conversations. You'll negotiate from data, not guesswork. So, keep the total cost in mind as we move into architecture, security, and governance requirements, where your choices start to have long-term consequences.
 2 min
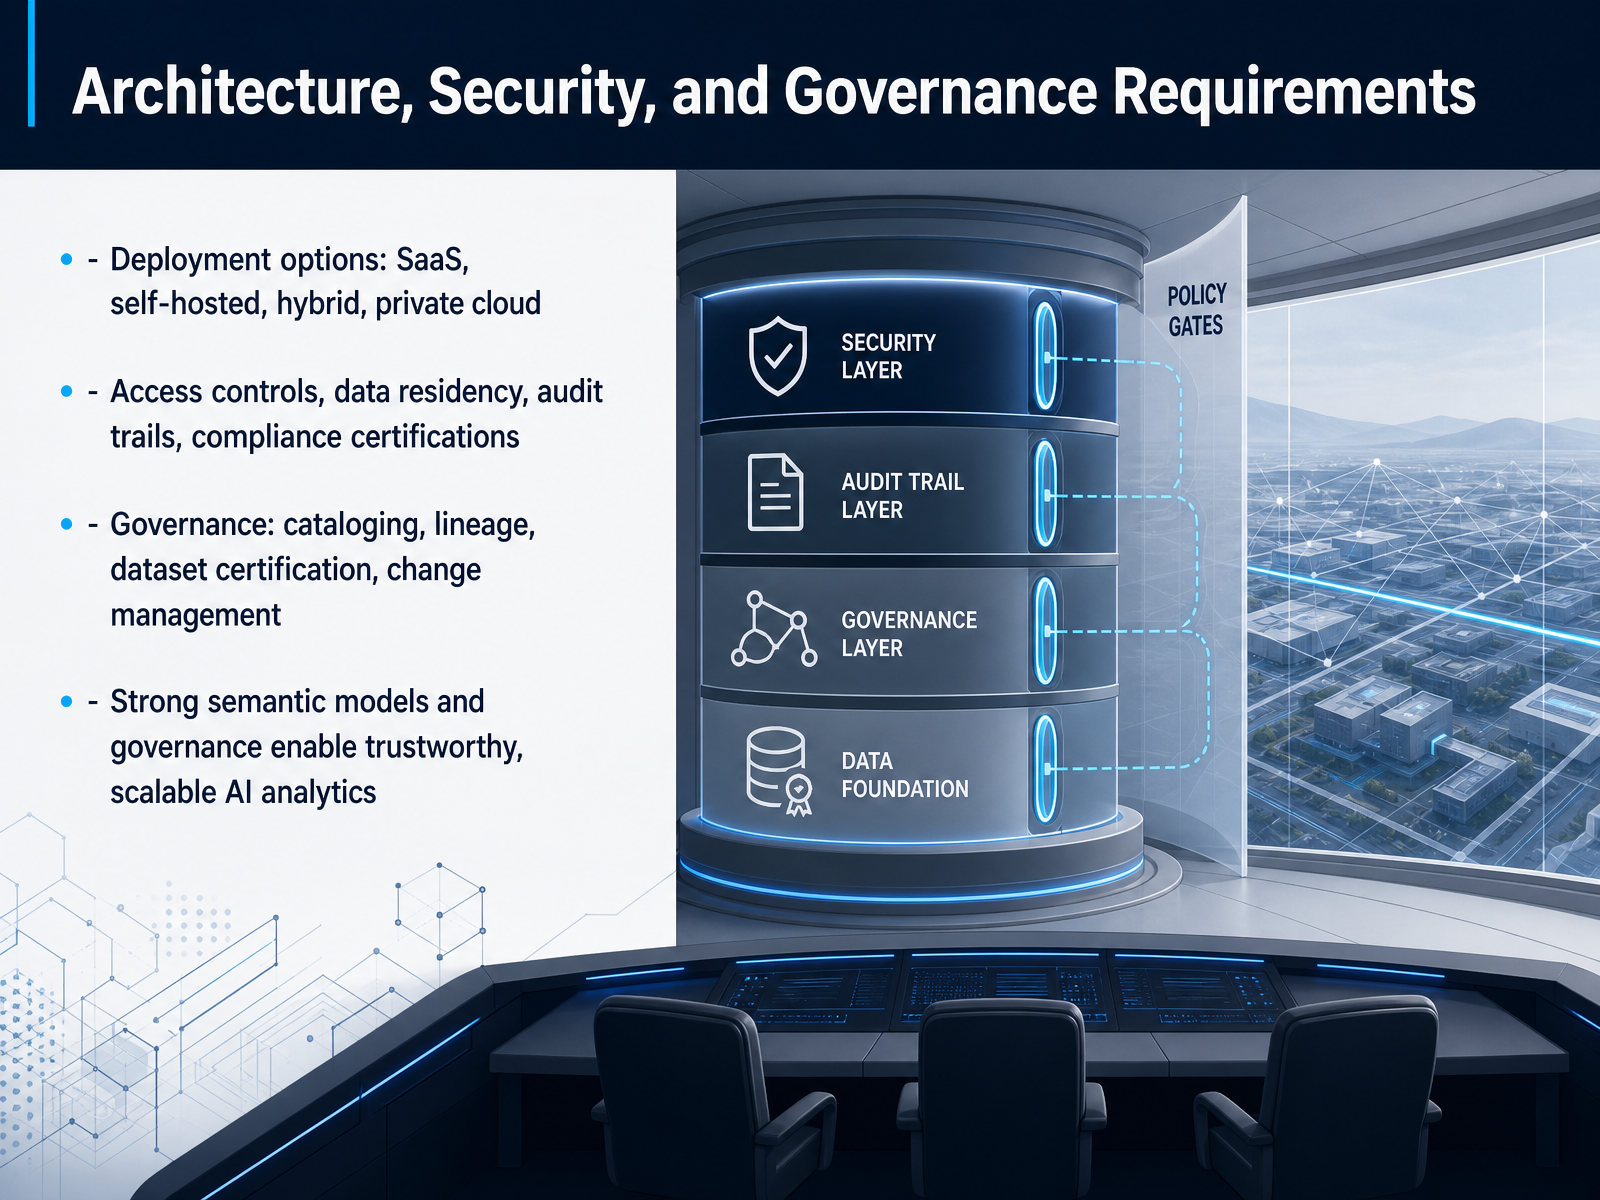
2 min - 08Architecture, Security, and Governance RequirementsNow let’s talk about the guardrails. Architecture, security, and governance are not afterthoughts—they are the foundation of trust in your analytics stack. First, deployment. You have four main paths: software as a service, self-hosted, hybrid, and private cloud. SaaS gives you speed and low maintenance. Self-hosted gives you control. Hybrid lets you balance both. Private cloud is for when data residency is non-negotiable. Choose based on where your data lives and who needs to access it. Second, security specifics. You need role-based access controls, clear data residency policies, full audit trails, and compliance certifications that match your industry. If you handle financial or health data, these are non-negotiable. Third, governance. This means active cataloging of your data assets, lineage tracking to show where data comes from, dataset certification to mark trusted sources, and formal change management. Without these, your analytics will drift. And here is the key takeaway: strong semantic models paired with solid governance are what make scalable AI analytics actually trustworthy. Get this right, and your team can move fast without breaking things. Next, we’ll look at how to design the analytics workflow from data to decision.
 2 min
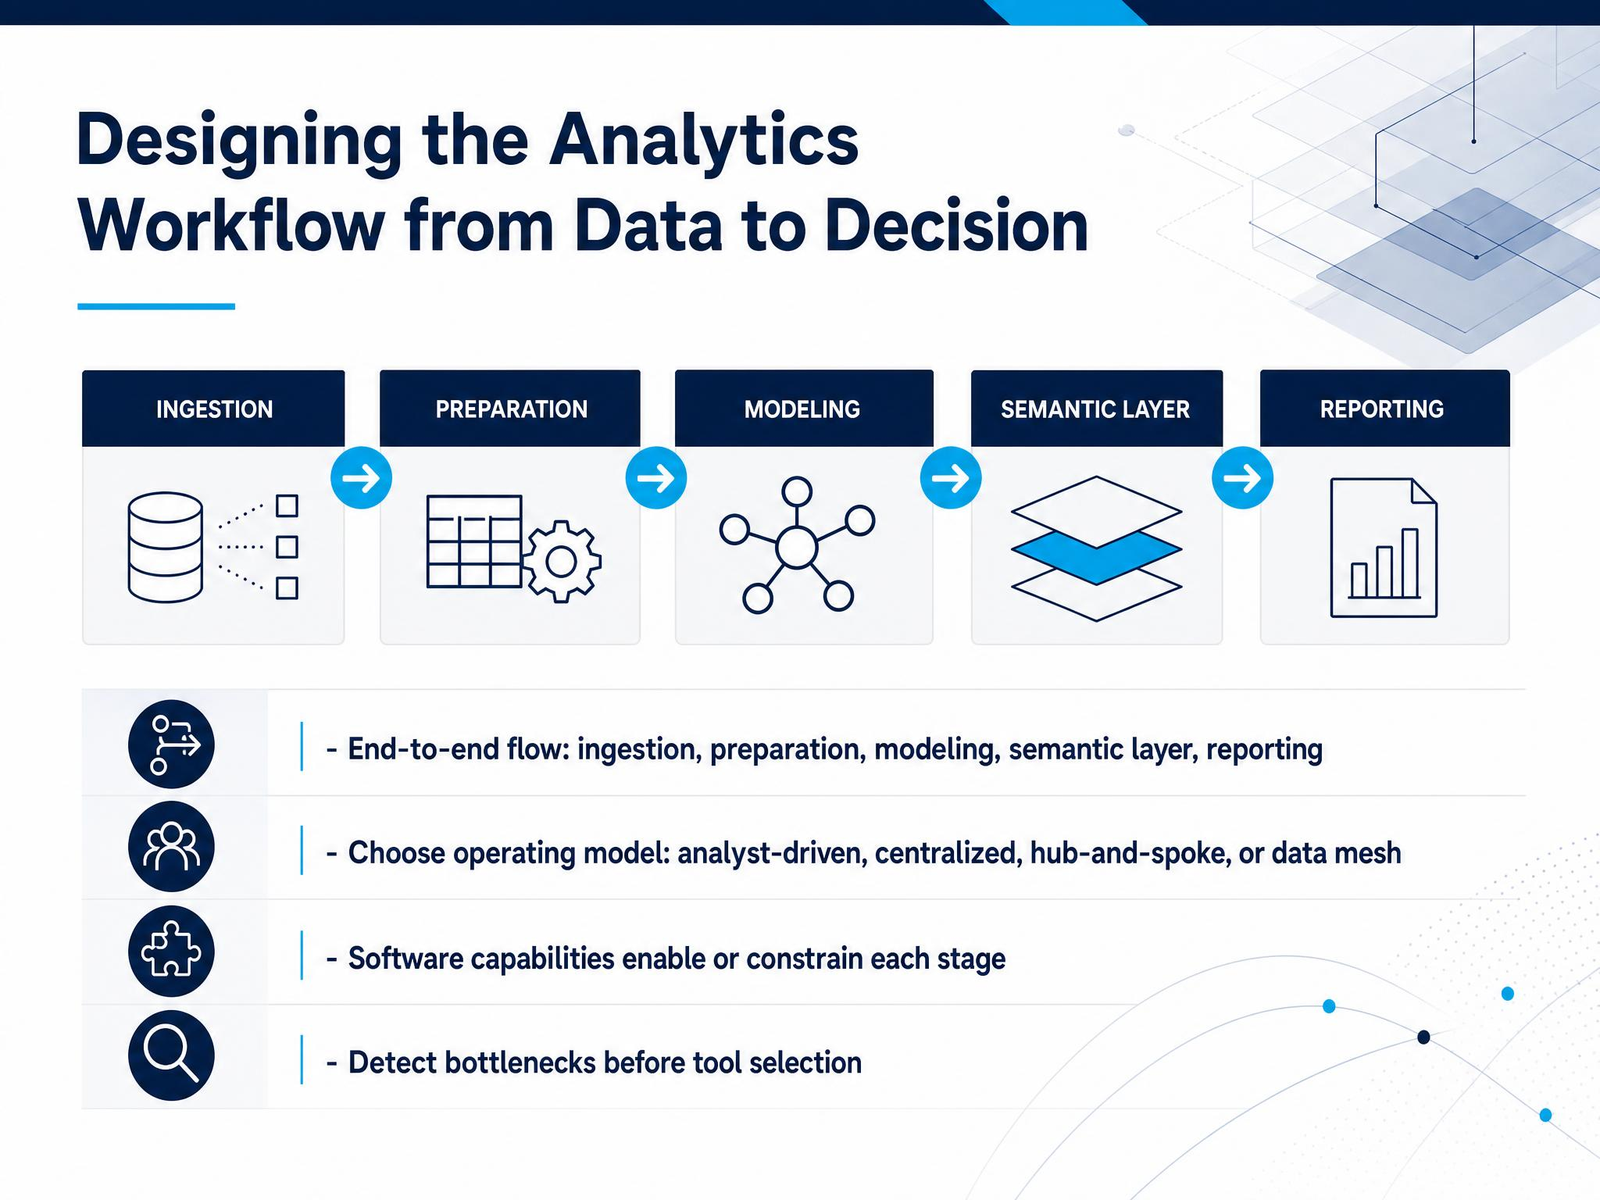
2 min - 09Designing the Analytics Workflow from Data to DecisionNow let's walk through the full analytics workflow, from raw data to the final decision. It's a chain: ingestion, preparation, modeling, the semantic layer, and then reporting. Each link matters, and your software choices either enable or constrain every single stage. For example, a great visualization tool won't save you if your modeling layer can't handle your data volume. So before you even look at vendors, map out your operating model. Are you going with a centralized team, a hub-and-spoke structure, a fully analyst-driven approach, or a data mesh where domain teams own their data? Each model has very different software implications. And here's the critical step: pinpoint bottlenecks in your current pipeline before you select anything. If your reports take forever because data prep is manual, buying a fancier dashboard won't fix that. Identify where the friction is, then let your workflow requirements drive the tool selection, not the other way around. Keep that sequence in mind as we look at how software capabilities map to these workflow patterns.
 2 min
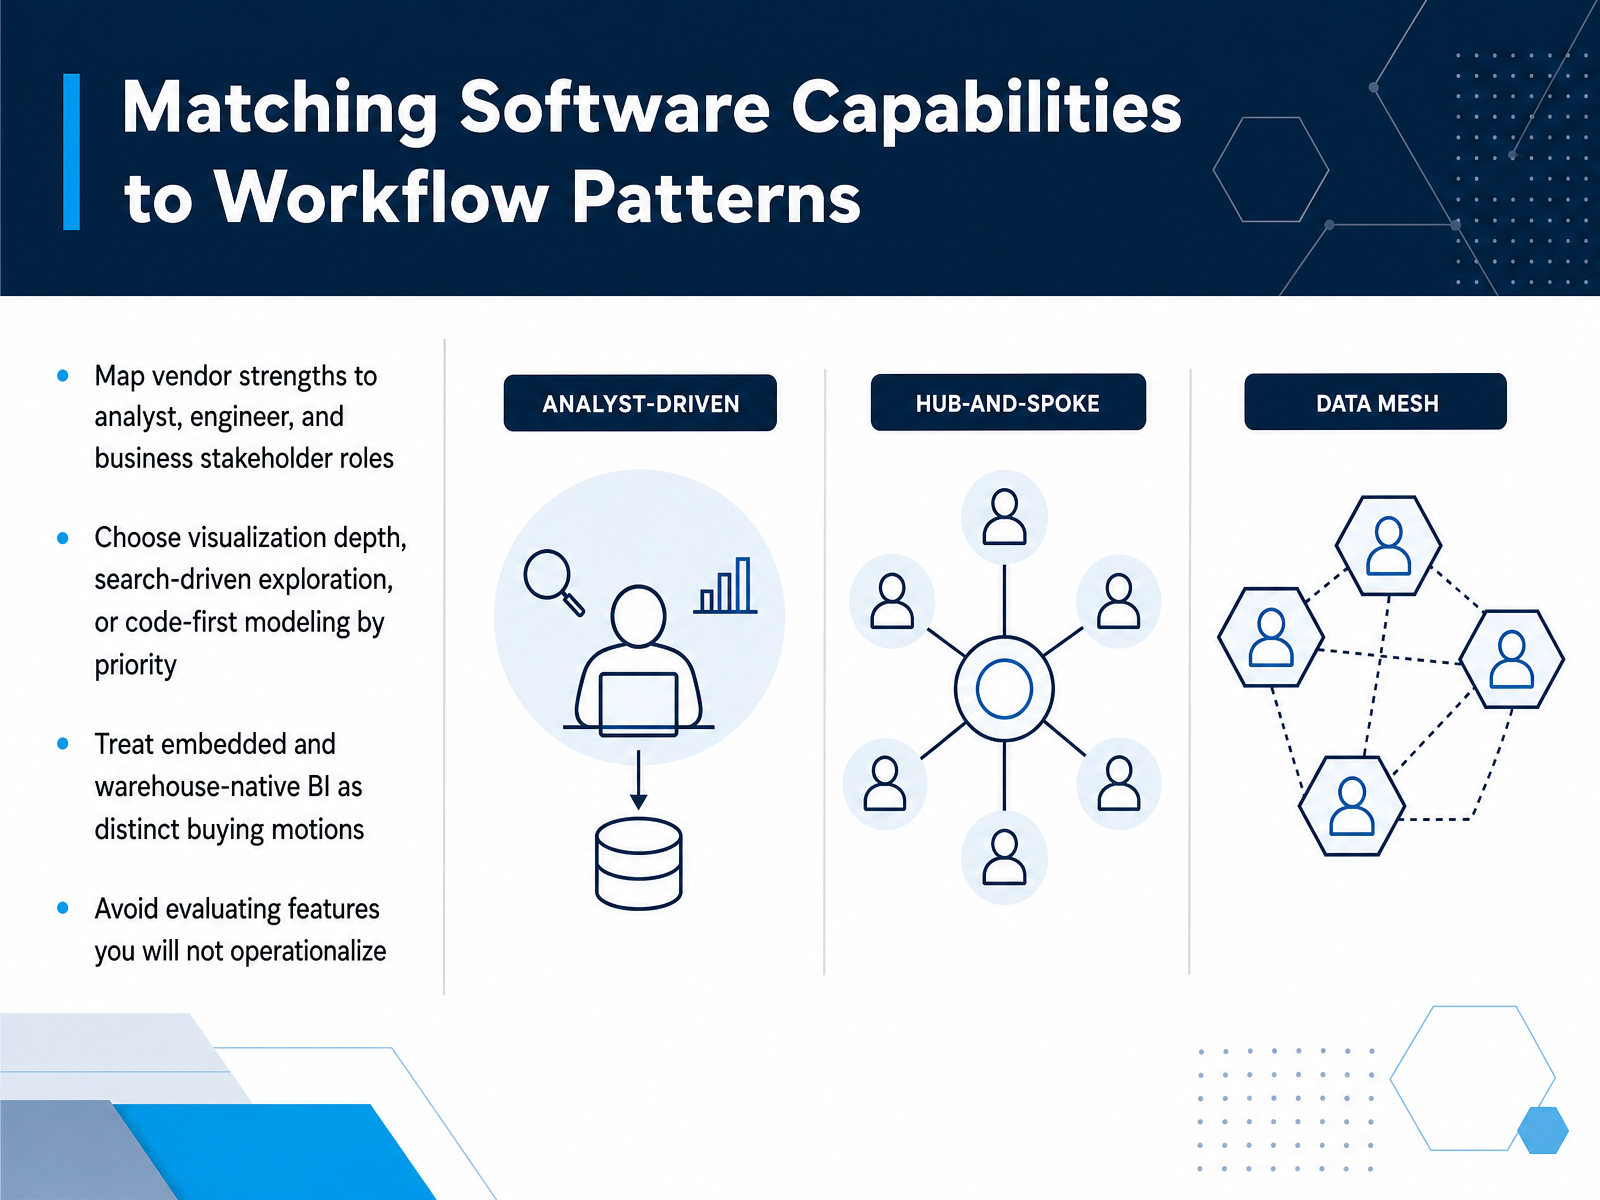
2 min - 10Matching Software Capabilities to Workflow PatternsNow let us talk about matching software capabilities to real workflow patterns. A common mistake is evaluating every feature on the vendor list, when only a few will actually drive value for your teams. Start by mapping vendor strengths to distinct roles. Analysts need interactive visualization depth, engineers need code-first modeling, and business stakeholders need search-driven exploration. One product rarely excels across all three, and that is fine. Your priority should reflect who will use the tool daily. Also, treat embedded analytics and warehouse-native BI as separate purchasing decisions. They serve different needs and often involve different stakeholders. If you only need dashboards inside your application, do not pay for a full BI platform. And avoid evaluating features you will not operationalize. A beautiful demo of predictive forecasting is irrelevant if your team lacks the data infrastructure to support it. Focus on what you will actually deploy within the next two quarters. This alignment is what turns a software purchase into a sustainable capability. Next, we will look at how to drive adoption and enablement across your organization.
 2 min
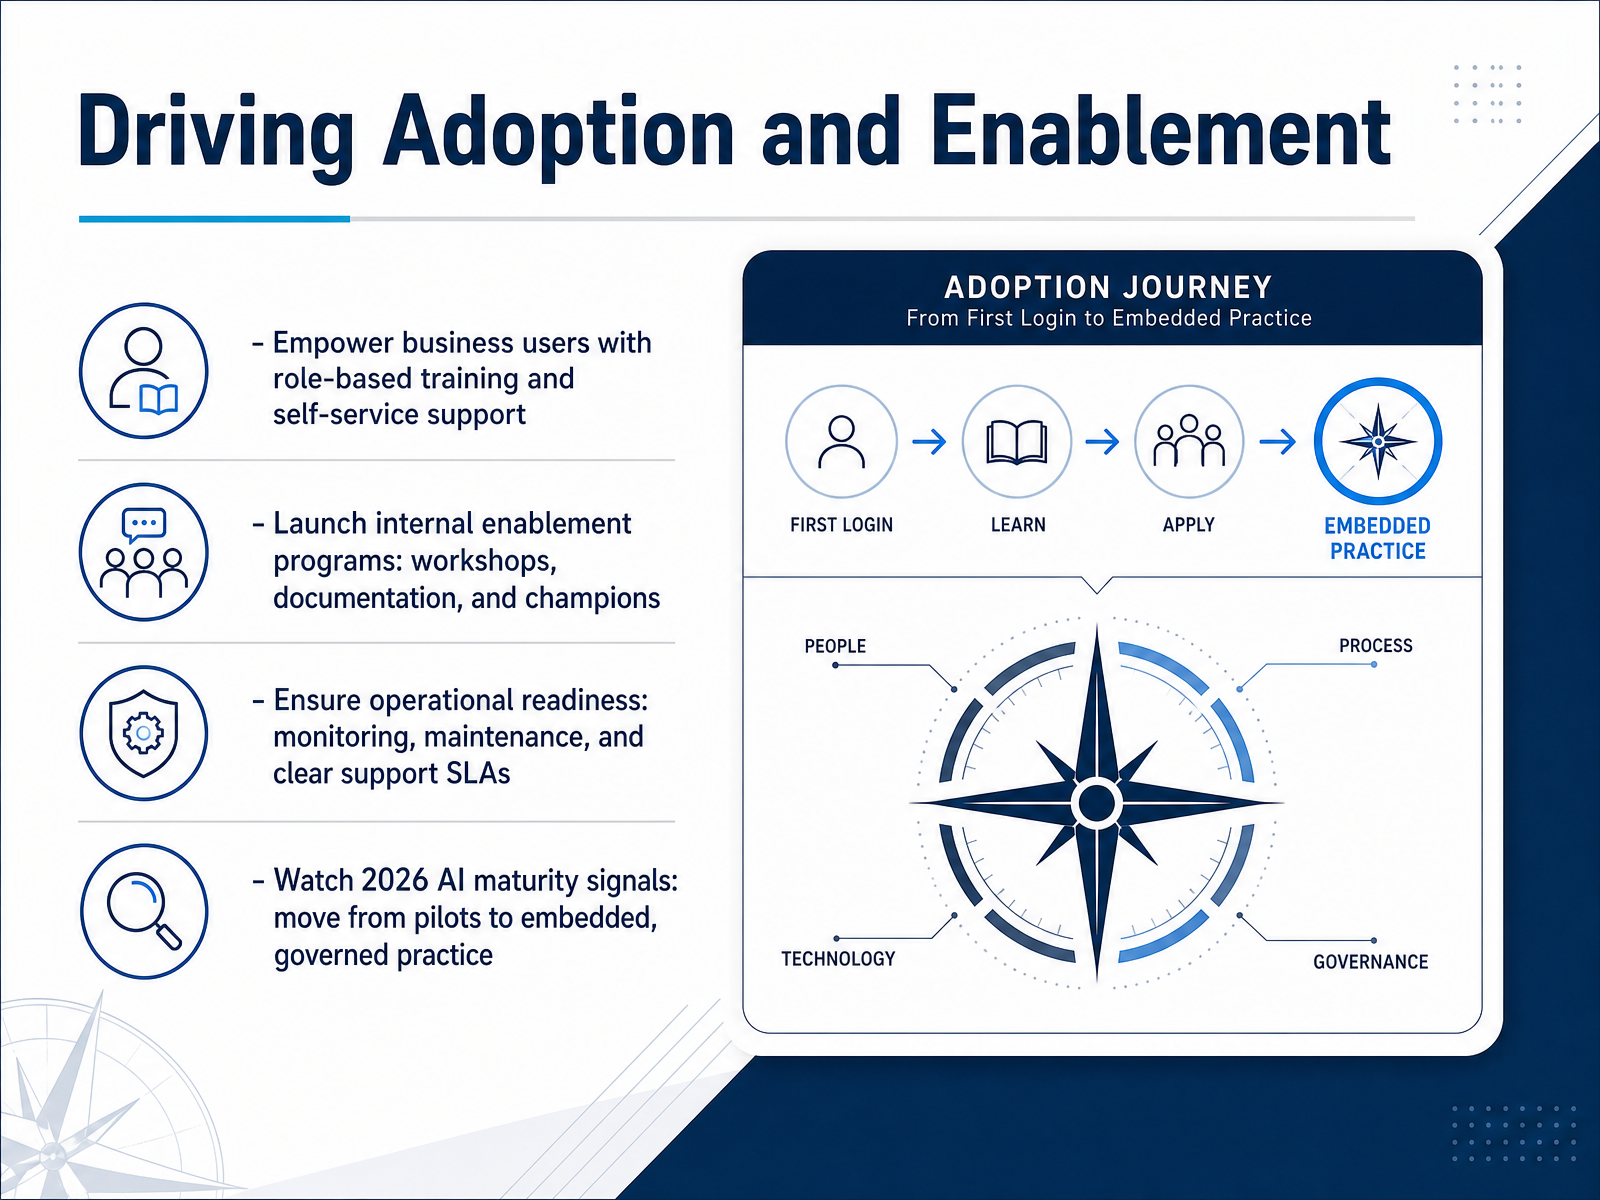
2 min - 11Driving Adoption and EnablementNow, once you’ve selected the right platform, the real work begins. Adoption doesn’t happen by simply flipping a switch. It happens when business users feel empowered to explore data on their own terms. That means role-based training is non-negotiable. Don’t just teach the tool—teach the decisions it supports. Pair that with self-service support, like searchable FAQs or a community forum, so users aren’t blocked every time they hit a question. Then, build momentum with internal enablement programs: hands-on workshops, concise documentation, and a network of champions who can coach their peers. These champions often make the difference between a rollout that stalls and one that sticks. At the same time, don’t overlook operational readiness. Define monitoring, maintenance, and support SLAs upfront so the team knows who to call and how fast a response will come. Finally, keep an eye on 2026 AI maturity signals. Move beyond pilots into embedded, governed practice. That’s where real value compounds. So, a quick takeaway: adoption is a system, not a one-time event. Train for roles, support through champions, and operationalize early. Up next: from selection to implementation—a practical roadmap.
 2 min
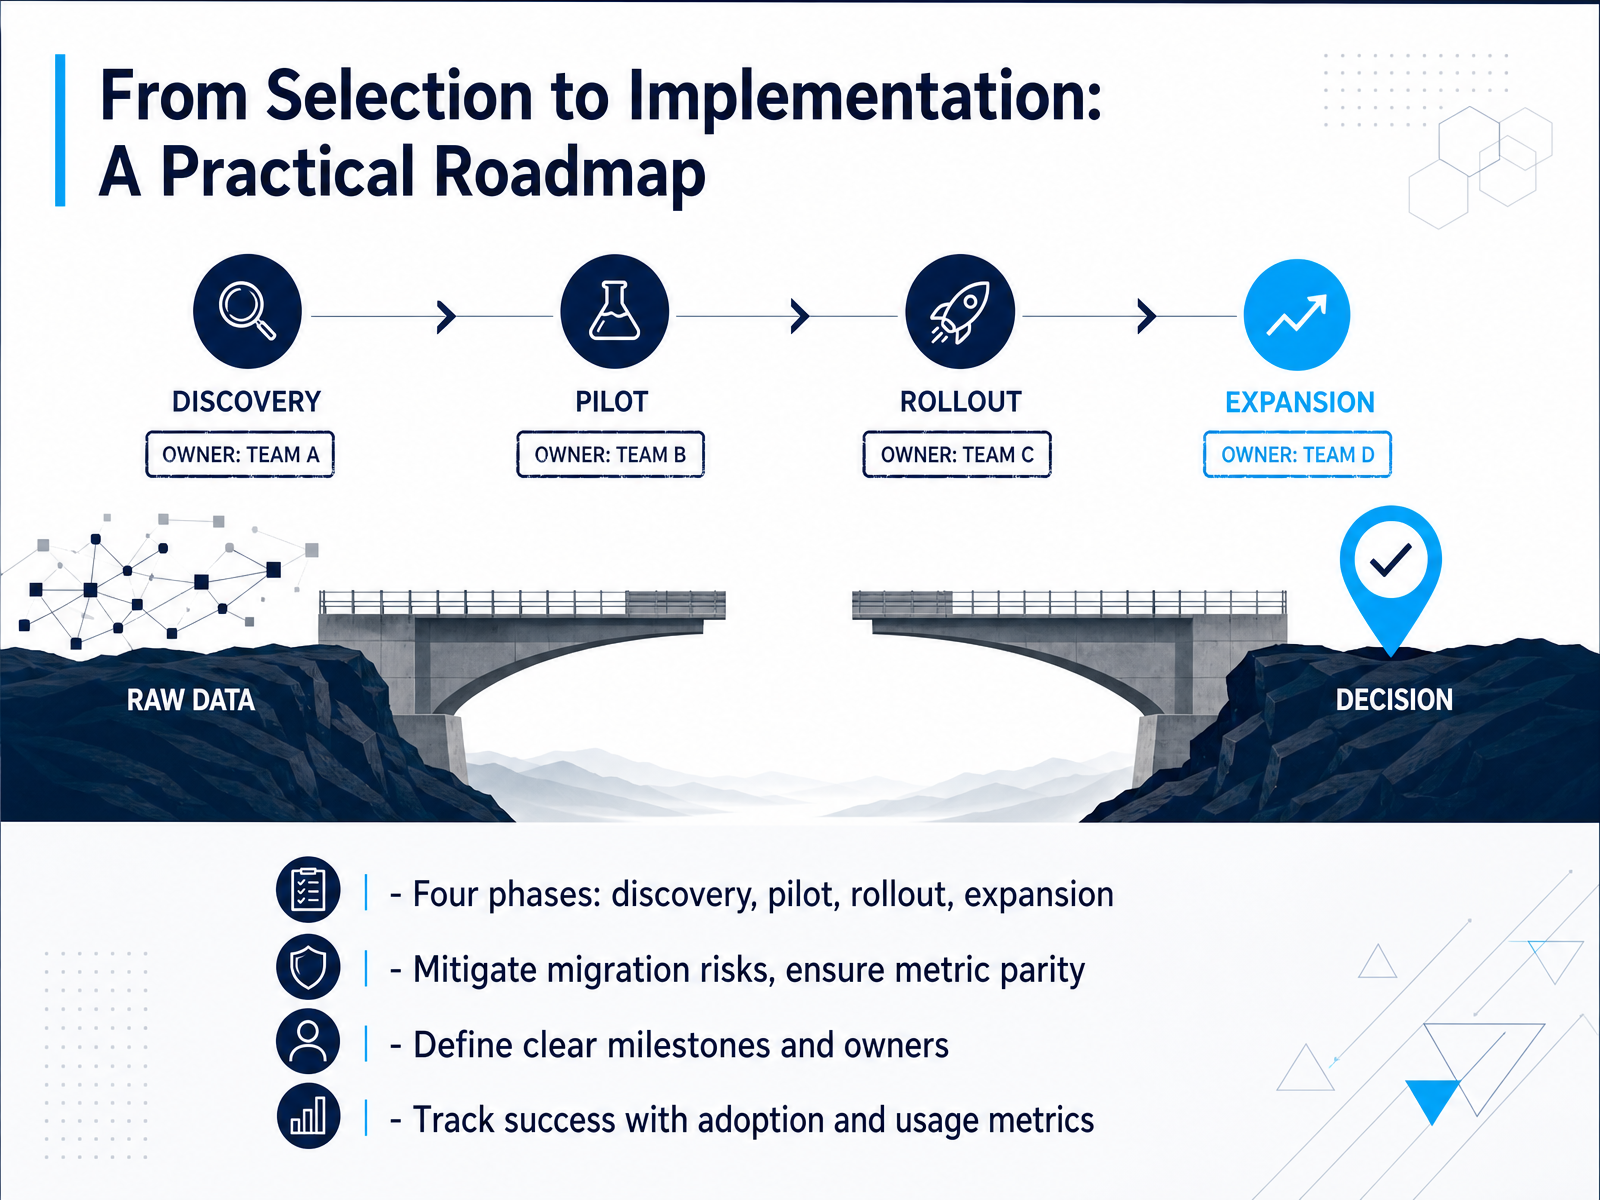
2 min - 12From Selection to Implementation: A Practical RoadmapSo how do we actually get from a shortlist to a working solution? It comes down to four disciplined phases: discovery, pilot, rollout, and expansion. Discovery means confirming the true requirements and mapping them to the vendor's capabilities, not just the marketing sheet. The pilot is your proof of concept with real data and real users, not a sandbox demo. Rollout is about structured change management, and expansion is where you scale to new teams and new use cases. Throughout all of this, the biggest risk is data migration. Protect yourself by planning for metric parity, meaning the new tool computes the same numbers as the old one, at least for a parallel period. Also, define clear milestones and name the owner for each one. If nobody owns go-live, it will slip. Finally, track success with adoption metrics, like active users and query frequency, because a platform that looks good but isn't used is just an expensive dashboard. The bottom line: treat this like a product launch, not an IT task. Next, let's talk about operationalizing the platform and measuring success over time.
 2 min
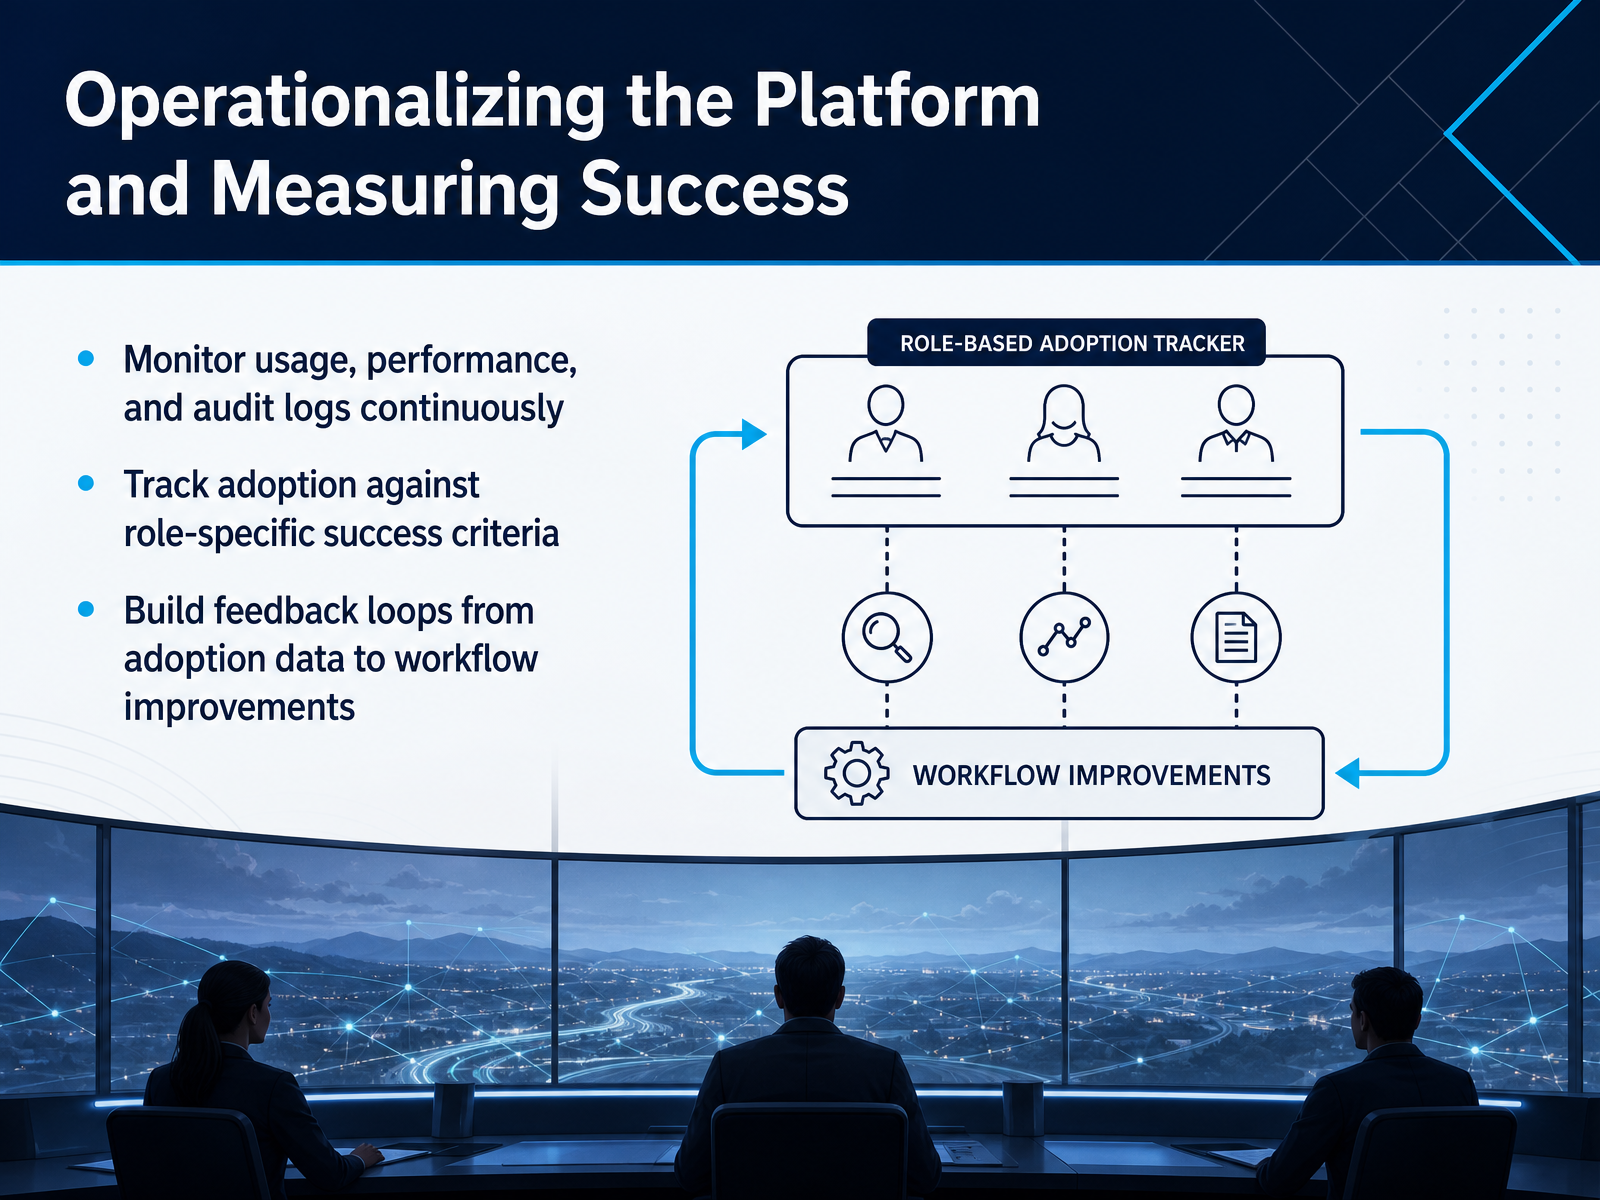
2 min - 13Operationalizing the Platform and Measuring SuccessNow that the platform is live, the real work begins: making sure it actually gets used and delivers value. Start by monitoring usage, performance, and audit logs continuously. This isn’t about watching dashboards for fun. It’s about catching issues before they become blockers. For example, if a critical report starts running slowly, you want to know before your finance team hits their Monday morning deadline. Next, track adoption against role-specific success criteria. A data engineer and a marketing analyst will use the platform very differently. Define what 'good' looks like for each role, and measure against that. Maybe it’s query volume for analysts, or pipeline freshness for engineers. Finally, build feedback loops from adoption data back into your workflow. If you see a feature being ignored, don’t assume it’s useless. Ask why. Use that insight to refine training or adjust the setup. The platform should evolve, not just exist. And that brings us to the evaluation playbook we’ll cover next—your structured way to keep this momentum going.
 2 min
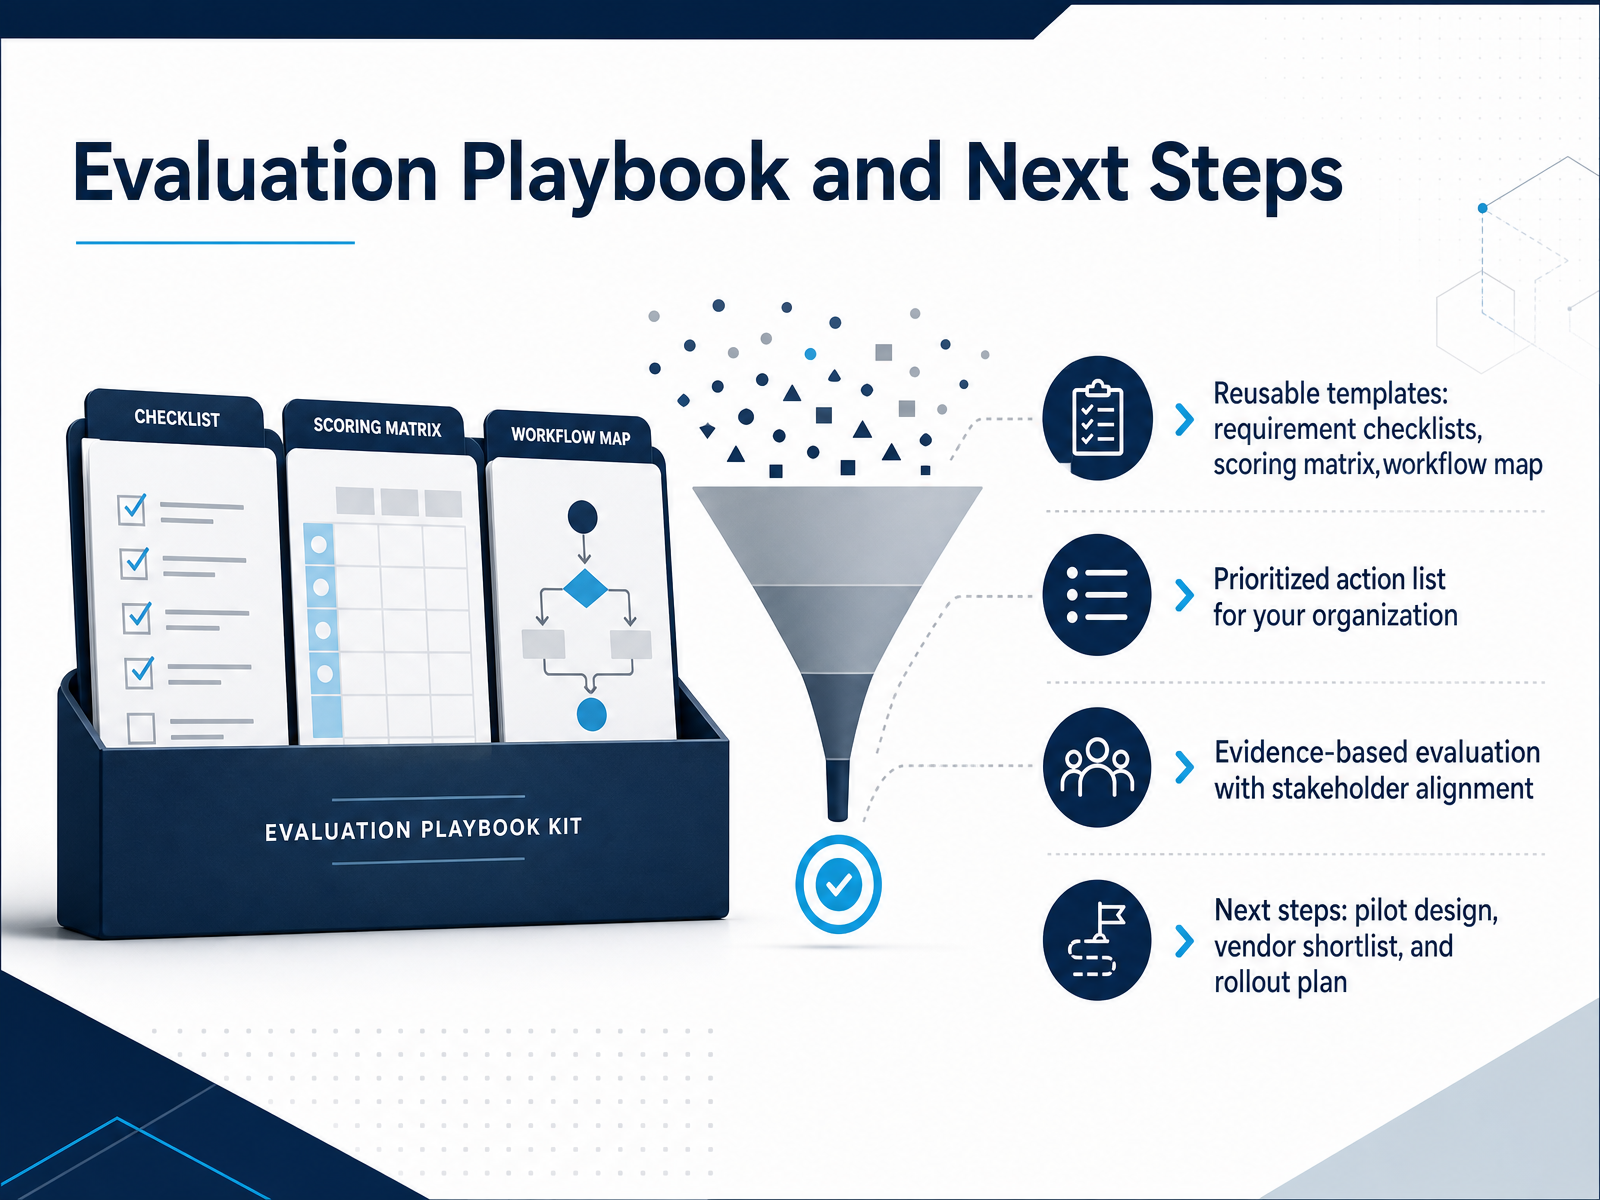
2 min - 14Evaluation Playbook and Next StepsWe have covered a lot of ground, so let’s bring it together with an evaluation playbook you can use right away. Start with the reusable templates: your requirement checklist, a scoring matrix, and a workflow map. These keep every decision transparent and repeatable. Next, build a prioritized action list that reflects your organization’s unique constraints—maybe data governance is your top concern, or perhaps speed to insight matters more. Then, make sure every choice is evidence-based and that your stakeholders are aligned on the criteria before you see any vendor demo. This prevents surprises later. Your next steps are clear: design a pilot that tests your top use cases, narrow the vendor shortlist to three or four, and draft a rollout plan with clear milestones and ownership. Remember, this is about making a confident, informed decision that your team will trust. Thank you for your attention today. You have the tools and the framework—now go evaluate with clarity and purpose. I wish you every success.
 2 min
2 min
Take the deck with you
Download this course as a file — free, no sign-up needed.
- PDF handoutEvery slide page, ready to print or share.15 pages · 3.4 MBDownload
- Narrated PowerPointThe deck that presents itself — every slide carries the digital human's narration video.15 pages · 15.7 MBDownload
- PowerPoint slidesThe full deck as a .pptx — open it in PowerPoint, Keynote, or Google Slides.15 pages · 3.3 MBDownload
Free to use in your own training — please keep the PersonWise credit page at the end.
Have your own deck? Turn it into a course