Business Process Intelligence
Begin
14 pages · ~28 min
Business Process Intelligence
Business Process Intelligence training provides professionals with tools and techniques to analyze, monitor, and optimize business processes using data-driven insights.
What you’ll learn
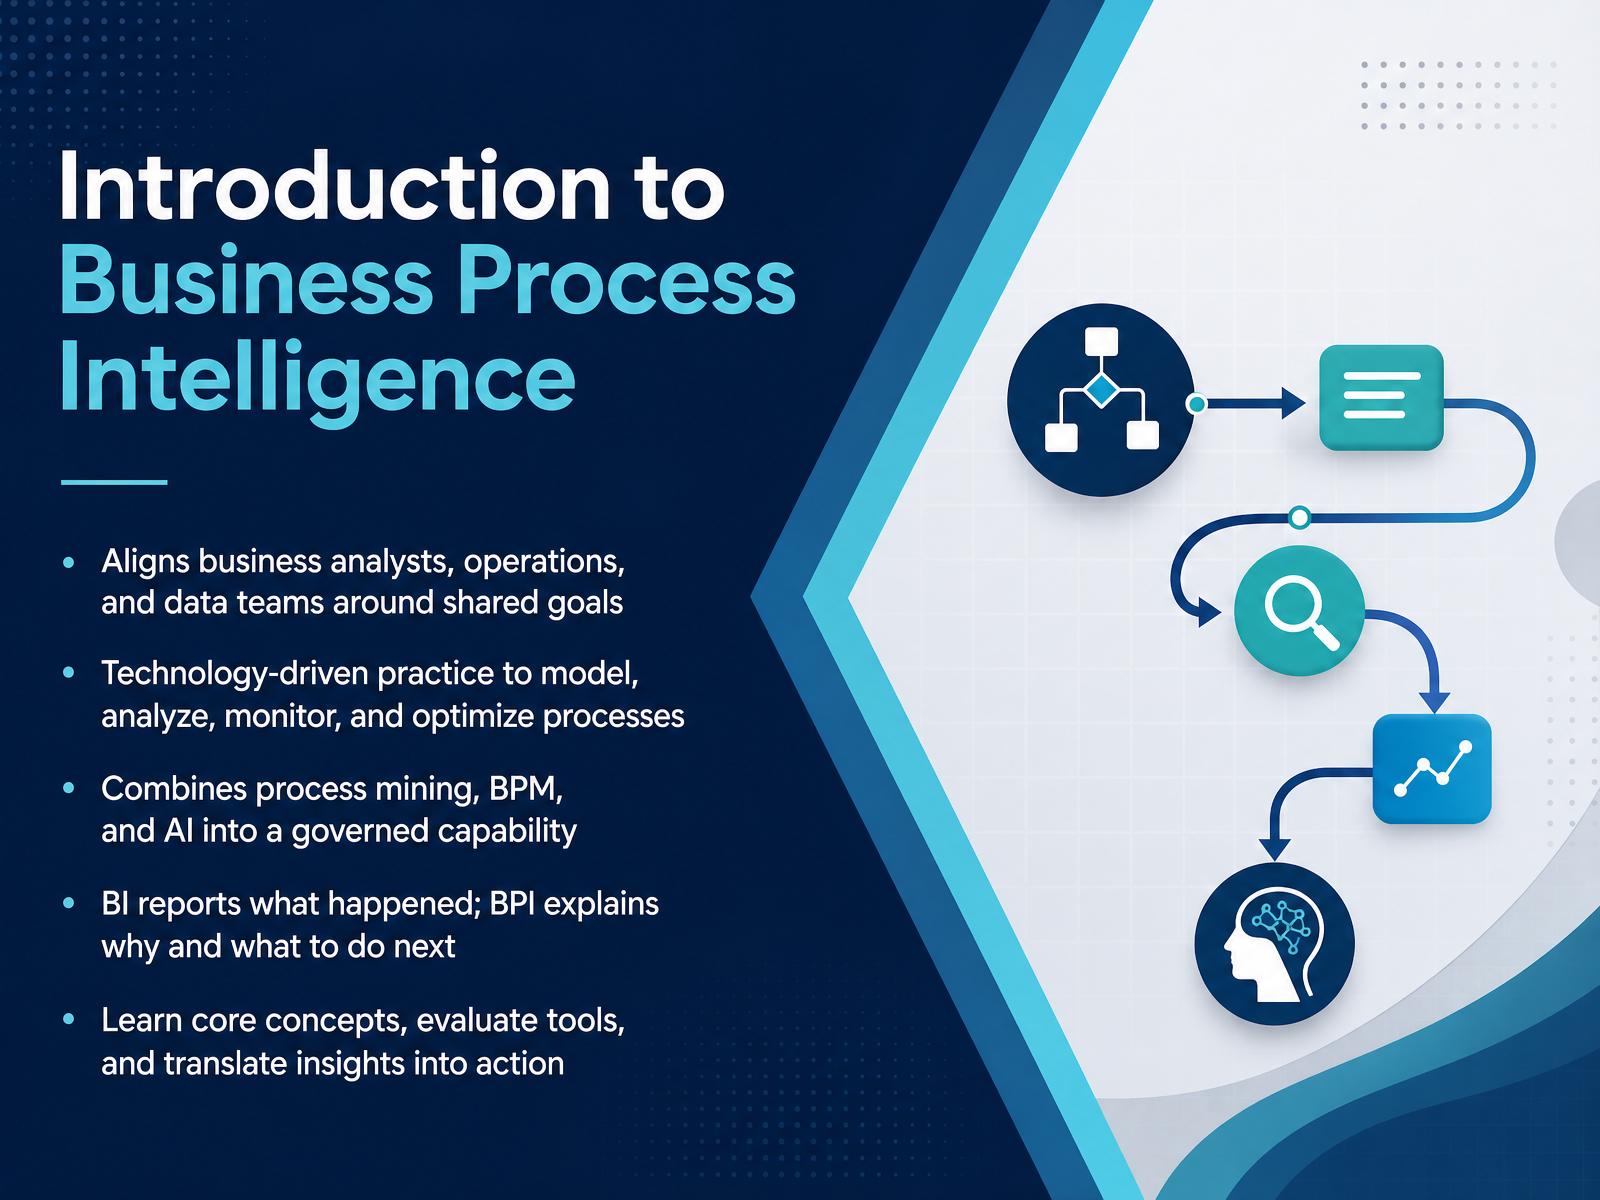
- 01Introduction to Business Process IntelligenceWelcome. Today we are going to talk about Business Process Intelligence, or BPI, and why it is becoming essential for teams like yours. Whether you work in business analysis, operations, or data, BPI gives us a shared language and a shared goal: understanding how work really happens and making it better. So what is it exactly? It is a technology-driven practice to model, analyze, monitor, and optimize how your processes actually run. It brings together process mining, business process management, and AI into one governed capability. Here is the key distinction. Traditional BI reports what happened. Business Process Intelligence explains why it happened, where in the process it happened, and what to do next. Instead of just seeing a KPI drop, you trace it back to a bottleneck in a specific handoff. Over the next few slides, we will cover the core concepts, how to evaluate tools, and how to translate these insights into action. Let's begin by looking at why this matters for your daily work.techtarget.comaris.comcamunda.com+21 min
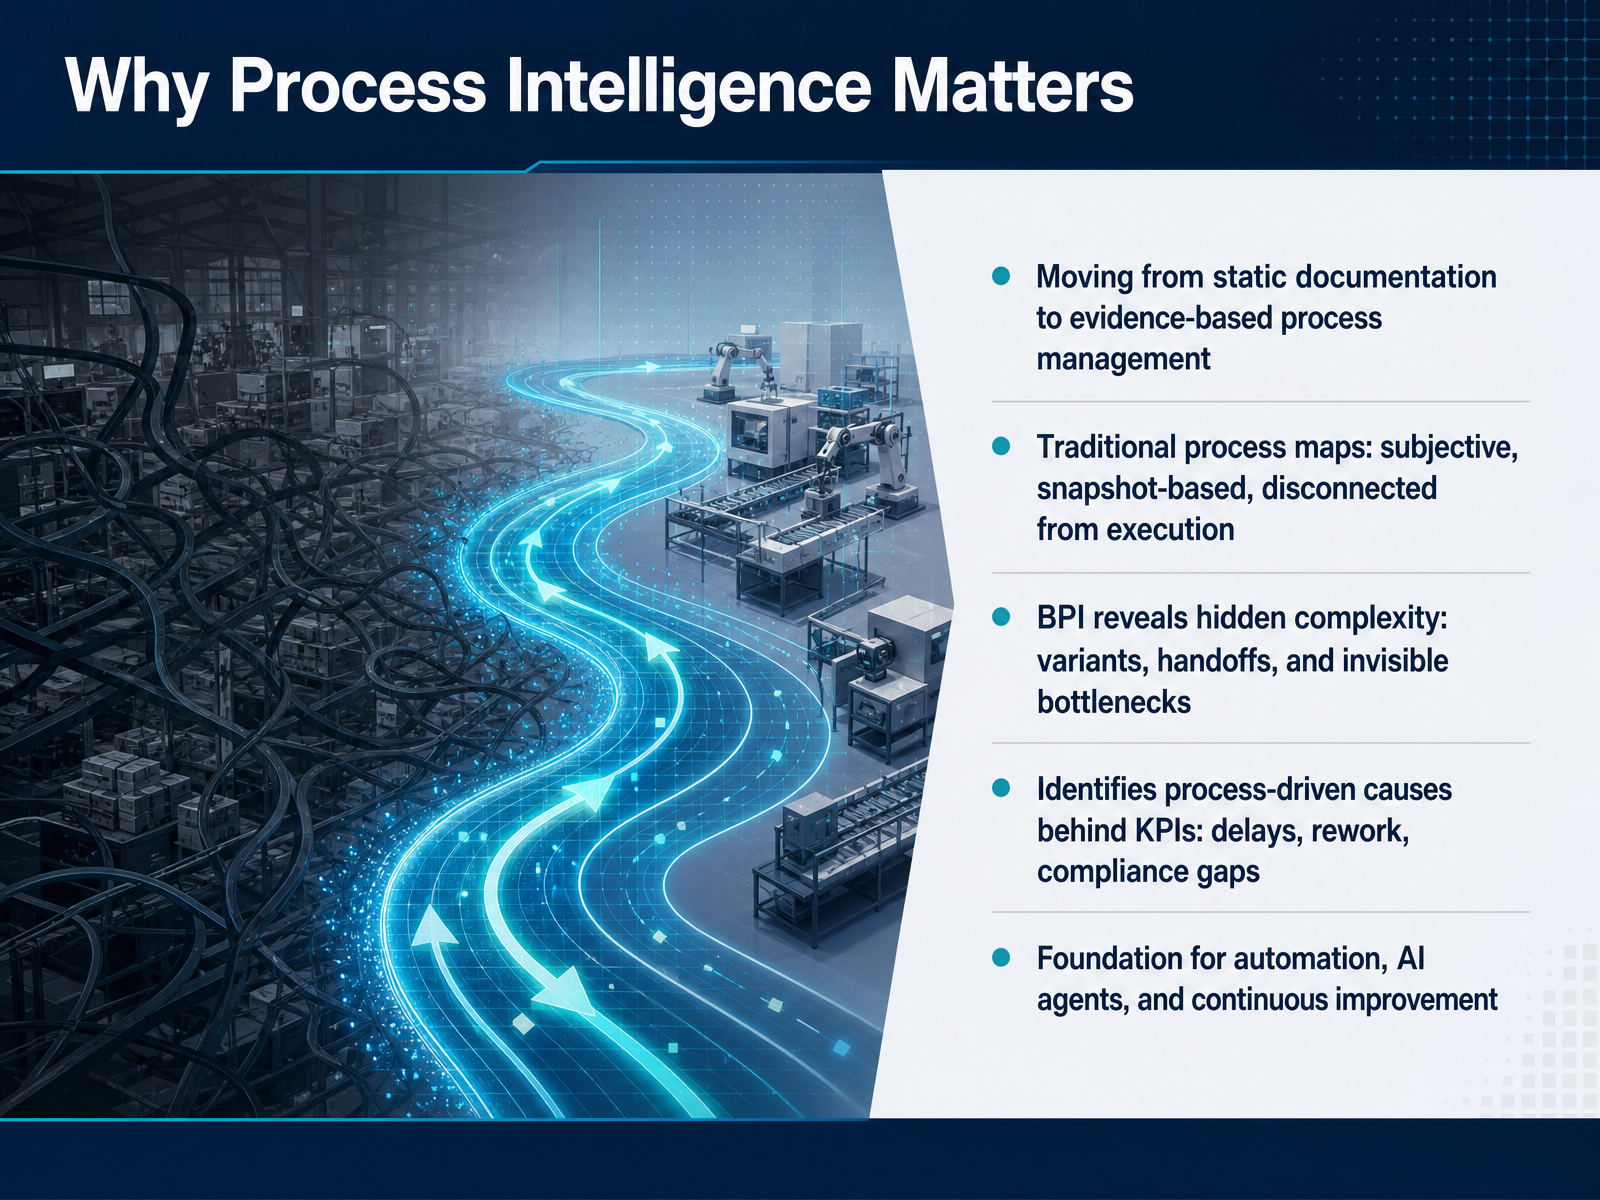
- 02Why Process Intelligence MattersLet’s talk about why process intelligence matters. For years, most organizations managed processes the same way: they drew a process map, documented the steps, and treated that as the truth. But those maps are static. They’re built from interviews and assumptions, and they rarely reflect what actually happens in your systems. Process intelligence changes that. It replaces subjective snapshots with evidence from your real execution data. When you pull the event log from your ERP or CRM, you see the process as it truly runs—not as it was designed. And that reveals what static documentation hides: process variants you didn’t know existed, handoffs that create delays, and bottlenecks that never show up on a whiteboard. Here’s the practical payoff. When a KPI like days sales outstanding or cycle time misses the target, process intelligence shows you the process-driven causes behind it—the rework loops, the approval delays, the compliance gaps. It answers the question business intelligence can’t: why did this happen? That same insight becomes the foundation for automation. You finally know which steps are worth automating, which AI agents can handle, and where to focus continuous improvement. In short, process intelligence turns your processes from guesswork into a measurable, improvable asset. Next, let’s look at the core building blocks: event logs and process data.
 techtarget.comaris.comcamunda.com+22 min
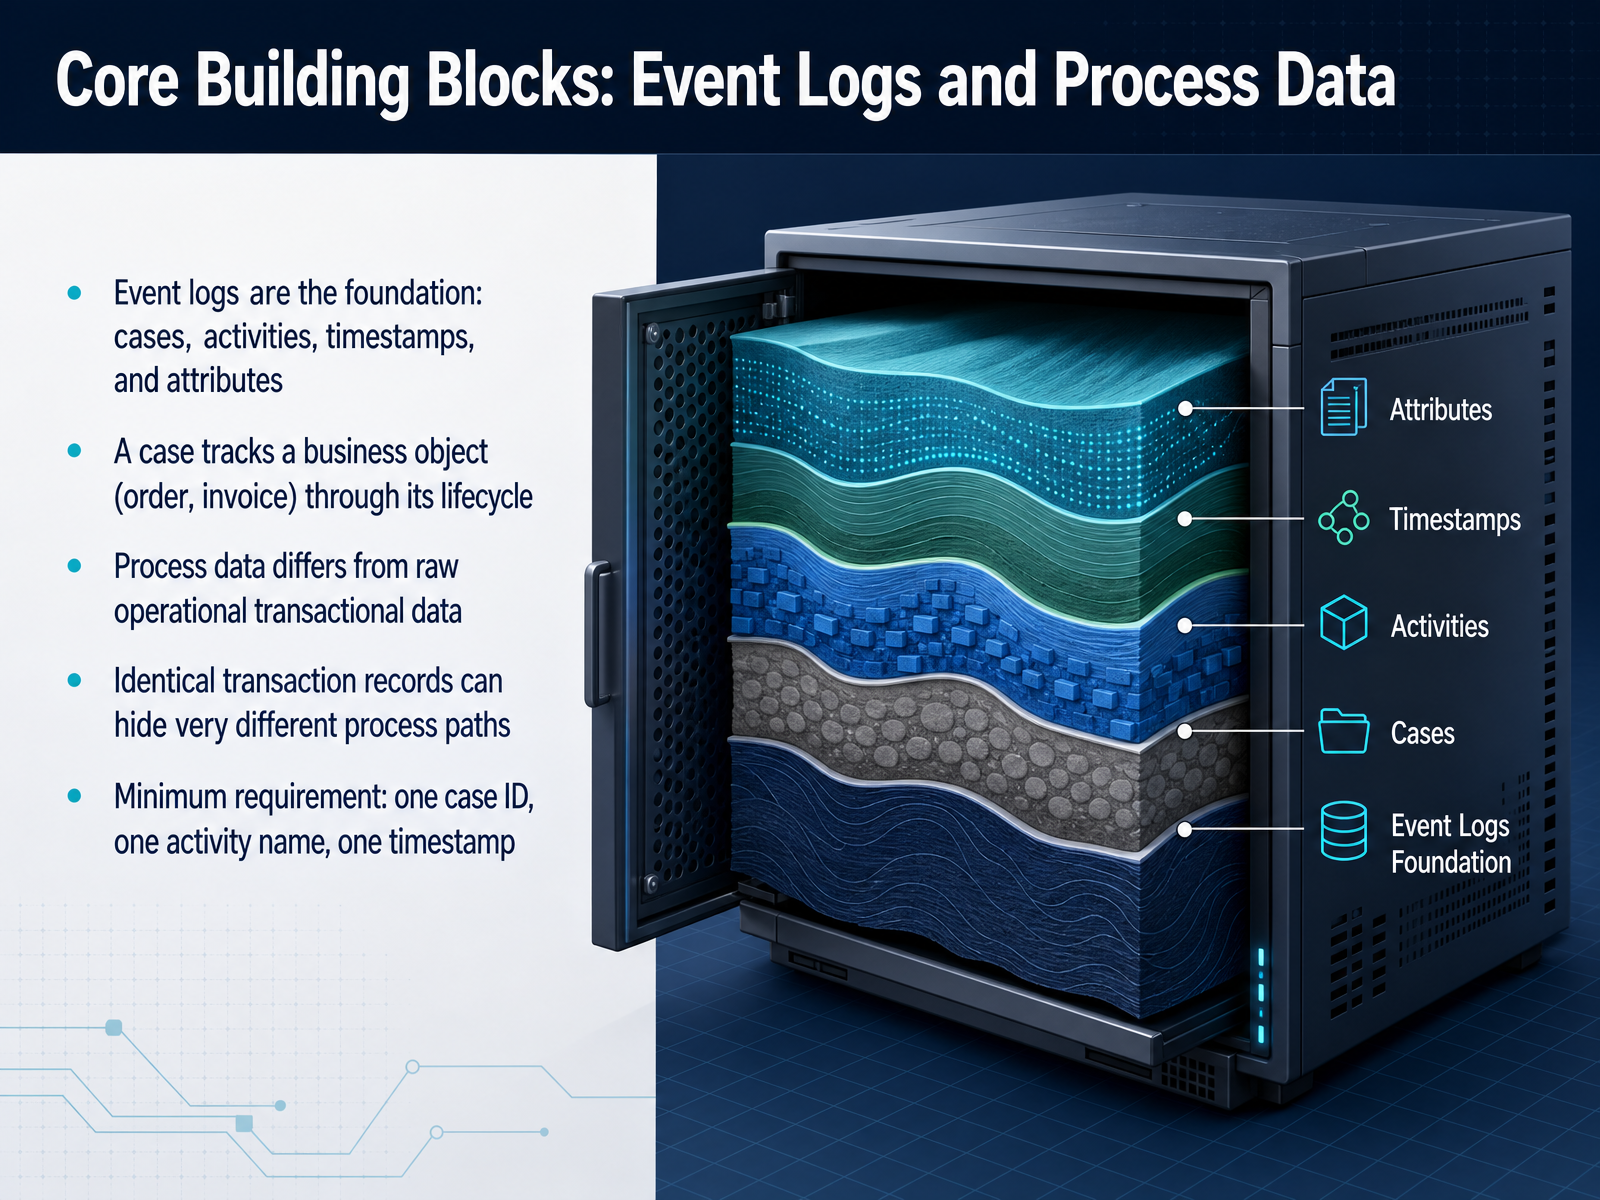
 - 03Core Building Blocks: Event Logs and Process DataNow let’s look at the core building blocks. Every process intelligence project starts with one thing: the event log. Think of it as the digital footprint of your process. Each log contains cases, activities, timestamps, and attributes. A case tracks a single business object, like an order or an invoice, through its entire lifecycle. This is where process data differs from ordinary transactional data. Transactional records tell you a step happened. Process data tells you the sequence of steps for a specific case. Two identical transactions on a report can actually come from completely different process paths. One invoice might flow through approval, while another skips it entirely. The minimum requirement for any analysis is just three fields: a case identifier, an activity name, and a timestamp. With that, you can start reconstructing the actual flow of work. This is the foundation. Once you understand the event log structure, we can move into how we turn that data into insights. Next, we will cover the analytical methods used: discovery, conformance, and performance analysis.
 techtarget.comaris.comcamunda.com+21 min
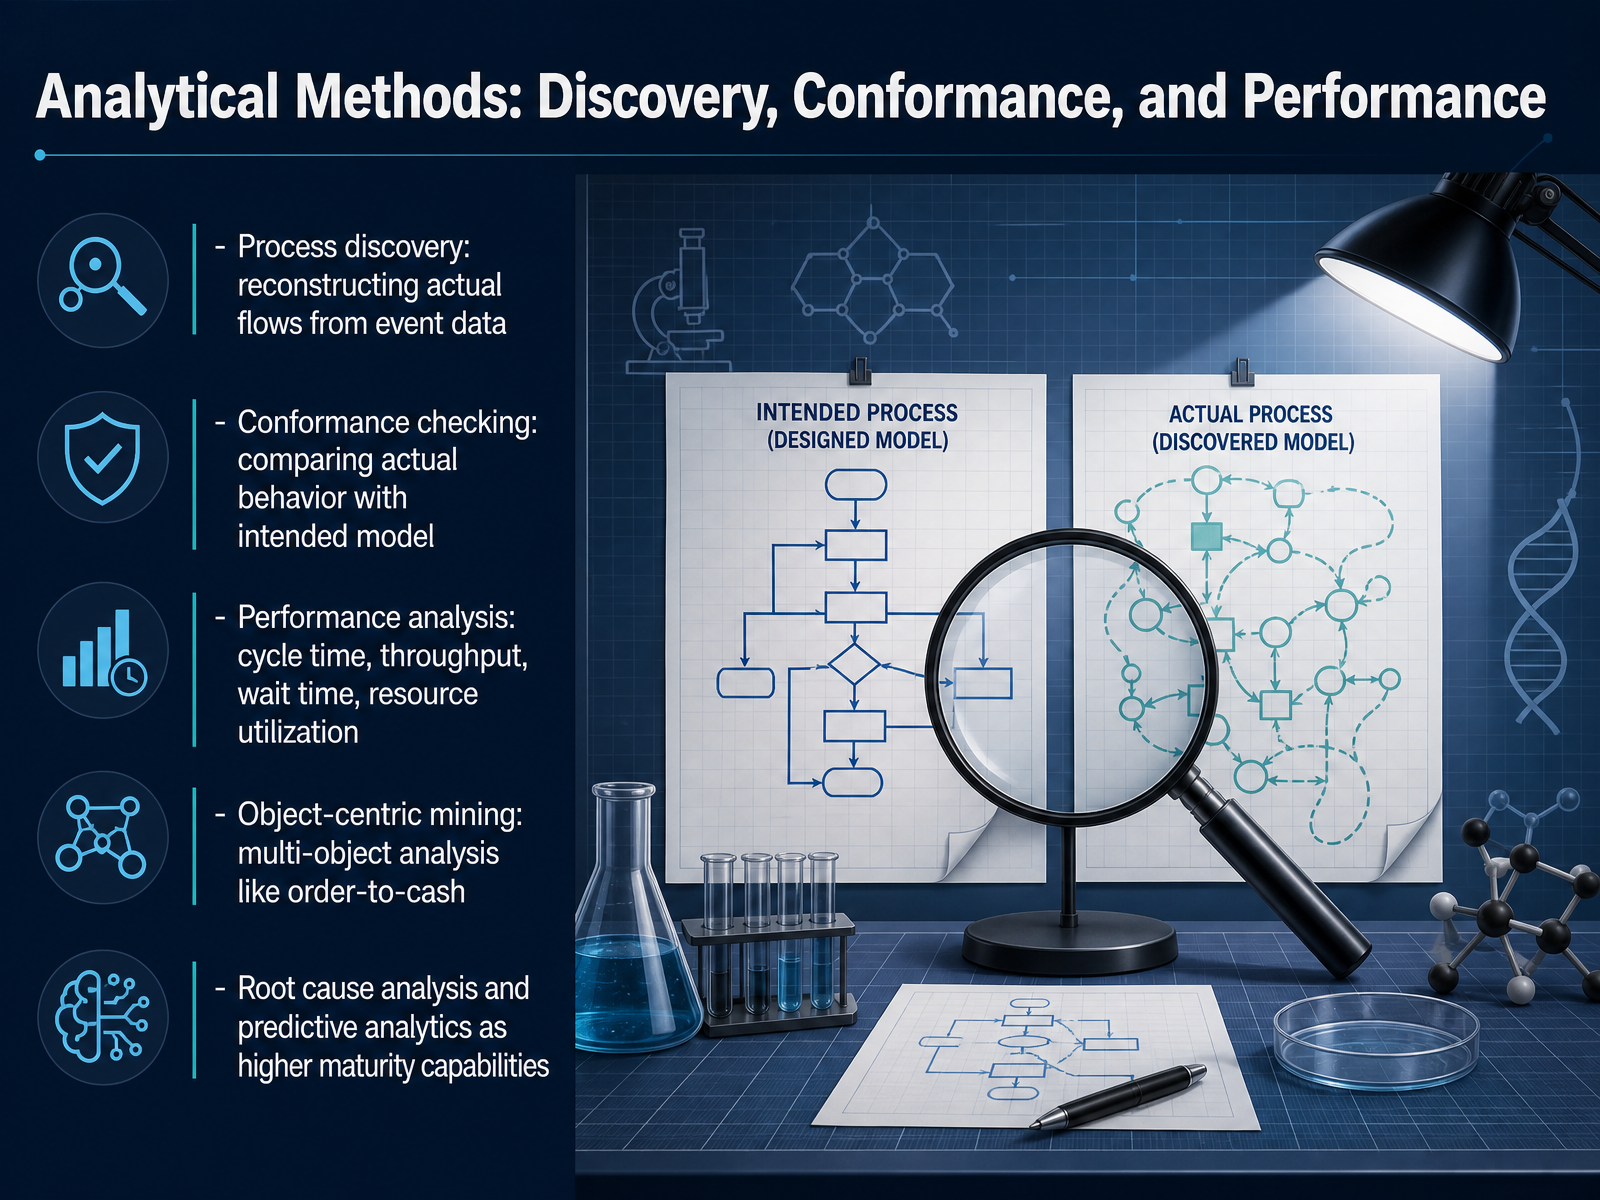
 - 04Analytical Methods: Discovery, Conformance, and PerformanceLet’s turn to the core analytical methods that make process intelligence actionable. The first is process discovery. When you pull the event log from your ERP or CRM, the system reconstructs the actual flow of work, showing every variant and deviation from what you might have expected. This reveals the real process, not the idealized one in your documentation. Second is conformance checking. Here, you compare actual behavior against the intended model. This flags skipped approvals, unauthorized steps, and policy violations as they happen, which directly supports your compliance efforts. Then we have performance analysis. This is where you quantify cycle time, throughput, wait time, and resource utilization across each step. It pinpoints the exact bottleneck inflating your lead times. For more complex, multi-object environments, object-centric mining is essential. It tracks orders, items, invoices, and shipments simultaneously, giving you a true end-to-end view of order-to-cash. Finally, as your maturity grows, you move into root cause analysis and predictive analytics. These capabilities answer why a deviation occurs and what is likely to happen next, enabling the step from reactive reporting to prescriptive action. We will explore the tangible outputs of these methods next.
 techtarget.comaris.comcamunda.com+22 min
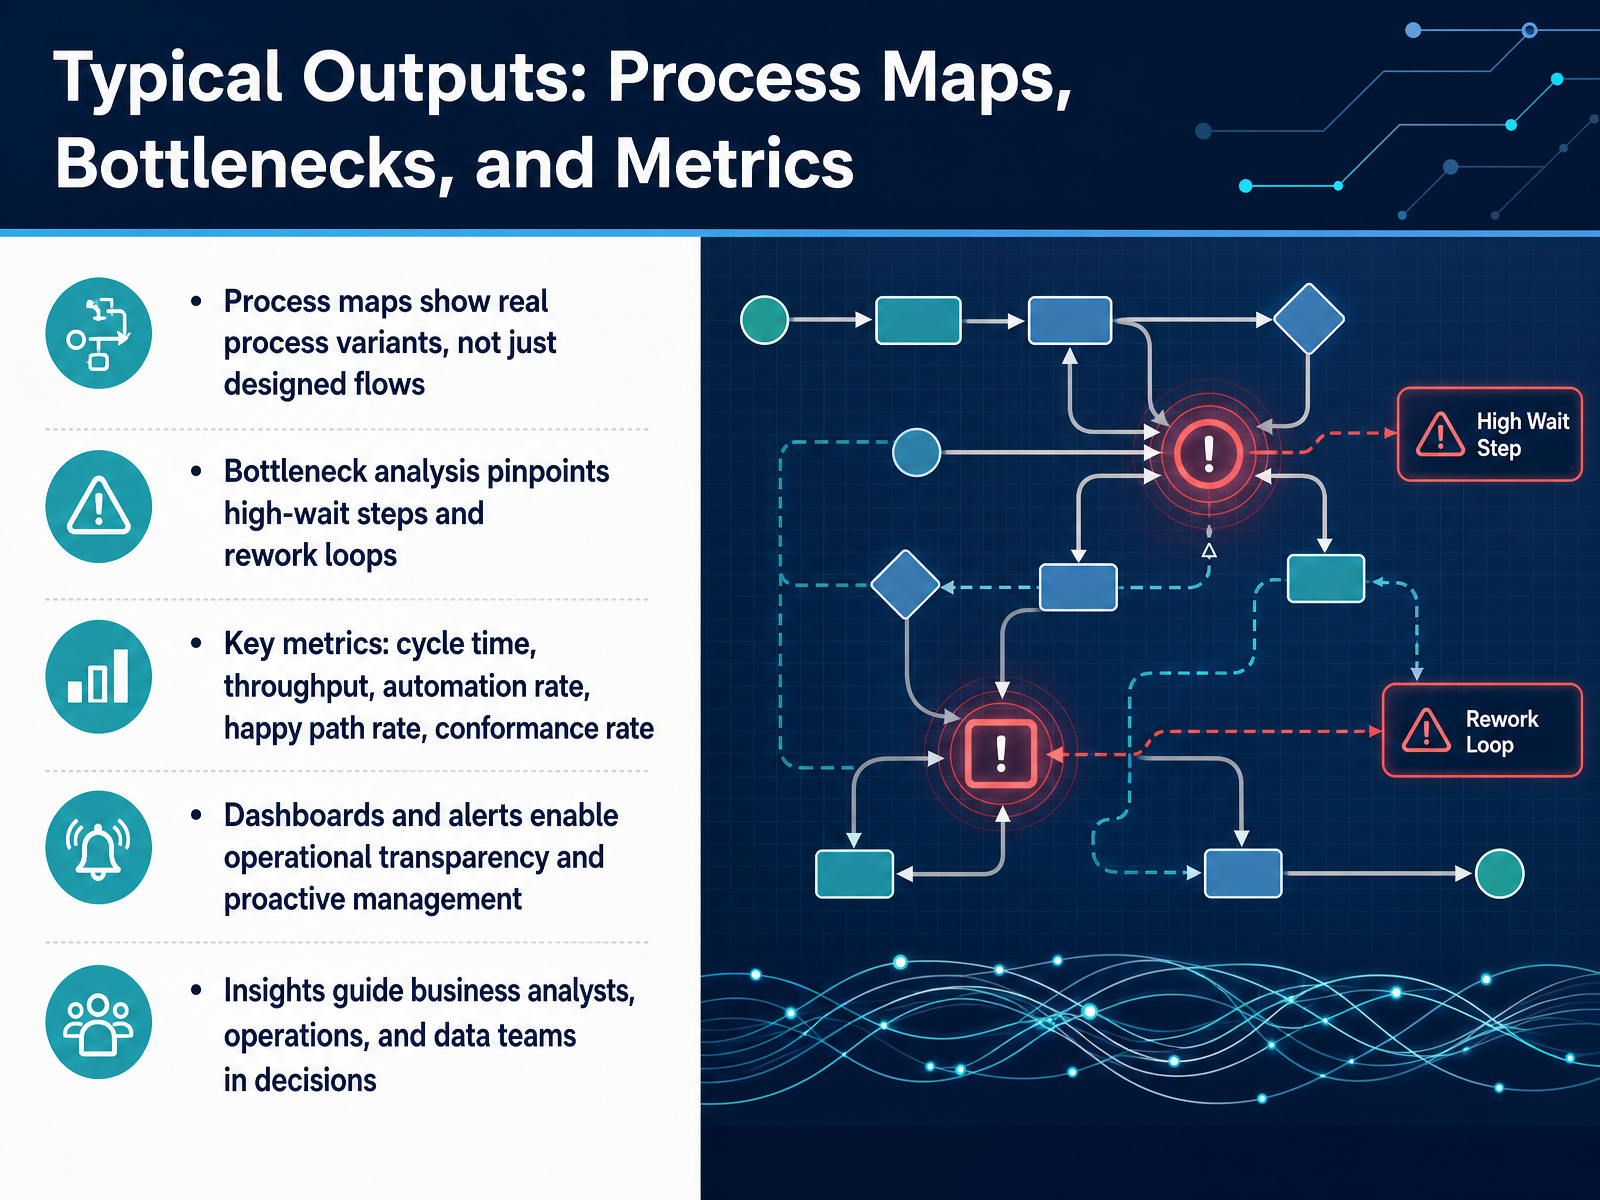
 - 05Typical Outputs: Process Maps, Bottlenecks, and MetricsNow let's look at what process intelligence actually puts in front of you. The first output is a process map. But don't expect the ideal flow from your training manual. The map shows the real process, with all its variants. You will often find dozens, even thousands, of different paths. That is the starting point for improvement, not a problem in itself. Next, bottleneck analysis pinpoints where work waits longest and where rework loops add cost. Maybe invoicing stalls because of missing approvals, or a master data error forces endless corrections. The platform highlights those exact steps. Then come the key metrics. Cycle time, throughput, automation rate, happy path rate, and conformance rate. These tell you how fast work moves, how much is automated, and how often reality matches the intended process. Dashboards and alerts turn this into operational transparency. You can monitor health in real time and get notified the moment a KPI dips or an SLA is at risk. That means you move from fixing problems after they happen to preventing them in the first place. For business analysts, this confirms where to act. For operations, it prioritizes their daily work. And for data teams, it provides a governed, fact-based foundation for decisions. Together, these outputs create a shared language across your organization. Next, we will look at the tools and technology landscape that make this possible.
 qpr.comcelonis.comibm.com+22 min
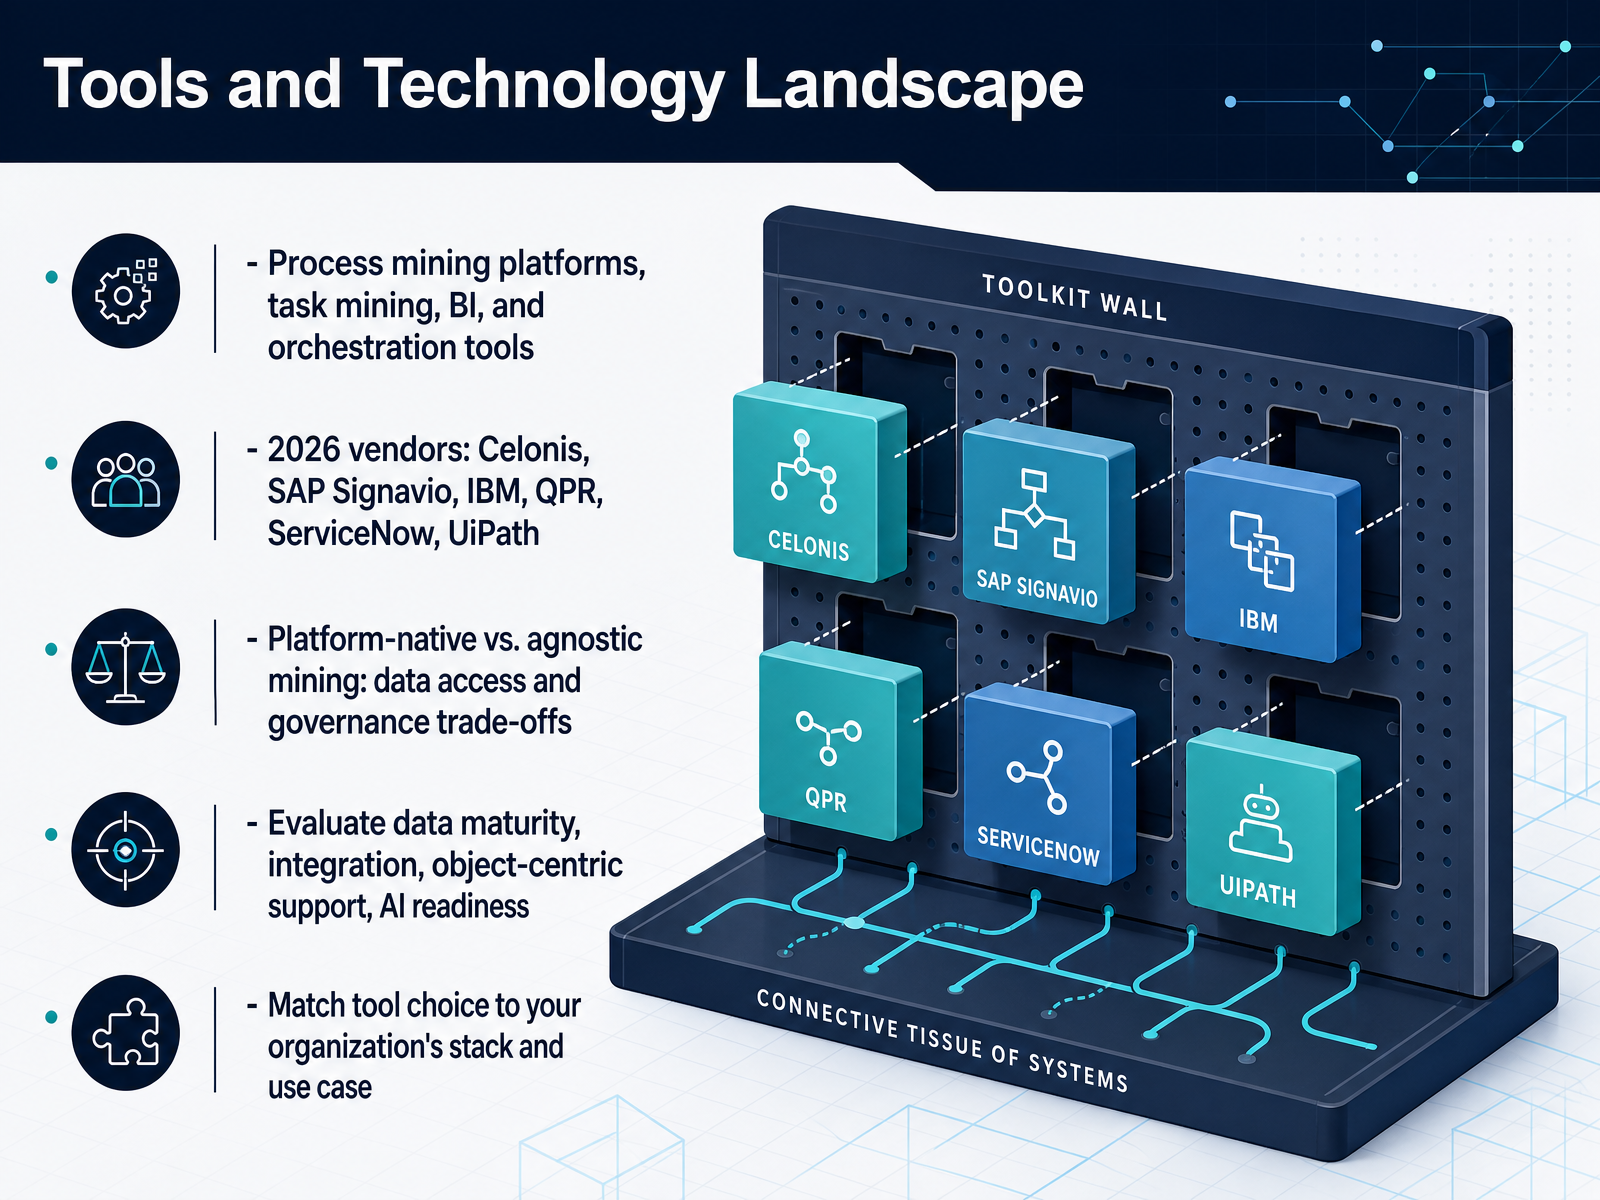
 - 06Tools and Technology LandscapeNow let's look at the tool landscape for business process intelligence. You have four main categories to consider: process mining platforms, task mining, traditional business intelligence, and orchestration tools. The 2026 vendor space is active. Celonis, SAP Signavio, IBM, QPR, ServiceNow, and UiPath are the names you will see most often. A core decision is whether to go platform-native or agnostic. Platform-native tools, like SAP Signavio inside the SAP ecosystem, give you deep, pre-built connectors and faster setup. But they can lock you into that vendor's data model. Agnostic miners, like Celonis or QPR, sit across your entire stack and give you a neutral view, but you own more of the governance work. When you evaluate, focus on data maturity, integration effort, object-centric support, and AI readiness. If your processes span supply chain or order-to-cash, object-centric mining is a hard requirement. Match the tool to your stack. A deep SAP environment may favor Signavio, while a multi-system landscape may point you toward a vendor-neutral layer. The right choice is the one that fits your use case. Next, we will walk through the common use cases, from order-to-cash to procure-to-pay and beyond.
 qpr.comcelonis.comibm.com+22 min
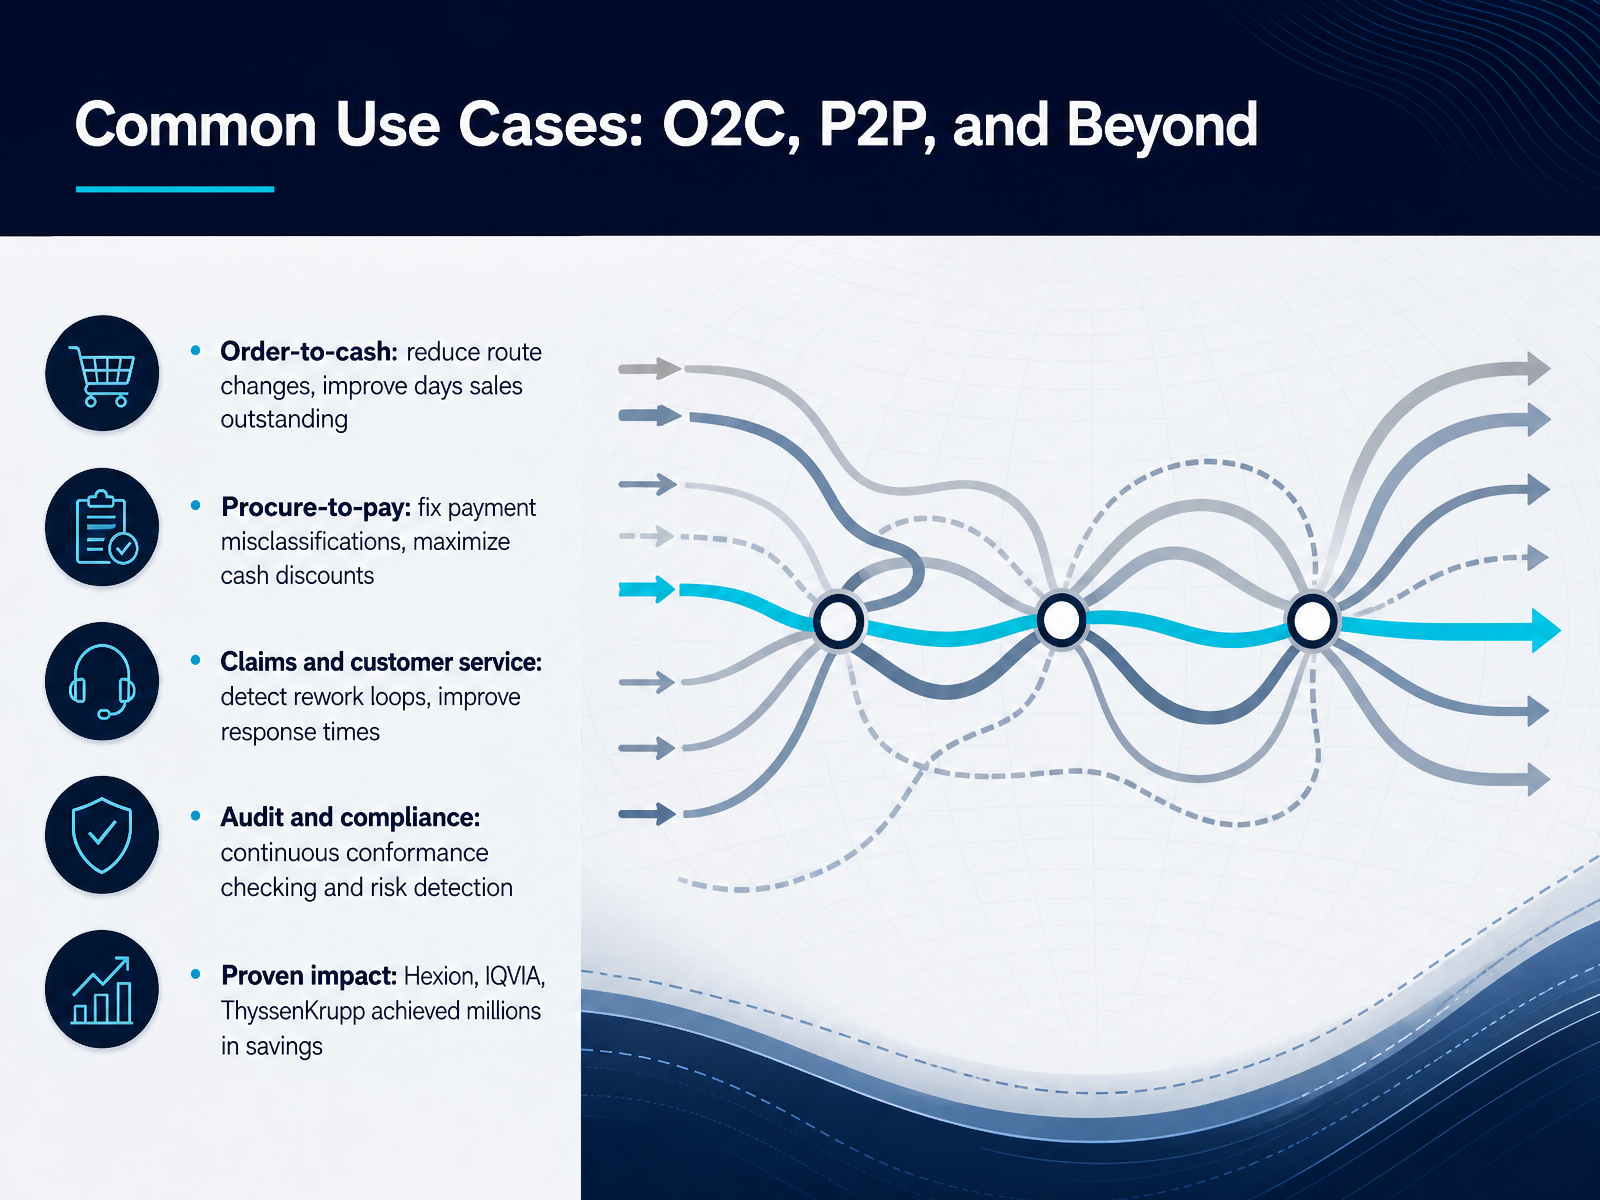
 - 07Common Use Cases: O2C, P2P, and BeyondLet's look at where process intelligence delivers the most value. The classic starting points are order-to-cash and procure-to-pay. In order-to-cash, you can reduce route changes by fixing master data errors, and improve days sales outstanding by predicting which customers will pay late. In procure-to-pay, process mining surfaces payment misclassifications, like the nearly thirty million dollars in invoices IQVIA found with incorrect terms. Fixing that freed up working capital and extended their days payable outstanding. You can also maximize cash discounts by identifying invoices where early payment actually makes financial sense. Beyond those two, claims and customer service teams use these tools to detect rework loops and speed up response times. Audit and compliance teams apply continuous conformance checking to catch deviations from policy in real time. The impact is proven. Hexion reduced route changes by forty-five percent, IQVIA cut shared service costs by forty percent, and ThyssenKrupp saved tens of millions in working capital. Those results come from turning process data into targeted action. Next, we'll look at the roles and collaboration that make these initiatives stick.
 cio.comcelonis.comdocumentation.celonis.com+22 min
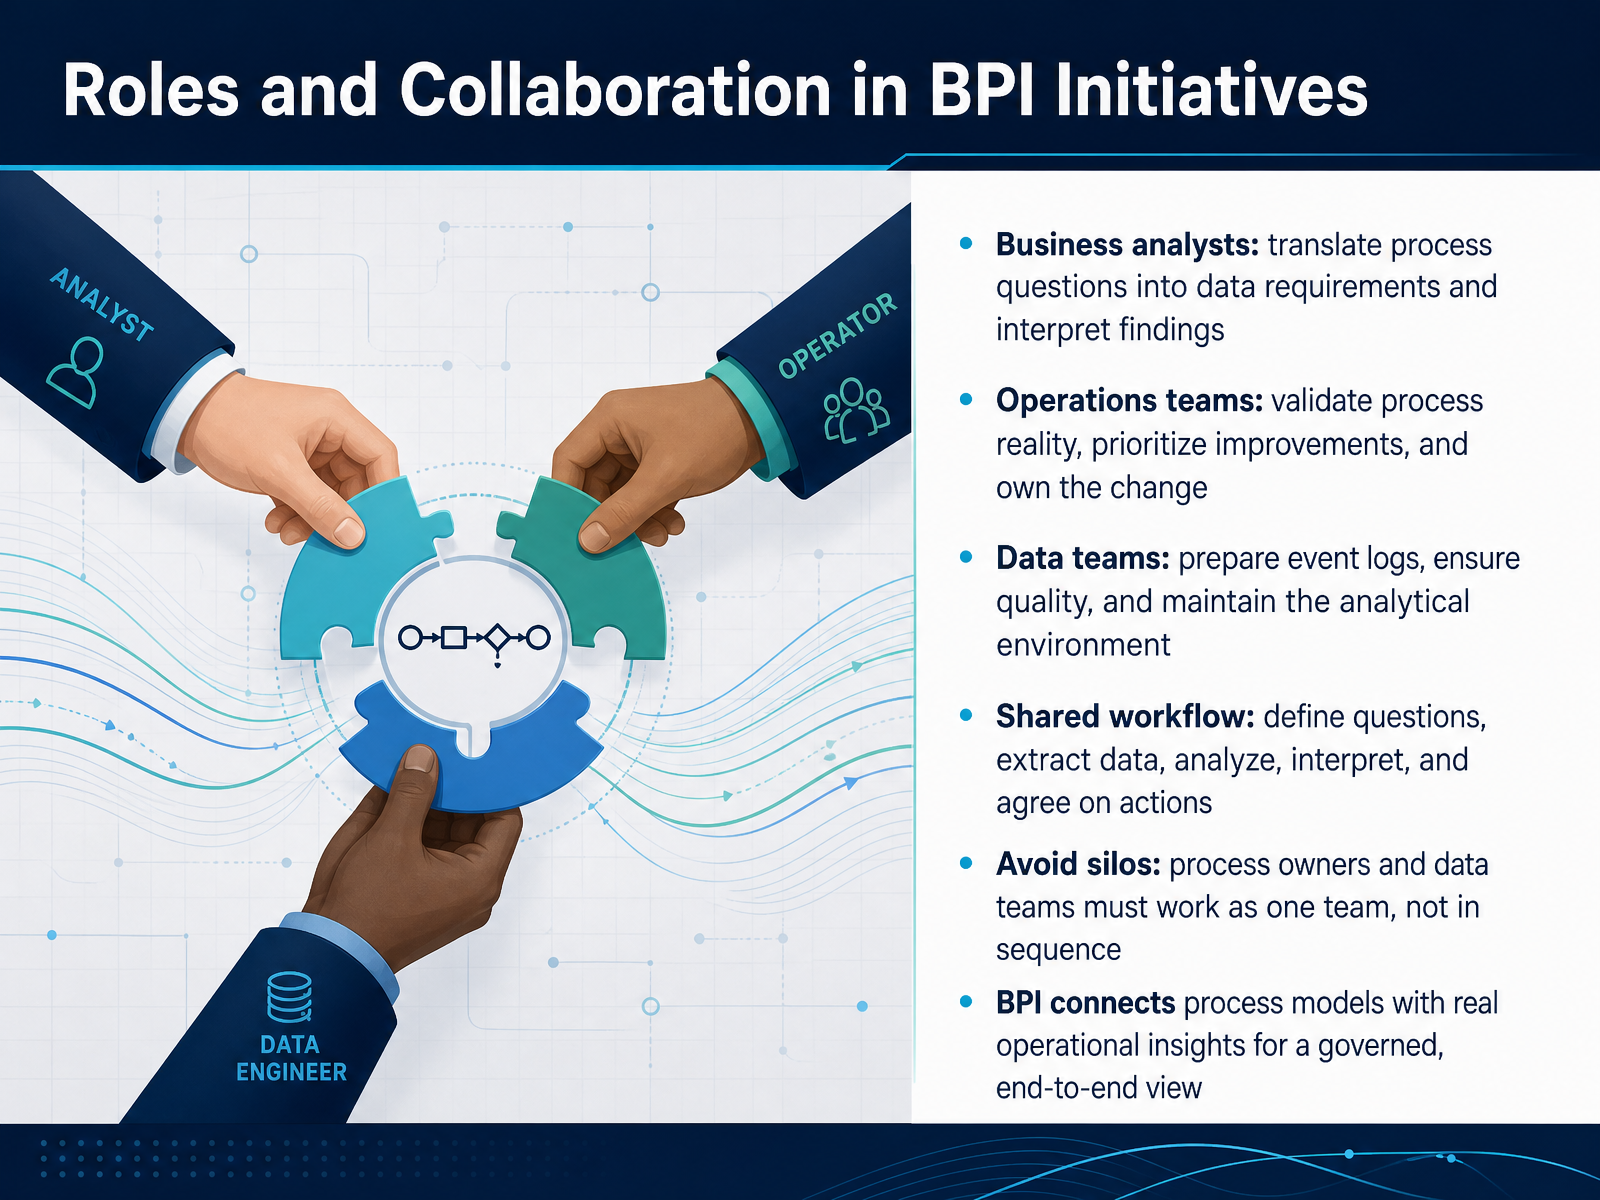
 - 08Roles and Collaboration in BPI InitiativesNow let's talk about who needs to be in the room for a Business Process Intelligence initiative to succeed. The reality is, this is not a data project or a process project. It's a shared discipline. Business analysts translate process questions into concrete data requirements and, just as importantly, interpret what the findings actually mean for operations. Operations teams validate that the process reality matches what the system logs show, prioritize which improvements to tackle first, and take ownership of making the change stick. And the data team prepares the event logs, secures the analytical environment, and ensures the quality of everything feeding the analysis. The workflow should be cyclical: define questions, extract data, analyze, interpret, and agree on actions. If these teams work in sequence, you create silos and lose momentum. Process owners and data teams need to operate as one unit, not hand off work to each other. When that collaboration works, BPI connects approved process models with real operational insights, giving you a governed, end-to-end view that everyone trusts. Next, we will talk about the foundation of all of this: data readiness and quality.
 techtarget.comaris.comcamunda.com+22 min
 - 09Data Readiness and QualityNow let's talk about the foundation that makes all of this possible: data readiness. When you pull the event log from your ERP or CRM, you need three fields for every entry: a case identifier, an activity name, and a timestamp. Without these, process mining cannot reconstruct the journey of a single order, claim, or customer request. The first thing to check is completeness. Are there missing events? Are case IDs consistent, or do duplicate and unreliable identifiers appear? These gaps produce false variants and phantom bottlenecks. So build data validation checks into the pipeline. Document the gaps openly, and flag them for review rather than silently dropping records. Also, involve IT and system owners early. They know which logs are trustworthy and where governance constraints live. Getting them on board from the start prevents rework later. Here is the takeaway: data readiness determines how quickly you see value from business process intelligence. Clean, validated logs shorten the time to insight dramatically. Next, we will shift from preparation to action, looking at how you prioritize and measure improvements once the insights are in hand.
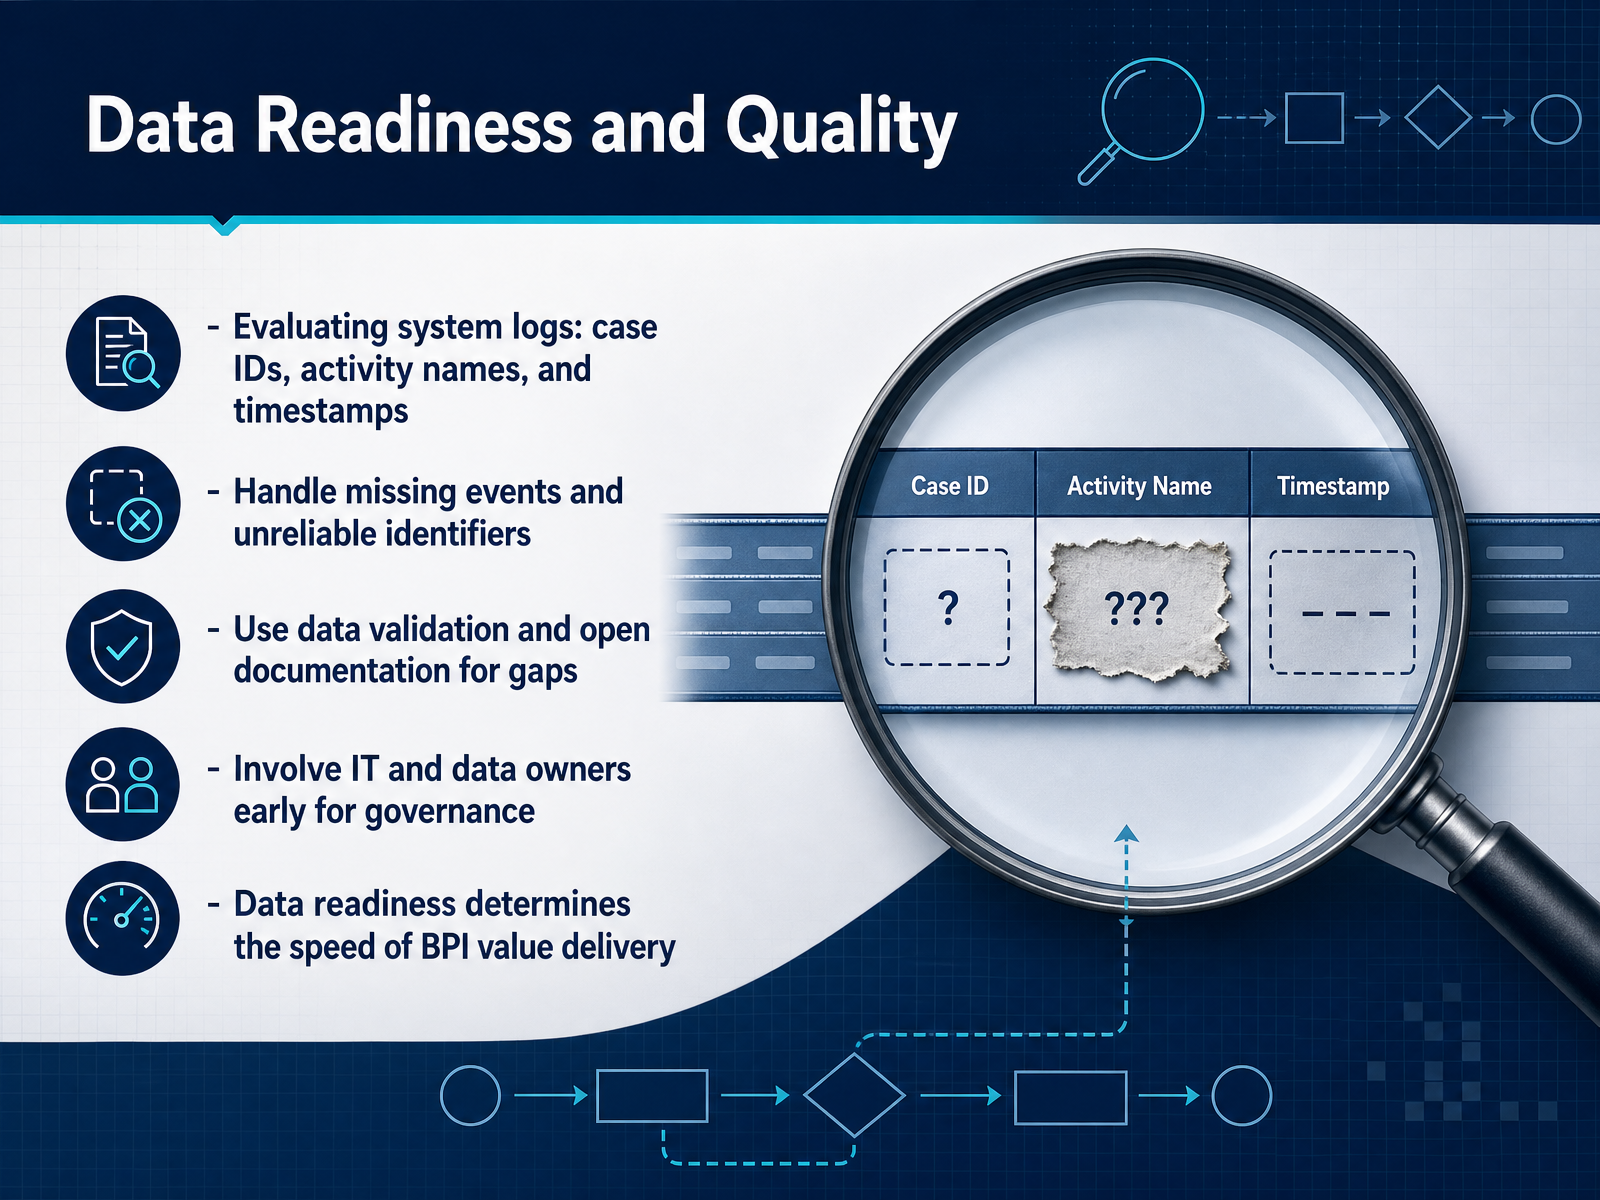 techtarget.comaris.comcamunda.com+22 min
 - 10From Insights to Action: Prioritizing and Measuring ImprovementNow we move from insight to action. The goal here is not just a problem list. It is a prioritized improvement backlog. You rank opportunities by impact, so your team works on what matters most first. Set measurable targets up front, like cycle time, error rate, working capital, or automation rate. That gives you a clear baseline and a clear definition of done. Before rolling out any change, use what-if simulation or a digital twin. This lets you test the impact in a virtual model first, which de-risks the change before it touches production. Then close the loop. Monitor the same KPIs before and after the change to prove the impact. This turns improvement from a one-time event into a continuous cycle. The insights you gain will also point directly to automation and redesign opportunities, which keeps the momentum going. Remember, an insight only has value when it drives a decision. A prioritized backlog with measurable targets is how you get there. Next, we will cover how to get started with your first project and secure those early quick wins.
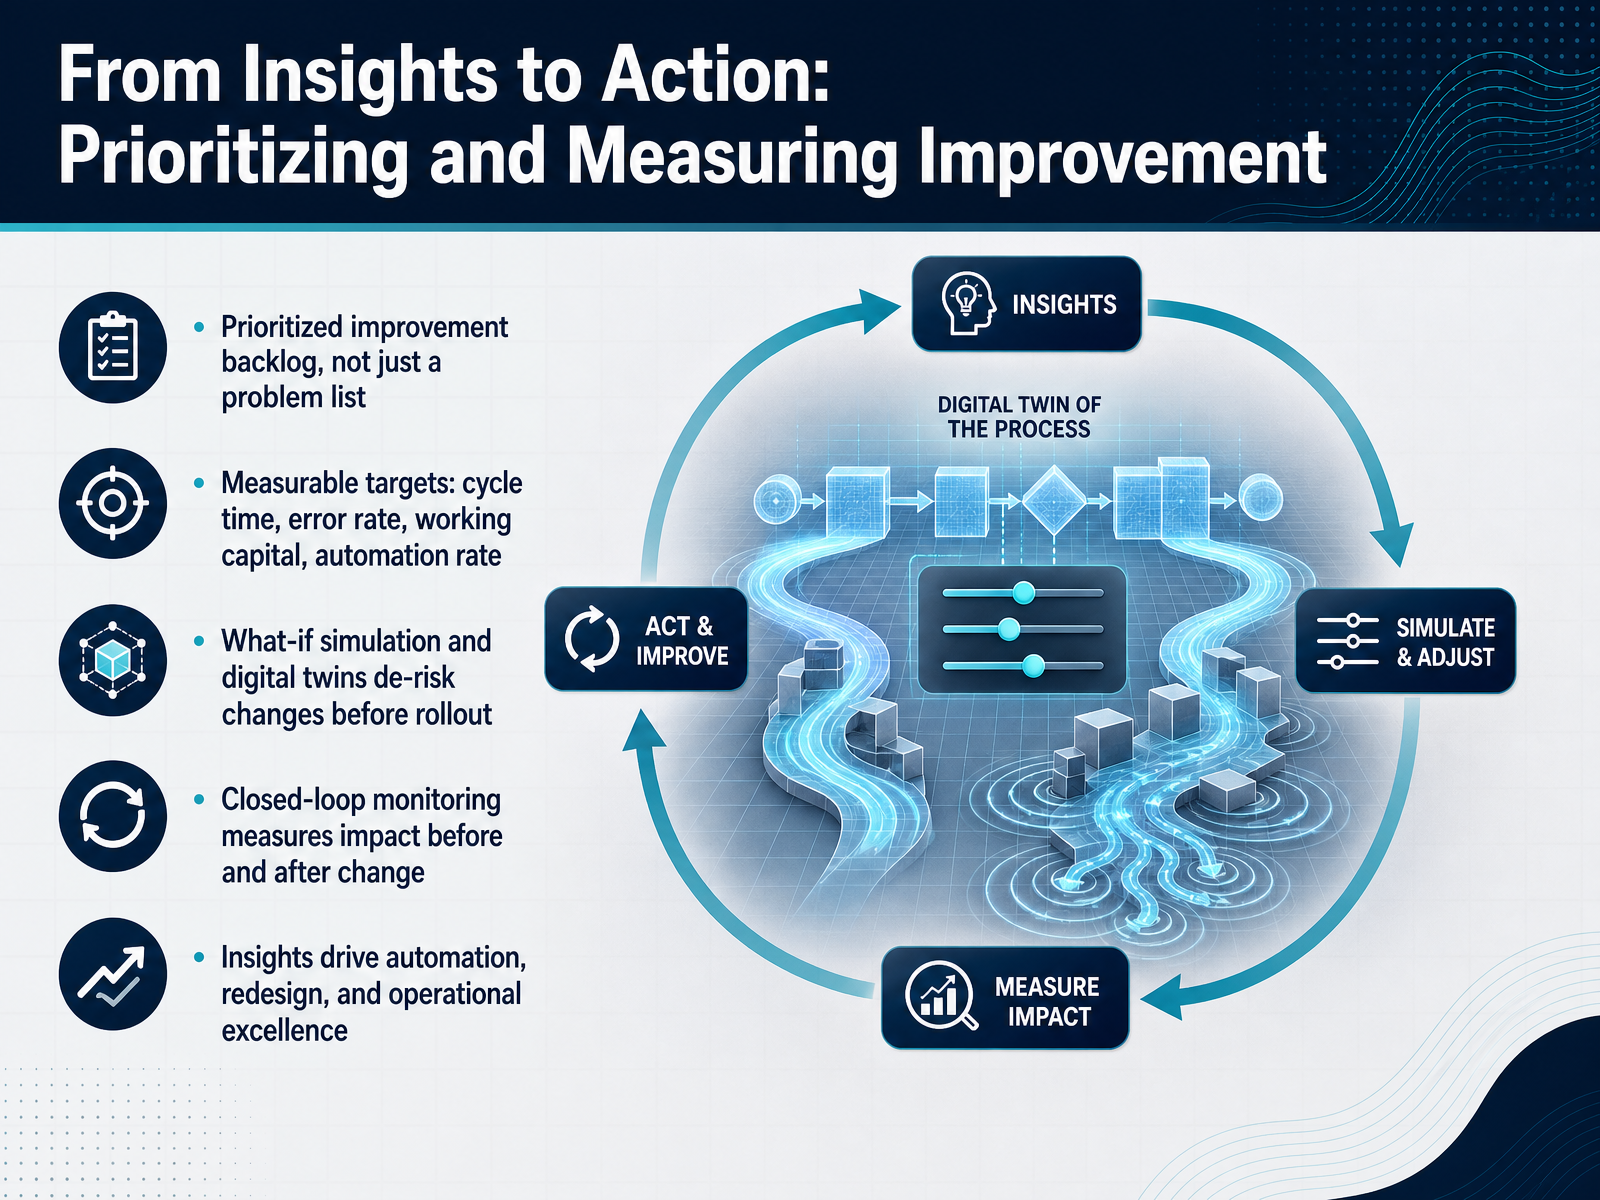 qpr.comcelonis.comibm.com+21 min
 - 11Getting Started: Readiness, First Project, and Quick WinsSo how do you actually get started? Before you touch any tooling, verify three things: data access, a process owner who is willing to sponsor the work, and a clear business question. Without those, the project stalls before it delivers anything. Next, pick a high-volume, high-pain process. Order-to-cash and procure-to-pay are the classic starting points because they touch multiple systems and generate enormous event logs. When you pull that log, you want quick wins. Look for master data errors, like the incorrect routes that caused a forty-five percent drop in route changes after cleanup. Look for misclassified payments, like the thirty million dollars in invoices with wrong payment terms. Avoid over-scoping, weak sponsorship, and poor data quality at all costs. They are the top three reasons these projects fail. Finally, build lasting capability through a center of excellence and shared playbooks, so the methodology spreads beyond the first use case. Start small, prove value fast, and let the momentum carry the next wave. Now let's walk through the practical workflow for a BPI project.
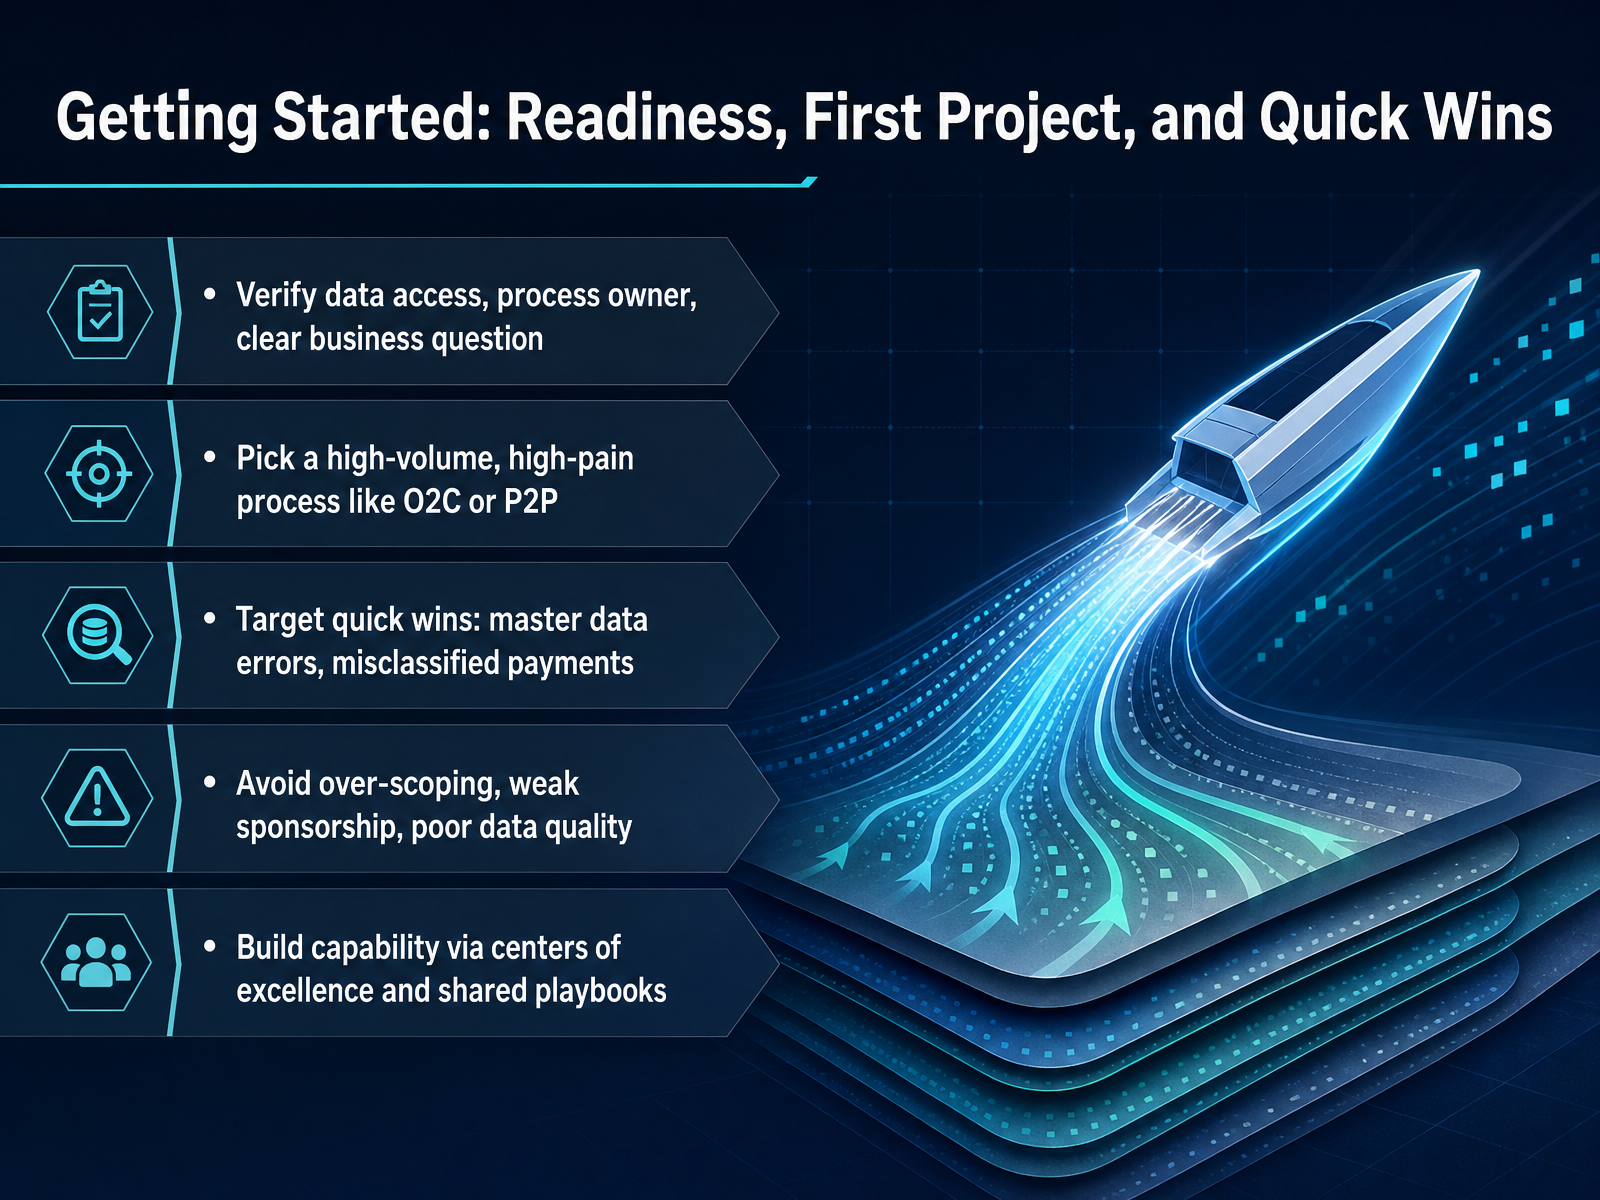 cio.comcelonis.comdocumentation.celonis.com+22 min
 - 12Practical Workflow for a BPI ProjectNow let's move from the concepts to the field. A BPI project follows a practical, five-step workflow that keeps analysis anchored to business value. Step one: align stakeholders on the core business question. Before pulling any data, agree on what you need to know. Are you chasing cycle time in order to cash, or compliance gaps in procure to pay? Get that question explicit. Step two: inventory and extract event logs with the data team. You'll need timestamps, case IDs, and activity names from systems like SAP or Salesforce. Step three: validate data quality and confirm case definitions. A case must mean the same thing to your analysts and your operations team, whether that's a purchase order or a customer order. Step four: run discovery, conformance, and performance analysis. Discovery shows how work actually flows, conformance checks it against the intended model, and performance flags the bottlenecks. Step five: interpret findings with operations and convert them into actions. This is where insights become decisions, like automating a manual step or rerouting a handoff. The takeaway is simple: each step builds on the last, and skipping validation only multiplies risk downstream. Next, let's look at the common pitfalls and the success factors that keep your project on track.
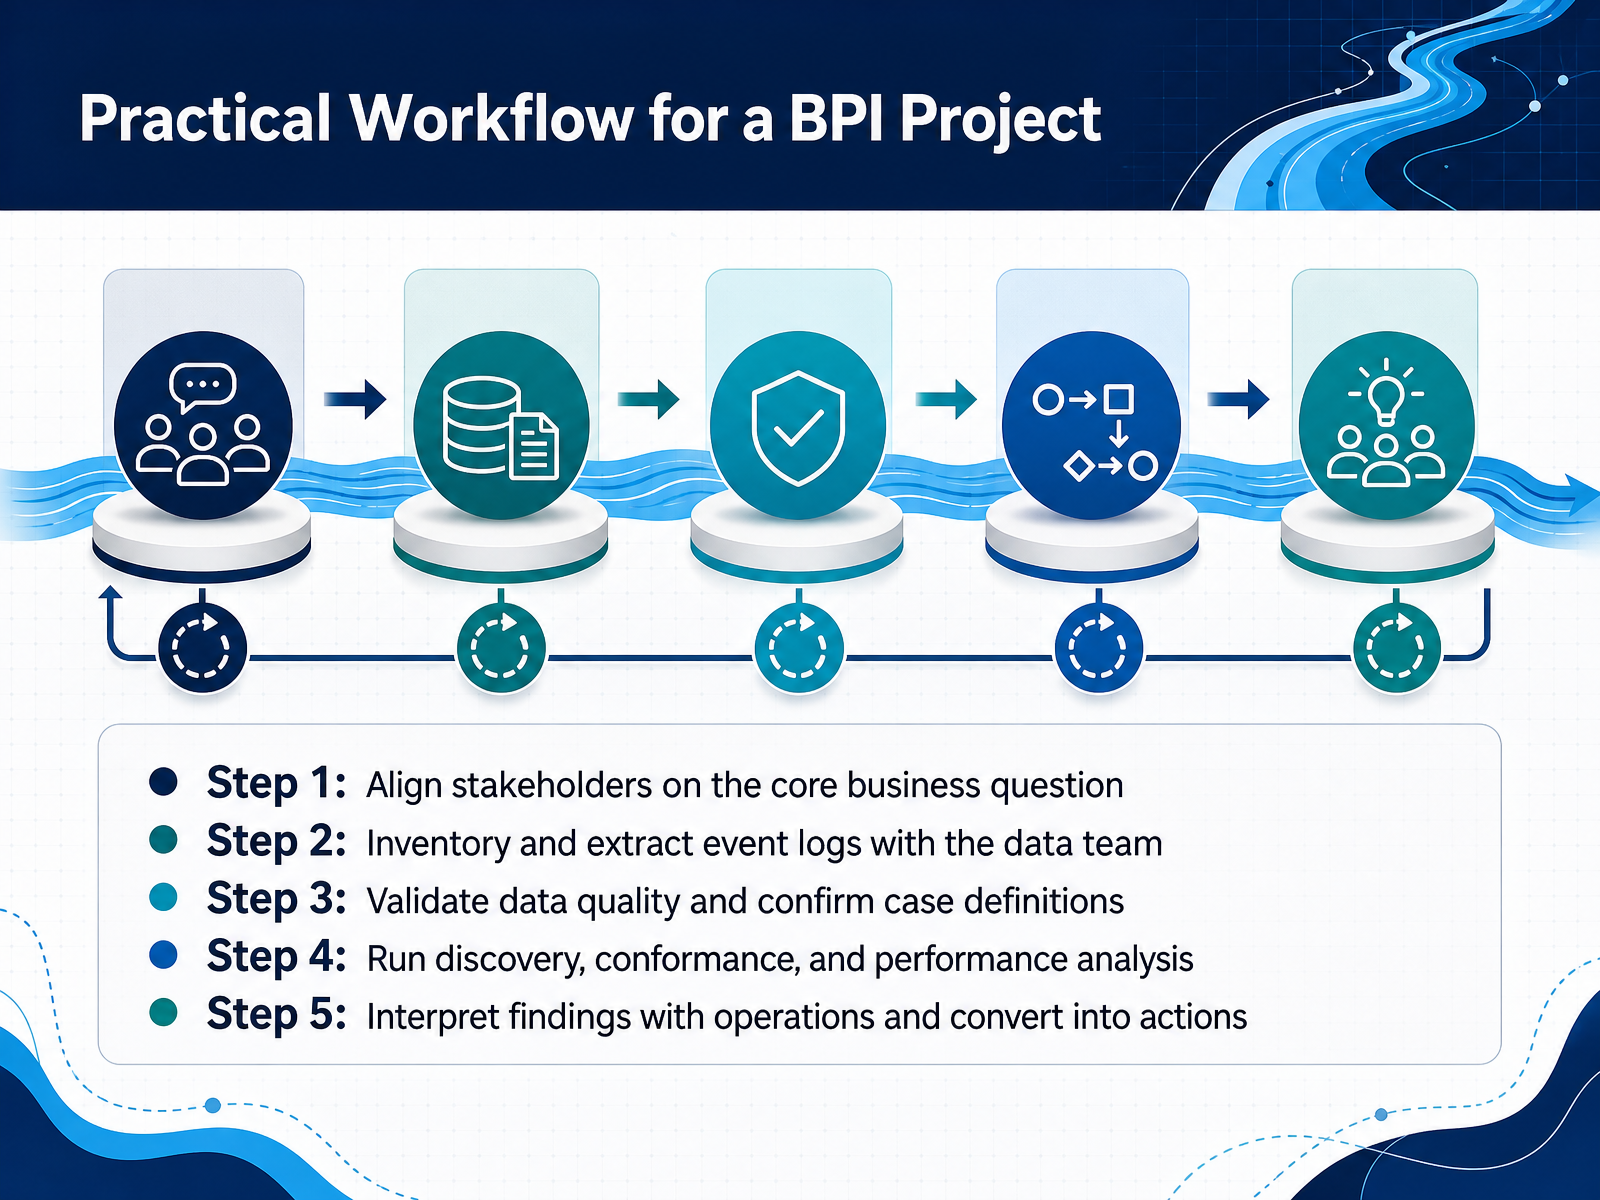 techtarget.comaris.comcamunda.com+22 min
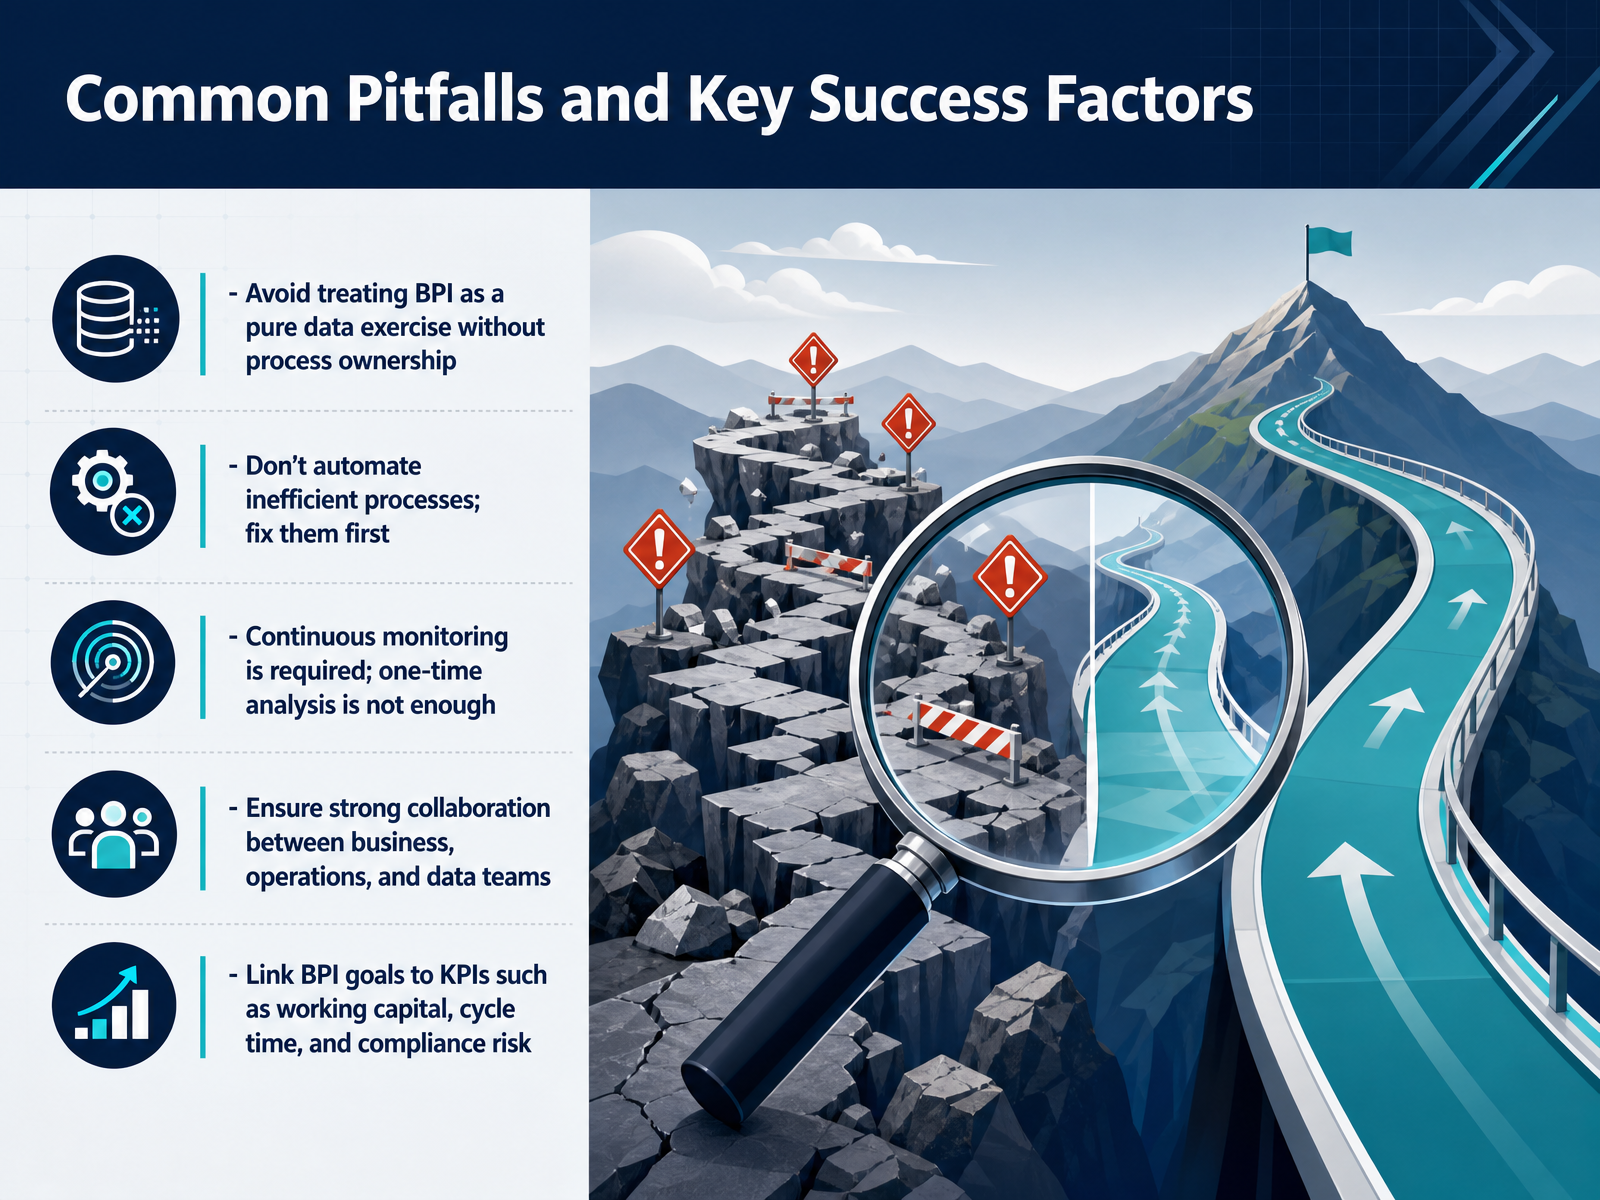
 - 13Common Pitfalls and Key Success FactorsNow let’s talk about what separates successful Business Process Intelligence initiatives from the ones that stall. The first pitfall is treating BPI as a pure data exercise. If you don’t have clear process ownership, insights will sit in a dashboard and never drive change. You need someone accountable for acting on what the data reveals. Second — and this is critical — don’t automate an inefficient process. You’ll just be doing the wrong thing faster. Fix the process first, then automate. And remember, process mining is not a one-time project. Your processes drift over time, so continuous monitoring is what keeps the value alive. Third, this only works with strong collaboration between business, operations, and data teams. The data team builds the analysis, but the business side knows the process reality. Without that partnership, you’ll chase the wrong bottlenecks. Finally, link your BPI goals to real KPIs — working capital, cycle time, compliance risk. When you tie the analysis to those numbers, you get executive attention and measurable results. Make the initiative about business outcomes, not just process maps. Now, let’s turn this into a concrete action plan and next steps.
 qpr.comcelonis.comibm.com+22 min
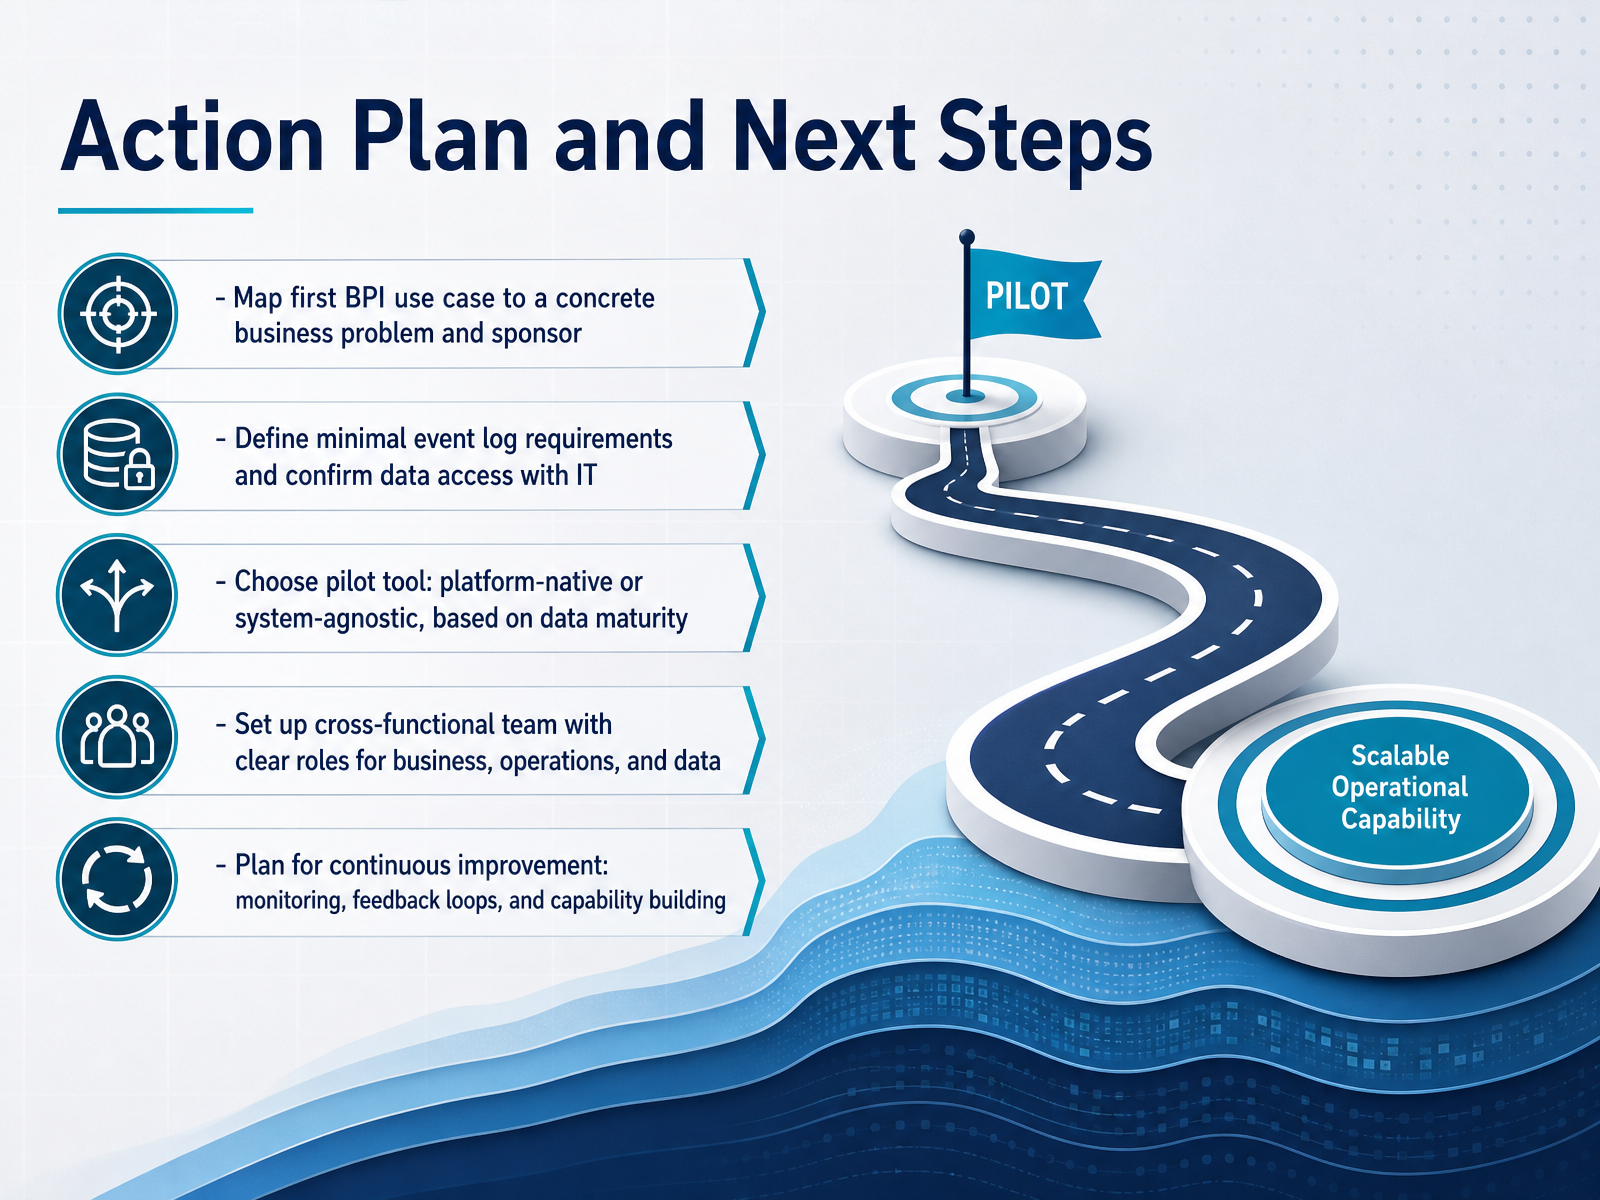
 - 14Action Plan and Next StepsLet's turn insight into action. Your first priority is to pick one concrete business problem and get an executive sponsor behind it. Don't boil the ocean. After that, work with IT to define the minimal event log requirements and confirm your data access. That step will determine your timeline. For the pilot tool, choose between a platform-native option like SAP Signavio or IBM, or a system-agnostic one like Celonis or QPR, based on how mature your data landscape is. Then assemble a cross-functional team across business, operations, and data, and assign clear roles from day one. Finally, plan for continuous improvement. Set up monitoring dashboards, establish feedback loops, and invest in building internal capability. This isn't a one-off project. It's a new operational muscle. Start small, deliver a visible win, and let the results speak for themselves. Thank you for your time today. You have everything you need to get started. Now go make your processes visible.
 qpr.comcelonis.comibm.com+22 min
Take the deck with you
Download this course as a file — free, no sign-up needed.
- PDF handoutEvery slide page, ready to print or share.15 pages · 4.1 MBDownload
- Narrated PowerPointThe deck that presents itself — every slide carries the digital human's narration video.15 pages · 16.4 MBDownload
- PowerPoint slidesThe full deck as a .pptx — open it in PowerPoint, Keynote, or Google Slides.15 pages · 4.0 MBDownload
Free to use in your own training — please keep the PersonWise credit page at the end.
Have your own deck? Turn it into a course
Sources consulted
Web sources consulted while building this course.
- What is process intelligence (business process intelligence)? | Definition from TechTarget — techtarget.com
- What is Process Intelligence? | ARIS — aris.com
- What is Process Intelligence? | Camunda | Camunda — camunda.com
- What is Process Intelligence? A Guide for Enterprise Leaders - Appian — appian.com
- Defining Business Process Intelligence For Better Performance | Signavio — signavio.com
- Products - QPRProcessAnalyzer — qpr.com
- Celonis for Process Excellence | Celonis — celonis.com
- IBM Process Mining — ibm.com
- PROCESS — kai-waehner.de
- Process Intelligence Software for Enterprise Transformation | UiPath — uipath.com
- ThyssenKrupp Rasselstein integrates process intelligence into the supply chain | CIO — cio.com
- The Power of Process Mining in Purchase-to-Pay | Celonis — celonis.com
- Process Intelligence Graph — documentation.celonis.com
- Hexion + Celonis | Process Mining — celonis.com
- 6 ways to improve order-to-cash with process mining | TechTarget — techtarget.com