Begin
14 pages · ~28 min
Measuring Instructional Design Outcomes
This training helps instructional designers measure and evaluate learning outcomes. Participants learn to assess training effectiveness and demonstrate impact.
A digital instructor presents all 14 pages. Hold “Ask” at any point and ask out loud — the answer comes from this course. No sign-up needed.
What you’ll learn
- 01Measuring Instructional Design Outcomes: An OverviewWelcome. Over the next few minutes, we are going to talk about measuring instructional design outcomes. This is a practical conversation for people who already design learning, so we will focus on the decisions that make measurement useful rather than theoretical.
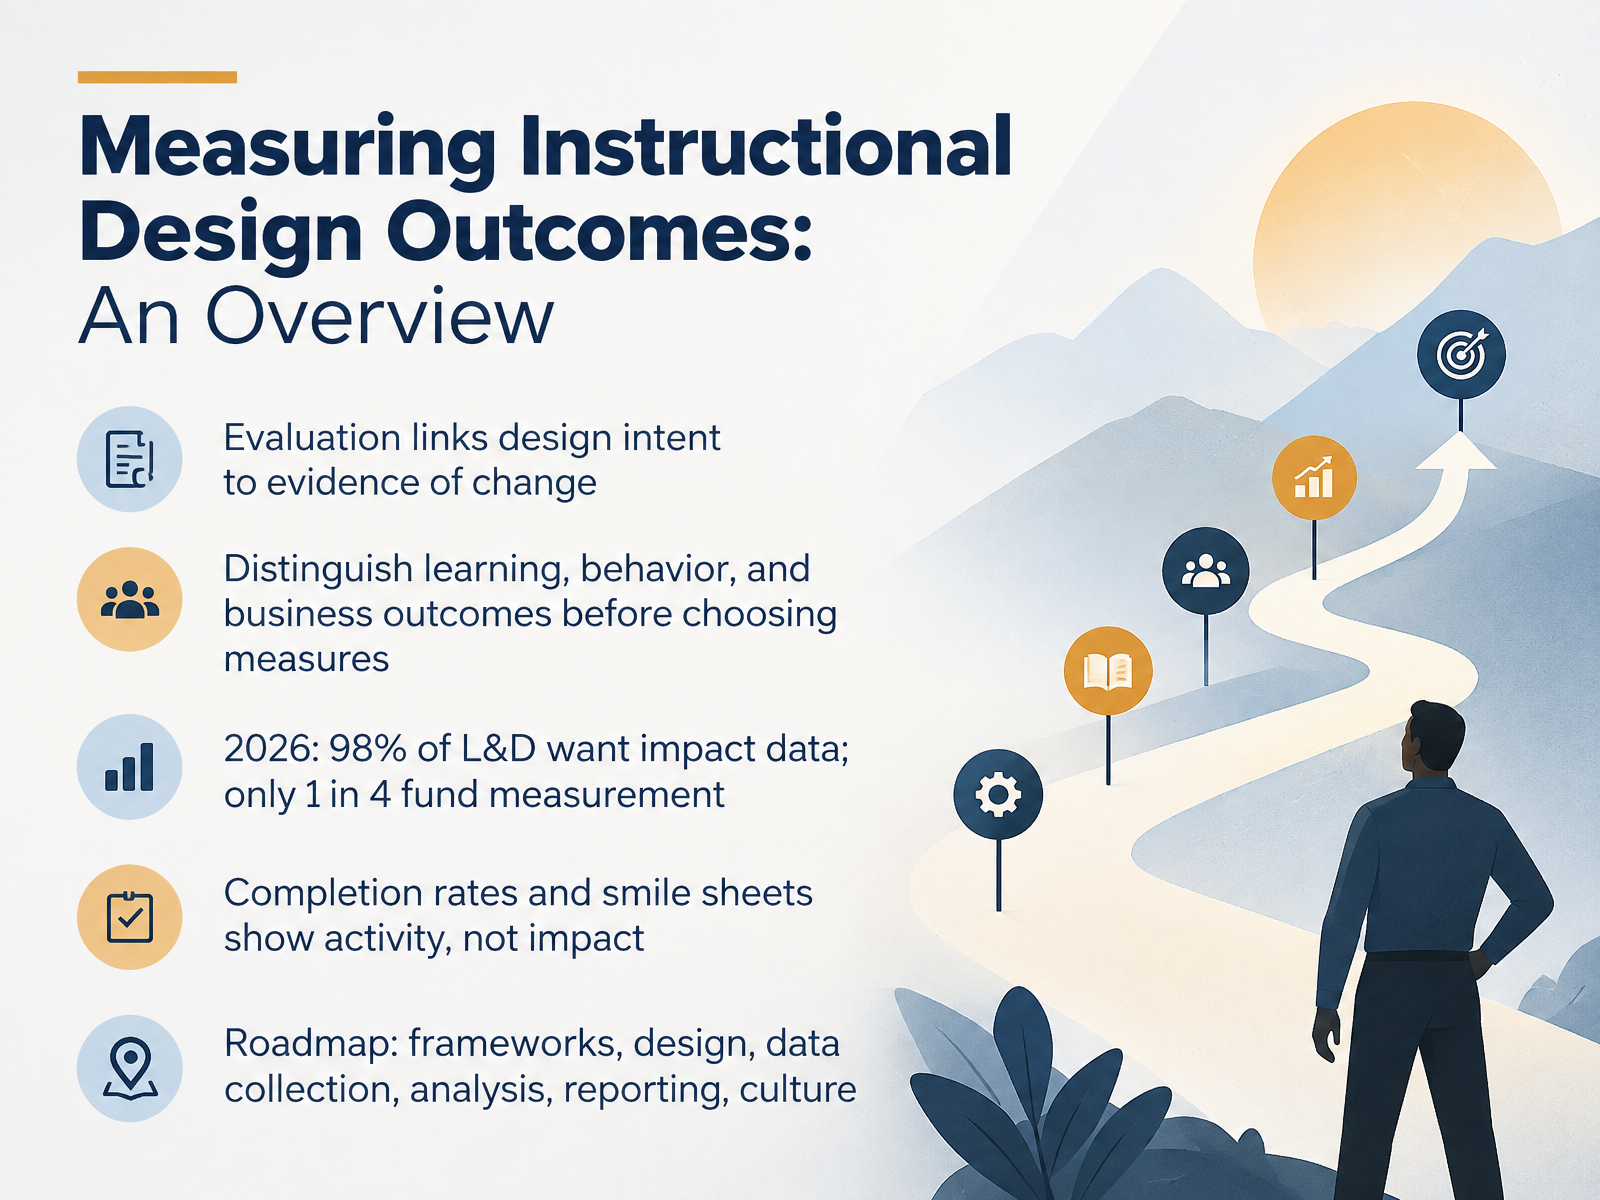
Here is the core idea. Evaluation links your design intent to evidence of actual change. That means you need to decide before you build what kind of change you are looking for: learning, behavior, or business results. Those are different outcomes, and they require different measures.
The pressure to do this well is real. In 2026, ninety-eight percent of learning and development teams say they want impact data, yet only about one in four organizations fund measurement. And be careful with the easy numbers. Completion rates and smile sheets show activity, not impact. They tell you people showed up and felt good, not that anything changed on the job.
So here is our roadmap. We will move through frameworks, design, data collection, analysis, reporting, and the culture that makes measurement stick. Each piece builds on the last.
Let's start with the background: the measurement paradox and the analytics divide.trainingindustry.comkirkpatrickpartners.commindtools.com+21 min
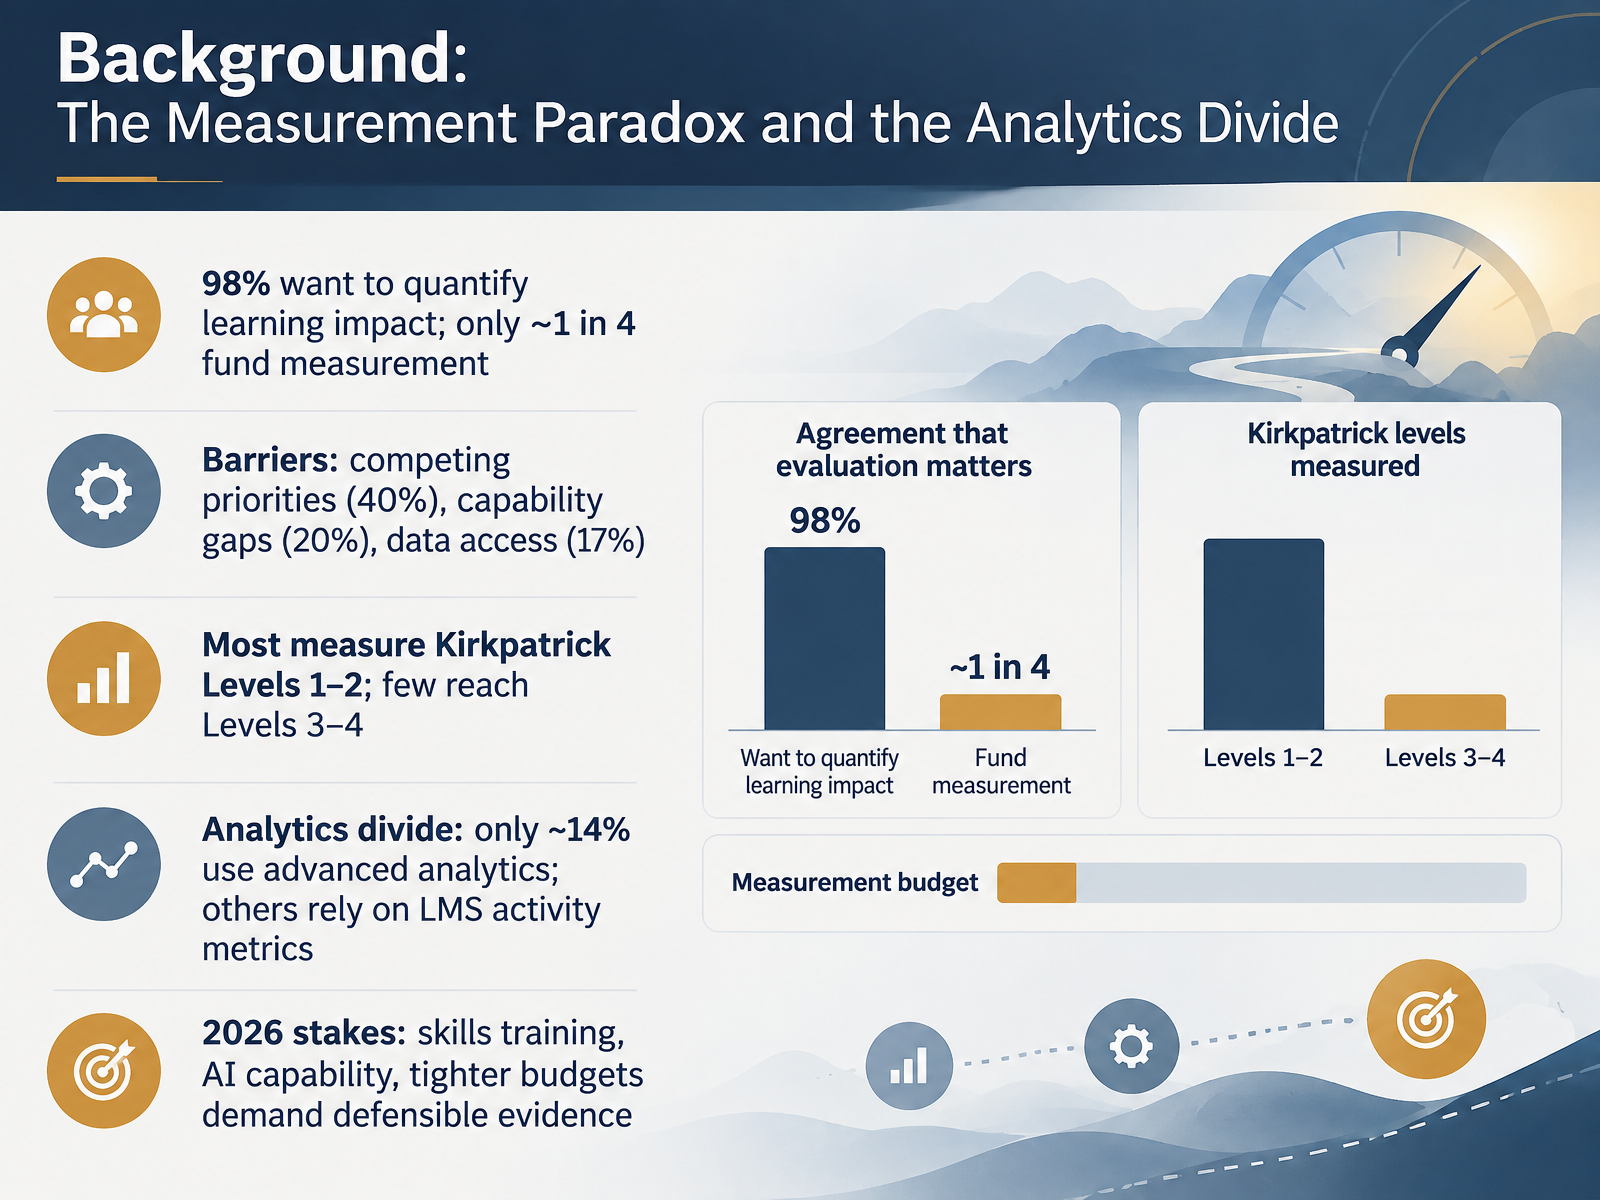
- 02Background: The Measurement Paradox and the Analytics DivideLet's start with the landscape you're working in. There's a real paradox here. Ninety-eight percent of learning leaders say they want to quantify impact, yet only about one in four actually fund measurement. The intent is there. The investment isn't. Why? Competing priorities top the list at forty percent, then capability gaps at twenty percent, and data access at seventeen percent. So what happens in practice? Most teams measure Kirkpatrick Levels One and Two, reaction and learning, because they're fast and familiar. Few reach Level Three or Four, where behavior change and business results actually live. That creates an analytics divide. Only about fourteen percent of organizations use advanced analytics. Everyone else leans on LMS activity metrics, completions and clicks, which tell you who showed up, not what changed. Now, why does this matter more in twenty twenty-six? Skills training, AI capability, and tighter budgets are all converging. When money gets tight, stakeholders ask harder questions, and completion rates won't answer them. You need defensible evidence that learning moved something that matters. That's the gap this course helps you close. Next, let's look at the core frameworks and how they differ.
 trainingindustry.comkirkpatrickpartners.commindtools.com+22 min
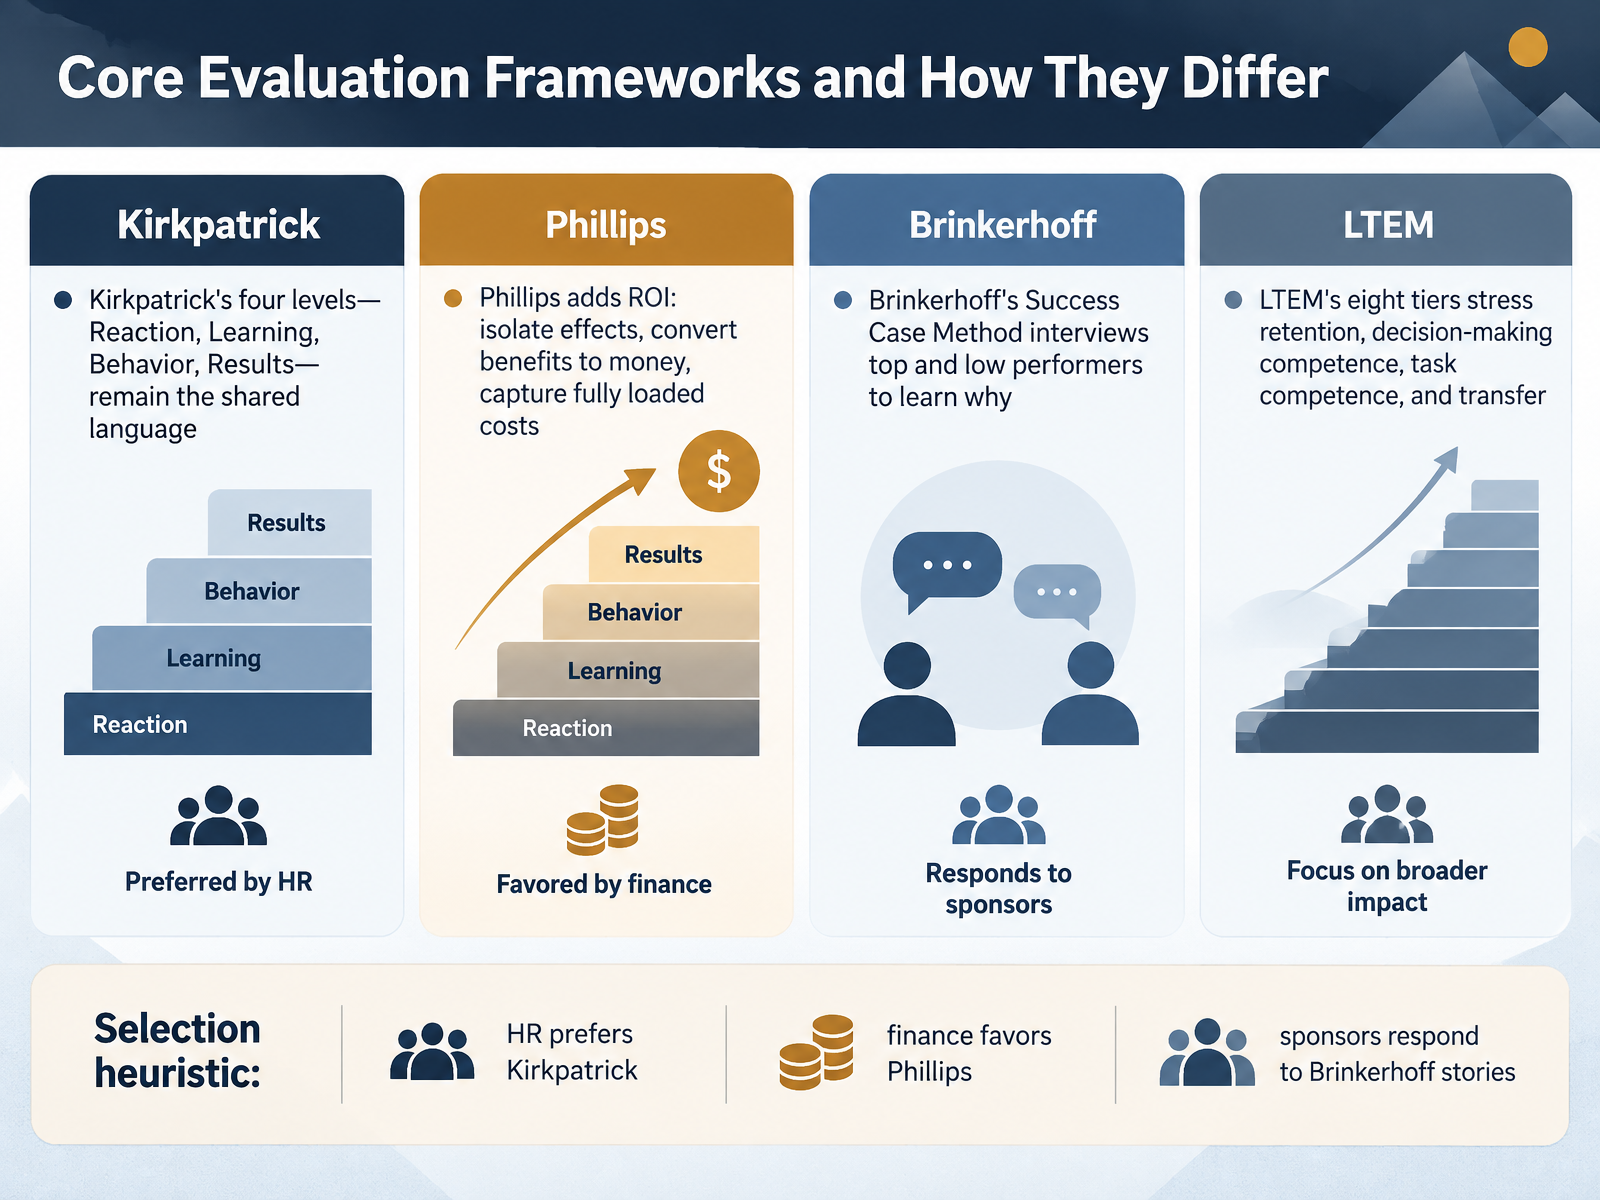
 - 03Core Evaluation Frameworks and How They DifferLet's look at the main evaluation frameworks and where they diverge. Kirkpatrick's four levels, Reaction, Learning, Behavior, and Results, remain the shared language most stakeholders already recognize. Phillips adds a fifth level, return on investment, which means isolating the training effect, converting benefits to money, and capturing fully loaded costs. Brinkerhoff's Success Case Method interviews your top and lowest performers to learn why transfer succeeded or failed. Kaufman splits reaction into input and process, then adds a societal Mega level for mission-driven work. LTEM uses eight tiers and pushes you toward retention, decision-making competence, task competence, and real transfer. So how do you choose? A simple heuristic: HR audiences prefer Kirkpatrick, finance favors Phillips, and wavering sponsors respond to Brinkerhoff stories. Pick the frame your stakeholders already trust, then collect data that fits it, because debating models while collecting nothing costs you the quarter and the budget. Next, we move into Designing for Measurable Outcomes from the Start.
 blueedgewater.comblueedgewater.comimpactcheck.net+22 min
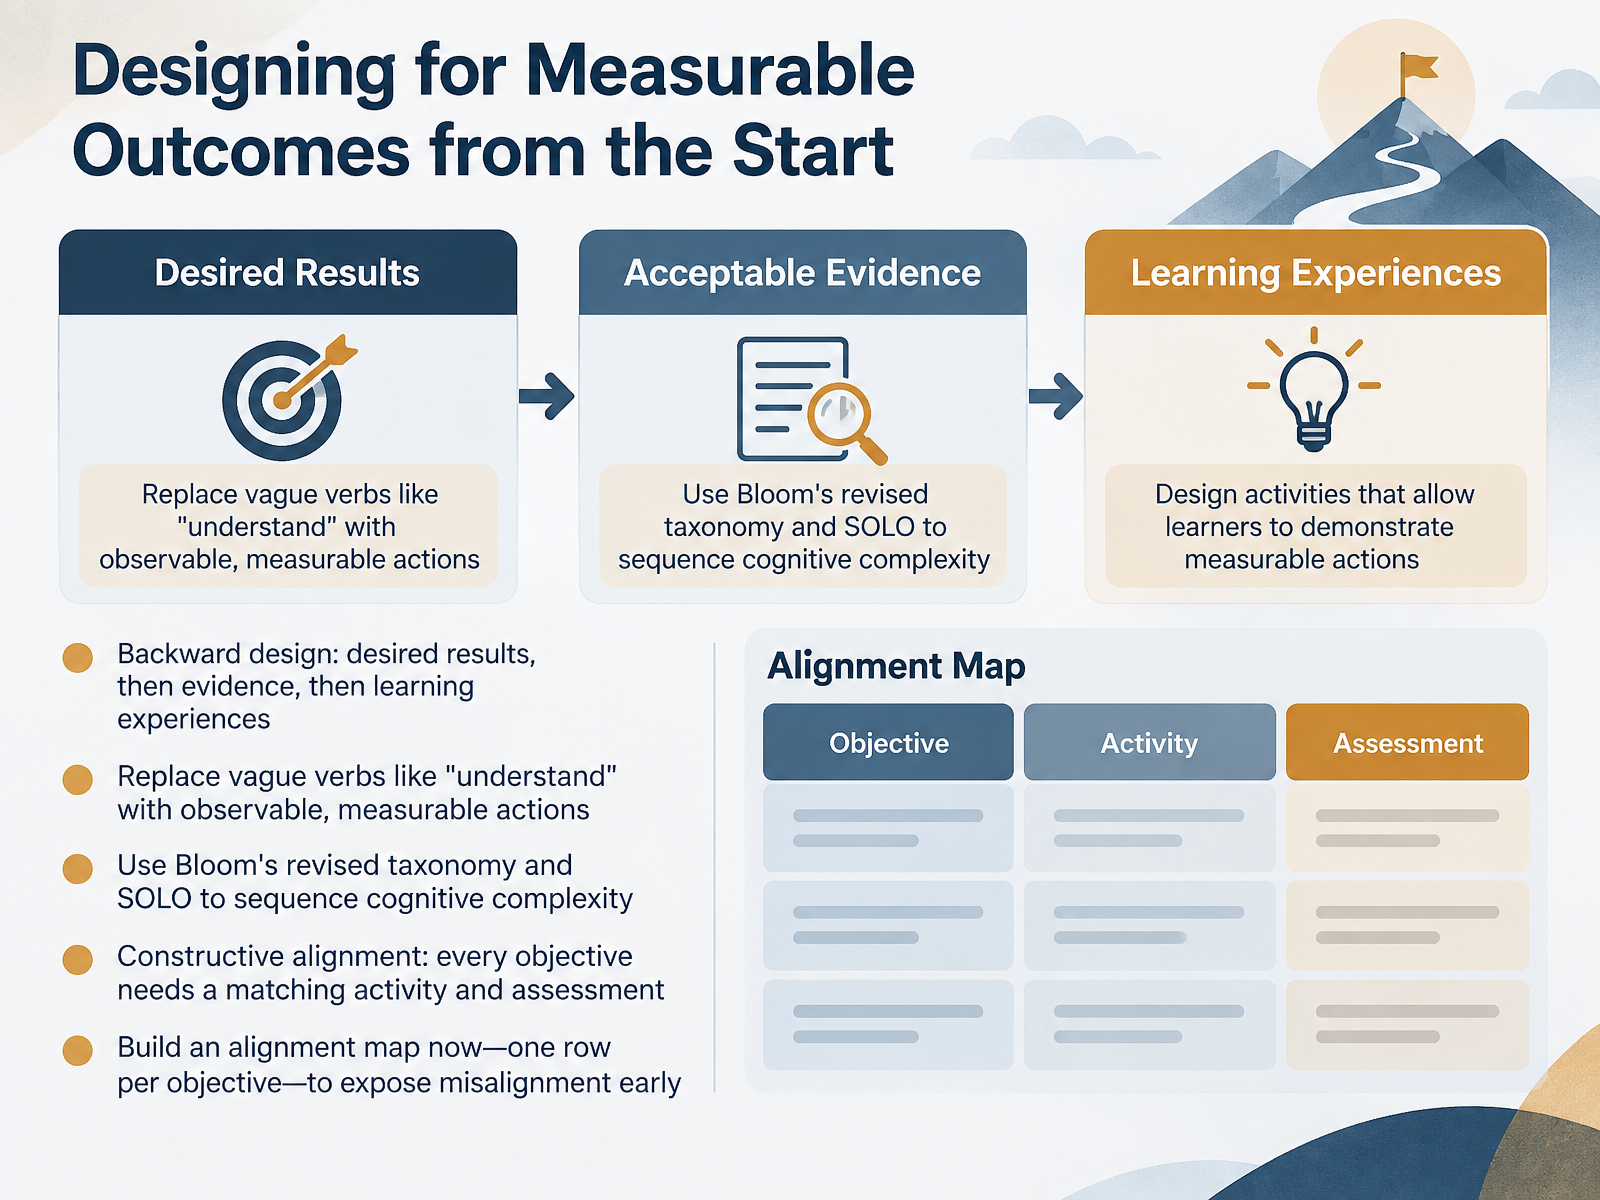
 - 04Designing for Measurable Outcomes from the StartSo let's talk about building measurement in from the start, not bolting it on at the end. The most reliable approach is backward design. You begin with the desired results, then define the evidence that proves those results, and only then design the learning experiences. That sequence keeps you honest. Next, replace vague verbs. If an objective says learners will understand something, ask yourself how you would know. Rewrite it with observable actions: describe, compare, apply, troubleshoot. Bloom's revised taxonomy and the SOLO taxonomy help you sequence cognitive complexity, so skills build in a logical order. Then use constructive alignment. Every objective needs a matching activity and a matching assessment. Miss either one, and your evidence falls apart. Here's the practical move: build an alignment map now, one row per objective, listing the activity and the assessment. It exposes gaps early, before development costs pile up. Take a moment after this and sketch three rows from your current project. Next, we'll look at data collection methods and instruments.
 tll.mit.eduelearnmag.acm.orgteaching.vt.edu+21 min
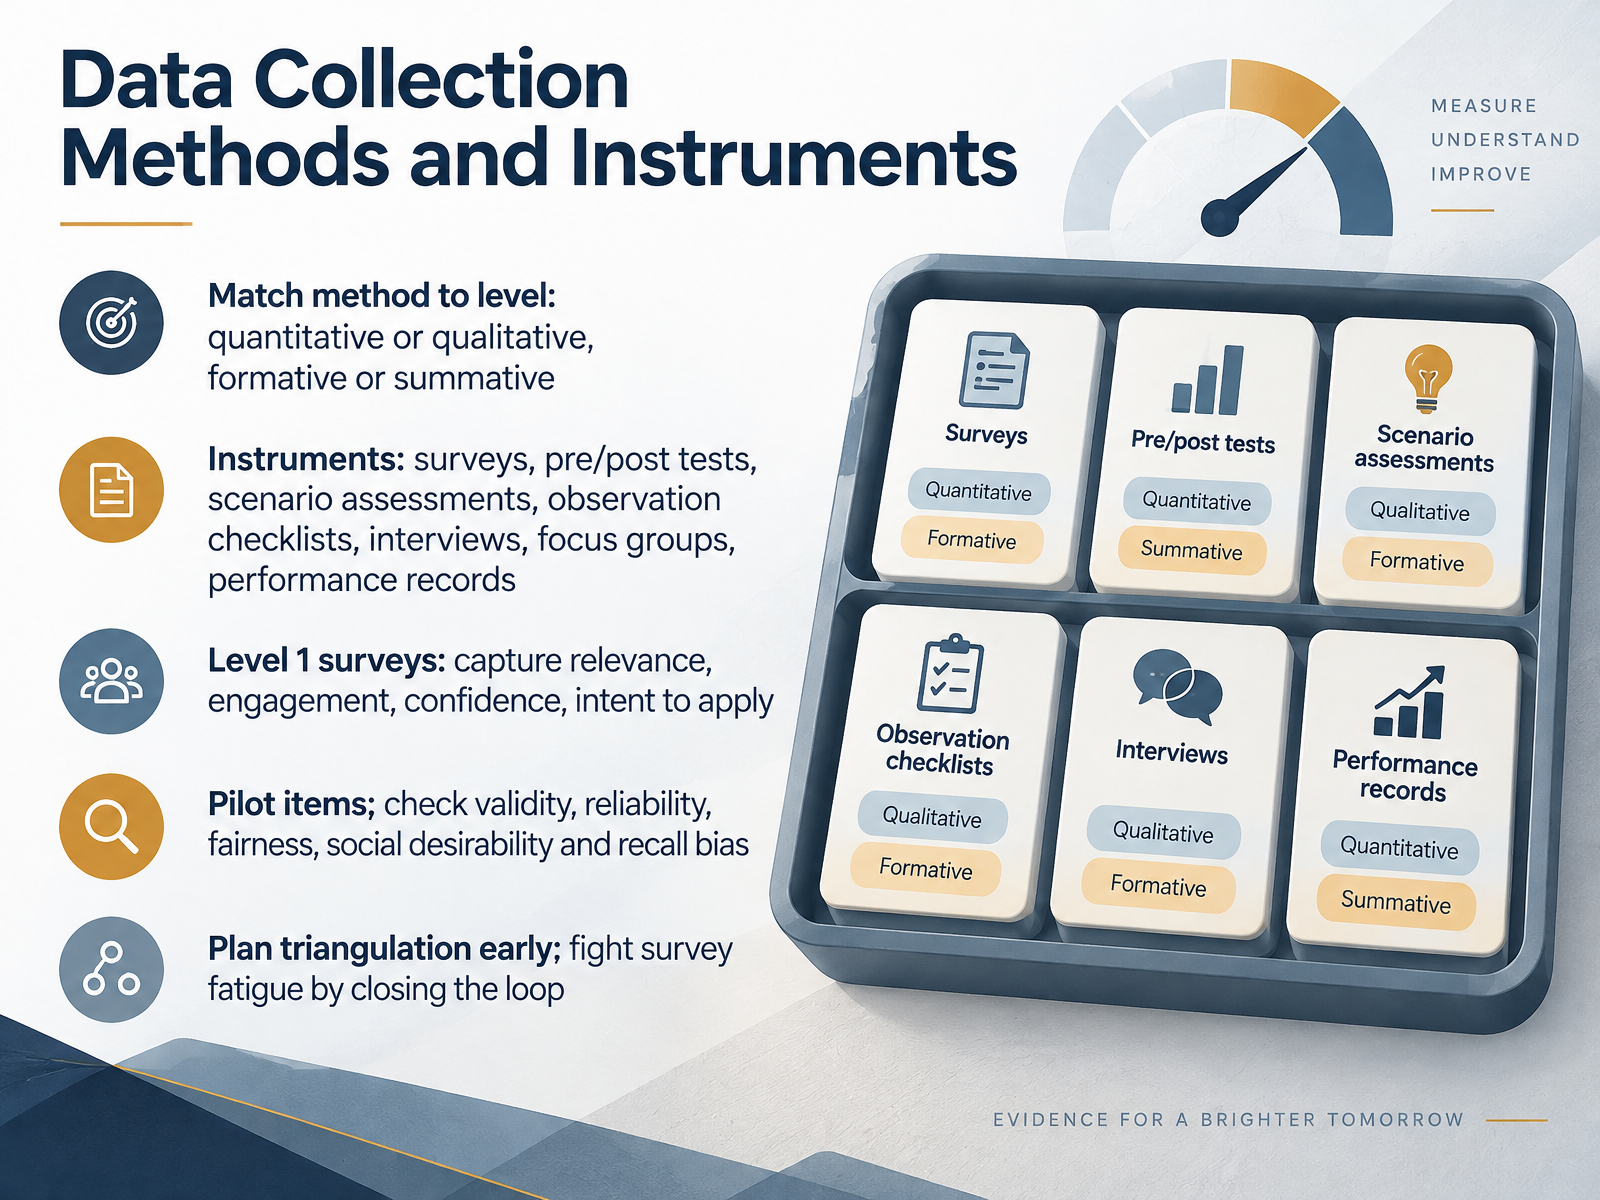
 - 05Data Collection Methods and InstrumentsLet's turn to how you actually collect the evidence. First, match the method to the level. Decide whether you need quantitative or qualitative data, and whether it's formative, captured during the programme, or summative, captured afterwards. Your instruments might be surveys, pre and post tests, scenario assessments, observation checklists, interviews, focus groups, or existing performance records. For Level One, keep surveys tight and focused on relevance, engagement, confidence, and intent to apply. Before you launch, pilot your items and check validity, reliability, and fairness, and watch for social desirability and recall bias. Plan triangulation early, so multiple sources can confirm or challenge each other. And fight survey fatigue by closing the loop; tell people what changed because they responded. Next, we'll look at measuring reaction and learning.
 trainingindustry.commindstamp.compeoplepilot.io+22 min
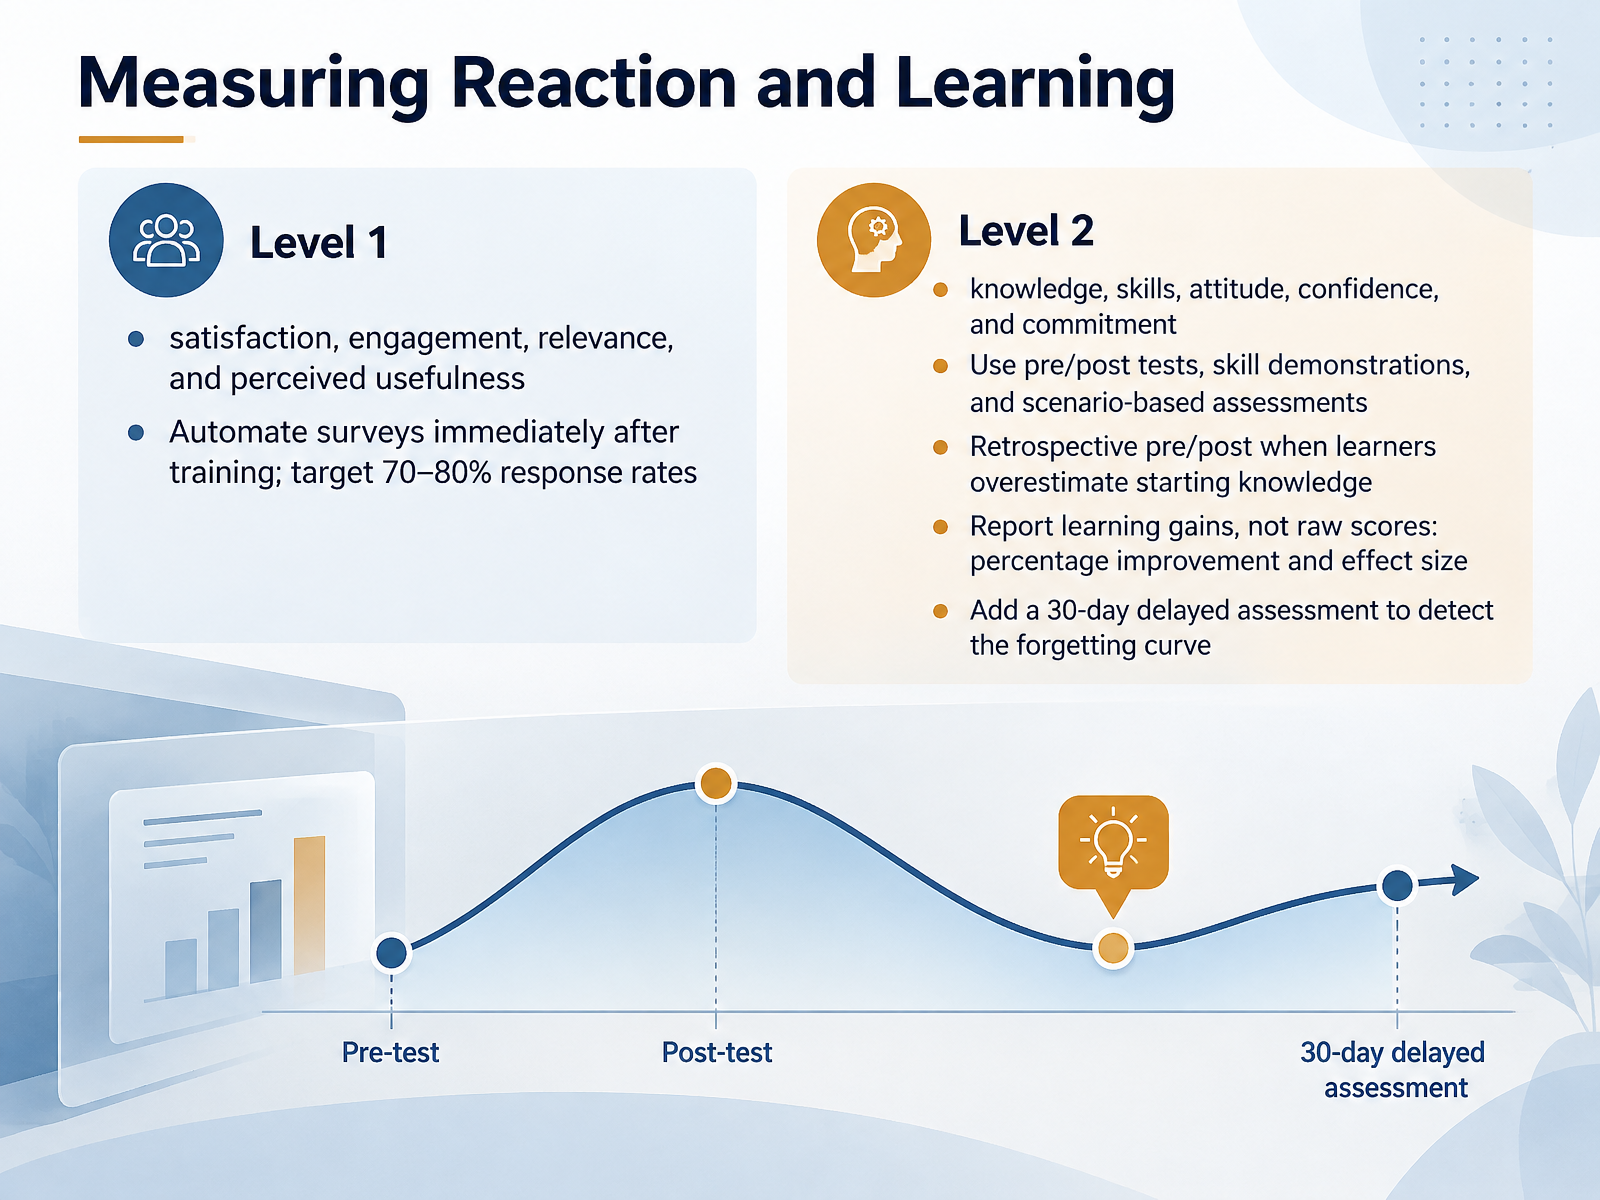
 - 06Measuring Reaction and LearningLet's turn to the first two levels of evaluation, which measure reaction and learning. Level one captures satisfaction, engagement, relevance, and whether learners found the training useful. Automate your surveys so they go out immediately after training, and aim for a response rate of seventy to eighty percent. Keep them short and consistent across programs. Level two measures knowledge, skills, attitude, confidence, and commitment. Use pre and post tests, skill demonstrations, or scenario based assessments. If learners tend to overestimate their starting knowledge, try a retrospective pre and post instead. When you report results, show learning gains rather than raw scores. That means percentage improvement and effect size. And add a thirty day delayed assessment to catch the forgetting curve, so you know what actually stuck. Next, we look at measuring behavior and transfer.
 trainingindustry.comkirkpatrickpartners.commindtools.com+22 min
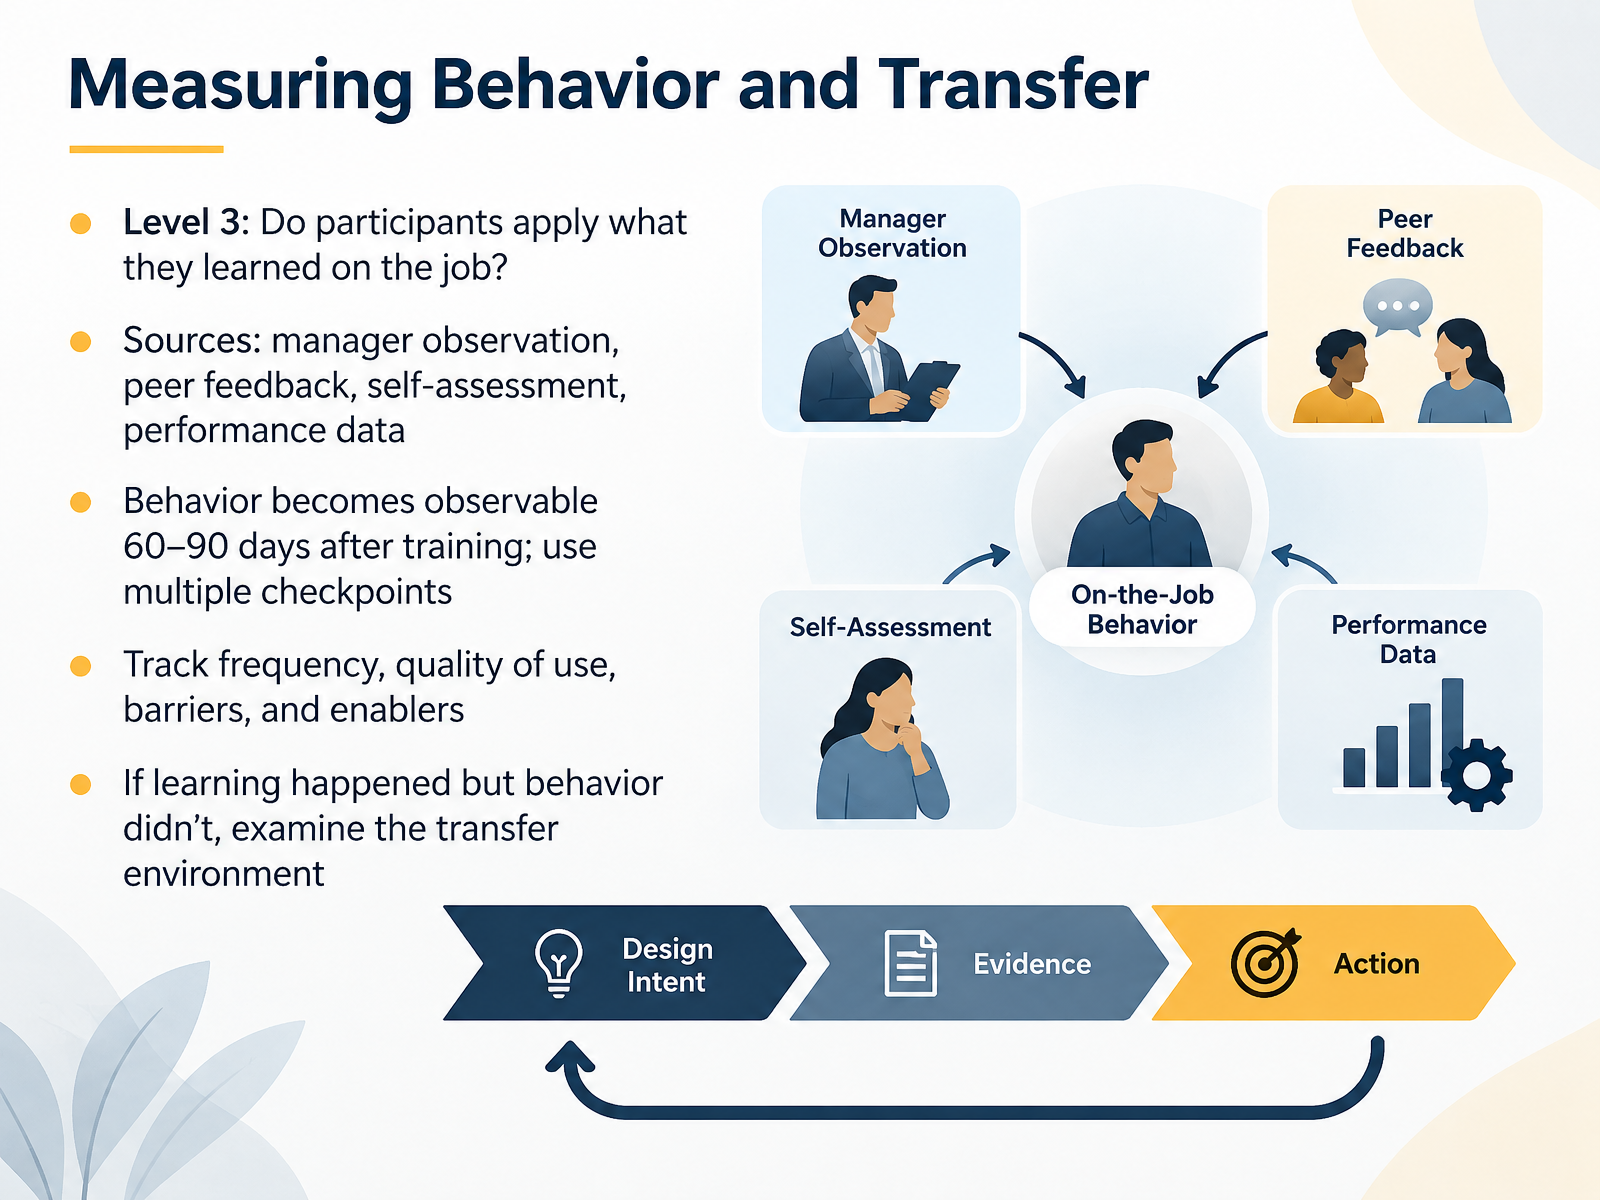
 - 07Measuring Behavior and TransferNow let's look at Level Three, behavior and transfer. This is where you ask a simple but demanding question. Do participants actually apply what they learned on the job? You gather evidence from several sources: manager observation, peer feedback, self-assessment, and performance data. Behavior usually becomes observable sixty to ninety days after training, so use multiple checkpoints rather than a single follow-up. When you measure, track four things: how often the behavior occurs, the quality of use, the barriers people hit, and the enablers that help. For example, if a coaching program shows strong learning scores but managers rarely hold coaching conversations, don't assume the training failed. Examine the transfer environment. Do they have time, manager support, and the tools to apply it? If learning happened but behavior didn't, that gap is your real design problem. Next, we move into measuring results and calculating return on investment.
 trainingindustry.commindstamp.compeoplepilot.io+21 min
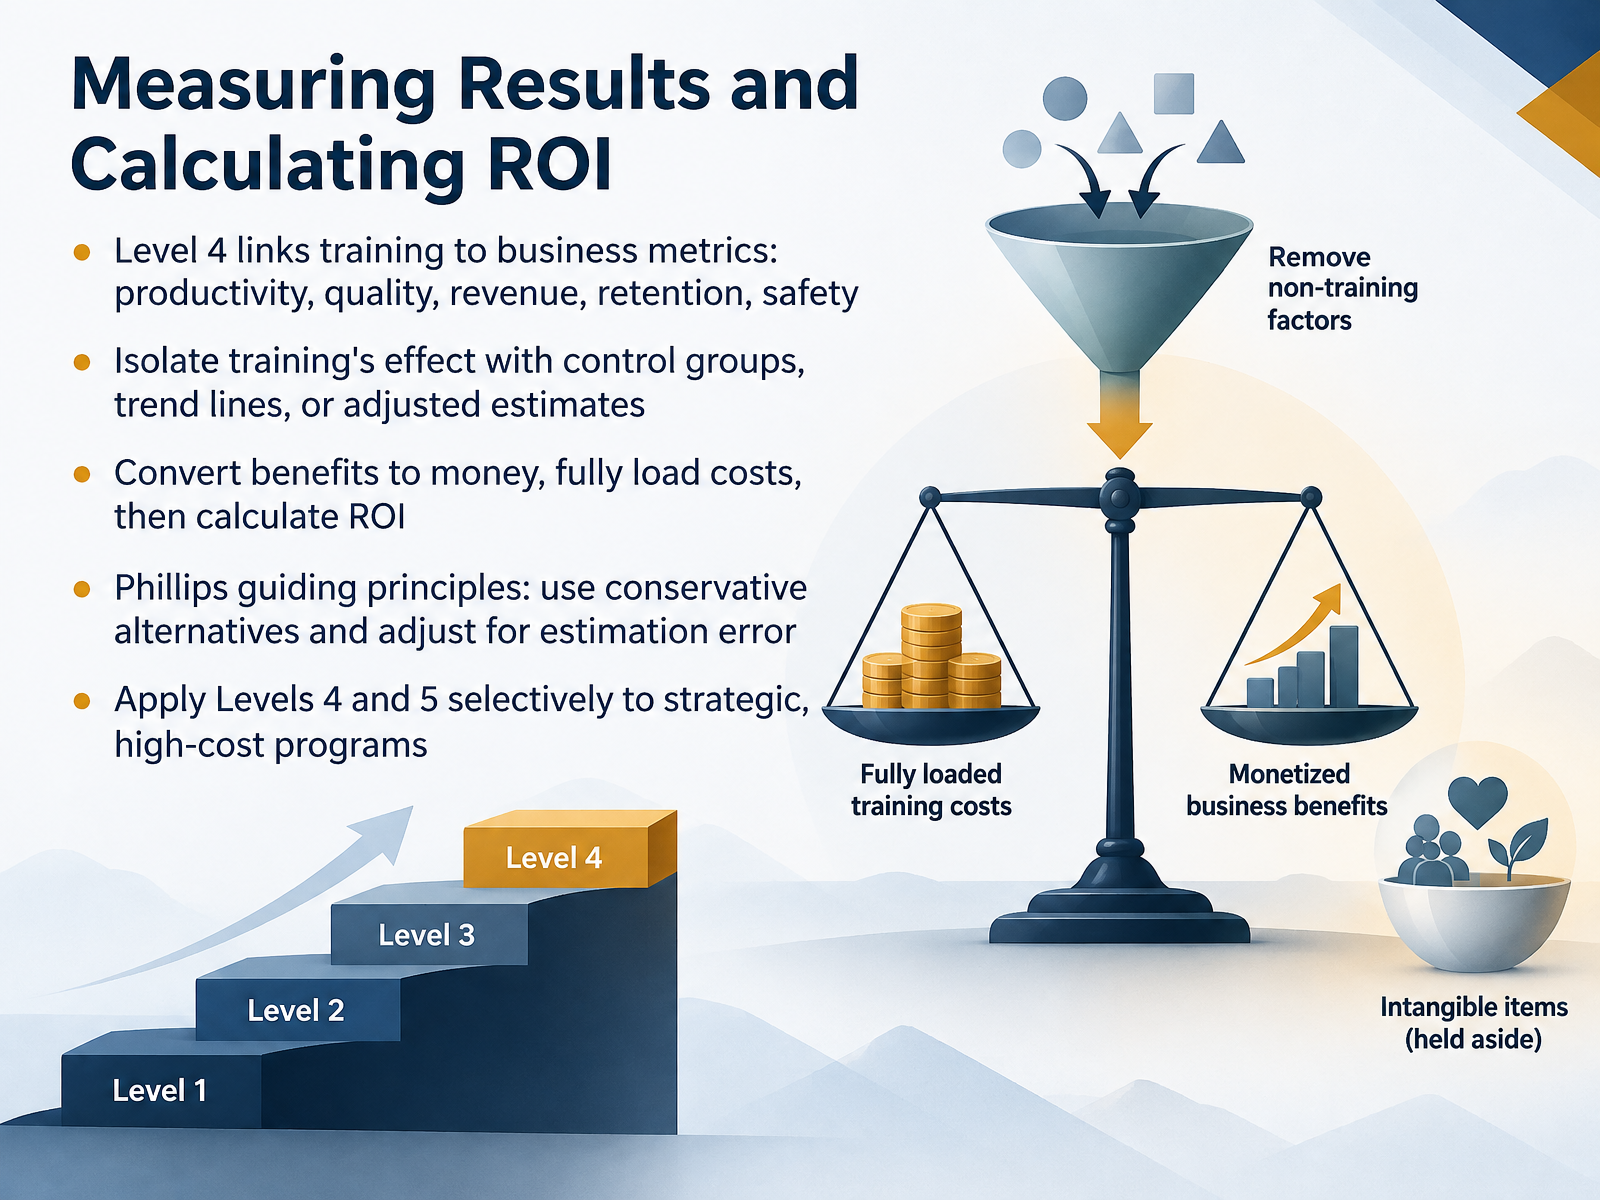
 - 08Measuring Results and Calculating ROINow let's look at measuring results and calculating return on investment. Level four ties training to business metrics that matter: productivity, quality, revenue, retention, and safety. To isolate training's effect, use control groups, trend lines, or adjusted estimates, so you're not crediting training for changes it didn't cause. Then convert those benefits to money, fully load your costs, including participant time and evaluation expenses, and calculate the return on investment. When you do, follow Phillips' guiding principles: use the most conservative alternatives, and adjust for estimation error. Here's the practical rule. Apply levels four and five selectively, to strategic, high cost programs where the evidence justifies the effort. A sales program showing a forty percent ROI can defend next year's budget; a short compliance refresher usually doesn't need it. Next, we'll move into analyzing and interpreting evaluation data.
 roiinstitute.net2 min
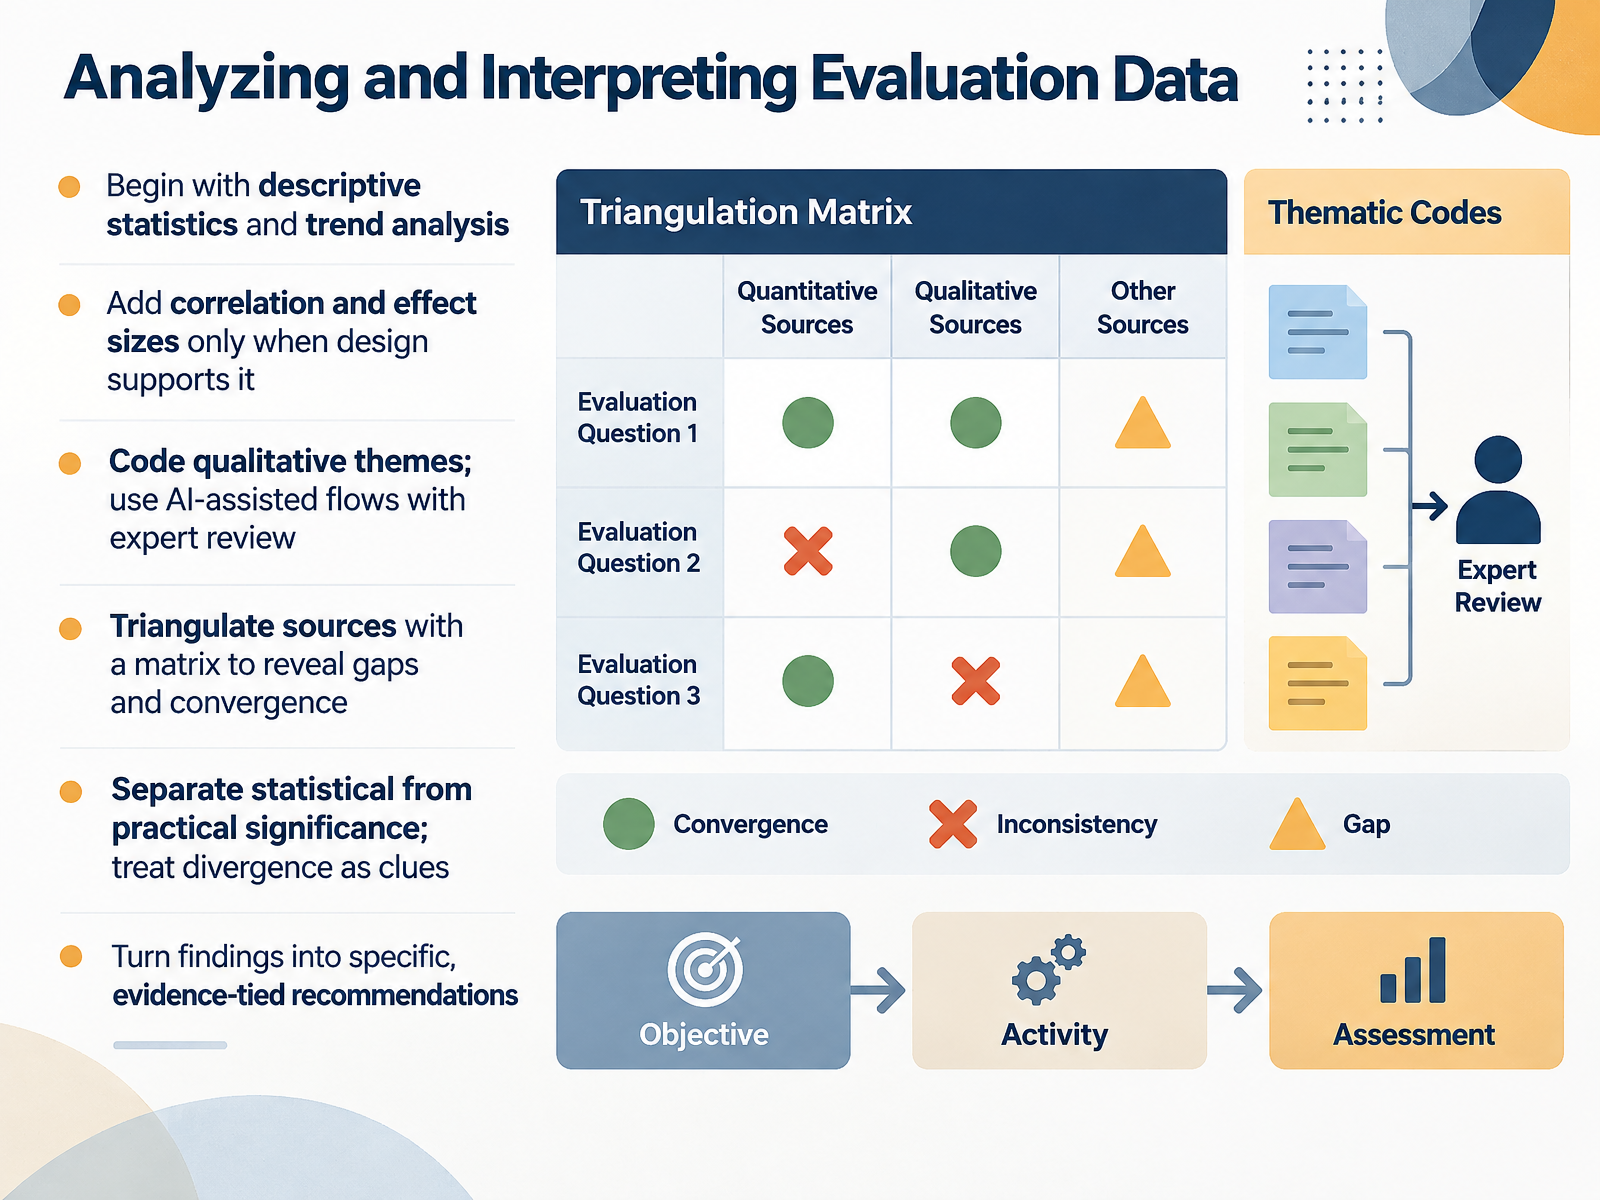
 - 09Analyzing and Interpreting Evaluation DataLet's turn to analyzing and interpreting evaluation data. Start simple. Run descriptive statistics and trend analysis before anything else, so you know what the data actually looks like and where change is showing up.
Add correlation and effect sizes only when your design supports that claim. A pre-post pattern in a single group is useful, but it isn't proof of causation.
For open-ended responses, code your qualitative themes. AI-assisted flows can speed up clustering and synthesis, but keep expert review in the loop. AI alone tends to produce vague, context-blind output.
Next, triangulate. Build a matrix that maps each evaluation question against every data source. That shows you where findings converge, and where gaps or contradictions sit.
When results diverge, don't hide them. Treat divergence as a clue about differences in role, context, or implementation. And keep statistical significance separate from practical significance. A large effect size matters only if it translates into changed on-the-job behavior.
Finally, turn findings into specific, evidence-tied recommendations. State which sources support each one, so stakeholders can act with confidence. From here, we move into reporting and communicating results.
 trainingindustry.com2 min
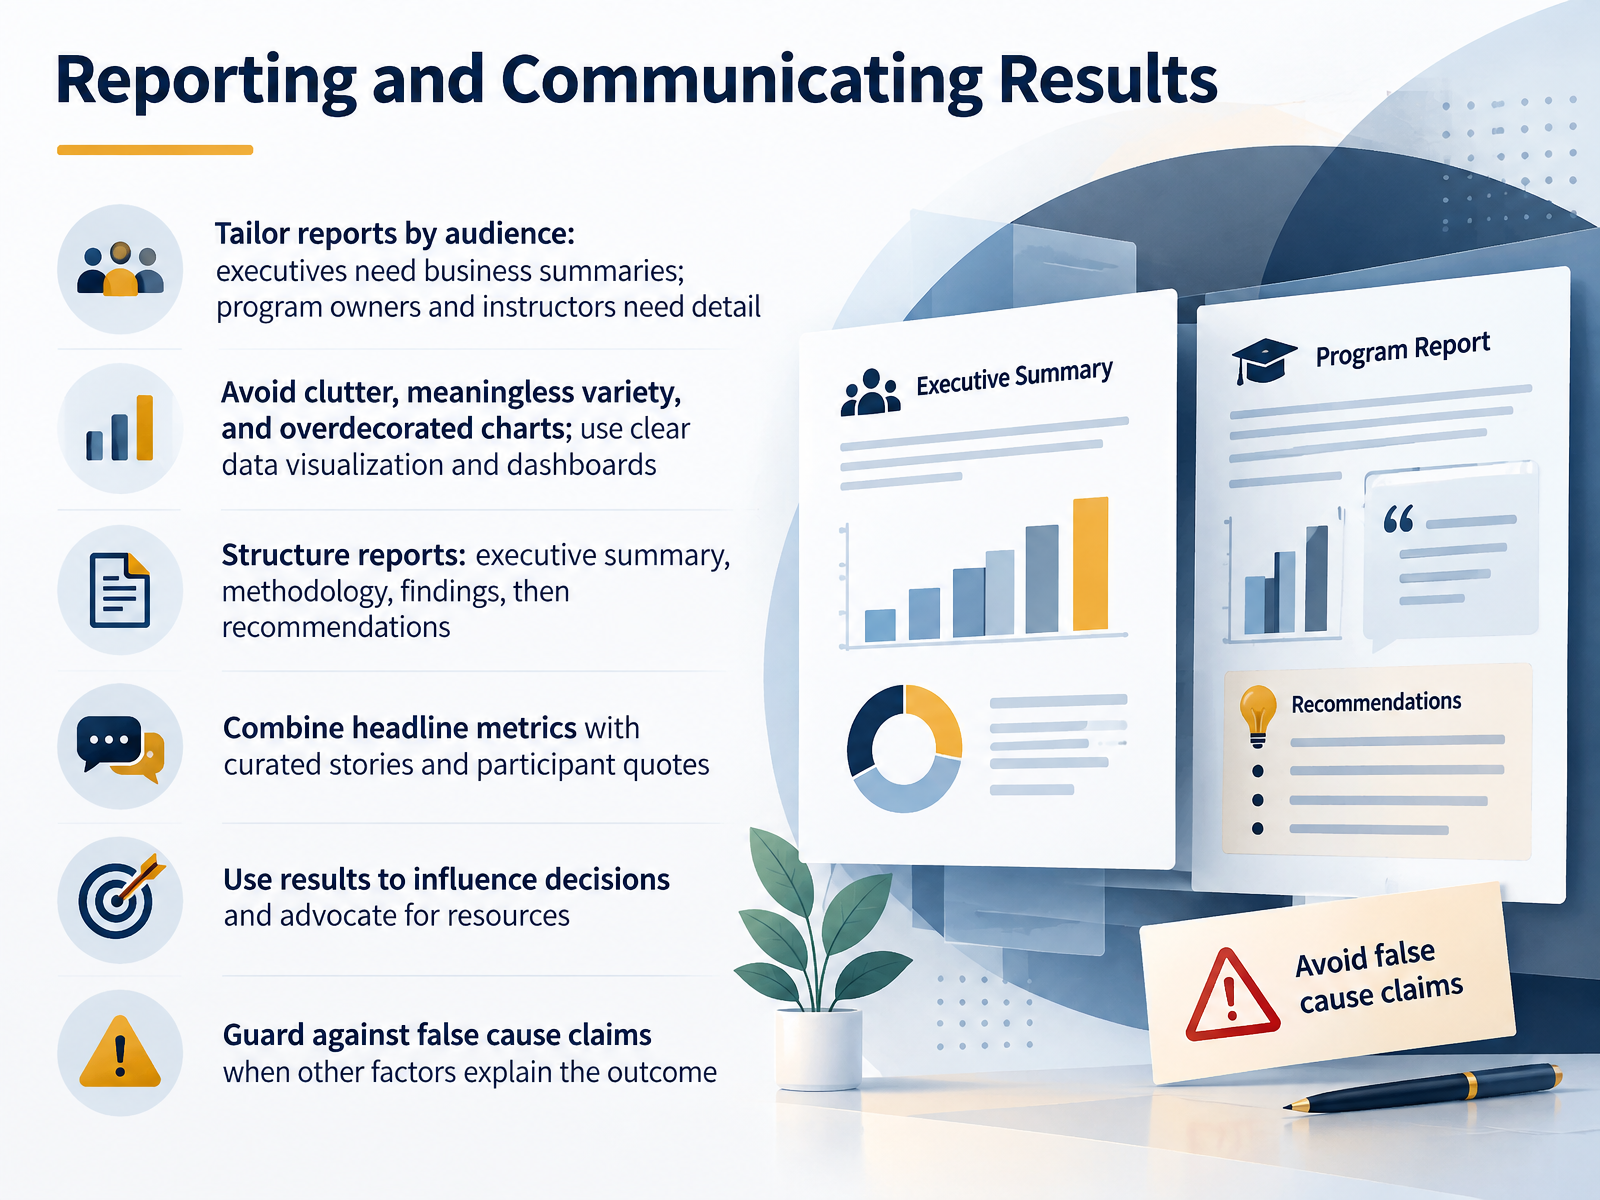
 - 10Reporting and Communicating ResultsLet's talk about reporting and communicating results. The same evaluation findings can land very differently depending on who's reading. Executives want a business summary, maybe two paragraphs and one clear chart. Program owners and instructors want the detail: which modules worked, where learners struggled, what to fix next. So tailor the report, don't send everyone the same file. Keep your visuals clean. Too much data, too little context, meaningless variety, and overdecorated charts all undermine credibility. Then structure the report the same way every time: executive summary, methodology, findings, recommendations. Combine headline metrics with a few curated stories and participant quotes. Numbers show scale, stories show meaning. Use those results to influence decisions and advocate for resources. And one caution: guard against false cause claims. If performance improved, ask what else changed. Say the training likely contributed, not that it caused the result. Be honest and specific, and people will keep trusting your data. Next, we'll look at overcoming barriers and building a measurement culture.
 trainingindustry.com2 min
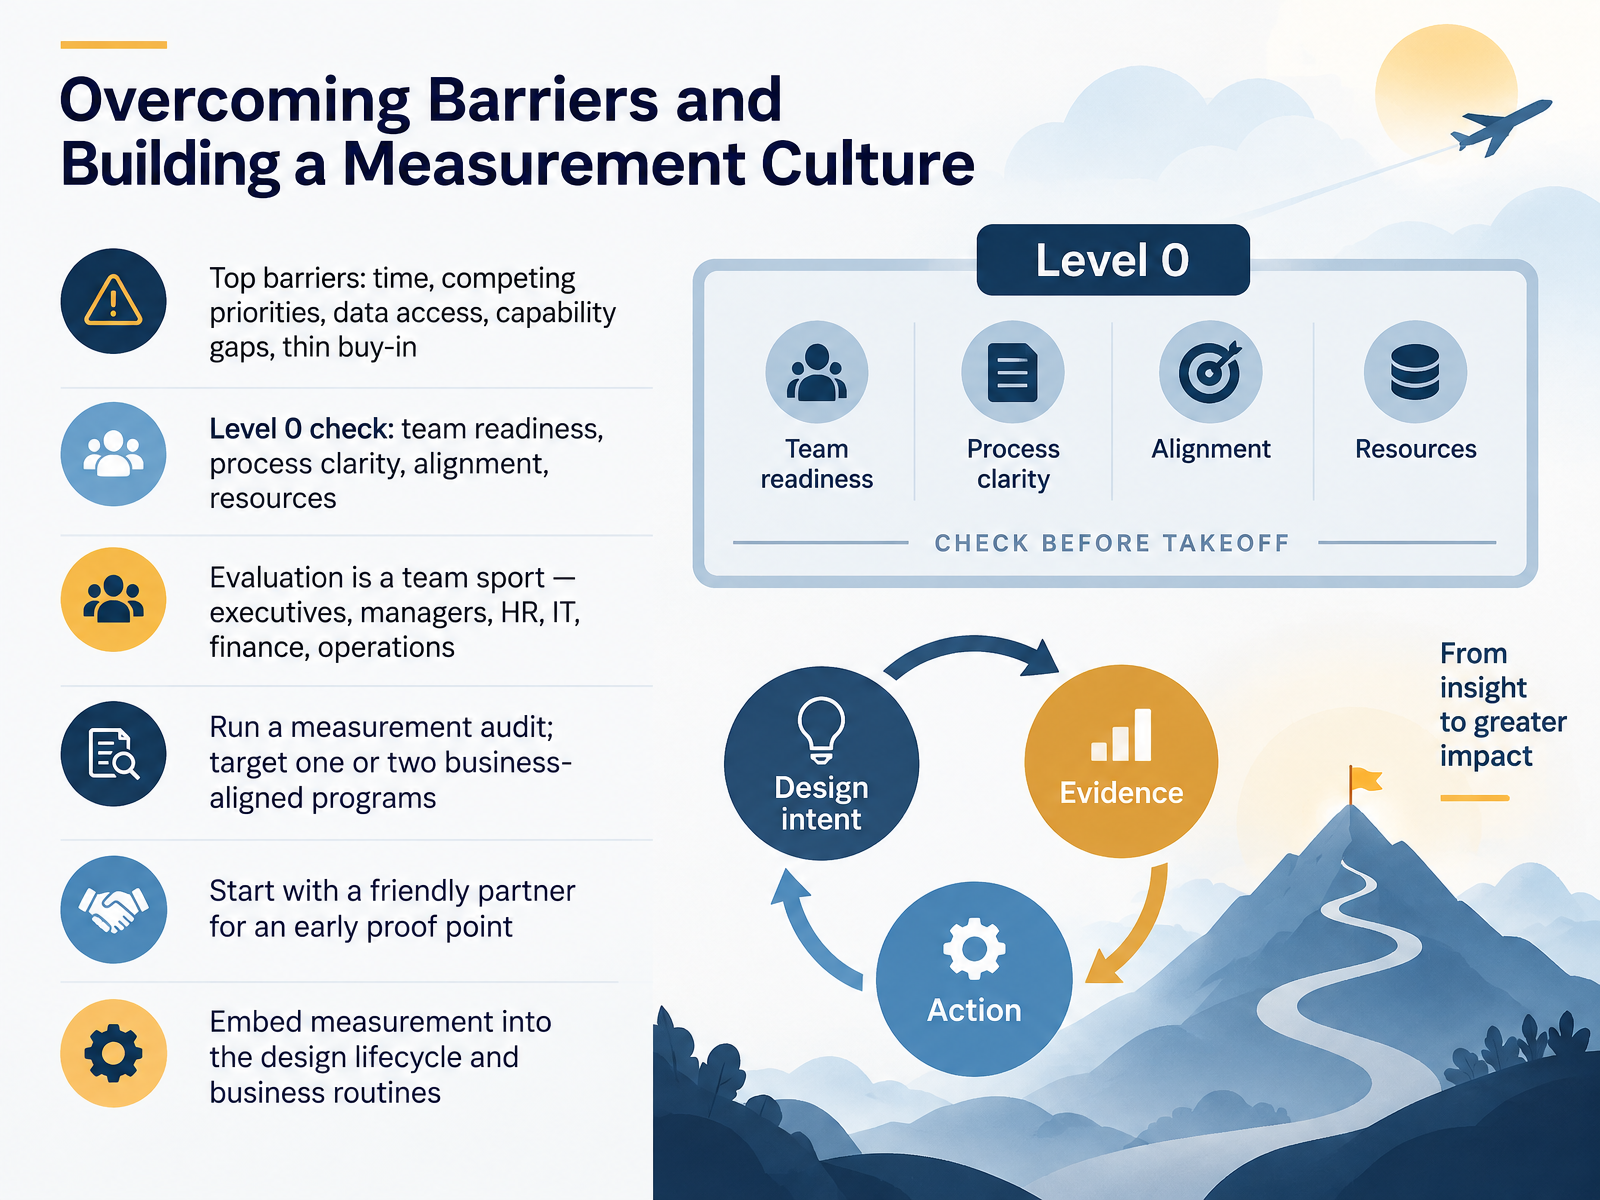
 - 11Overcoming Barriers and Building a Measurement CultureLet's talk about the barriers you'll face, because naming them is half the battle. The usual suspects are time, competing priorities, limited data access, capability gaps, and thin buy-in from leadership. Before you push forward, run a Level Zero check on your own team: are you ready, are your processes clear, is everyone aligned, and do you have the resources to actually follow through? Here's the reframe that matters most. Evaluation is a team sport. Executives, managers, HR, IT, finance, and operations all have a role. So start with a measurement audit to see what data you already have. Then pick one or two programs tied directly to business goals. Choose a friendly partner for that first proof point. Finally, embed measurement into your design lifecycle and your regular business routines, so it becomes a habit, not a one-time project. Next, we'll move into practical application, building your measurement plan.
 2 min
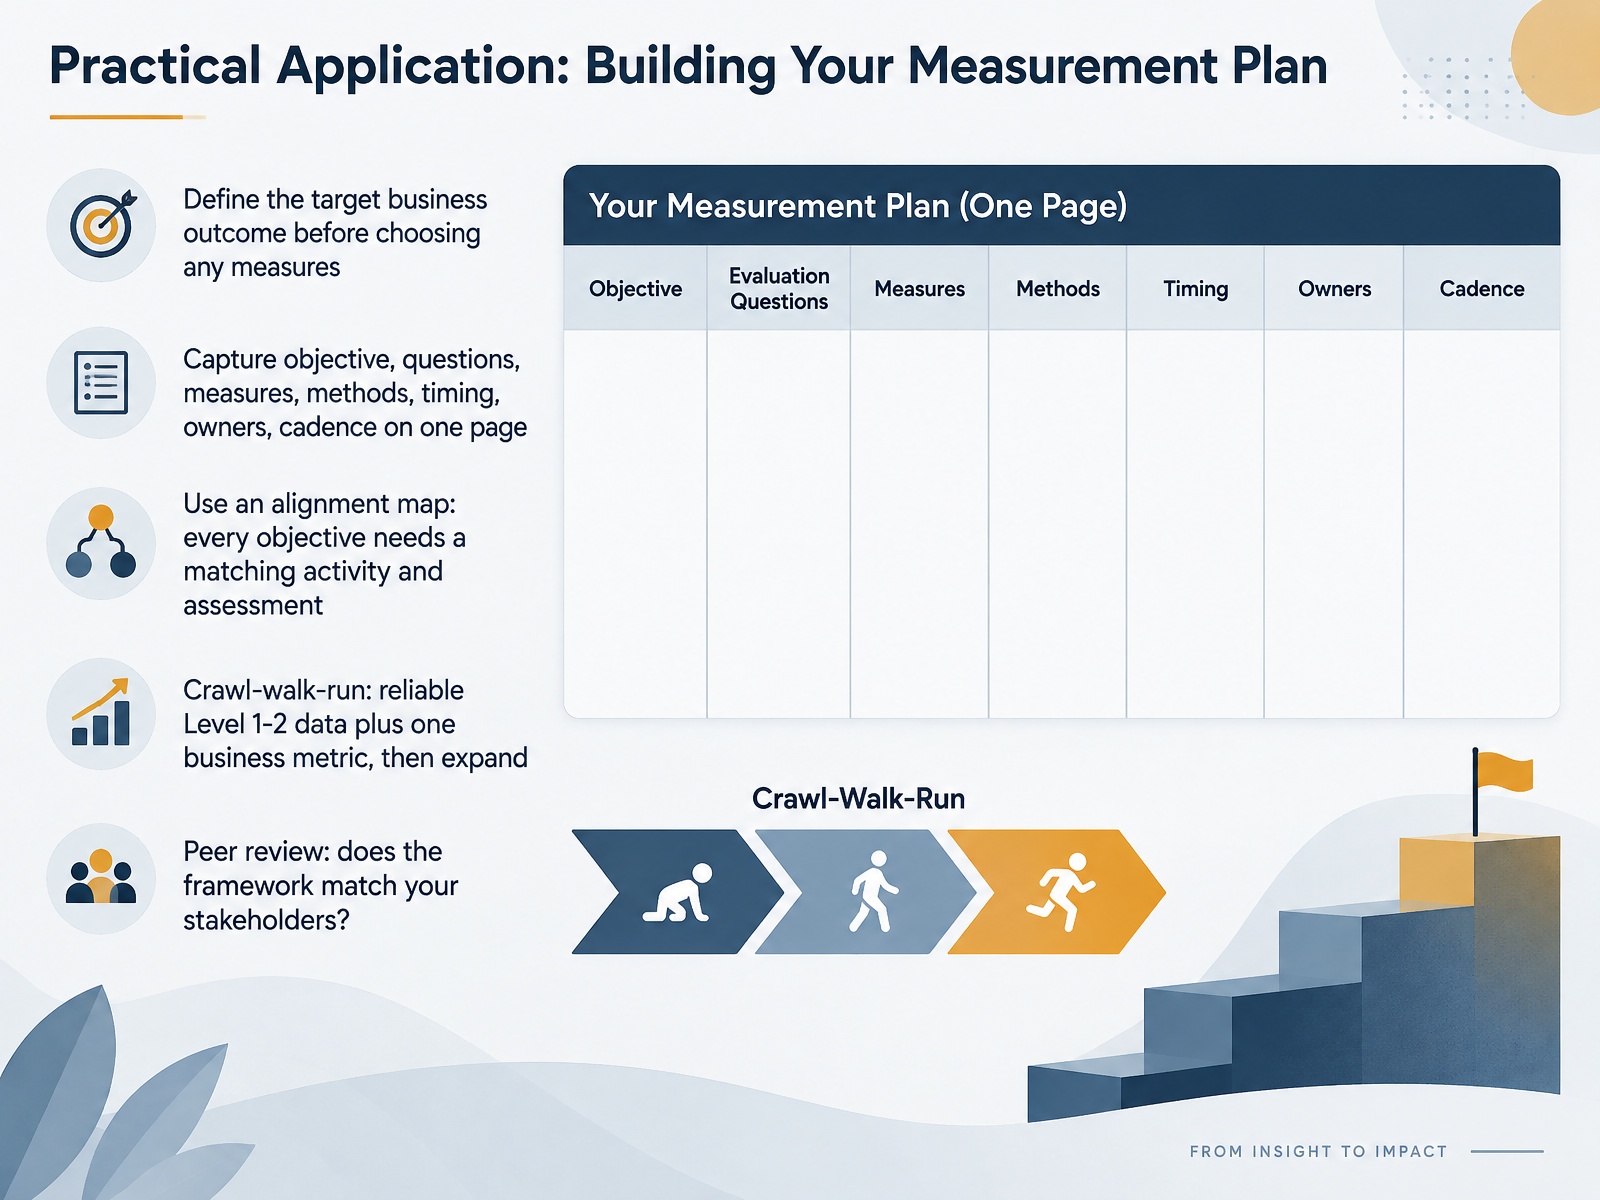
2 min - 12Practical Application: Building Your Measurement PlanLet's turn all of this into something you can actually build. Start with the business outcome. Decide what has to change on the job before you pick a single measure, because the outcome drives everything that follows.
Then put it on one page: objective, questions, measures, methods, timing, owners, and cadence. One page forces the hard decisions. If it doesn't fit, you haven't prioritized yet.
Next, build an alignment map. Every objective needs a matching activity and a matching assessment. When a reviewer spots an objective with no assessment, that's your misalignment, caught early and cheap.
And pace yourself. Crawl, walk, run. Get reliable Level one and Level two data plus one business metric first. That's credible. Then expand.
Finally, have a peer review it. Ask whether the framework matches what your stakeholders actually care about.
In the next session, we'll workshop this together, with peer review and action planning.
 2 min
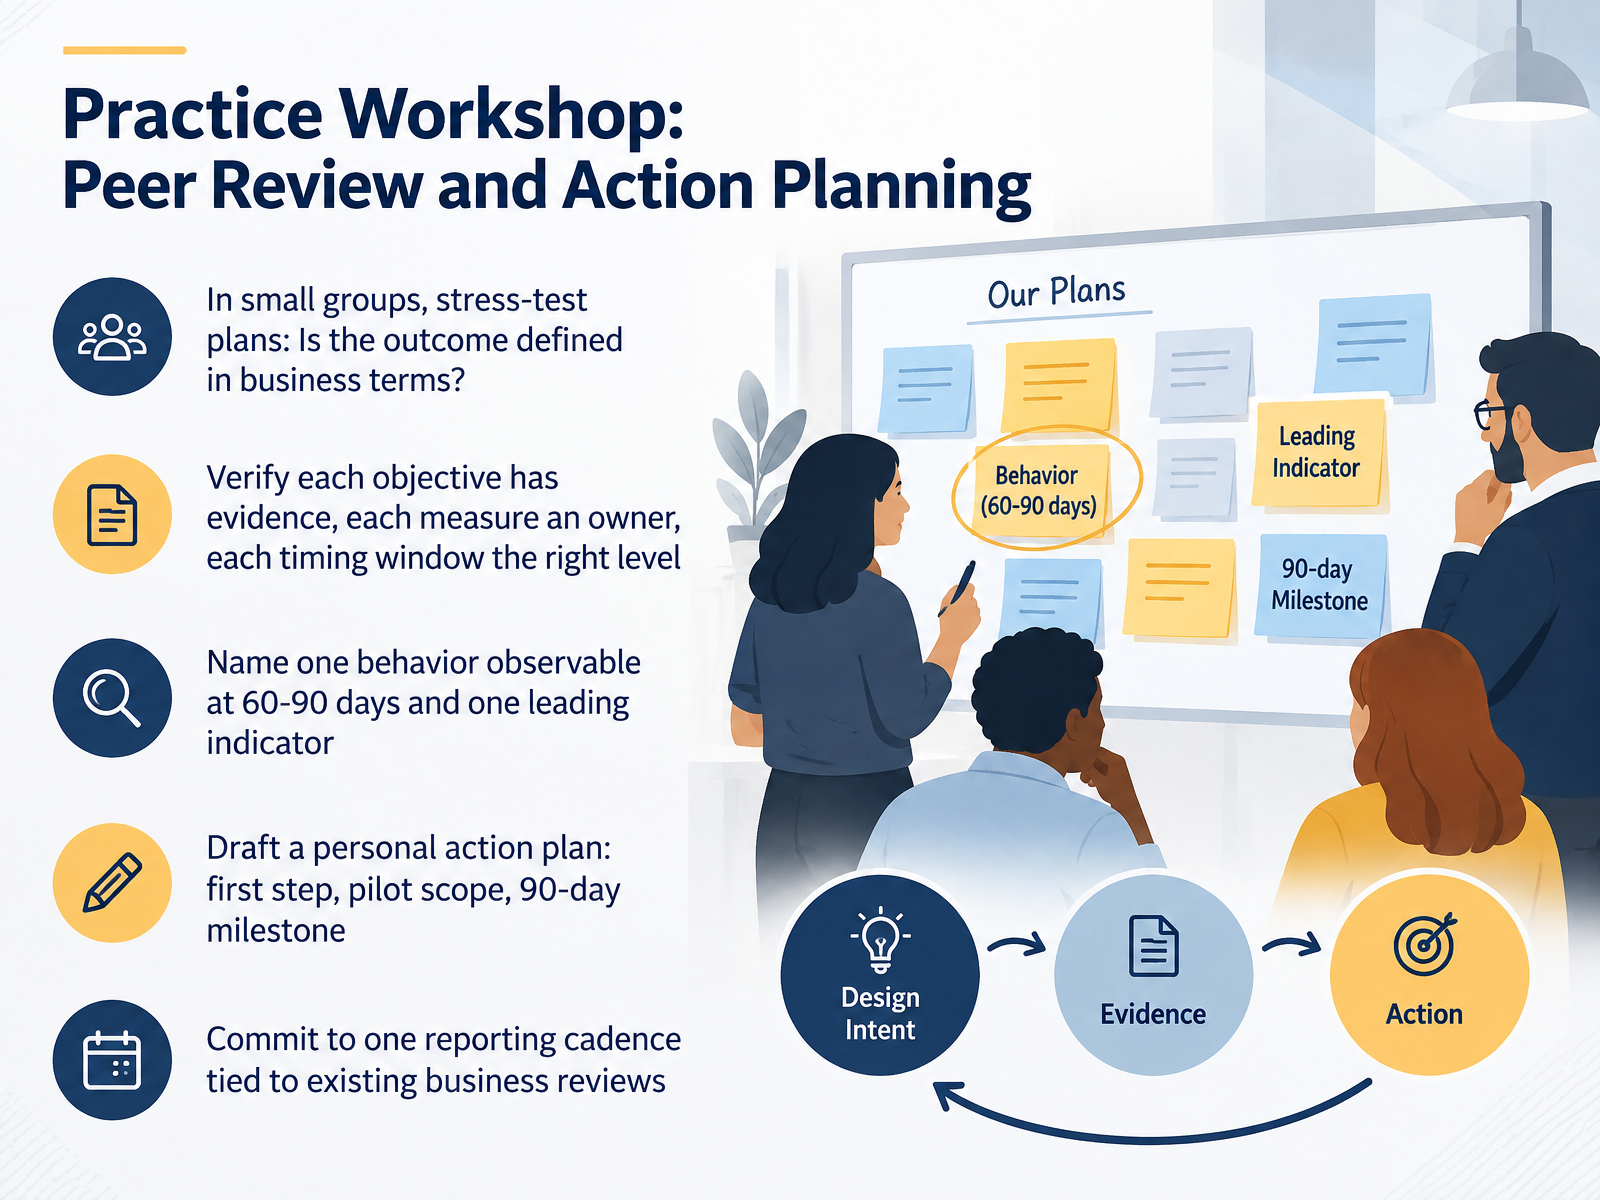
2 min - 13Practice Workshop: Peer Review and Action PlanningNow let's put this into practice. This workshop is where your plans get tested and your commitments get made.
Work in small groups and stress-test each other's plans. Start with one question: is the outcome defined in business terms? Not learning terms, business terms. If you can't name the metric a sponsor already cares about, rewrite the outcome before you go further. Then verify three things. Every objective has evidence behind it. Every measure has a named owner. Every timing window matches the level you're measuring, so behaviour at sixty to ninety days, results later. Then name one behavior you can observe at sixty to ninety days, and one leading indicator that tells you early whether that behavior is on track.
From there, draft a personal action plan. Write down your first step, your pilot scope, and your ninety-day milestone. Keep the pilot small enough that you can actually watch it, and specific enough that you know whether it worked.
Finally, commit to one reporting cadence tied to a review that already exists. If your business already meets monthly on operations, attach your update there. Don't build a new meeting. Borrow an existing one, and bring evidence, not activity counts.
Before you move on, one checkpoint. Can you state your outcome, your evidence, and your cadence in under a minute? If you can, your plan is reviewable. If you can't, it's still a draft.
Let's pull the threads together now, in our wrap-up on key takeaways and continuous improvement.
 trainingindustry.commindstamp.compeoplepilot.io+22 min
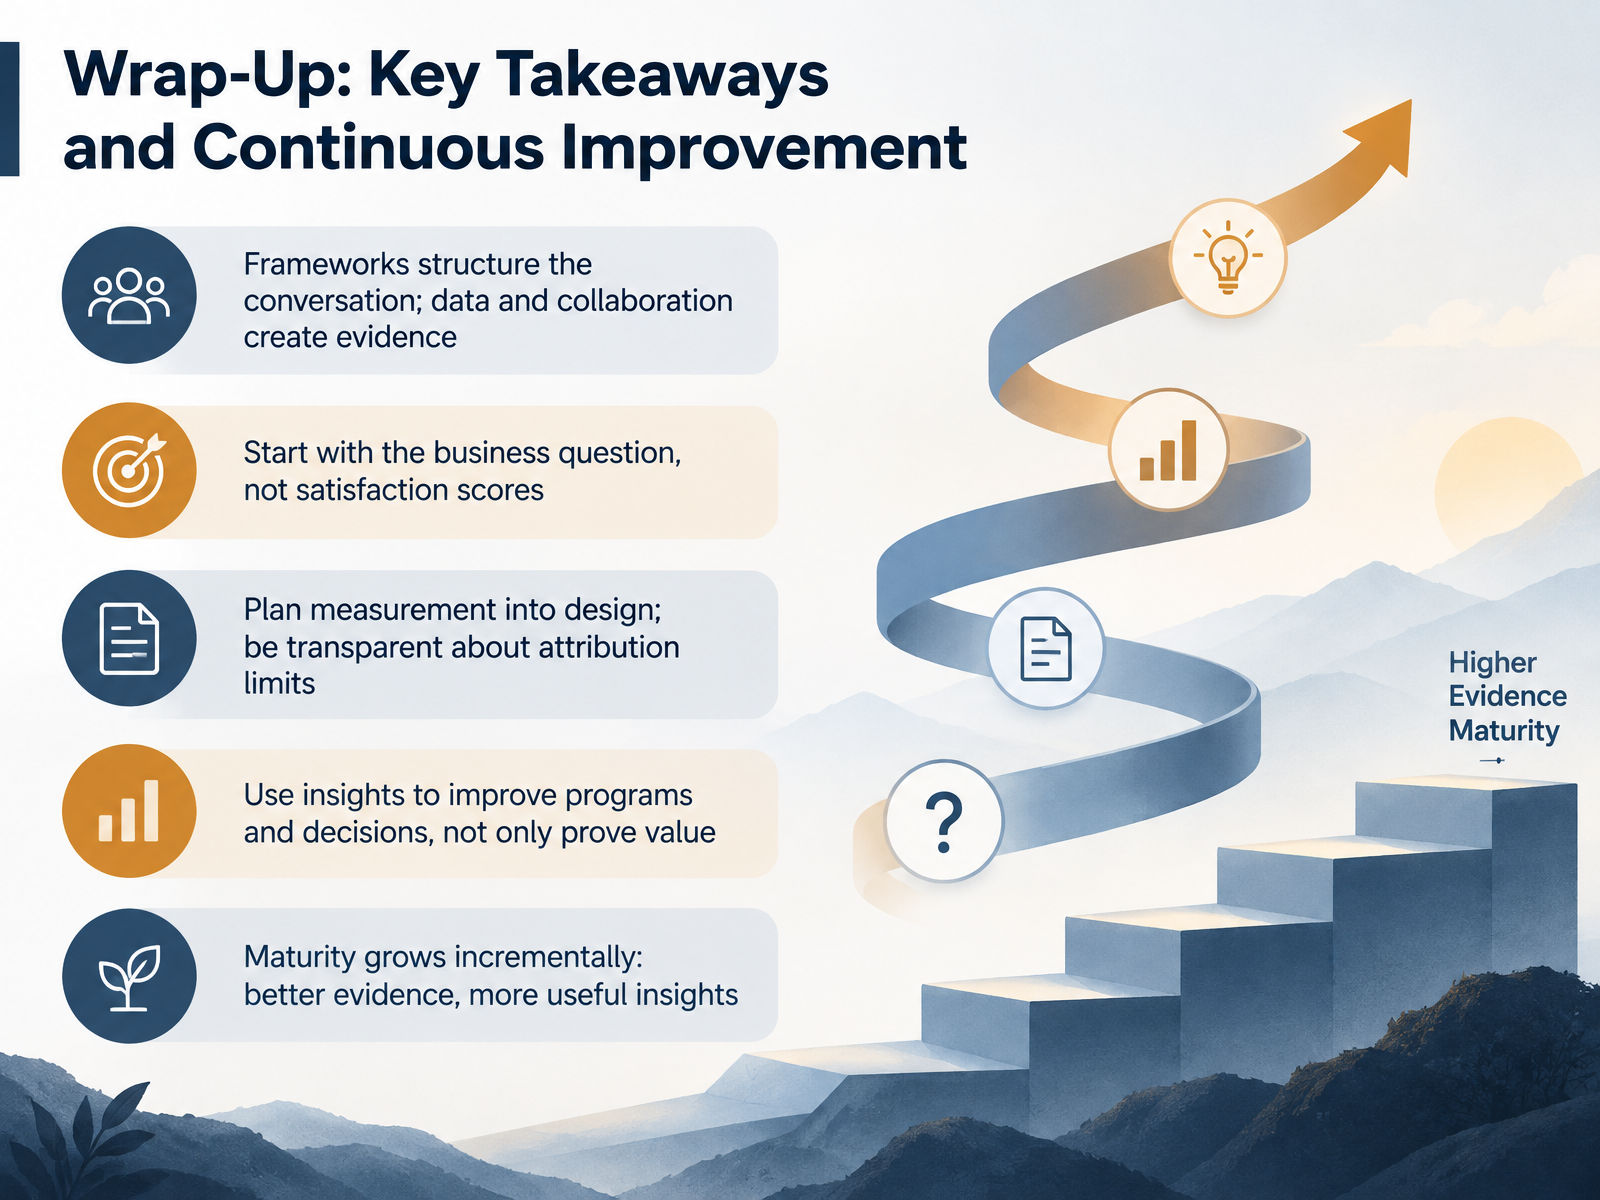
 - 14Wrap-Up: Key Takeaways and Continuous ImprovementLet's bring this together. Frameworks structure the evaluation conversation, but they don't create evidence on their own. Data and collaboration do that. So start with the business question, not satisfaction scores. Ask what decision you're trying to inform. Plan measurement into the design from the beginning, and be transparent about attribution limits. You rarely prove training alone moved a number, and saying so builds credibility rather than eroding it. Then use those insights to improve programs and decisions, not just to prove value. Maturity grows incrementally. Better evidence today, more useful insights tomorrow. Thank you for working through this with me. You now have a practical path to measure outcomes that matter. Keep it steady, keep it honest, and keep improving.
 blueedgewater.comblueedgewater.comimpactcheck.net+21 min
Take the deck with you
Download this course as a file — free, no sign-up needed.
- PDF handoutEvery slide page, ready to print or share.15 pages · 3.5 MBDownload
- Narrated PowerPointThe deck that presents itself — every slide carries the digital human's narration video.15 pages · 13.8 MBDownload
- PowerPoint slidesThe full deck as a .pptx — open it in PowerPoint, Keynote, or Google Slides.15 pages · 3.5 MBDownload
Free to use in your own training — please keep the PersonWise credit page at the end.
Have your own deck? Turn it into a course
Sources consulted
Web sources consulted while building this course.
- Measuring the Value of Learning: Getting to Kirkpatrick Levels 3 and 4 - Training Industry — trainingindustry.com
- Kirkpatrick Partners, LLC. Why Evaluation in 2025 is More Critical than Ever - Kirkpatrick Partners, LLC. — kirkpatrickpartners.com
- Kirkpatrick’s Model — mindtools.com
- The Enhanced Kirkpatrick Model—Your ROI Foundation - eLearning Industry — elearningindustry.com
- Kirkpatrick model for course evaluations | FrontCore — frontcore.com
- Kirkpatrick vs. LTEM: Two Models, One Mission (Evaluating Impact) - JB LDT Portfolio — blueedgewater.com
- Reflections on Evaluation Models: Kirkpatrick, LTEM, and the Evolving Role of Instructional Designers - JB LDT Portfolio — blueedgewater.com
- Nine Training Evaluation Models Compared — ImpactCheck — impactcheck.net
- Evaluation: Russ-Eft and Preskill v. Kirkpatrick — S. Matthew Sypert — smatthewsypert.com
- Model your measure on what fits you best - The Upside Learning Blog — blog.upsidelearning.com
- Where to Start: Backward Design – Teaching + Learning Lab — tll.mit.edu
- elearn Magazine: Backward Design: Aligning learning objectives and assessments — elearnmag.acm.org
- Course and Syllabus Design | Center for Excellence in Teaching and Learning | Virginia Tech — teaching.vt.edu
- Backward Design and Learning Objectives | Center for Teaching and Learning | The University of Vermont — uvm.edu
- Michael V. Drake Institute for Teaching and Learning — drakeinstitute.osu.edu
- 7 Essential Training Evaluation Methods for 2025 — mindstamp.com
- Transform L&D Analytics: Measure Training Impact Without Technical Expertise — peoplepilot.io
- How to Use the Kirkpatrick Model in Training Modules — tericbrooks.com
- Building a Culture of Evaluation: The New Kirkpatrick Model for Performance and Innovation — assets.td.org
- Measuring the Success of Sales Training — roiinstitute.net