Begin
12 pages · ~24 min
Measuring Data Science Outcomes
This training teaches data scientists and analytics managers how to measure and communicate the business impact of data science initiatives.
A digital instructor presents all 12 pages. Hold “Ask” at any point and ask out loud — the answer comes from this course. No sign-up needed.
What you’ll learn
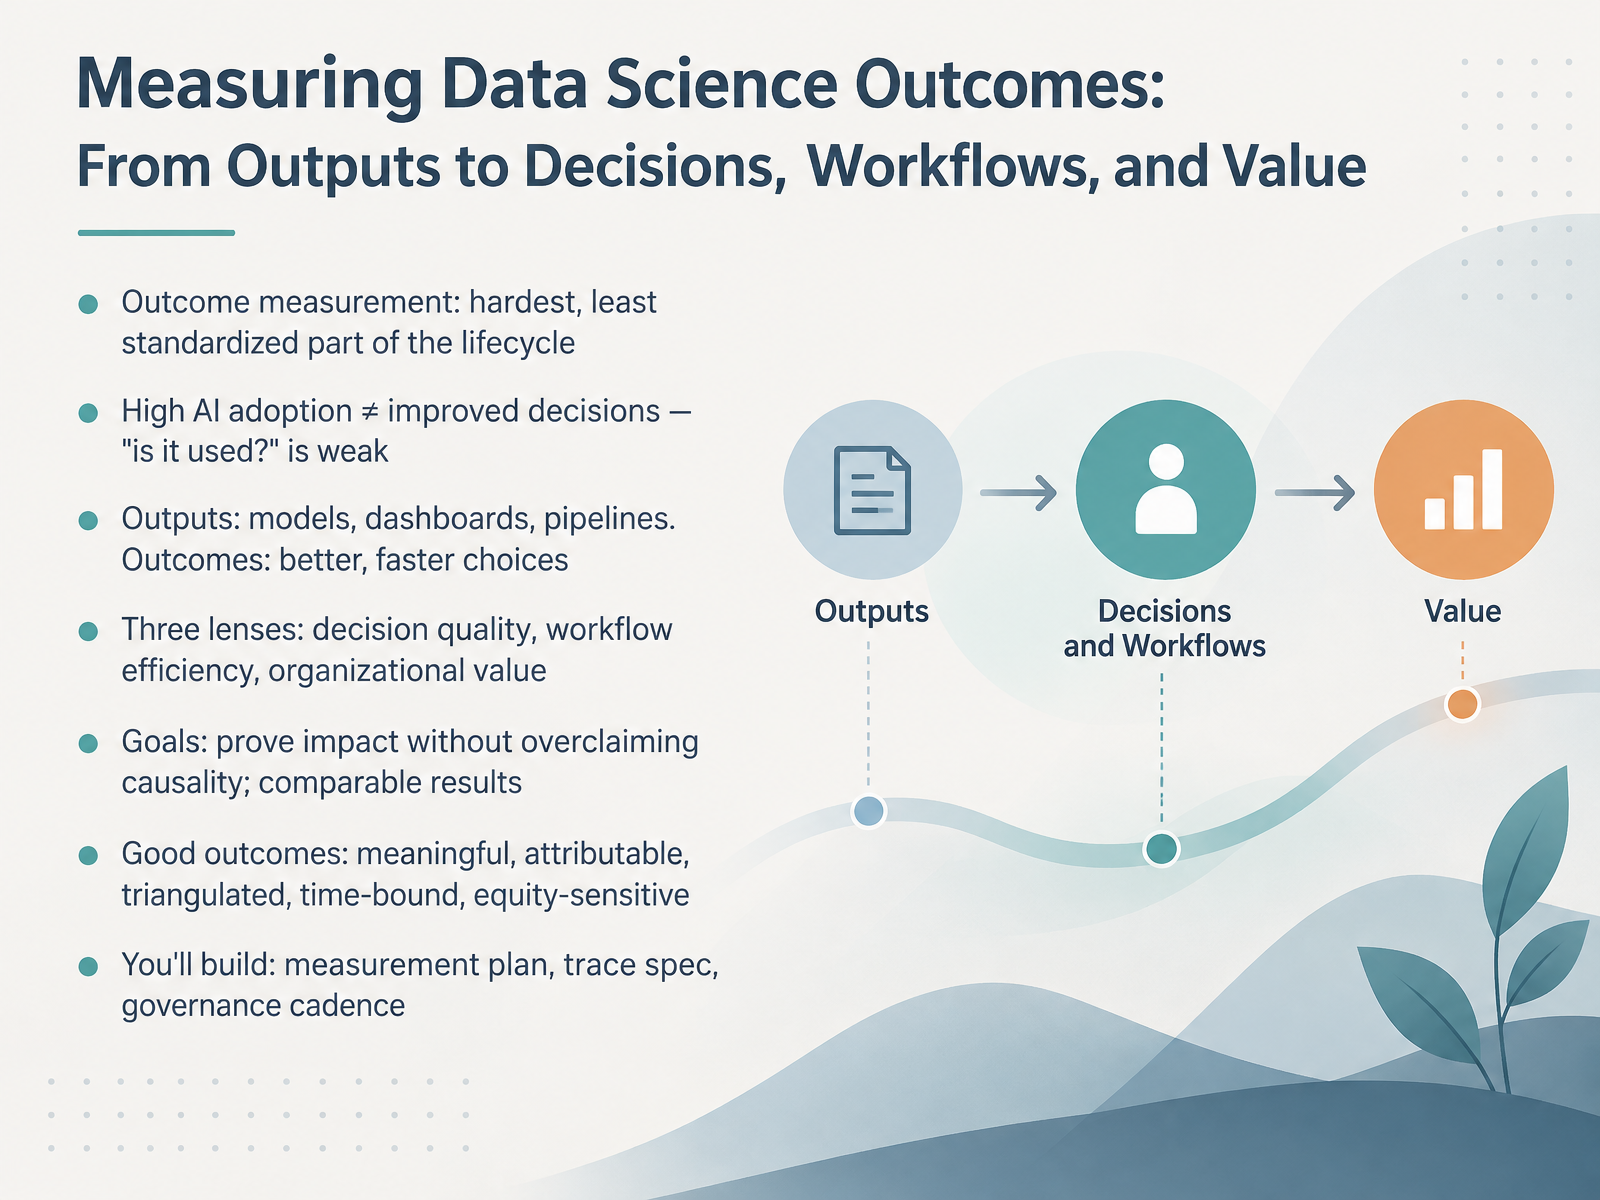
- 01Measuring Data Science Outcomes: From Outputs to Decisions, Workflows, and ValueWelcome. I'm glad you're here. Today we're talking about measuring data science outcomes. This is the hardest and least standardized part of the lifecycle. Here's the core problem. High adoption of an AI tool does not mean decisions got better. Asking 'is it used?' is a weak measure. So we separate two things. Outputs are the models, dashboards, and pipelines we build. Outcomes are better, faster choices. We'll use three lenses. Decision quality. Workflow efficiency. And organizational value. Our goals are simple. Prove impact without overclaiming causality. And produce results that are comparable across teams. Good outcomes are meaningful, attributable, triangulated, time-bound, and equity-sensitive. By the end, you'll build a measurement plan, a trace specification, and a governance cadence. Let's move from model metrics to decision metrics.2 min
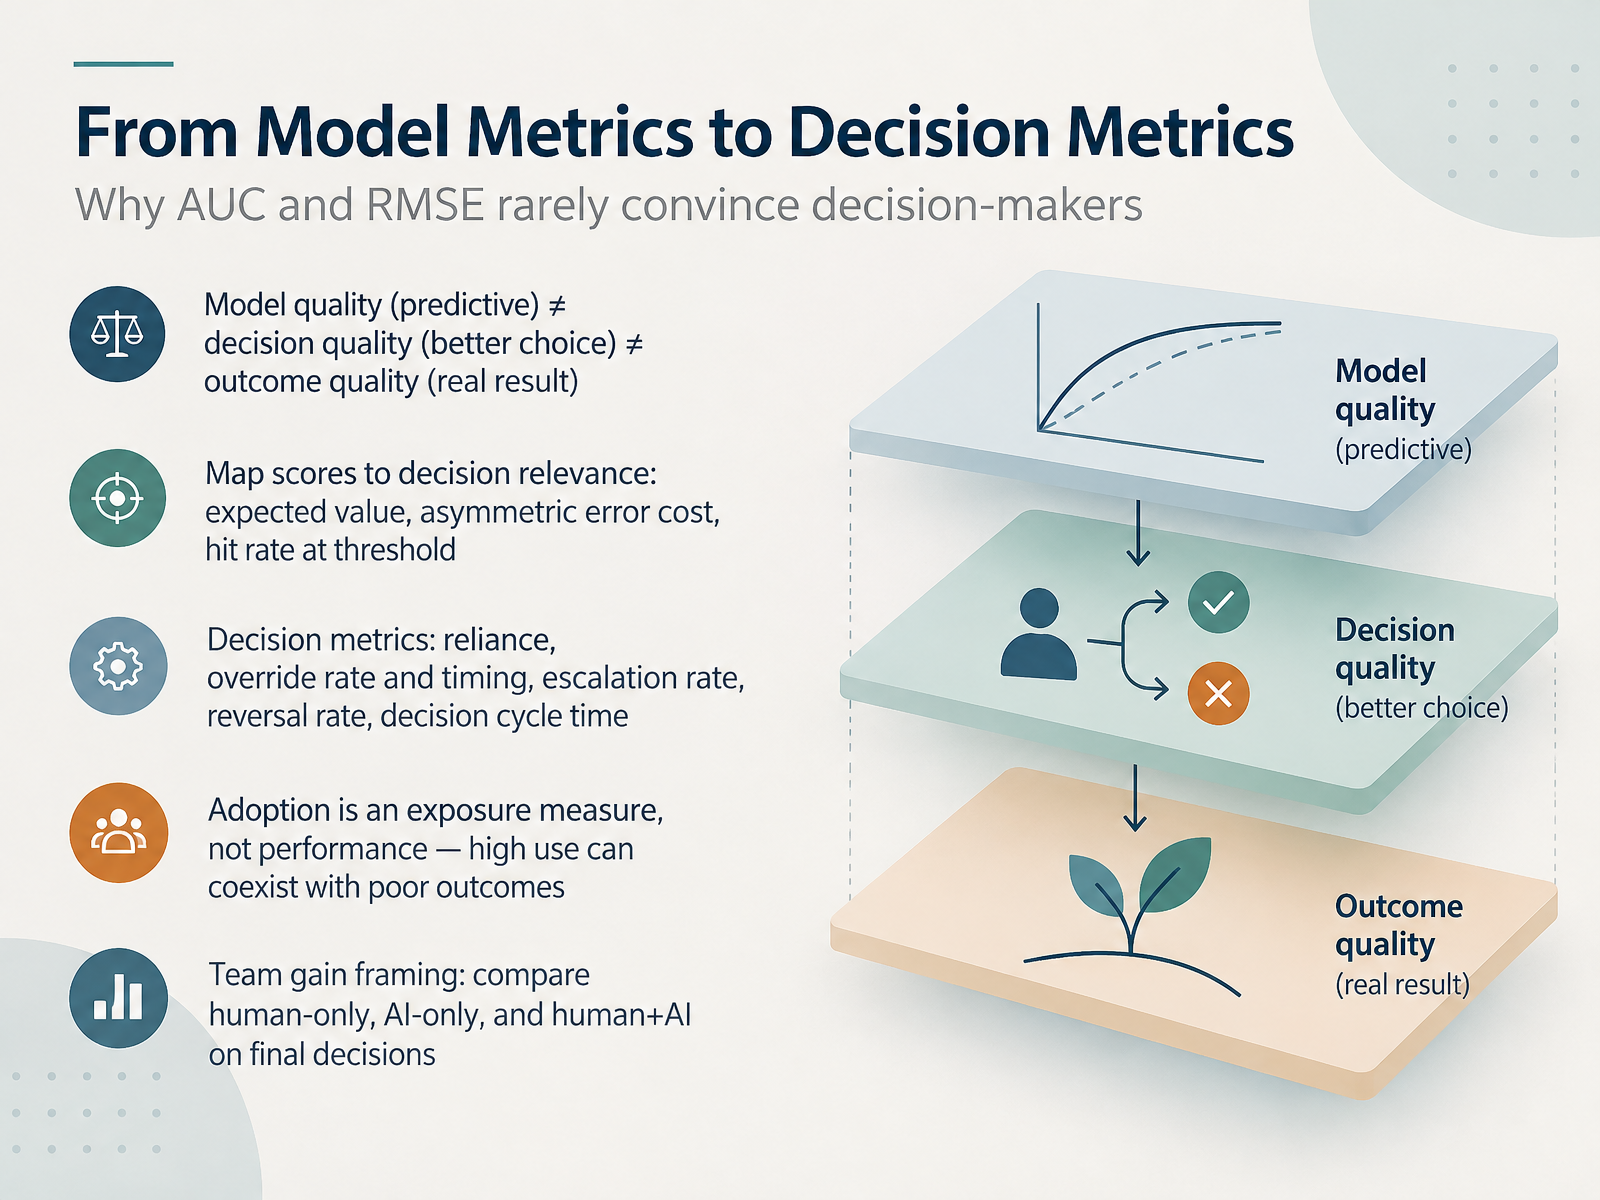
- 02From Model Metrics to Decision MetricsLet's move from model metrics to decision metrics. Here's the core problem. A model can score well and still fail to change anything. So keep three layers separate. Model quality is predictive. Decision quality is choosing better. Outcome quality is the real result you get. Those are not the same thing. AUC and RMSE rarely convince decision-makers, because they don't say what anyone should do differently. So map scores to decision relevance. Ask what the expected value is, what asymmetric error costs look like, and what the hit rate is at your actual threshold. Then instrument decision metrics like reliance, override rate and timing, escalation rate, reversal rate, and decision cycle time. One caution. Adoption is an exposure measure, not a performance measure. High use can coexist with poor outcomes. Finally, frame the team gain by comparing human-only, AI-only, and human plus AI on final decisions. Next, we'll look at instrumenting workflows and human-in-the-loop signals.
 2 min
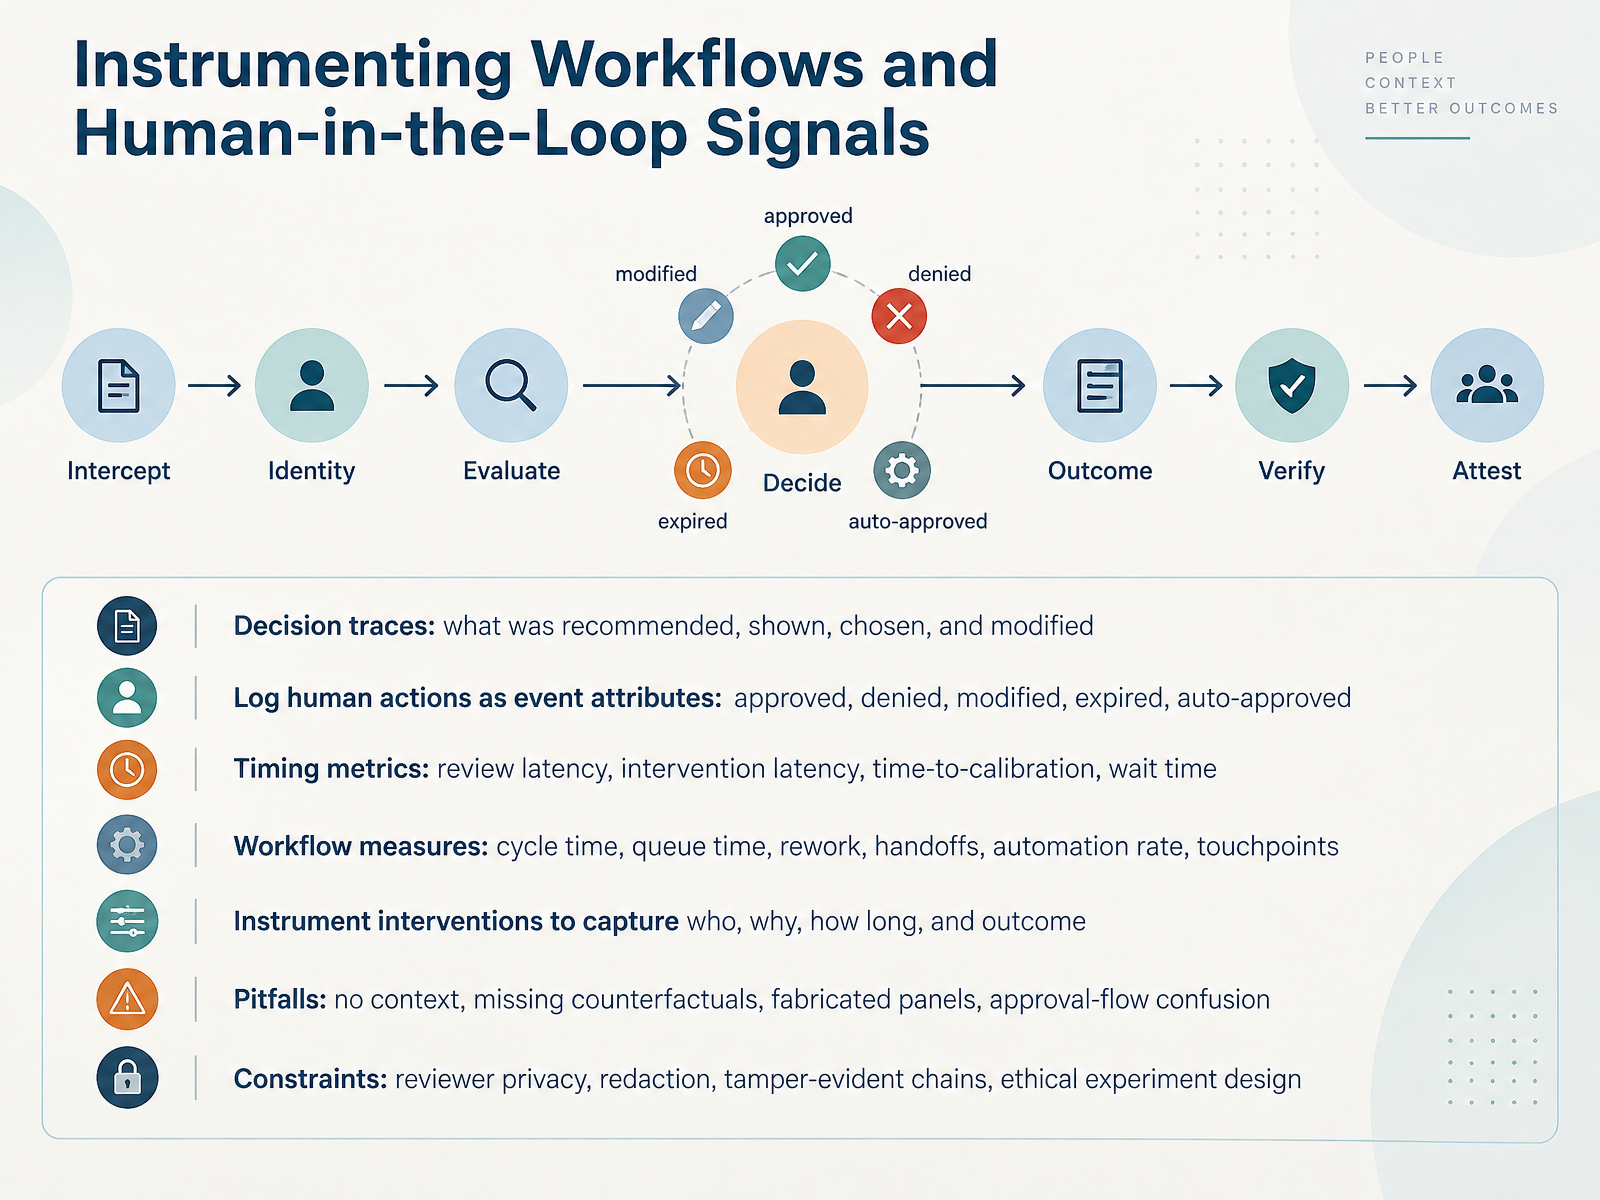
- 03Instrumenting Workflows and Human-in-the-Loop SignalsLet's move on to instrumentation, because you cannot measure decision impact if the workflow leaves no trace. Start with decision traces. A decision trace records what the model recommended, what was shown to the reviewer, what they chose, and what they modified. That tells you whether the model is shaping decisions or just decorating them. Next, log human actions as event attributes: approved, denied, modified, expired, auto approved. Timing matters too. Capture review latency, intervention latency, time to calibration, and wait time. Then add workflow measures: cycle time, queue time, rework, handoffs, automation rate, and touchpoints. When someone intervenes, instrument who, why, how long, and what happened afterward. Watch the common pitfalls: logs without context, missing counterfactuals, fabricated panels, and confusion between approval and automation flows. And respect constraints: reviewer privacy, redaction, tamper evident chains, and ethical experiment design. Instrument the decision, not just the model. That brings us to choosing and governing metrics.
 1 min
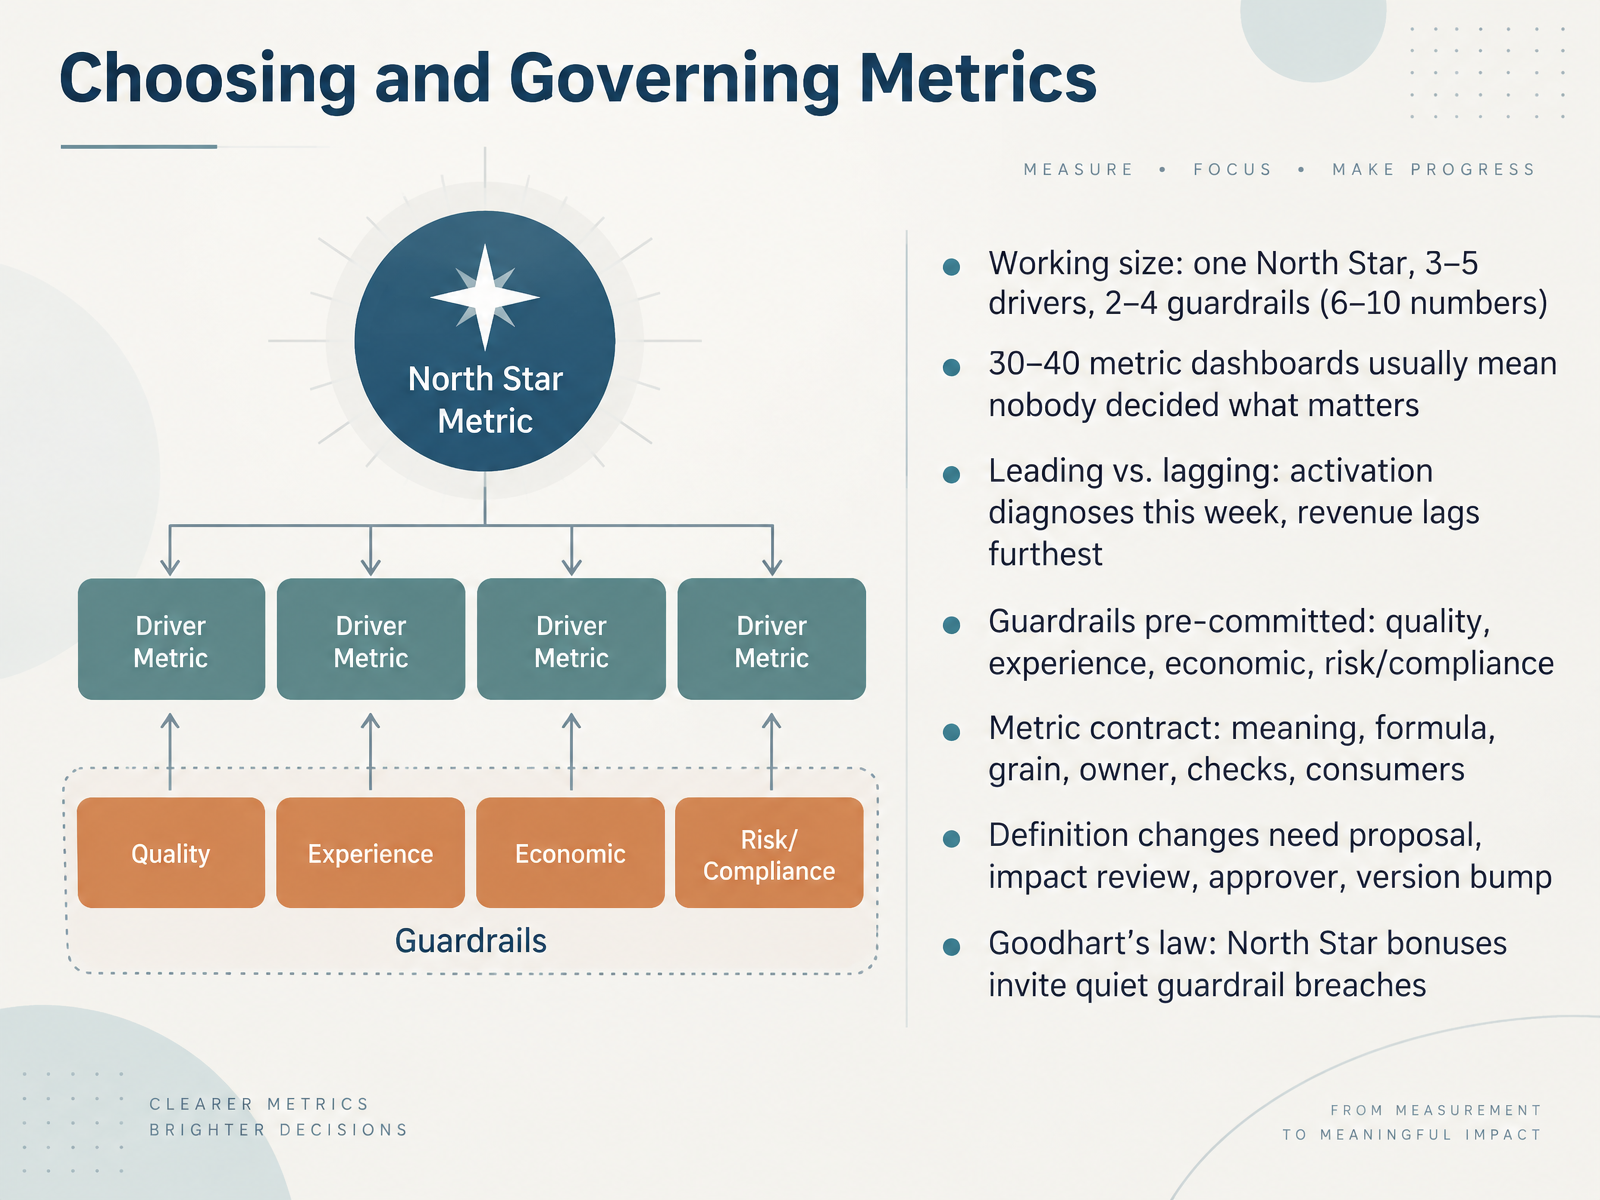
- 04Choosing and Governing MetricsNow let's talk about choosing and governing metrics. Start with working size. One North Star, three to five drivers, and two to four guardrails. That is six to ten numbers total. If your dashboard has thirty or forty metrics, that usually means nobody decided what matters. Separate leading from lagging. Activation is a leading metric. It diagnoses what happened this week. Revenue lags furthest behind. You see it only after the fact. Guardrails should be pre-committed in four areas: quality, experience, economic, and risk or compliance. Define each one in a metric contract: meaning, formula, grain, owner, checks, and consumers. If you change a definition, that needs a proposal, an impact review, an approver, and a version bump. And remember Goodhart's law. If you tie bonuses to the North Star, people may quietly breach the guardrails. So govern the whole set. Next, we move into causal inference for outcome measurement.
 2 min
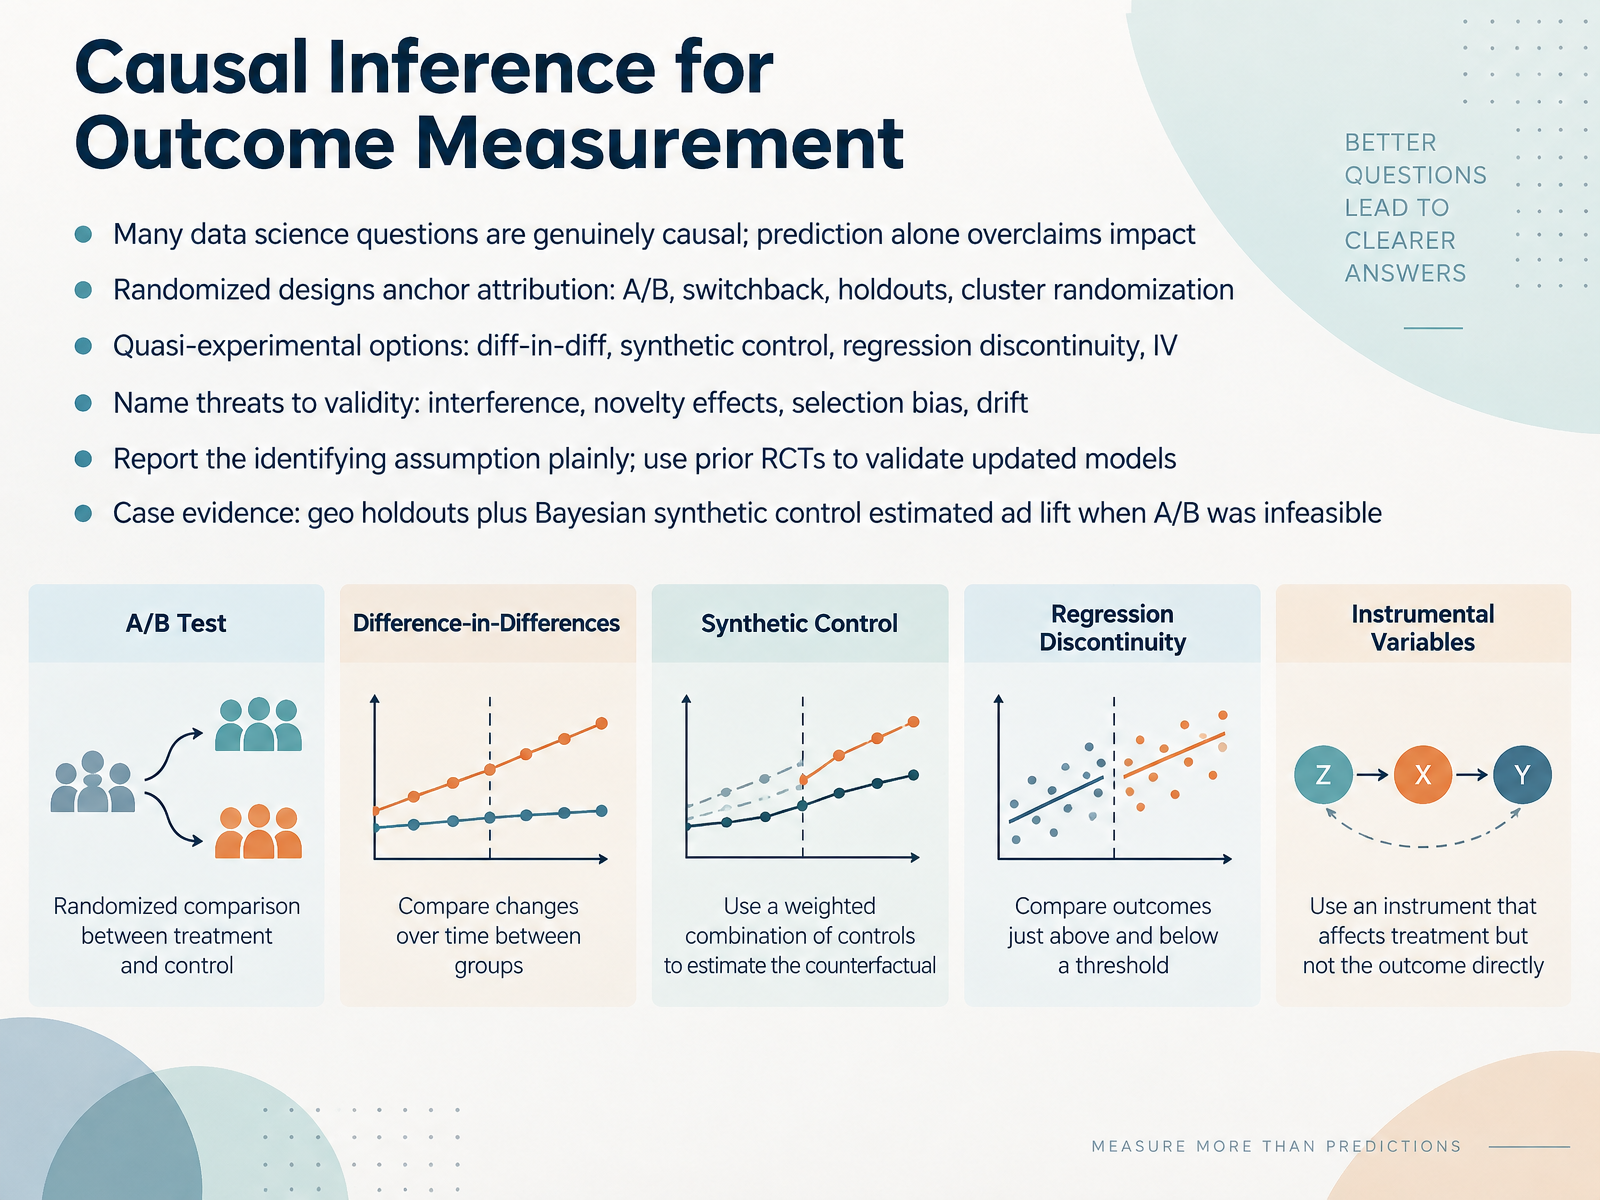
- 05Causal Inference for Outcome MeasurementLet's talk about causal inference for outcome measurement. Many data science questions are genuinely causal. Prediction alone overclaims impact. A model that ranks customers well does not prove the outreach caused them to stay. For attribution, randomized designs are the anchor. That means A/B tests, switchback tests, holdouts, and cluster randomization. When randomization is infeasible, quasi-experimental options help. Difference-in-differences, synthetic control, regression discontinuity, and instrumental variables. Each one needs you to name threats to validity. Interference, novelty effects, selection bias, and drift. Report the identifying assumption plainly. Say what must be true for the estimate to mean what you claim. Use prior randomized trials to validate updated models. A strong example is geo holdouts plus Bayesian synthetic control. That combination estimated ad lift when a clean A/B test was infeasible. Next, we'll look at designing measurement plans before deployment.
 1 min
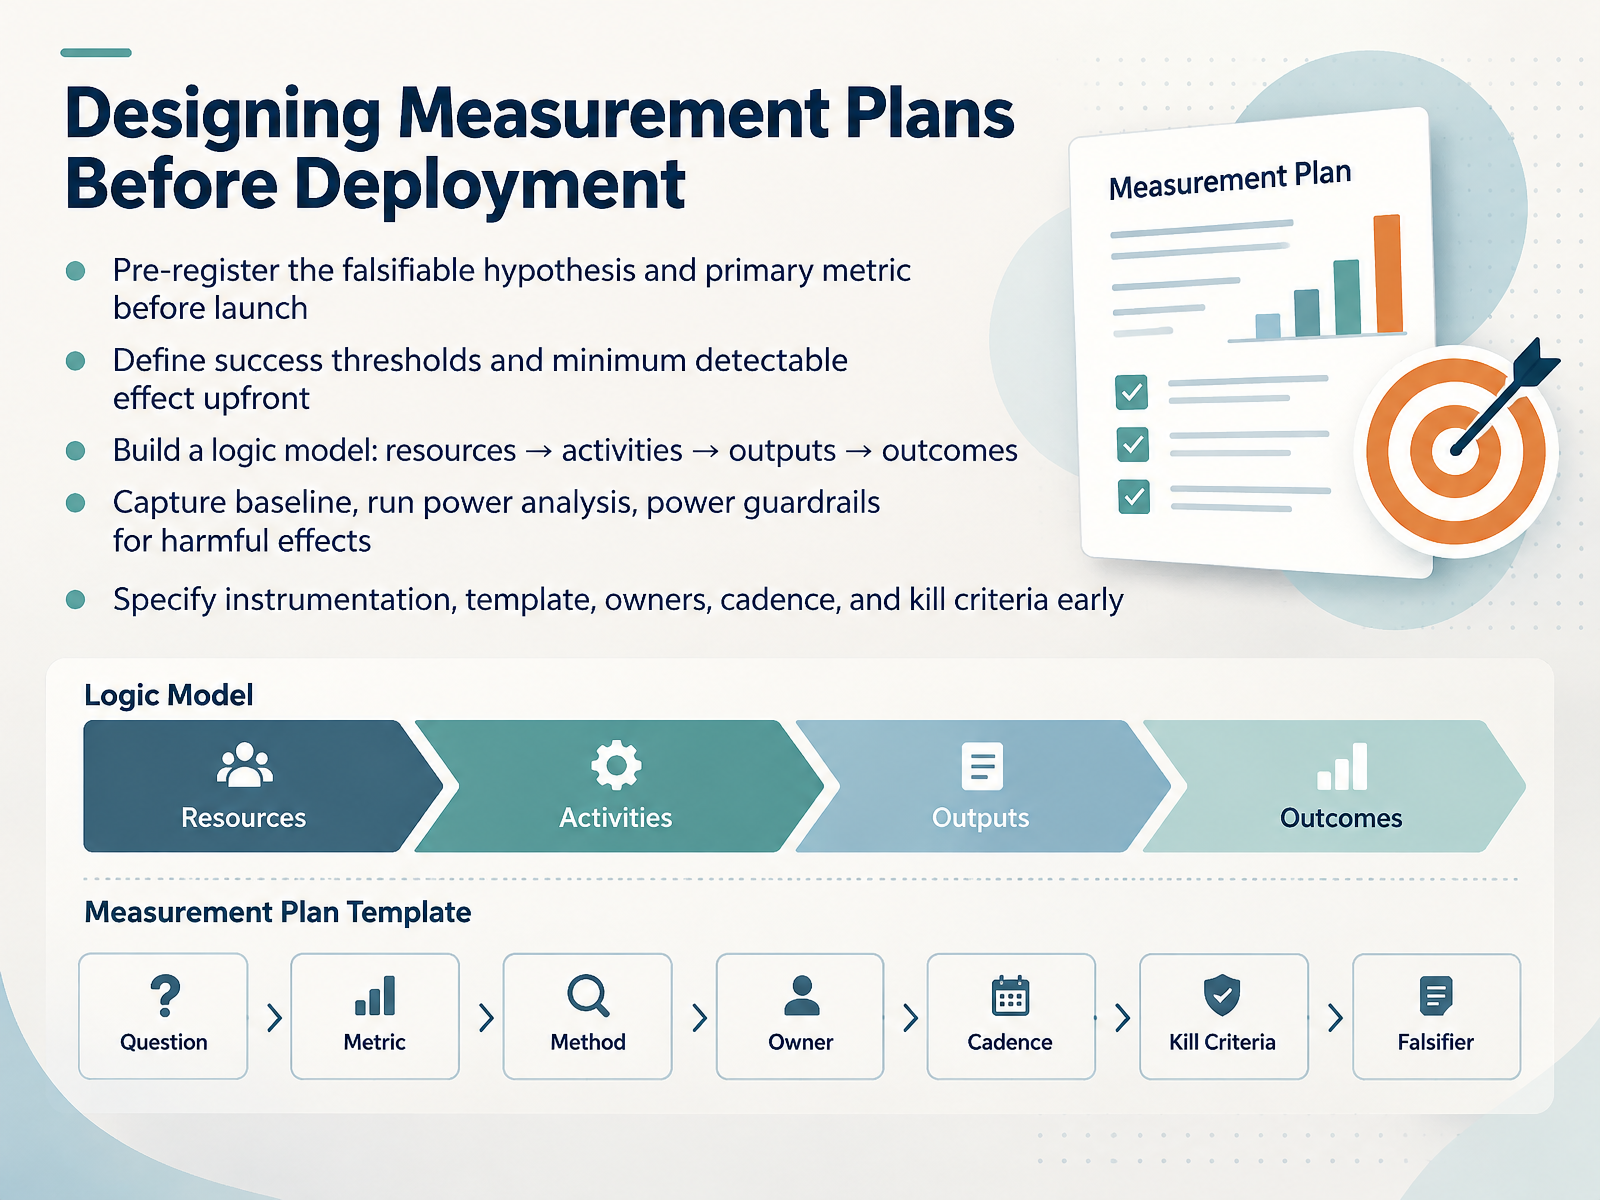
- 06Designing Measurement Plans Before DeploymentLet's talk about designing your measurement plan before deployment. The core principle is simple. Decide what would prove you wrong before you launch, not after you see the results. Start by pre-registering a falsifiable hypothesis and one primary metric. For example, if you expect a fraud model to cut manual reviews by ten percent, write that down, along with the threshold that counts as success and the smallest effect you care about detecting. Then build a logic model. Resources feed activities, which produce outputs, which drive outcomes. A model is an output. A faster decision with fewer errors is an outcome. Before launch, capture your baseline, run a power analysis, and set guardrails so you catch harmful side effects, not just wins. Finally, specify instrumentation, the tracking template, named owners, review cadence, and kill criteria early. That way, stopping or scaling is a planned decision, not an argument. Next, we look at quantifying business and organizational value.
 2 min
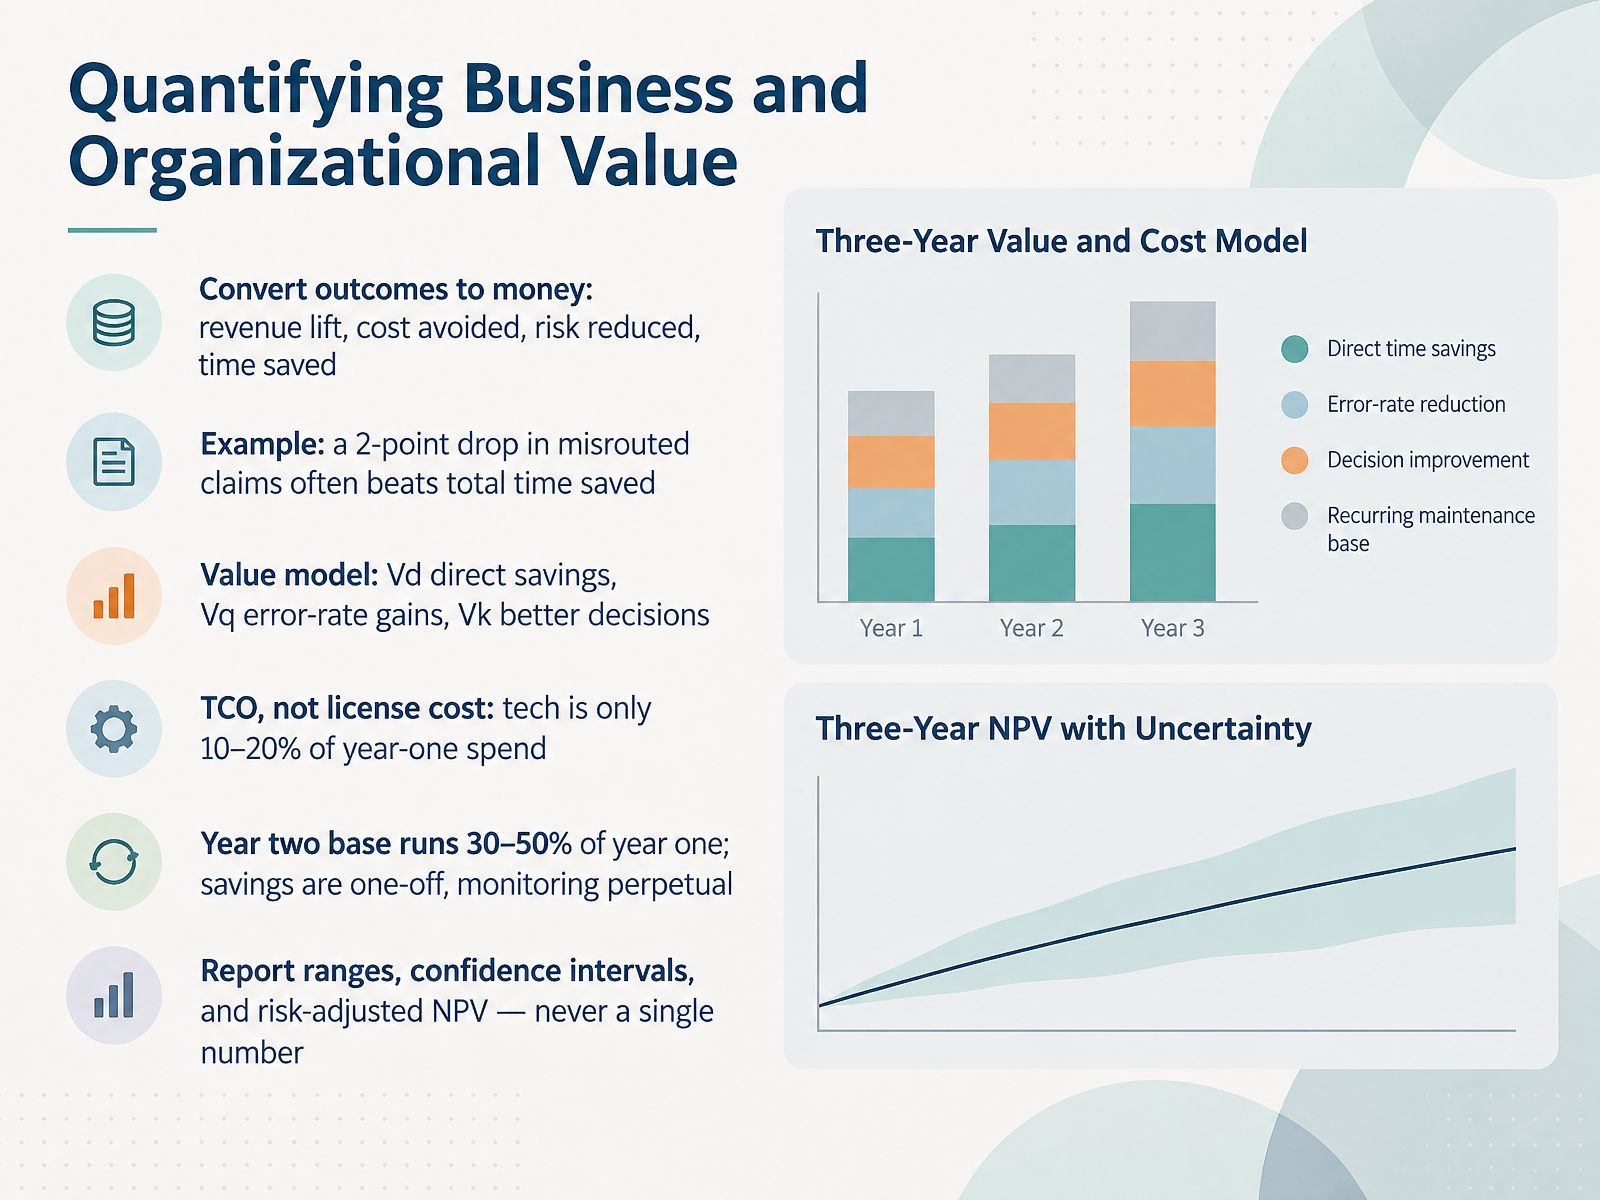
- 07Quantifying Business and Organizational ValueNow let's put numbers on the outcomes. First, convert each one to money. Revenue lift, cost avoided, risk reduced, and time saved. Each measure should point to a specific decision it informs.
Here's why that matters. A two point drop in misrouted claims often beats total time saved. Errors carry rework and customer cost. So the smaller metric can be the bigger win.
Use a value model with three parts. V d for direct savings. V q for error rate gains. V k for better decisions. They rarely move together, so keep them separate.
And count total cost of ownership, not license cost. Technology is only ten to twenty percent of year one spend.
Year two typically runs thirty to fifty percent of year one. Your savings are often one off. Monitoring is perpetual. So report ranges, confidence intervals, and risk adjusted net present value. Never a single number.
That sets up how we communicate this to stakeholders, in the next section on stakeholder reporting and decision narratives.
 1 min
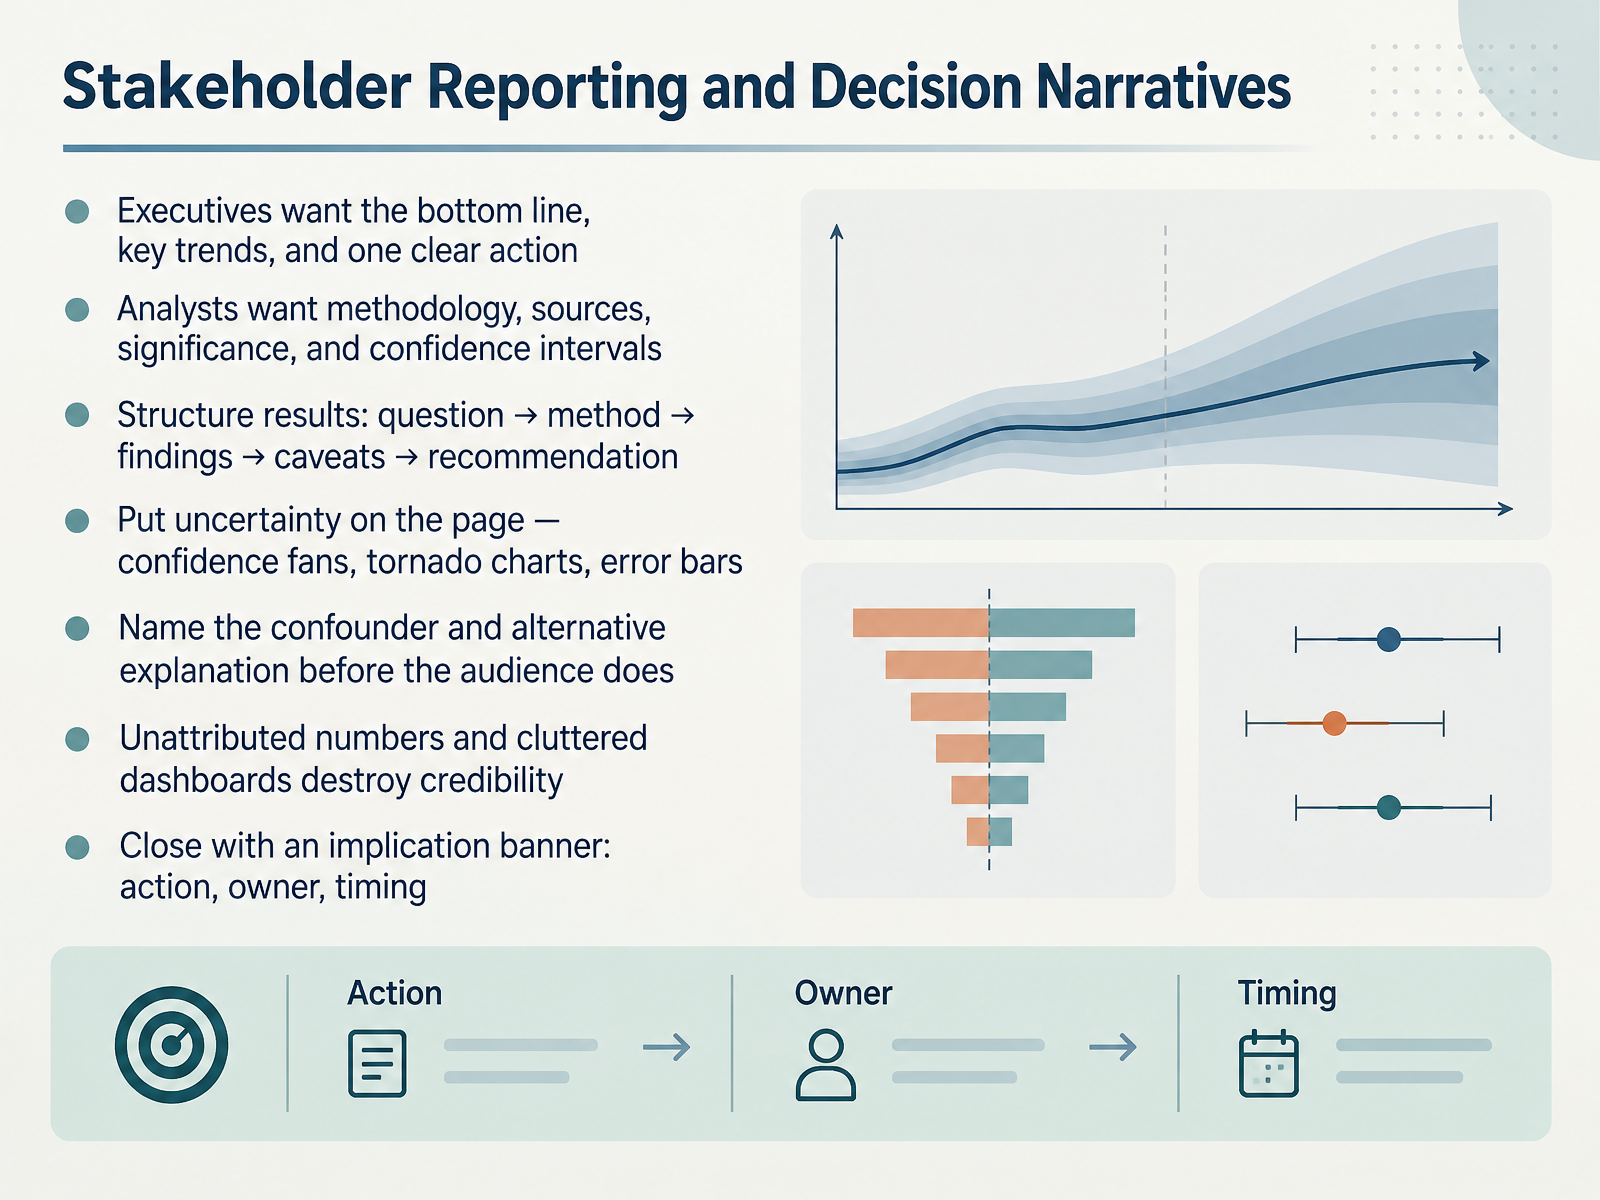
- 08Stakeholder Reporting and Decision NarrativesNow let's talk about how you report results, because the best analysis fails if it is not understood. Different stakeholders need different things. Executives want the bottom line, the key trends, and one clear action. Analysts want methodology, sources, significance, and confidence intervals. So structure your results the same way every time. Start with the question. Then the method. Then the findings. Then the caveats. Then the recommendation. Put uncertainty on the page. Use confidence fans, tornado charts, and error bars so people can see the range, not just a single number. And name the confounder and the alternative explanation before your audience does. If you skip that, someone will ask, and your credibility takes the hit. Unattributed numbers and cluttered dashboards destroy trust fast. Finally, close with an implication banner. State the action, the owner, and the timing. That turns analysis into a decision. Next, we will look at monitoring, drift, and lifecycle evaluation.
 2 min
- 09Monitoring, Drift, and Lifecycle EvaluationNow let's talk about keeping a model healthy after launch. Monitoring and lifecycle evaluation answer one question. Is the model still improving the decisions it was built for? Start by watching four things. Data drift, meaning input distributions move. Concept drift, meaning the input to outcome relationship changes. Label shift, meaning the outcome base rate moves. And pipeline failures, meaning the model never gets fresh, valid features. When labels are delayed, use label-free proxies. Disagreement rates between model and human. Suitability signals for the cases routed to it. And simple distribution statistics. Treat degradation detection as two-sample hypothesis tests, not ad hoc thresholds, so you know whether a shift is real or noise. Then scan subgroups hierarchically to find where and why decay lands. Maybe it is one region, one product line, one customer segment. Keep a monthly ops table. Agreement, escalation, reversal, latency, and cost per decision. That ties model health to operational reality. Finally, set a cadence. Monthly blind sample review. Calibration on each version. And a quarterly threshold review. The takeaway is simple. Monitor continuously, test rigorously, and review on a schedule. That keeps evaluation honest across the lifecycle. Next, we look at auditing human review. Is the human step substantive or a formality?
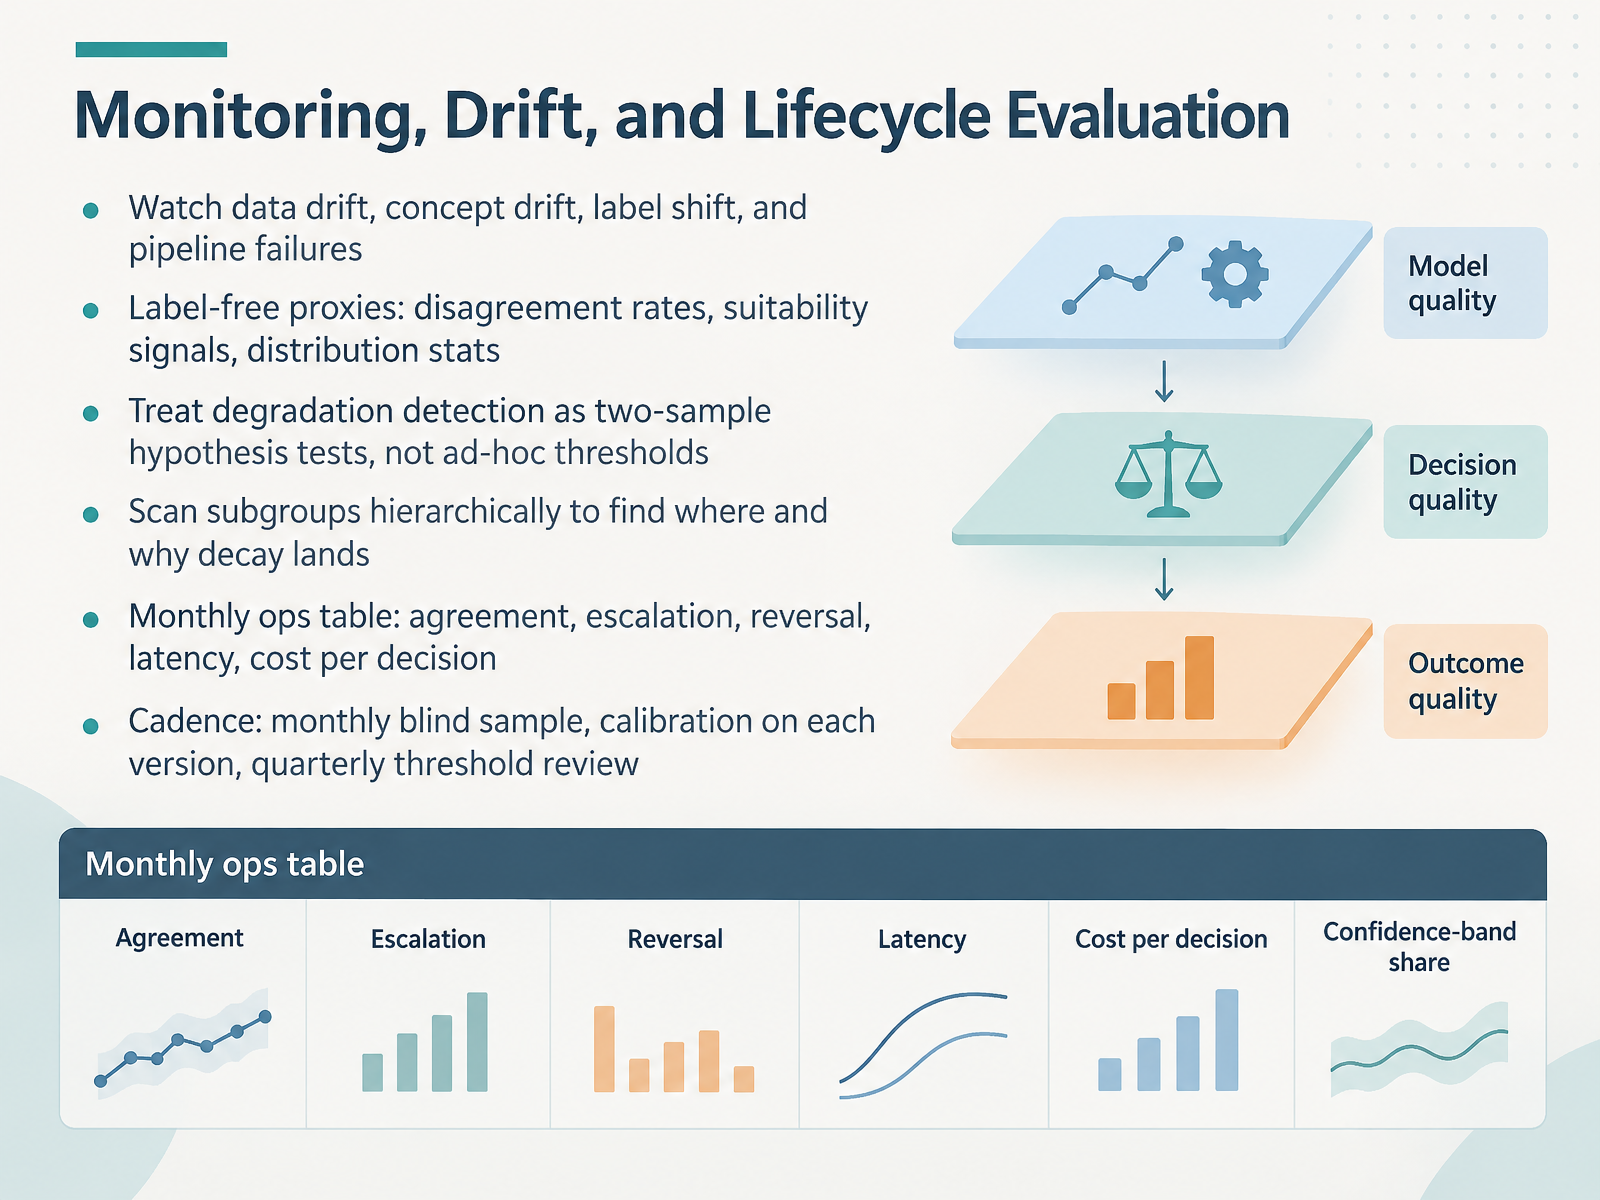 2 min
- 10Auditing Human Review: Is the Human Step Substantive or a Formality?Let's turn to auditing the human review step. The core question is simple: does human review actually reduce risk, or does it just ratify what the AI already decided? To answer that, log four things per system. Reviewer information. Logged time per case. The override mechanism. And documented reasoning. Then assign a verdict to every system: Substantive, Formality, or Mixed. A Formality verdict opens a remediation process. Watch for reviewer flags. Near-zero overrides. Instant reviews. High reversal rates when cases get a second look. These flags tell you the review may be rubber-stamping. But act on them carefully. Review workload and tooling before you have performance conversations. If a reviewer handles two hundred cases a day, the problem is capacity, not commitment. Feed second-review outcomes into coaching, thresholds, and the next audit cycle. Next, we will look at tracing and evidencing individual decisions.
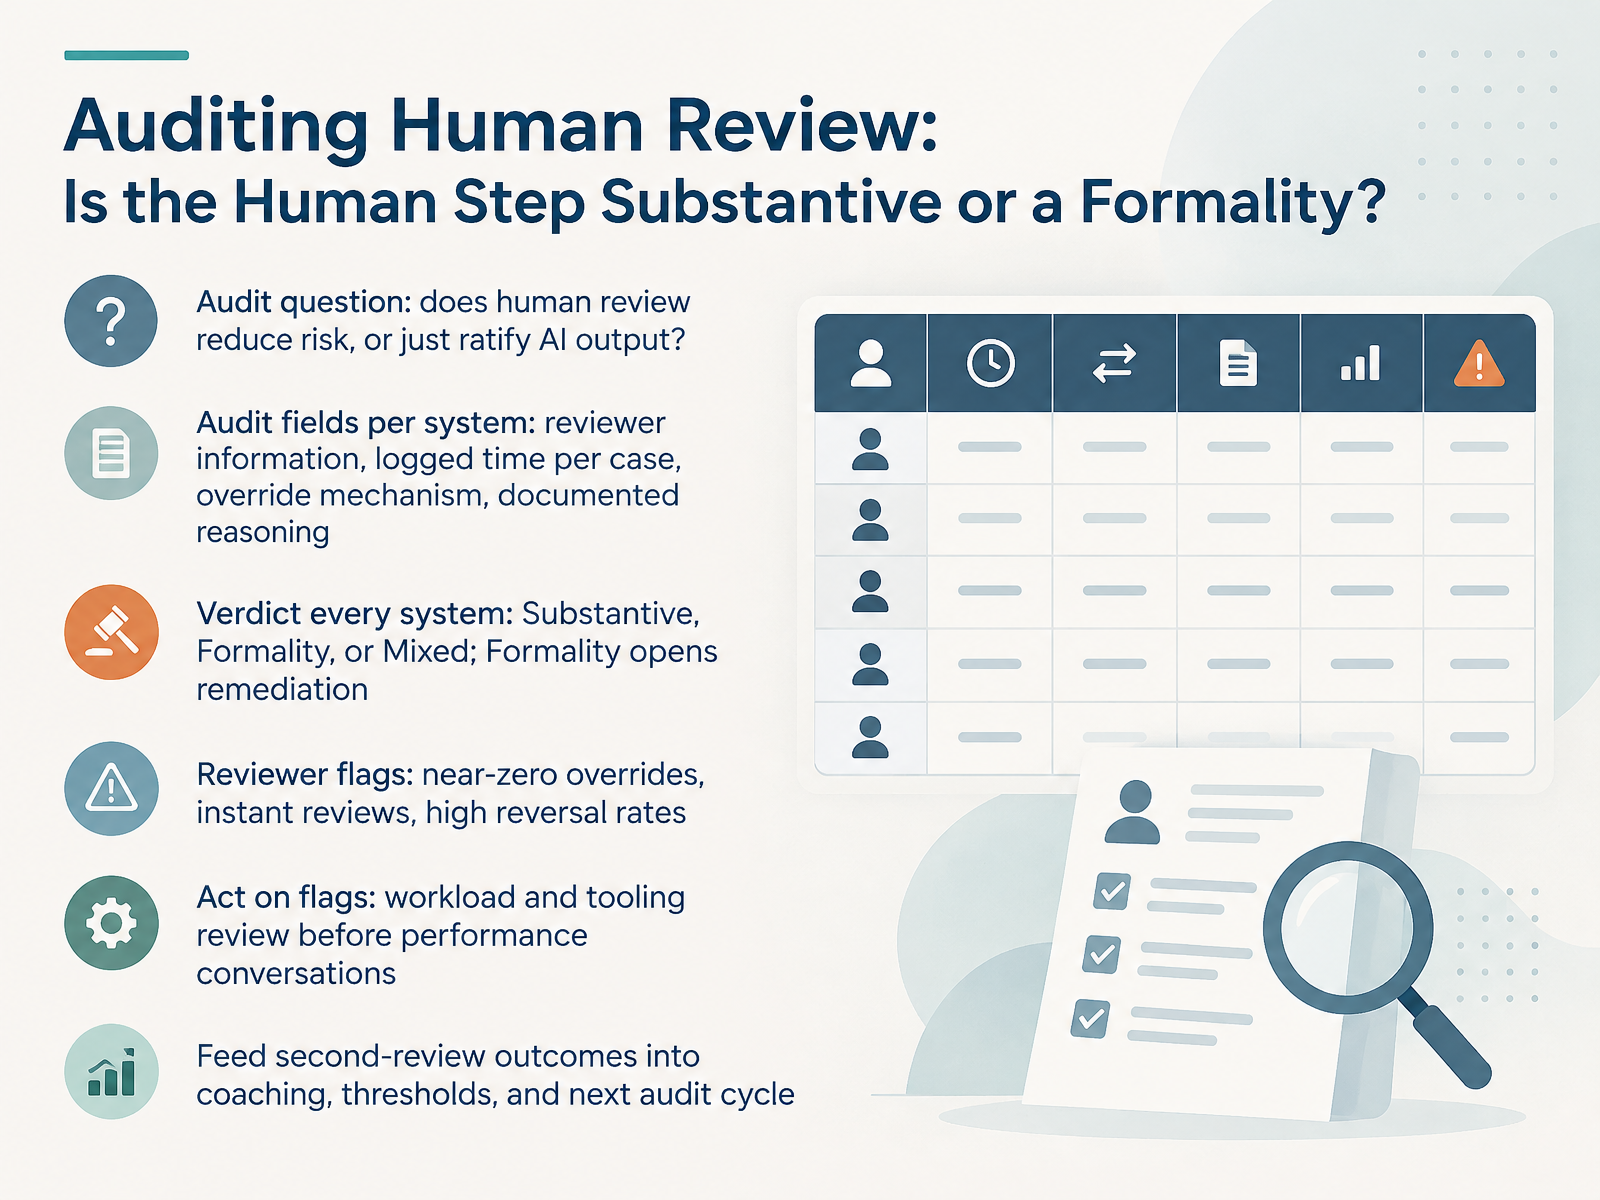 1 min
- 11Tracing and Evidencing Individual DecisionsNow let's look at how you trace and evidence individual decisions. A trace is the record of one decision event: the intent behind it, the policy block that fired, the outcome, and a tamper-evident proof. So the question it answers is simple. Can you reconstruct why a specific action happened, and show that the record was not altered?
Read the trace in order, all seven stages. Intercept, identity, evaluate, decide, outcome, verify, and attest. Order matters, because each stage depends on the one before it.
Here is the distinction that trips people up. A policy verdict is not the same as an outcome. If policy denied the action, the action never ran, and that is a success, not a failure. So do not treat every denial as a problem to fix.
Escalations behave differently. An escalated decision stays pending until a human resolves it. It is not finished, and it should not be counted as either approved or denied.
Keep integrity separate from target state. The chain can be untampered while the target state is still unverified. Those are two different questions, and you need both answers.
Identity gaps are findings, not noise. An action you cannot attribute fails the identity stage, and that is worth surfacing.
Finally, triage is where this becomes usable. Filter by severity, and search by request ID, tool, or note, so an evaluator can find the one decision they care about.
Next, we bring this together in the capstone: building your measurement plan and governance cadence.
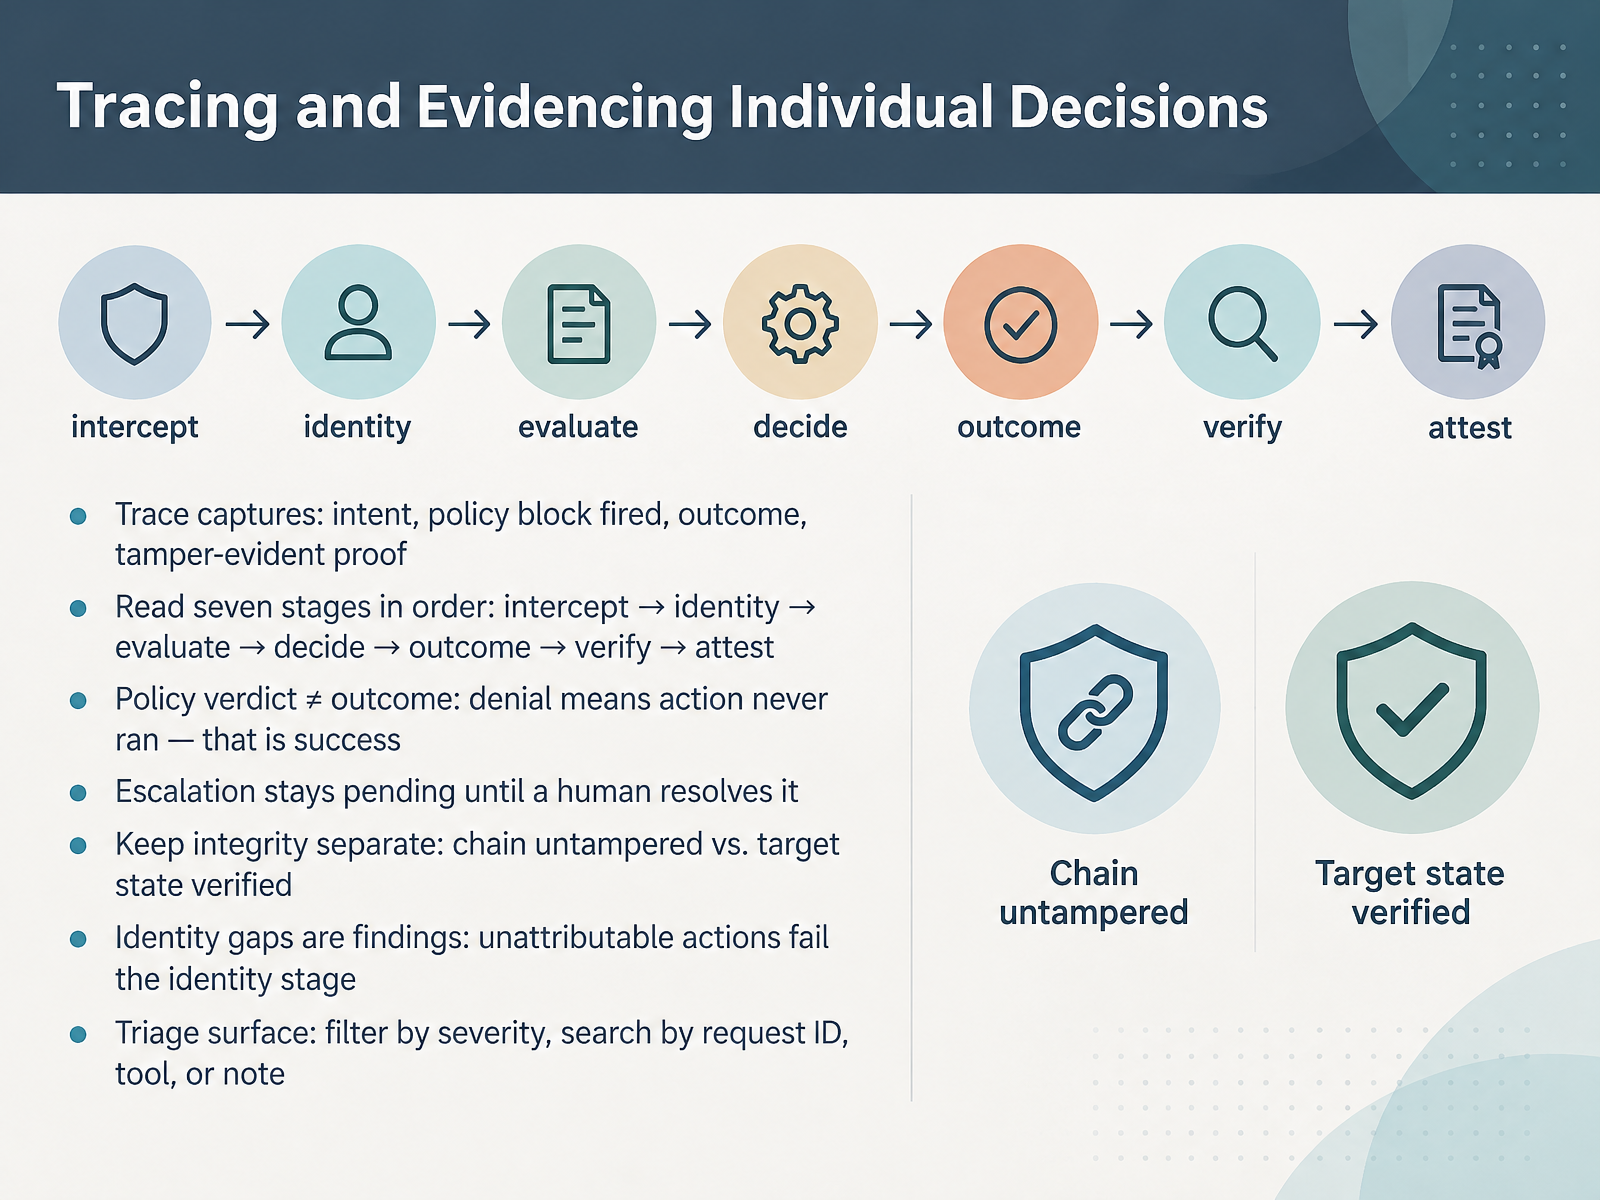 2 min
- 12Capstone: Building Your Measurement Plan and Governance CadenceLet's close by turning everything into a plan you can actually run. Start with a decision inventory. Pause the dashboards for thirty days. Then ask, which five decisions still matter? Those decisions define what you measure. Next, draft a one-page plan: the question, the metrics, the thresholds, the causal method, the owner, and the kill criteria. One page keeps it honest. Then define your instrumentation minimum: human events, decision-trace fields, entity IDs, and dashboard reads. If you cannot trace a decision, you cannot measure it. Write guardrail contracts too: the expected range, the alert band, and the automatic response, across four categories. Set a governance rhythm: monthly decisions review, quarterly threshold review, and named metric owners. Add peer critique: a falsifiable hypothesis, an isolating assumption, benefit confidence, a falsifier, and stop criteria. Roll it out over ninety days. Measure what decisions depend on, and publish a narrow board-grade set. Thank you for your attention. You now have the tools to make measurement a habit. Start small, stay honest, and keep the decisions in view.
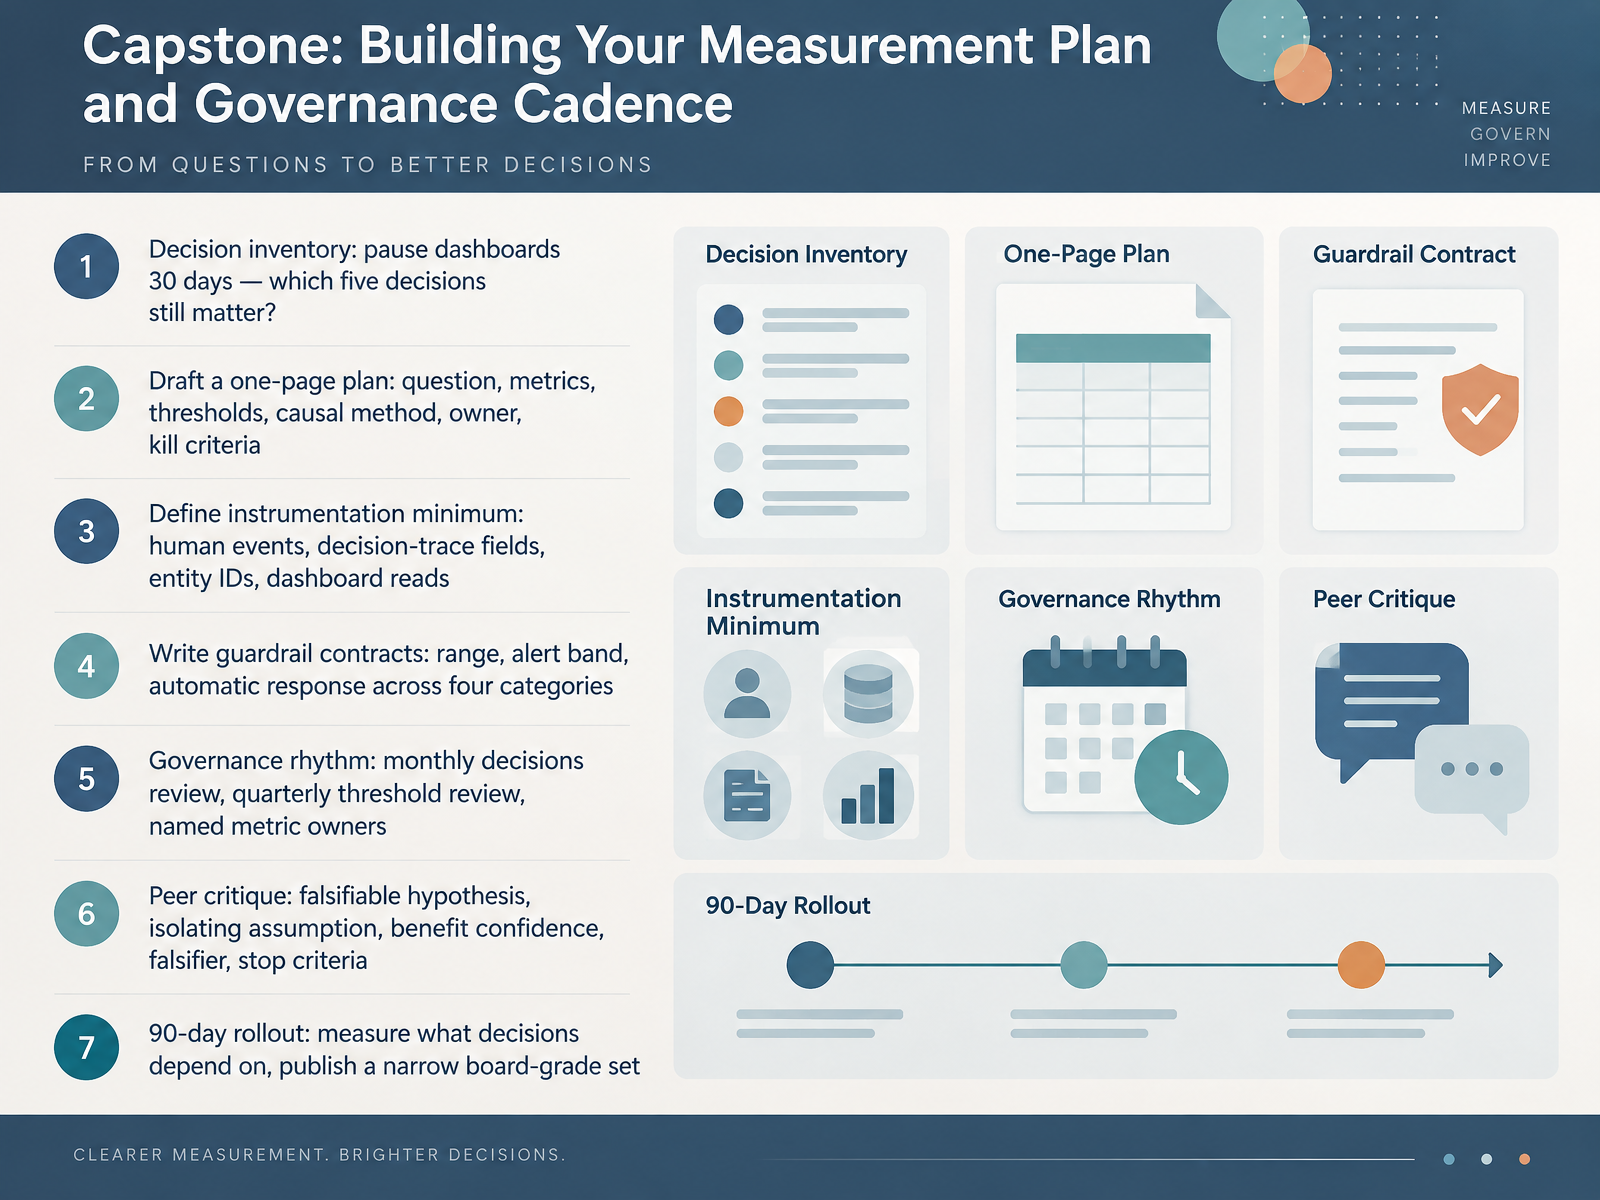 2 min
Take the deck with you
Download this course as a file — free, no sign-up needed.
- PDF handoutEvery slide page, ready to print or share.13 pages · 2.8 MBDownload
- Narrated PowerPointThe deck that presents itself — every slide carries the digital human's narration video.13 pages · 14.2 MBDownload
- PowerPoint slidesThe full deck as a .pptx — open it in PowerPoint, Keynote, or Google Slides.13 pages · 2.8 MBDownload
Free to use in your own training — please keep the PersonWise credit page at the end.
Have your own deck? Turn it into a course