Conversion Rate Optimization KPI Measurement
Begin
15 pages · ~30 min
Conversion Rate Optimization KPI Measurement
Learn how to measure and interpret key conversion rate optimization KPIs to effectively analyze performance, identify improvement opportunities, and drive data-informed decisions.
What you’ll learn
- 01Conversion Rate Optimization KPIs: Measurement and InterpretationWelcome. Before we optimize anything, we have to measure it correctly. That is what this course is about: the KPIs that tell you whether your conversion work is actually paying off. Getting measurement wrong means wasted effort and budget pointed at the wrong problems. Getting it right means every optimization decision is tied to a real business outcome. You already own the data. By the end of this session, you will know exactly which numbers matter, and which ones are just noise. Let's get to work with the first question: What Counts as a Conversion?omniconvert.comnngroup.comspaceads.agency+21 min
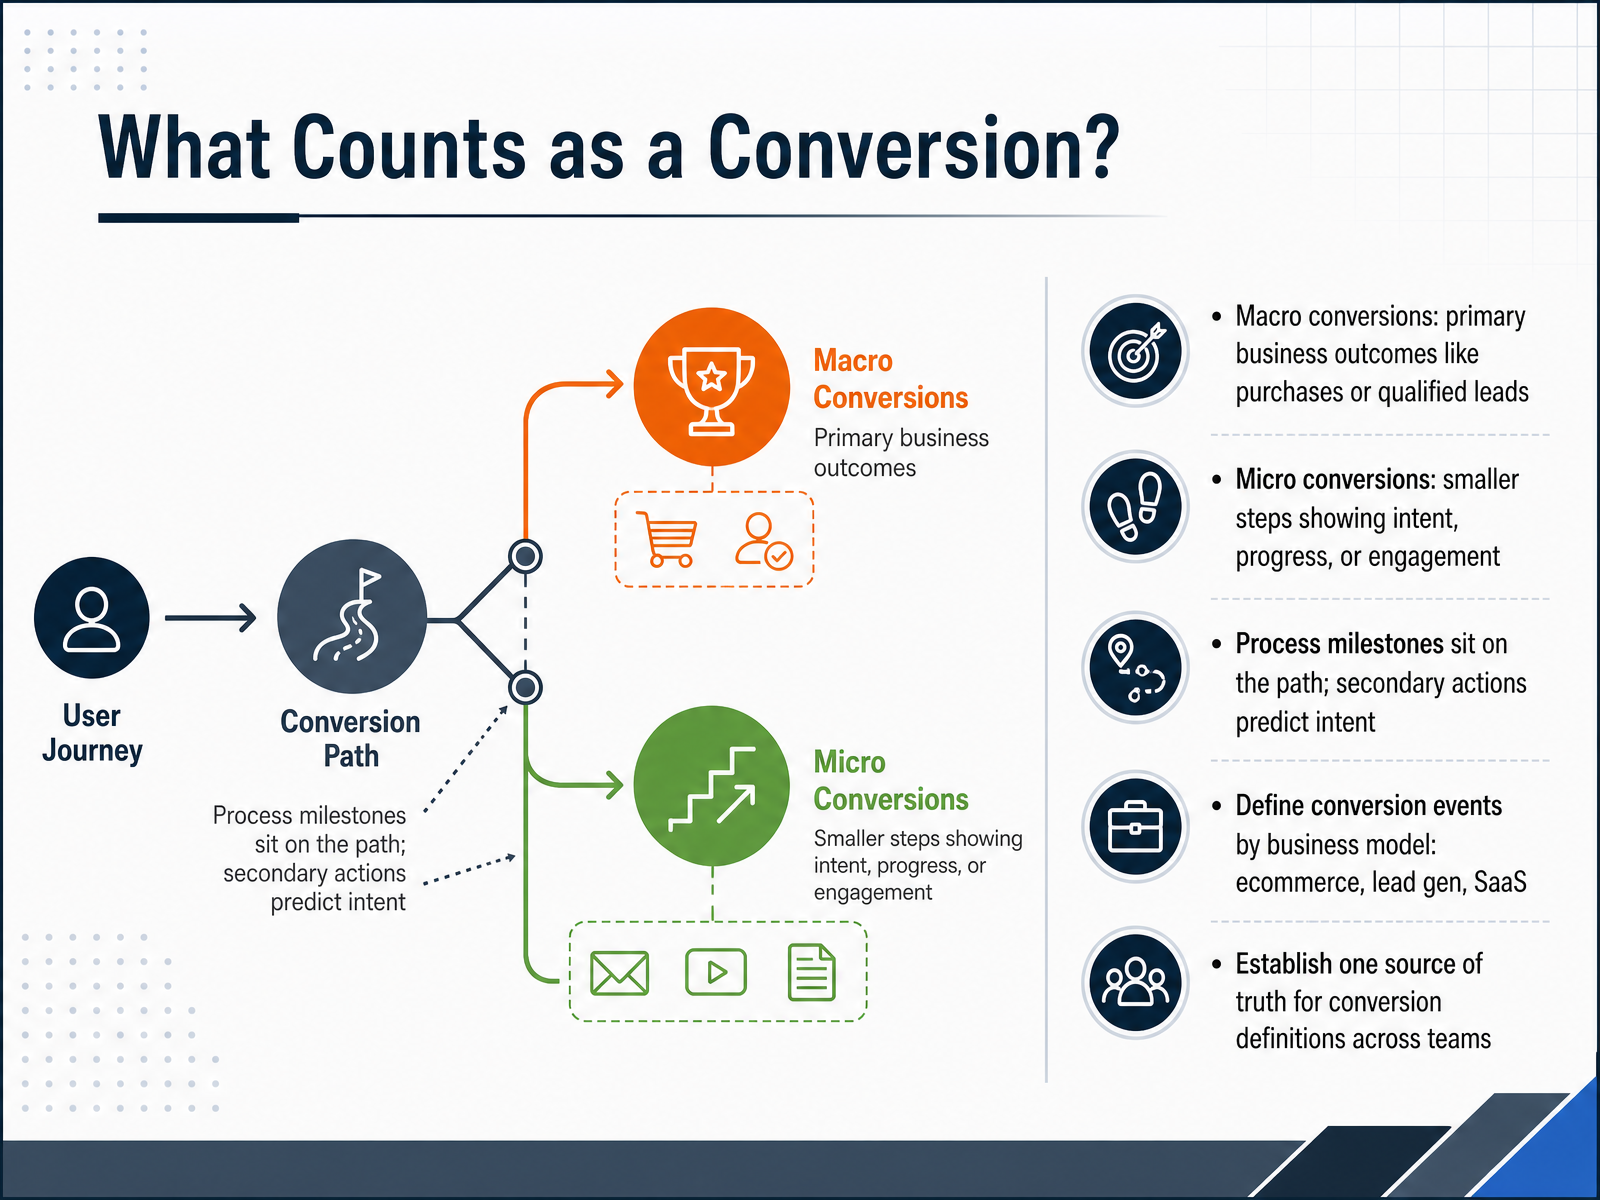
- 02What Counts as a Conversion?Let's anchor on the most fundamental question: what actually counts as a conversion? A purchase is a conversion. But so is clicking a call-to-action, adding a product to the cart, or downloading a guide. The key is to separate macro conversions from micro conversions. Macro conversions are your primary business outcomes—the completed purchase, the signed contract, the qualified lead. Micro conversions are smaller steps that show intent and progress. They fall into two categories: process milestones, which sit directly on the path to the macro goal, like starting checkout; and secondary actions, which predict intent even though they're not required, like watching a product video. Your exact definitions depend on your business model. For ecommerce, a macro conversion is a sale. For lead gen, it's a qualified form submission. For SaaS, it's a paid subscription or an activated trial. The critical rule: establish one single source of truth for these definitions across your entire team. If marketing and product use different labels, your optimization efforts will point in conflicting directions. Remember, macro conversions measure outcomes, while micro conversions explain progress. Define them deliberately. Now, let's shift to why micro conversions are your best leading indicators of intent and where they fit in the funnel.
 omniconvert.comnngroup.comspaceads.agency+22 min
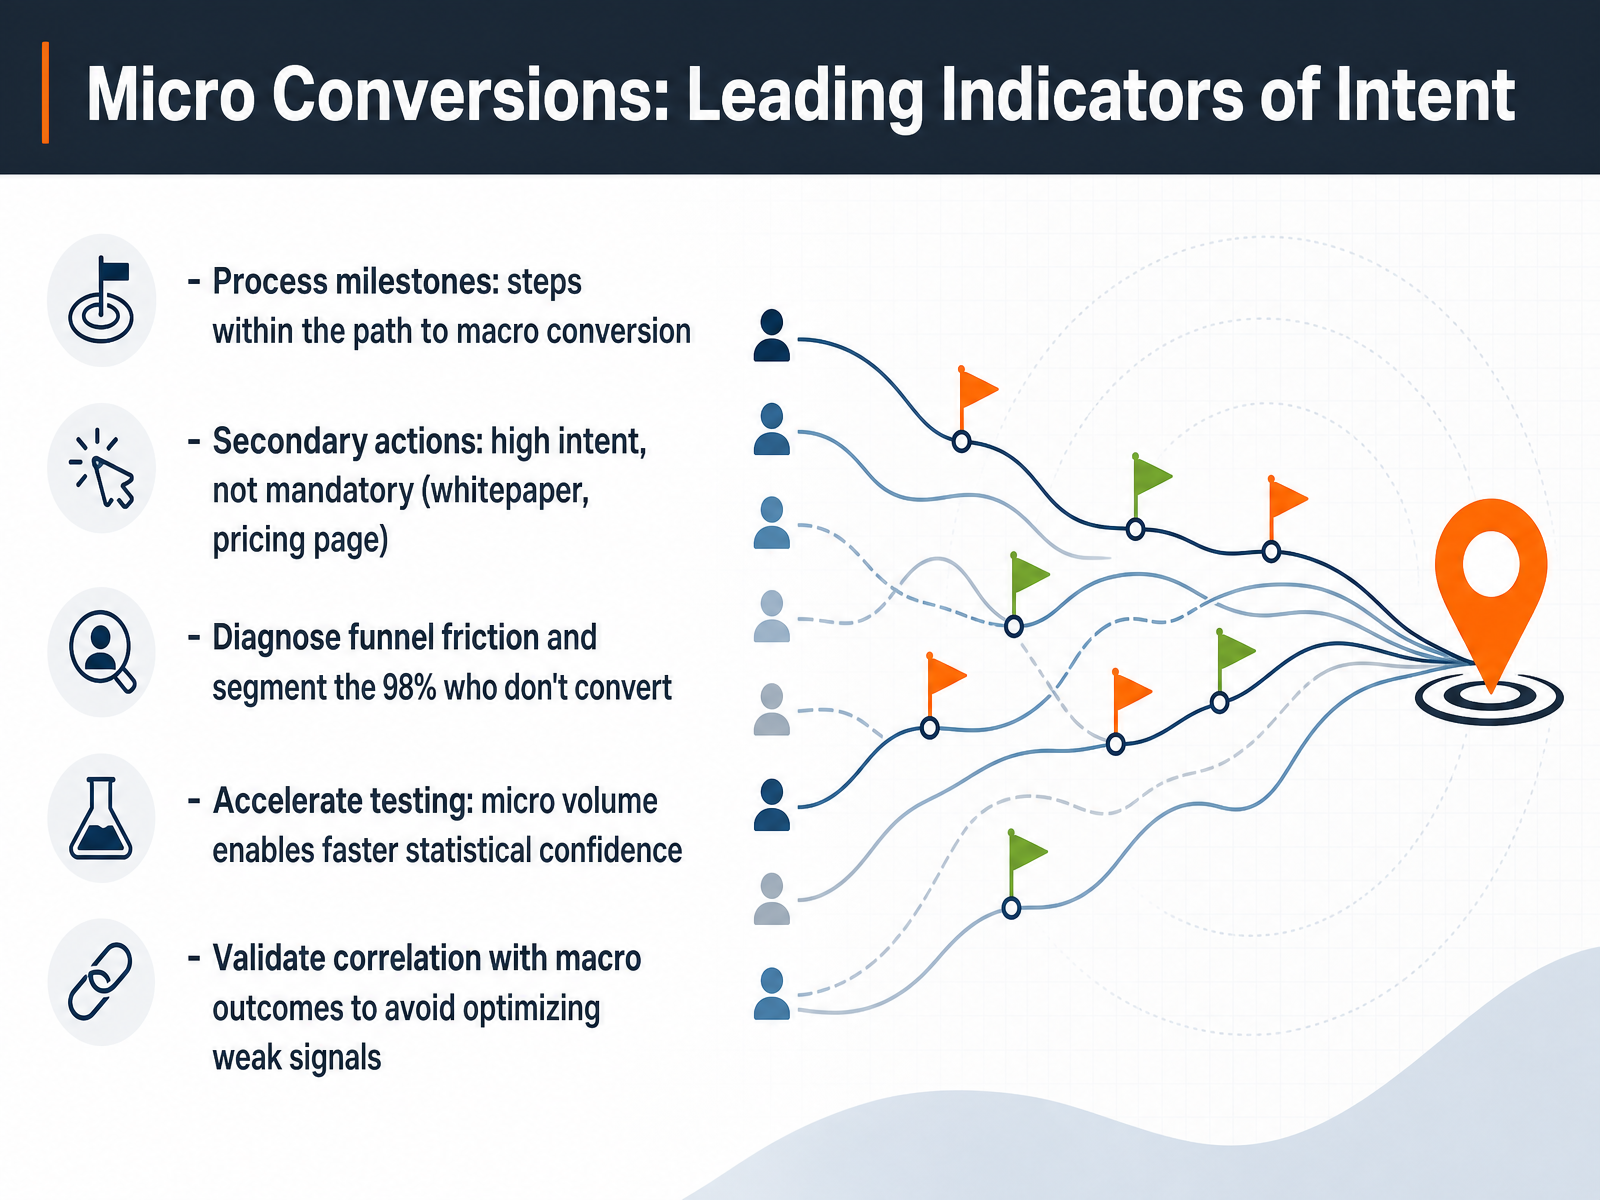
 - 03Micro Conversions: Leading Indicators of IntentNow let's look at micro conversions. These are the small, deliberate actions that signal intent before the final outcome. Think of them in two categories. Process milestones are the mandatory steps on the path to purchase, like adding to cart or starting checkout. Secondary actions, like downloading a whitepaper or visiting the pricing page, are high intent but not required. Here's why this matters. If your macro conversion rate is two percent, you're ignoring the other ninety-eight percent of traffic. Micro conversions let you segment that group into window shoppers versus high intent prospects. They also accelerate testing. A high ticket page might get five sales a month, which takes a year to reach statistical significance. But if two hundred people a month click to open the demo video, you can get a confident answer in weeks. The critical rule is validation. Never optimize on a micro conversion that doesn't correlate with revenue. A change that boosts video plays but cannibalizes the buy button is a false positive. Now let's move on to the core CRO metrics and the denominator problem.
 omniconvert.comnngroup.comspaceads.agency+22 min
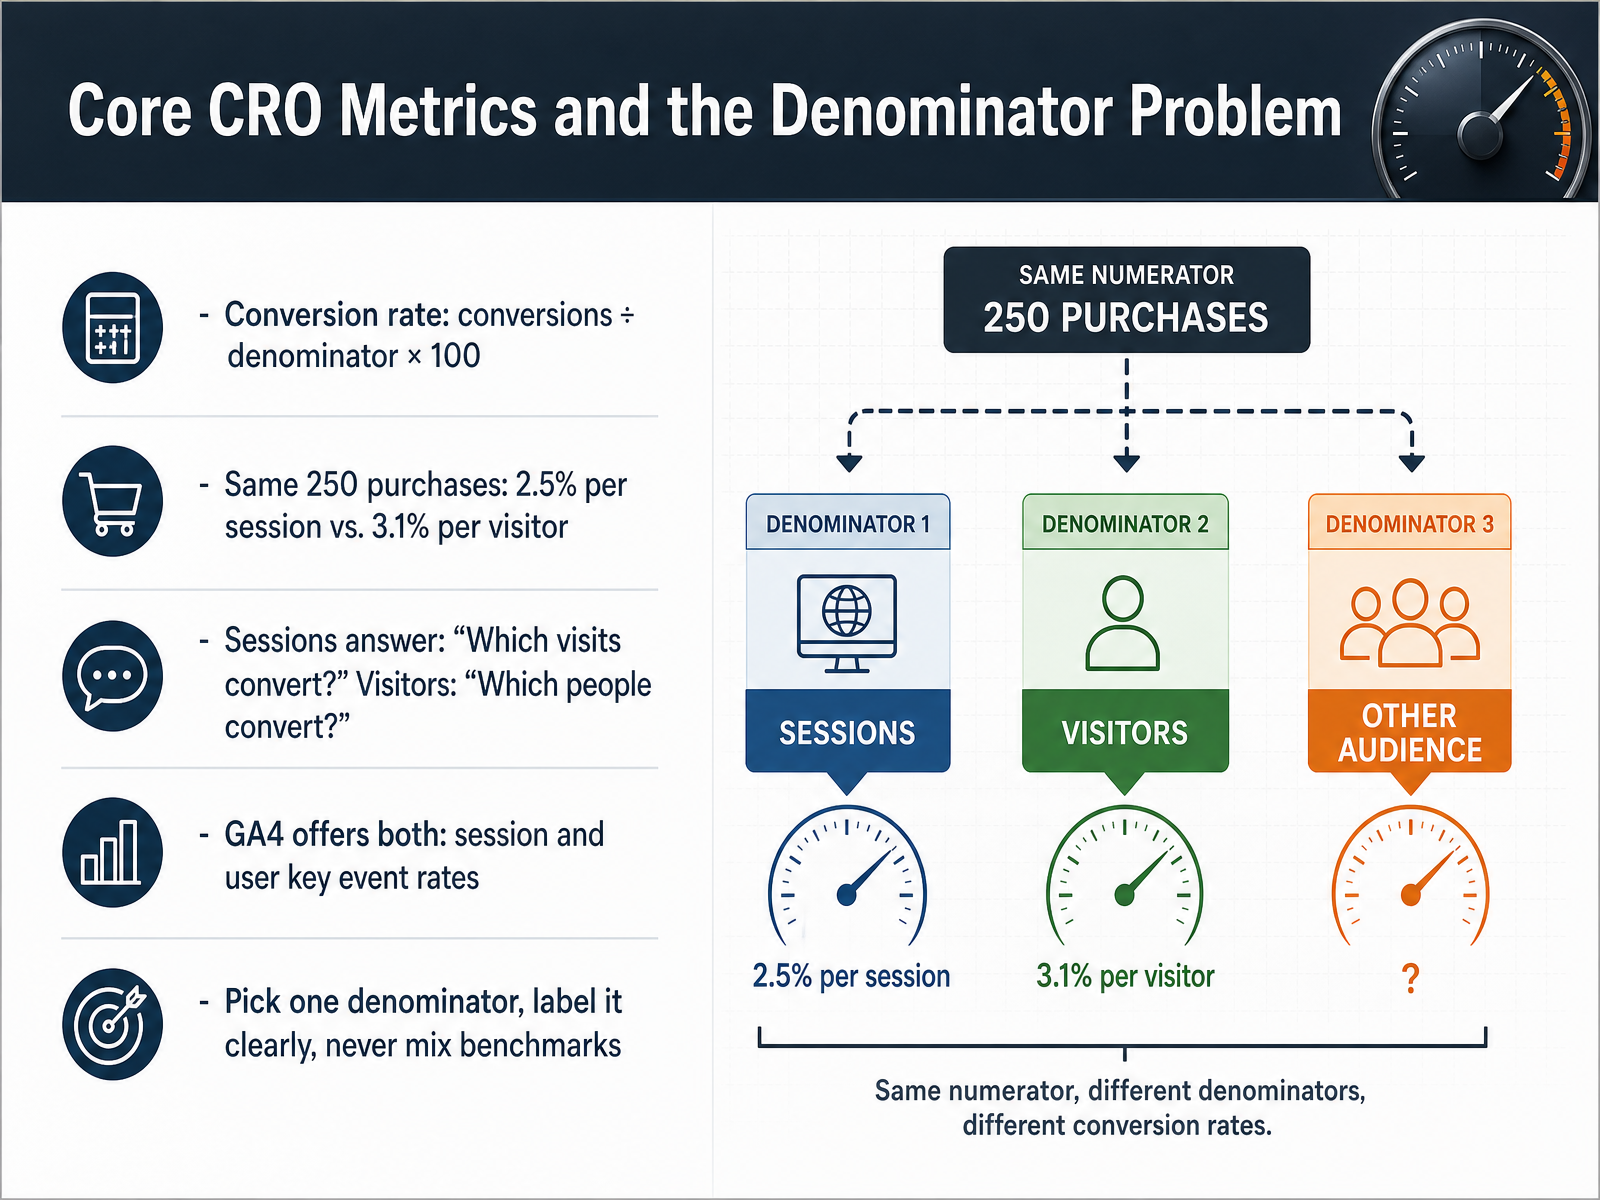
 - 04Core CRO Metrics and the Denominator ProblemLet's talk about the denominator problem. The conversion rate formula looks simple: conversions divided by some base, times one hundred. But that base is a choice, and it changes your number more than you might expect. Picture this: your site gets eight thousand unique visitors across ten thousand sessions, and those visitors make two hundred and fifty purchases. Divide by sessions and you get two and a half percent. Divide by visitors, and you get three point one percent. Same business, same purchases, two different answers. Neither is wrong. They just answer different questions. Sessions tell you which visits convert. Visitors tell you which people convert. In GA4, you have both: the session key event rate and the user key event rate. The trap is mixing them with benchmarks. Comparing your session-based number to a visitor-based industry average is comparing apples to oranges, and it's the most common way teams convince themselves they're underperforming when they aren't. So the rule is simple: choose one denominator, label it clearly on every chart, and never compare across the two. Next, let's look at segmented conversion rates and why averaging them can hide the real story.
 kissmetrics.ioshopify.commetricuno.com+22 min
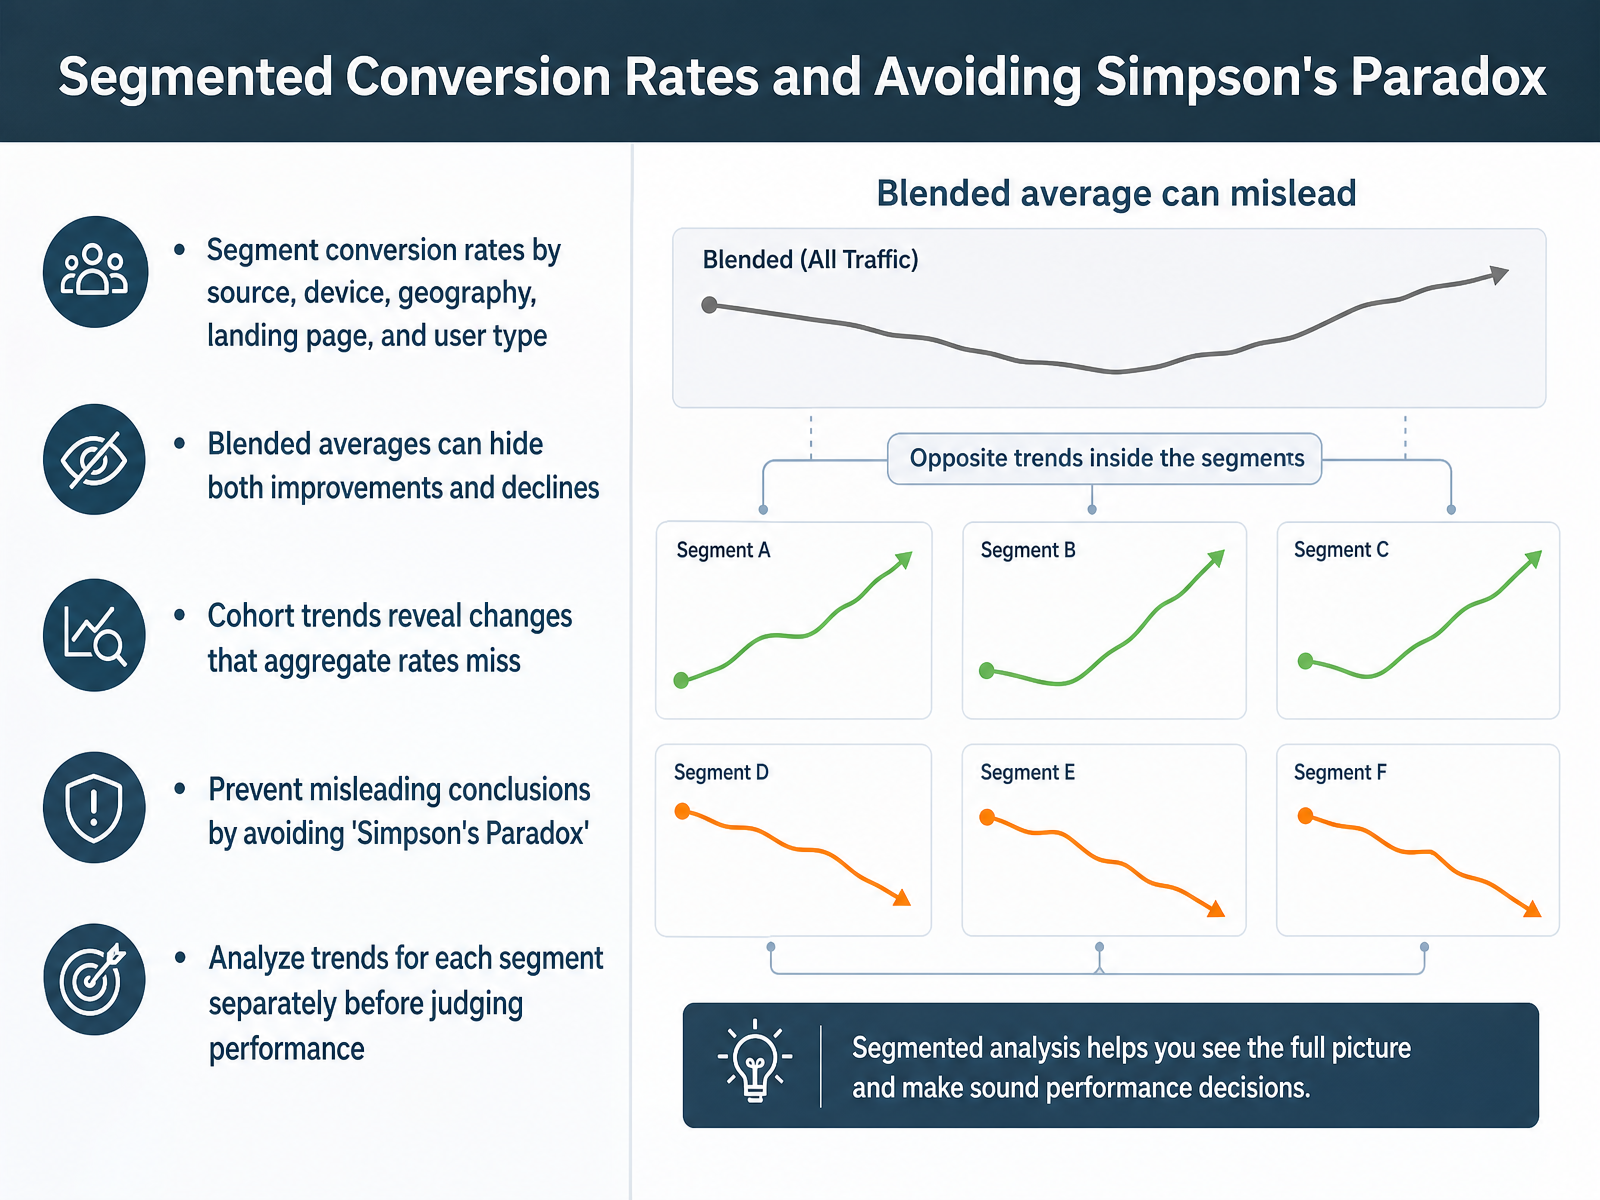
 - 05Segmented Conversion Rates and Avoiding Simpson's ParadoxNow let's talk about segmentation, because a single blended conversion rate can actively mislead you. When you average conversion across all traffic, you risk running into what statisticians call Simpson's Paradox. That's where an overall trend looks one way, but every segment underneath it is moving the opposite direction. For example, your overall rate might look flat. But when you split by source, you might see paid traffic improving while organic is declining. They cancel each other out, and the blended number hides both stories. So always segment your rates by source, device, geography, landing page, and user type. And track cohorts over time. Watching a group of users from their first visit reveals changes that aggregate rates completely miss. The rule is simple: analyze each segment's trend separately before you judge the overall performance. Never let a blended average make the decision for you. This leads directly into our next topic, funnel and path metrics, where we will find the leaks.
 kissmetrics.ioshopify.commetricuno.com+22 min
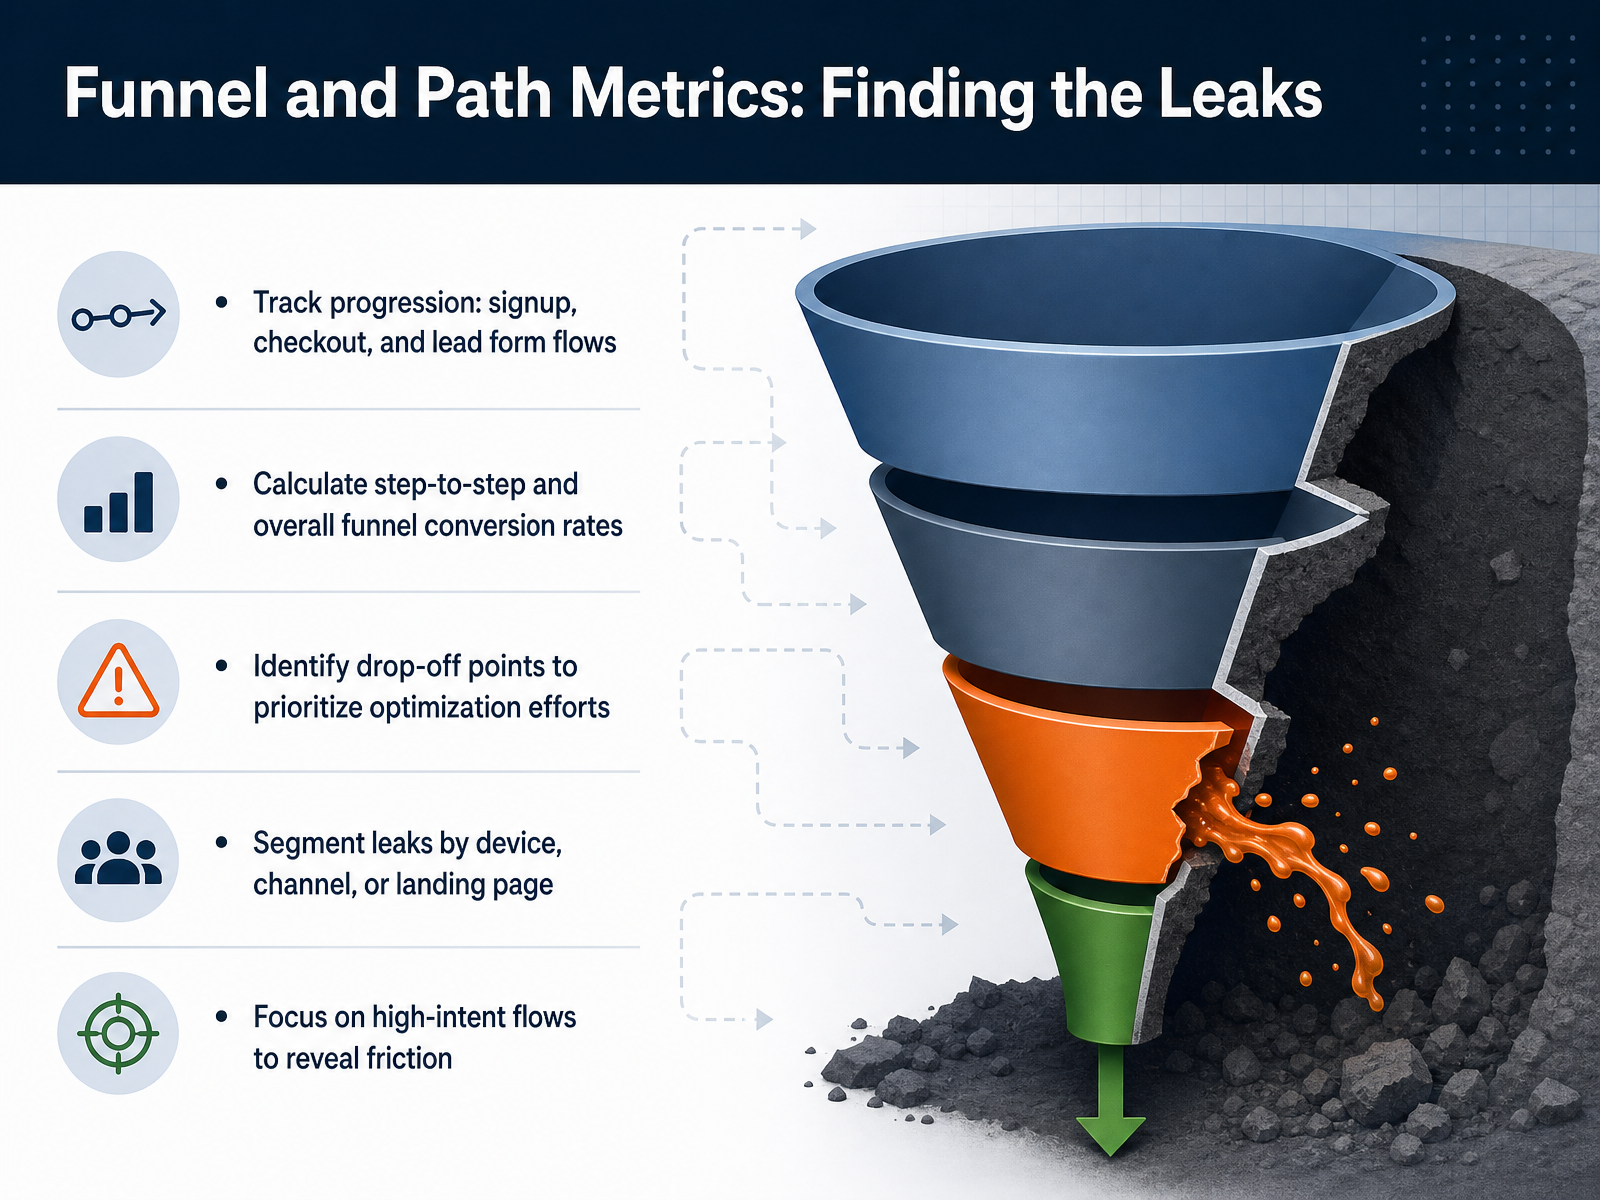
 - 06Funnel and Path Metrics: Finding the LeaksLet's turn the lens toward the journey itself. Funnel and path metrics show you where value leaks, not just where it ends. Start by tracking progression through your critical flows: account signup, checkout, lead form completion. Then calculate the conversion rate at each individual step, and for the funnel as a whole. The step rates are what make the overall number diagnosable. If overall conversion drops, the step rates tell you whether fewer people added to cart, or the same share added but fewer paid. That distinction is your action plan. Now, find the drop-off points and prioritize the biggest absolute losses first. And critically, segment those leaks by device, channel, and landing page. A leak on mobile checkout is a different problem than a leak from paid search. Finally, focus on your highest-intent flows, like checkout initiation. These reveal friction with the least noise. A session-based rate shows how each visit performed; a user-based rate shows how many people eventually converted. Pick one denominator and stay consistent. Next, we'll look at session quality and engagement signals to see how attention supports conversion.
 omniconvert.comnngroup.comspaceads.agency+22 min
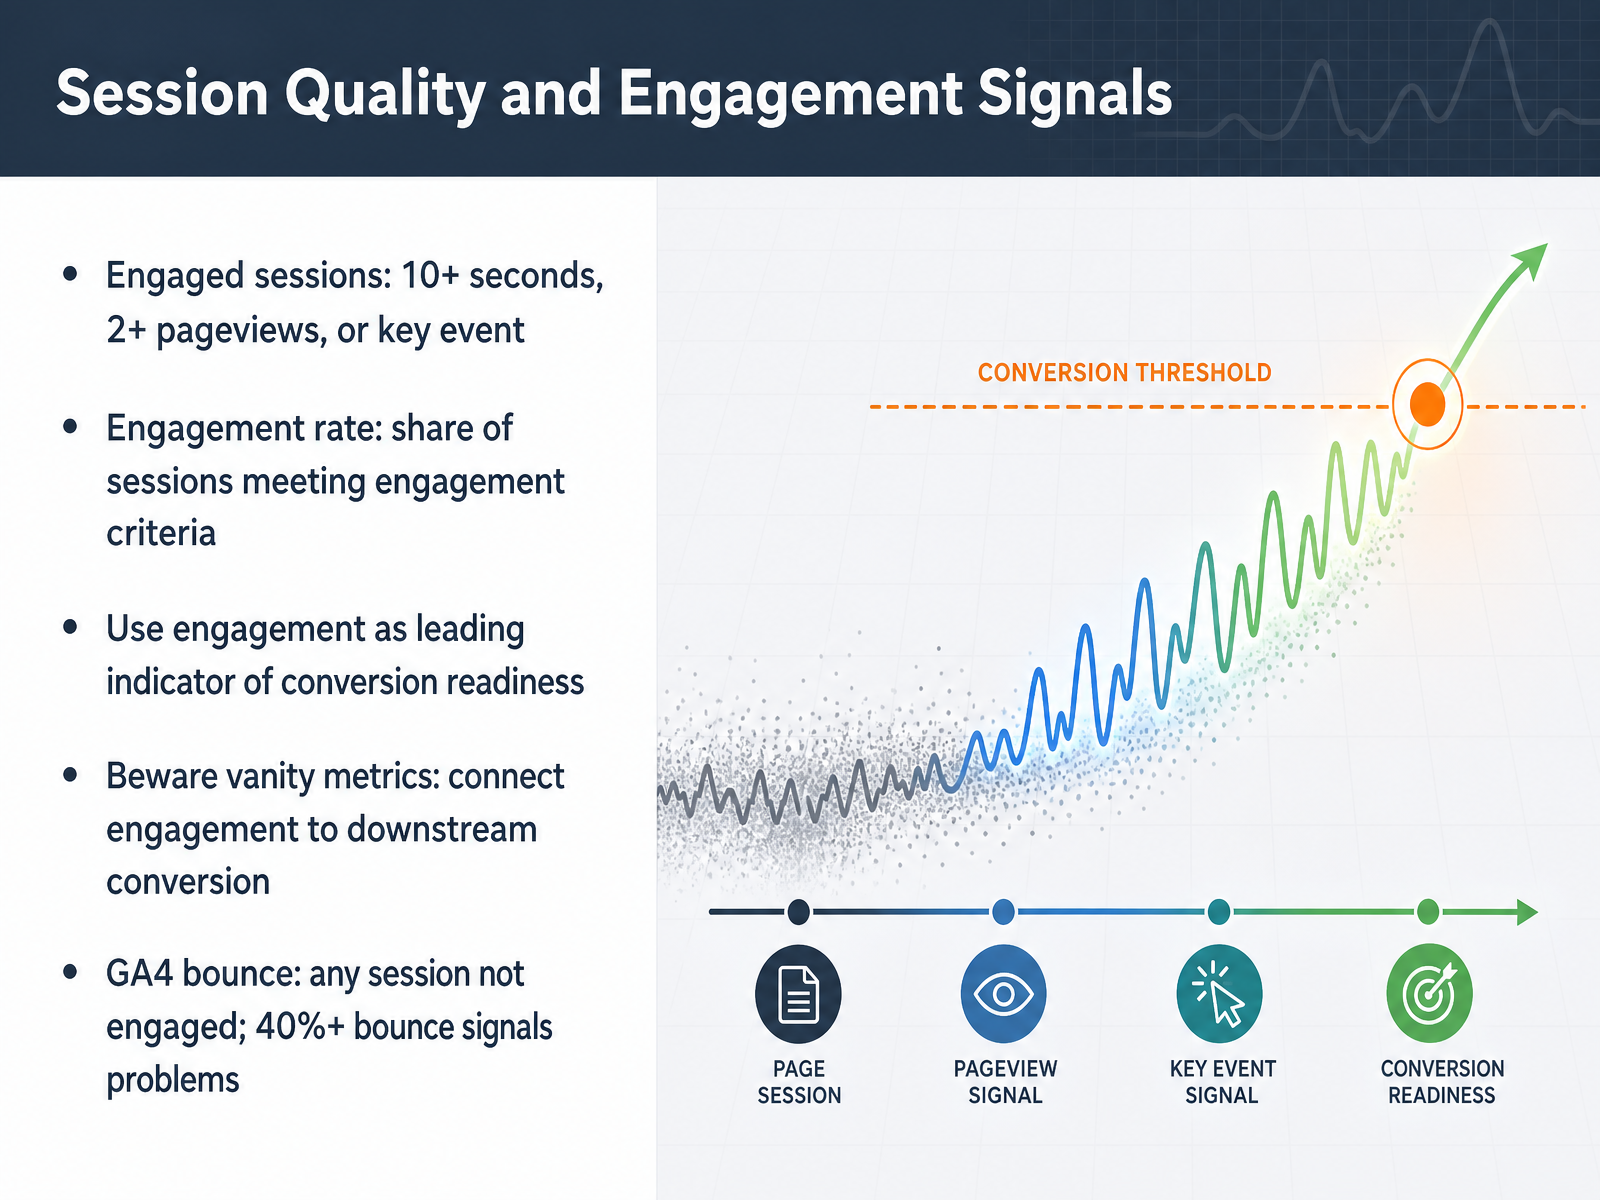
 - 07Session Quality and Engagement SignalsNow let's look at session quality and engagement signals. In GA4, an engaged session is one that lasts longer than ten seconds, includes two or more page views, or triggers a key event. Your engagement rate is simply the percentage of sessions that meet those criteria. Here's how to use this: treat engagement as a leading indicator of conversion readiness. If a campaign brings high traffic but low engagement, you have a message-match problem before you even get to conversion. But be careful about vanity metrics. Engagement only matters when it connects to downstream conversion. A blog reader who stays for five minutes is engaged, but you need to see whether that engagement leads to a newsletter signup or a product view. As for bounce rate, GA4 defines it as any session that is not engaged. If your bounce rate climbs above forty percent, that's a genuine warning sign that users are leaving without meaningful interaction. The key takeaway: engagement tells you if people are paying attention, but conversion tells you if they're buying. Now let's examine how engagement rate and bounce rate work together in GA4.
 support.google.comnicelookingdata.comwebeyez.com+22 min
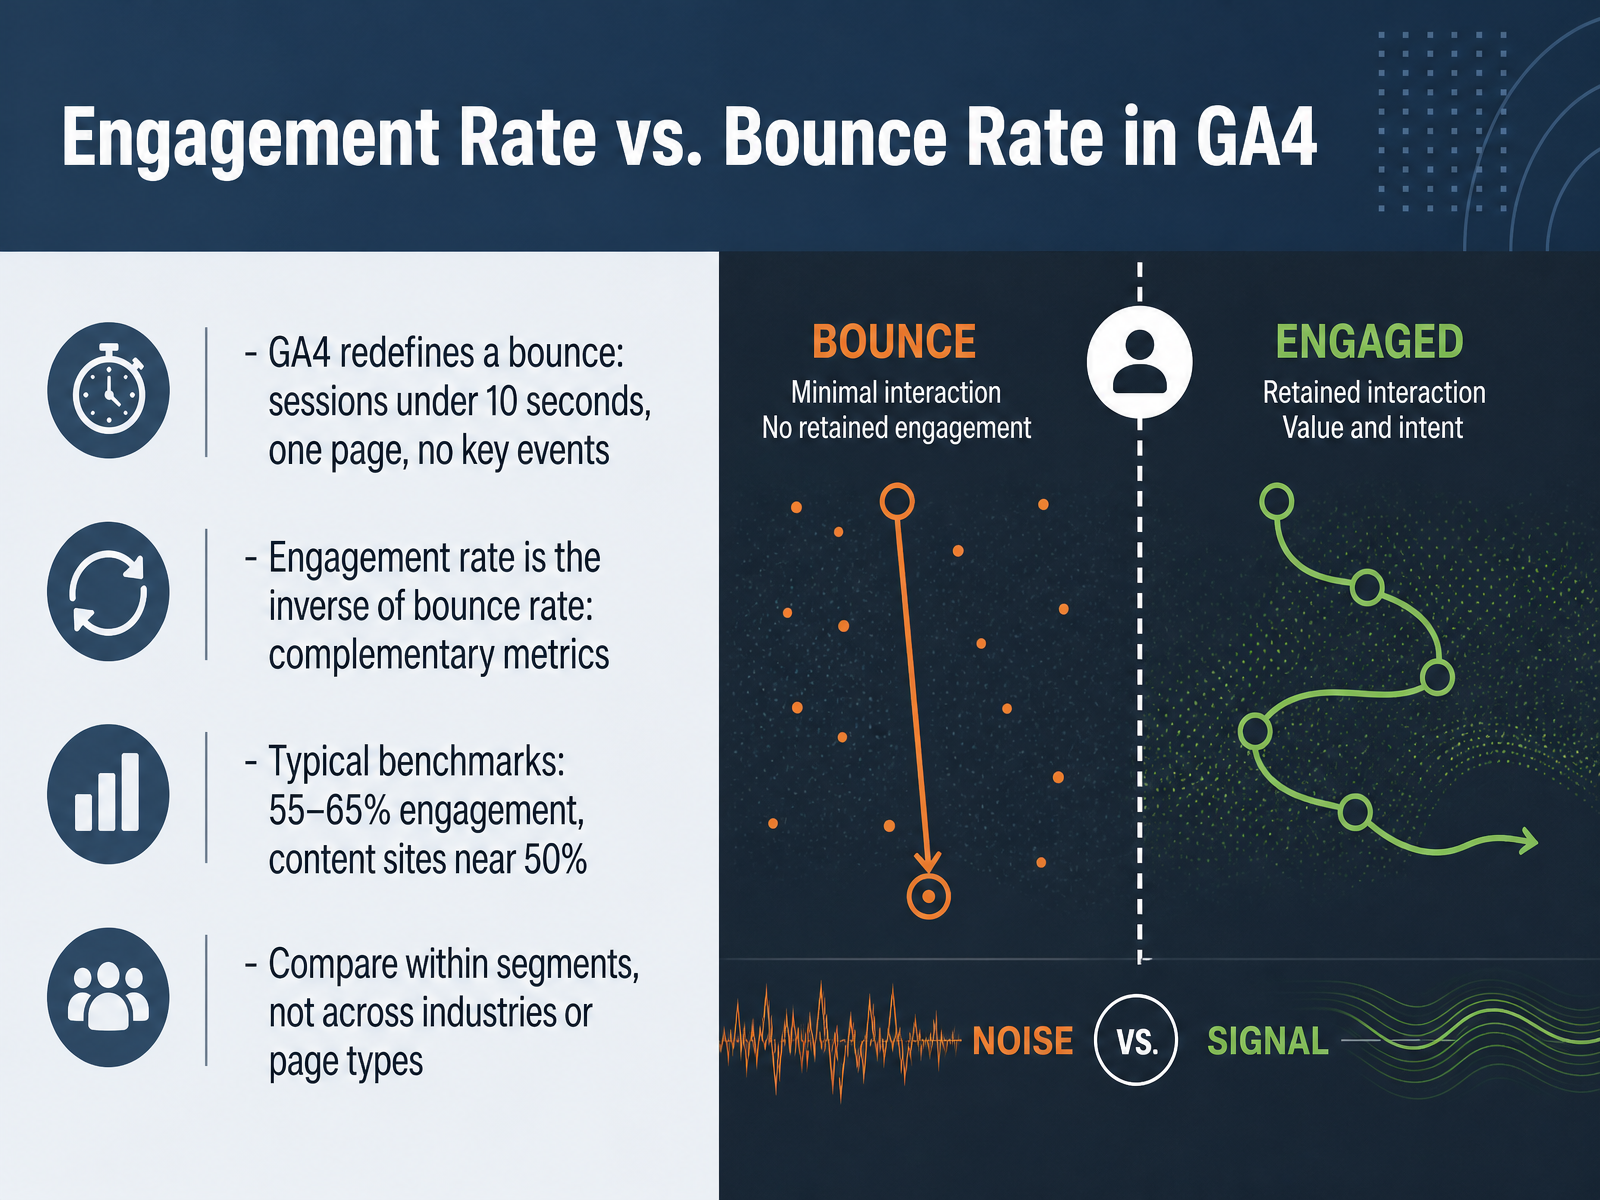
 - 08Engagement Rate vs. Bounce Rate in GA4Let's talk about engagement rate and bounce rate in Google Analytics 4. GA4 fundamentally redefined what a bounce is. In the old Universal Analytics, any single-page session counted as a bounce, no matter how long the visitor stayed. Now, a bounce only counts if a session lasts under ten seconds, has just one page view, and triggers no key events. Everything else is an engaged session. That's why engagement rate is simply the inverse of bounce rate—they always add up to one hundred percent. For benchmarks, most sites land between fifty-five and sixty-five percent engagement. If you run a content-heavy site, closer to fifty percent is normal because readers often get their answer on one page and leave satisfied. The critical rule is to compare within your own segments—same channel, same page type, same campaign. Do not benchmark your blog against your checkout flow, or your paid landing pages against your organic traffic. Whenever you see a dip in engagement, segment by traffic source and landing page to locate the problem before you change anything. Now, let's move on to revenue and value-based KPIs.
 support.google.comnicelookingdata.comwebeyez.com+22 min
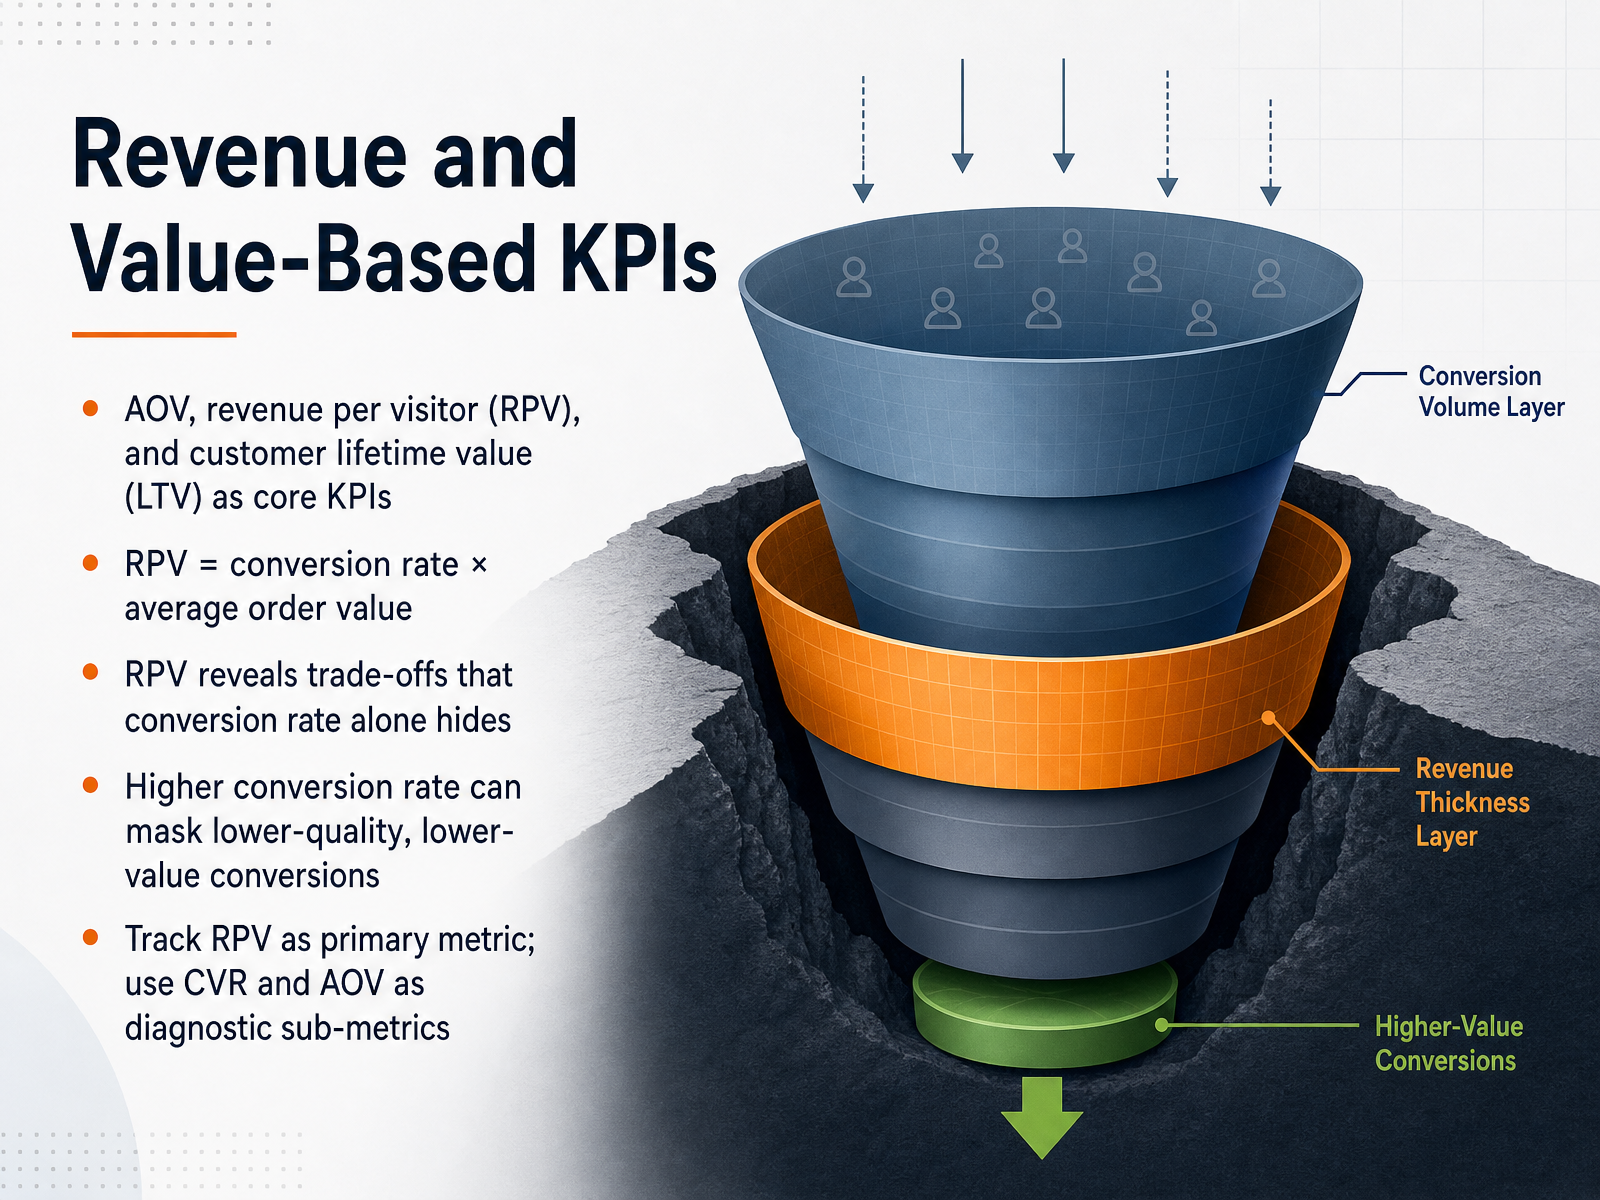
 - 09Revenue and Value-Based KPIsLet’s shift from counting conversions to counting revenue. The core value-based KPIs are average order value, revenue per visitor, and customer lifetime value. Of these, revenue per visitor, or RPV, is your primary scoreboard because it’s simply conversion rate times average order value. That single product reveals trade-offs that conversion rate alone hides. A higher conversion rate can mask lower-quality, lower-value conversions. For example, a team celebrates a jump in conversion rate after a discount campaign, but the average order value drops, so revenue per visitor actually falls and the business earns less. That’s the hidden trap. So make RPV your primary metric. Use conversion rate and average order value as diagnostic sub-metrics to explain why RPV moved. If RPV goes up, the change is a real win. If it goes down, the change costs you money, regardless of what conversion rate says. Next, we’ll walk through how to use revenue per visitor as your decision metric in testing.
 revenueflows.aigetshogun.compulsecro.com+21 min
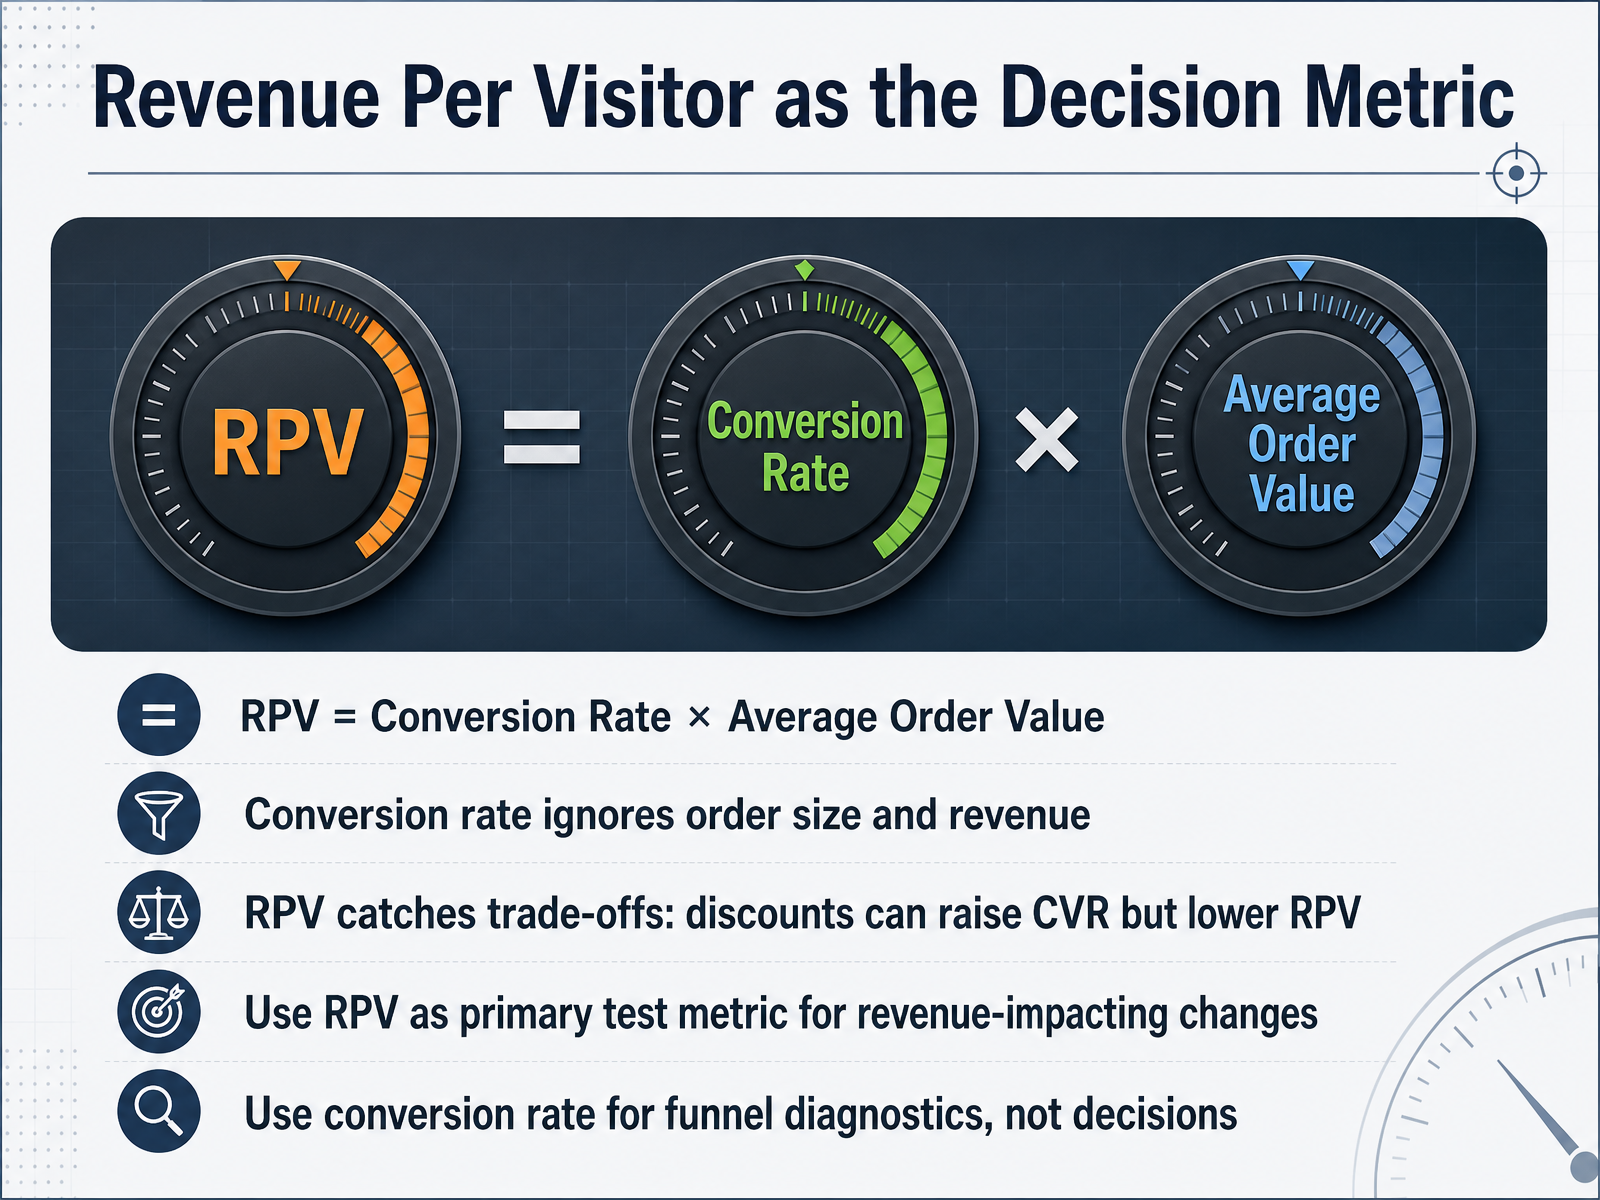
 - 10Revenue Per Visitor as the Decision MetricNow let's talk about the one metric that should drive your optimization decisions: revenue per visitor. It's a simple formula: conversion rate times average order value. But that simple product changes everything. Conversion rate alone tells you how many people said yes, but it ignores how much they actually spent. A visitor who buys a twenty dollar accessory and one who buys a three hundred dollar bundle count exactly the same. Revenue per visitor catches that gap. Let's look at a real trade-off. Run a twenty-five percent discount, and your conversion rate might jump from one point five to one point nine percent, a nice-looking win. But your average order value drops from one twenty to ninety dollars. Revenue per visitor falls from one eighty to one seventy-one. On ten thousand visitors, that's nine hundred dollars less, and your dashboard is celebrating. That's the trap. So here's the rule: for any change that touches pricing, bundles, or checkout offers, make revenue per visitor your primary test metric. It tells you whether the change actually grew the business. Keep conversion rate for funnel diagnostics, catching friction early, but never make it the decision maker. Next, we'll look at how statistical confidence keeps those revenue per visitor decisions honest.
 revenueflows.aigetshogun.compulsecro.com+22 min
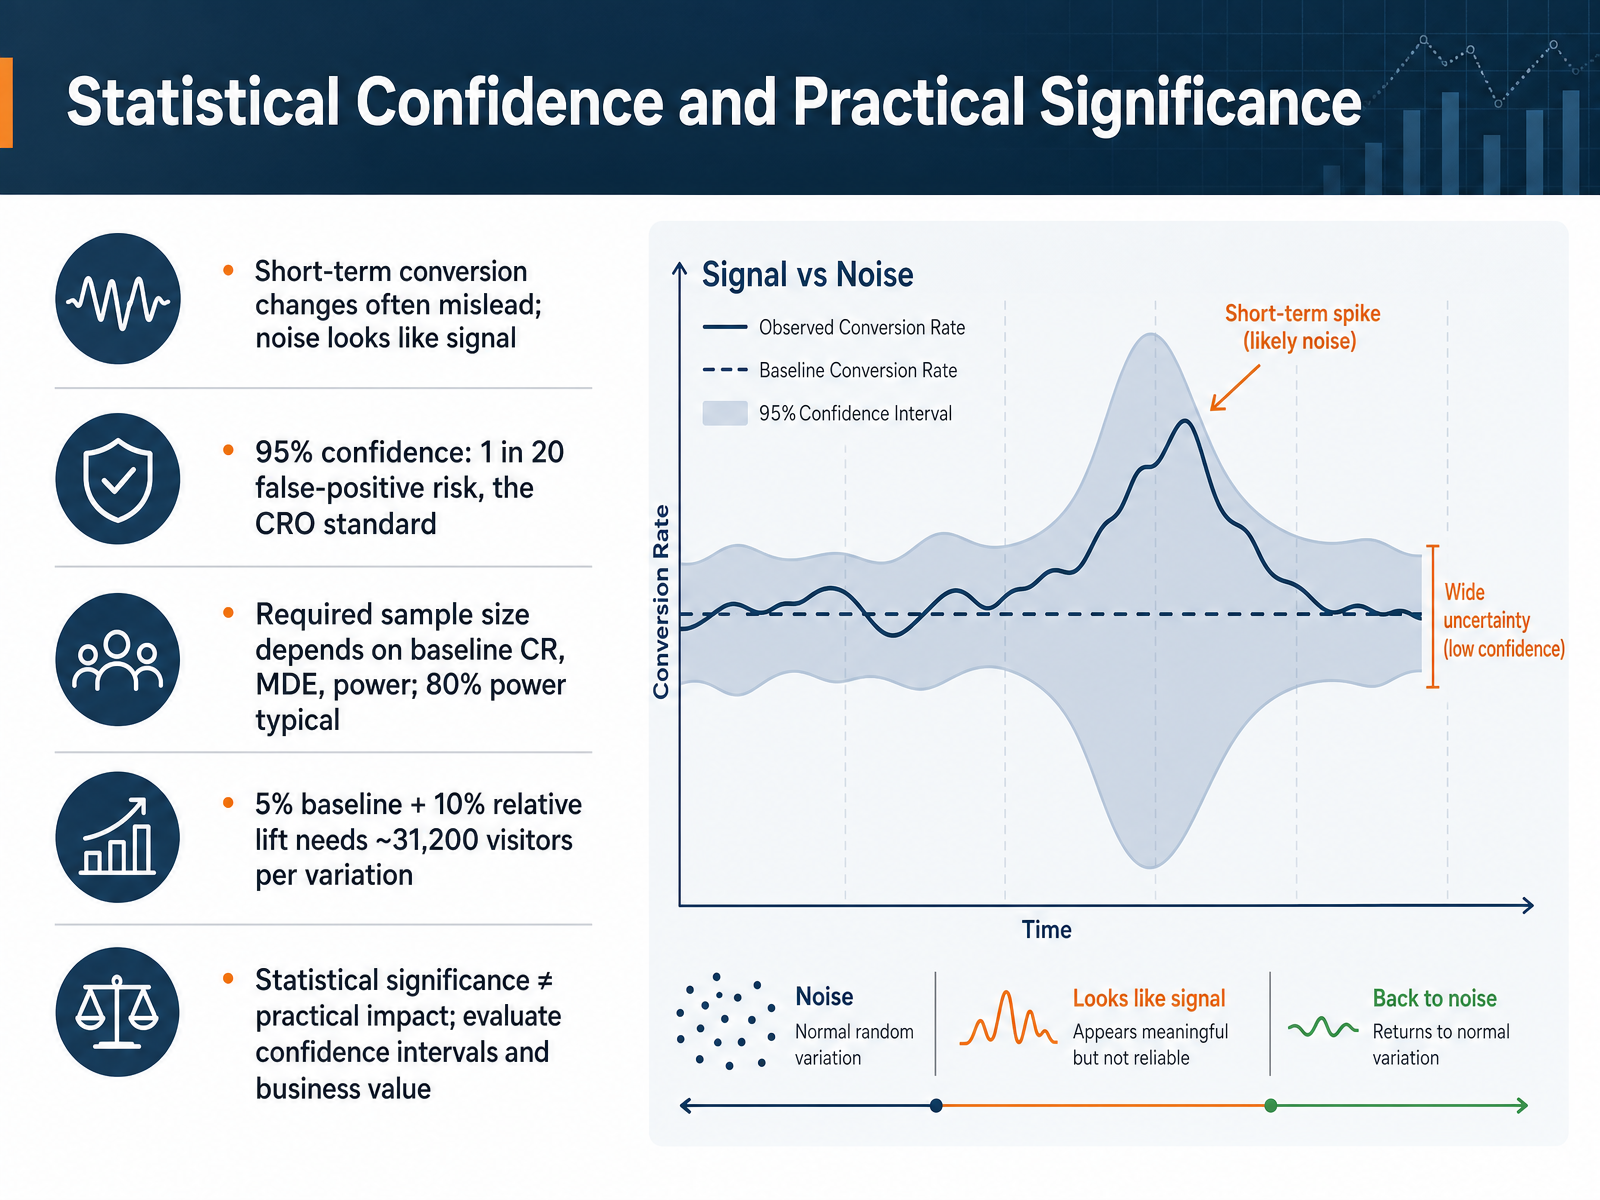
 - 11Statistical Confidence and Practical SignificanceLet’s talk about the difference between statistical confidence and practical significance. Short-term conversion changes often mislead you. What looks like a signal is frequently just noise. The CRO standard is 95% confidence, meaning a 1 in 20 false-positive risk. That’s the threshold you should hold yourself to. Sample size depends on your baseline conversion rate, your minimum detectable effect, and the power you choose. Power is typically 80 percent, so you have an 80 percent chance of detecting a real effect if it exists. Here’s a concrete example. If your baseline is 5 percent and you want to detect a 10 percent relative lift, you need roughly 31,200 visitors per variation. That’s about 62,000 total for two arms. If you only have 5,000 visitors a week, that’s a 12-week test. Now, statistical significance alone doesn’t mean you should ship. A result can be statistically real but practically irrelevant. So always check the confidence interval and ask what the business value really is. A 0.5 percent absolute lift might be real, but if it costs too much to implement, it’s not worth it. Next, let’s look at how to design experiments that you can actually trust.
 1 min
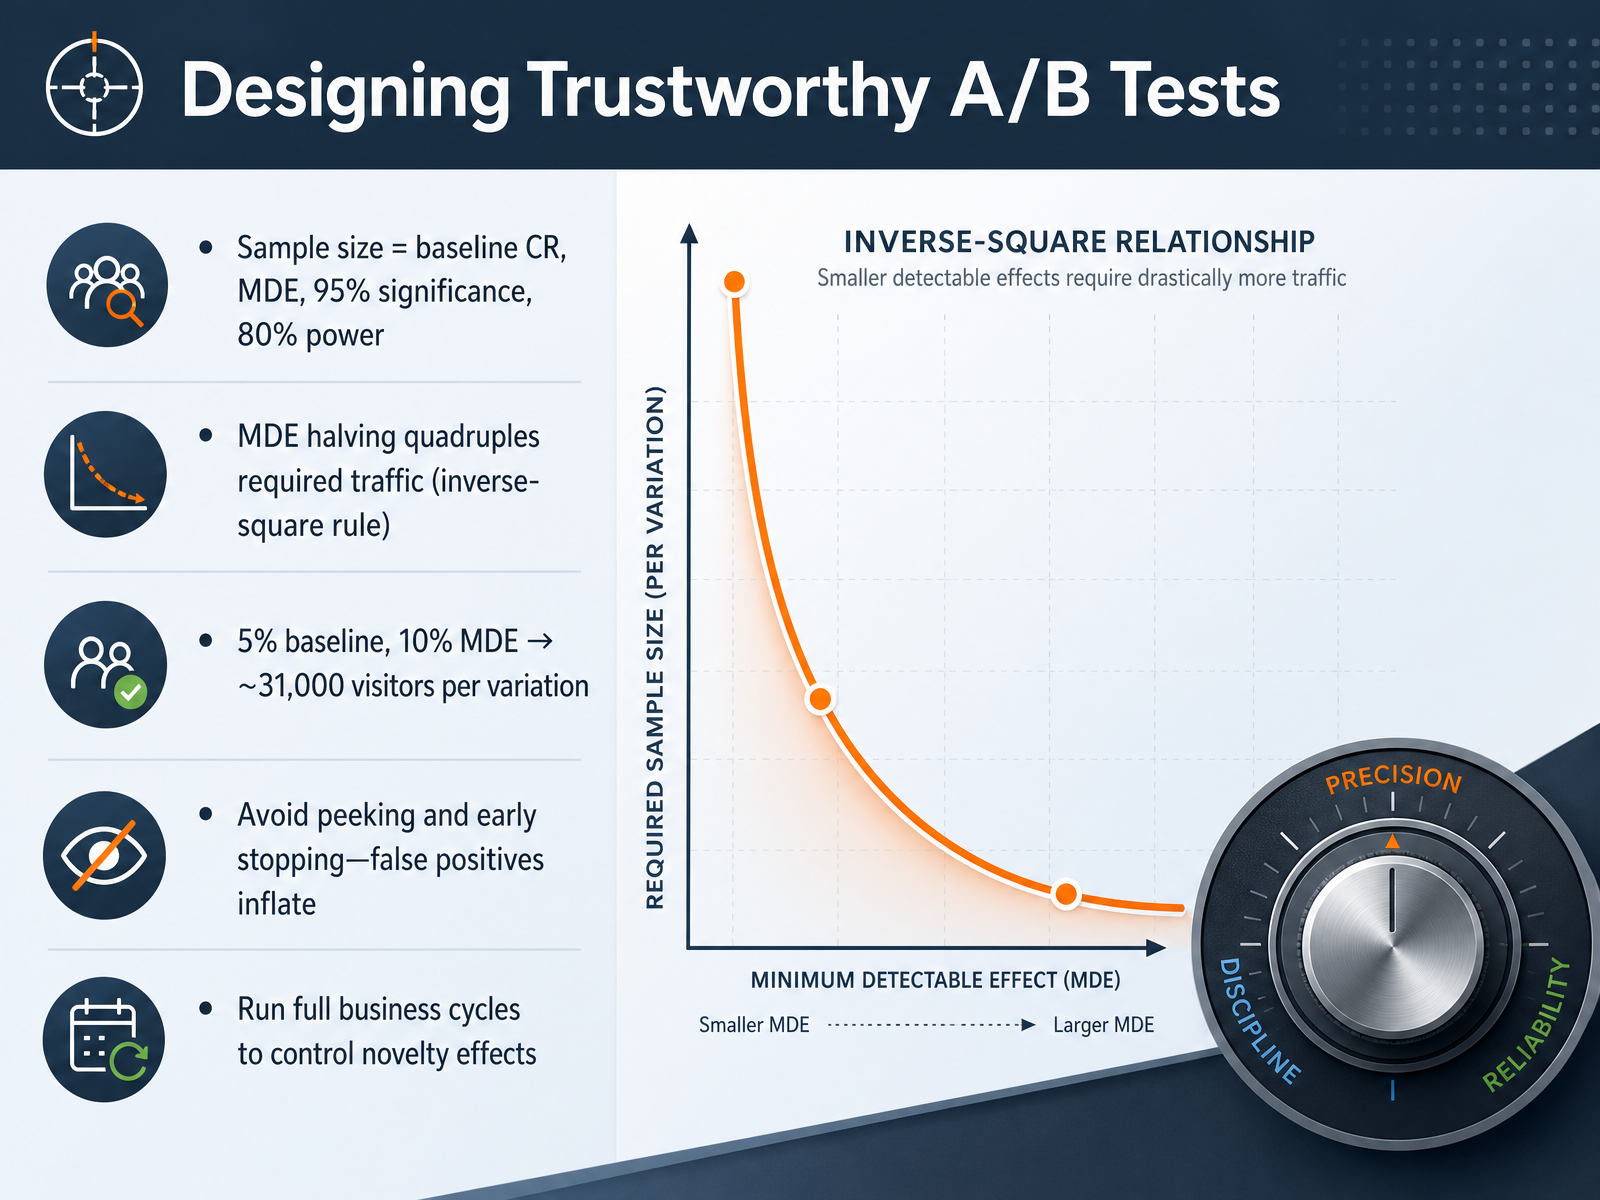
1 min - 12Designing Trustworthy A/B TestsNow let’s talk about designing tests you can actually trust. The foundation is sample size, and it comes from four inputs: your baseline conversion rate, the minimum effect you want to detect, your significance level, and your statistical power. For most tests, that means 95 percent confidence and 80 percent power. The key relationship to remember is inverse-square. If you cut your minimum detectable effect in half, you roughly quadruple the traffic you need. For example, with a 5 percent baseline and a 10 percent relative lift, you need about 31,000 visitors per variation. That’s 62,000 total. So before you launch, ask if that runtime is realistic. The other big mistake is peeking. Stopping the test the moment it looks significant inflates your false positive rate well beyond the 5 percent you planned for. Commit to the sample size up front. Finally, run for full business cycles. That controls for novelty effects and weekly patterns. A solid test is sized before it launches, and judged strictly on the plan.
 1 min
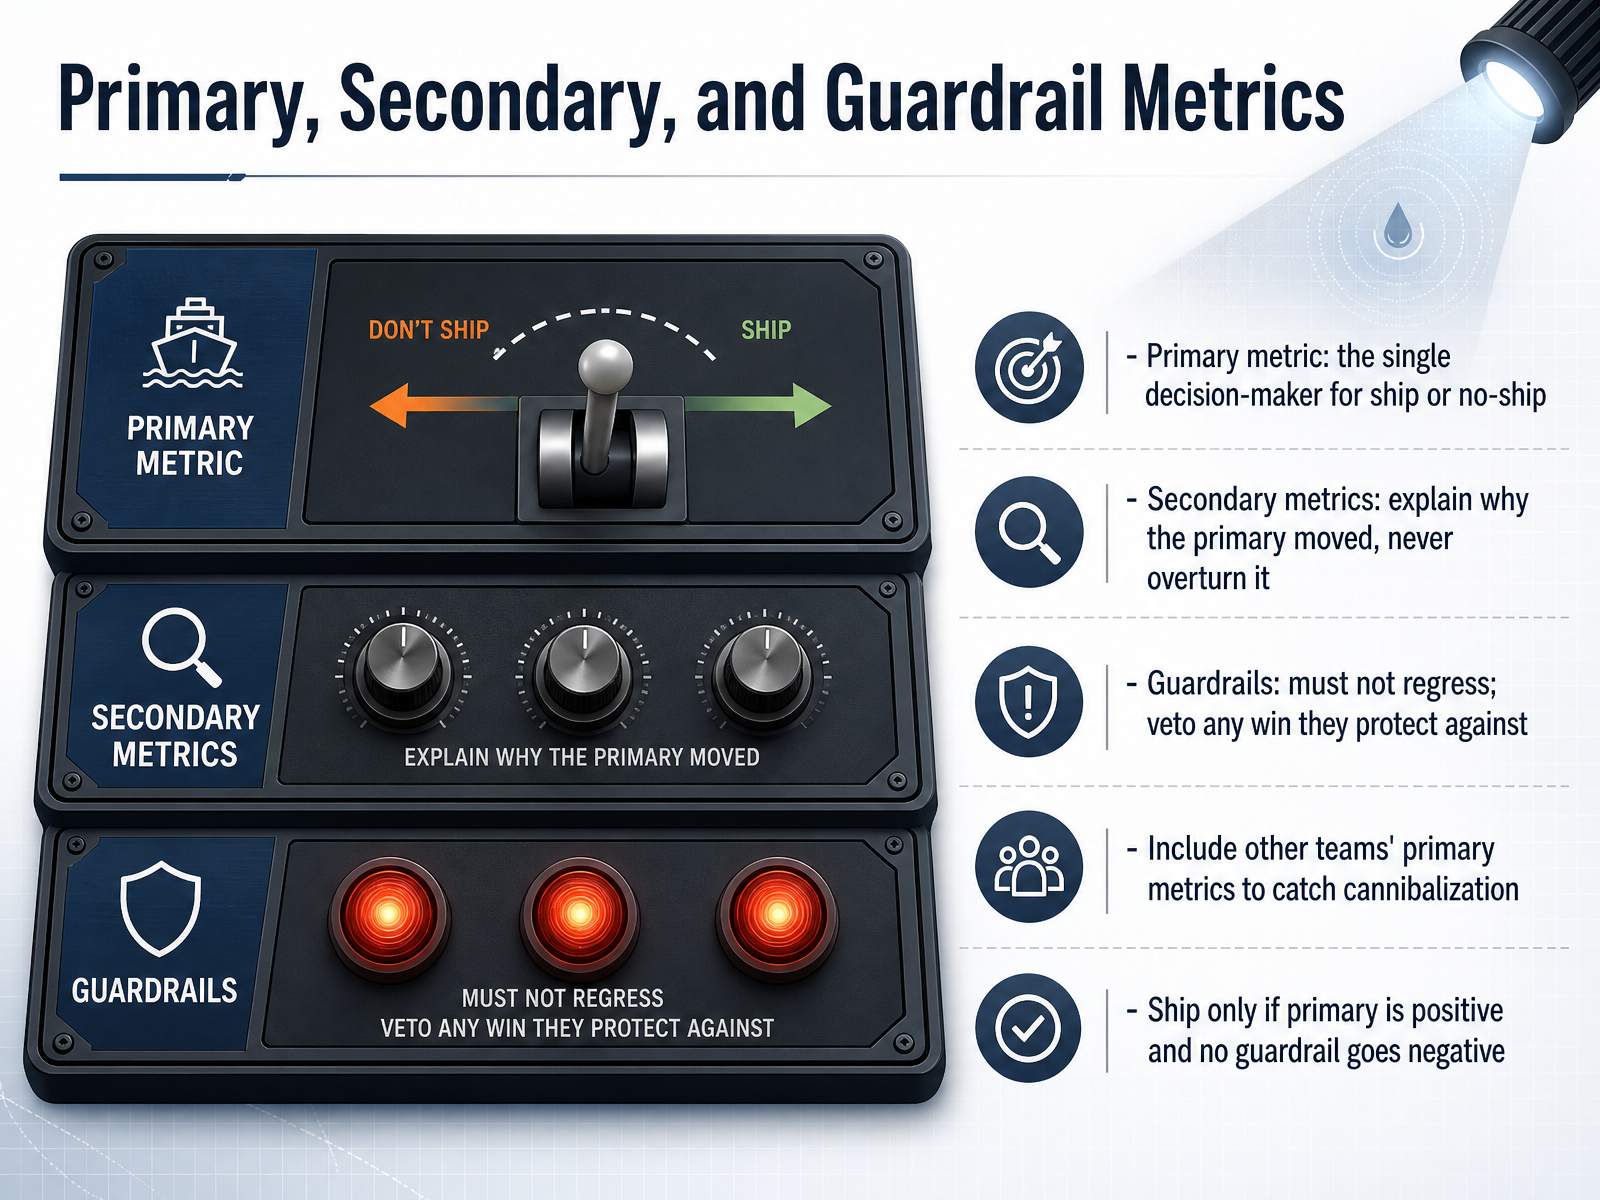
1 min - 13Primary, Secondary, and Guardrail MetricsNow let's talk about how to structure the metrics that actually determine a launch decision. You need a primary metric. This is the single decision-maker. It answers the question: does this win or not? Choose one, and pre-commit to it before the experiment starts. This prevents you from cherry-picking a winner after the fact. Next, secondary metrics. These explain why the primary moved. Did users actually behave how you predicted? They clarify the mechanism, but they never overturn the verdict. A secondary win with a flat primary is a learning opportunity, not a launch. Now, guardrails. These protect the business from hidden costs. They must not regress — think refund rate, latency, or, critically, other teams' primary metrics. Put those in your guardrails to catch cannibalization. If your win comes at their expense, the guardrail blocks it. So, the rule is simple: ship only if the primary is positive and no guardrail goes negative. That discipline converts a messy dashboard into an unambiguous decision. Now, let's connect these experiment metrics to actual business impact.
 1 min
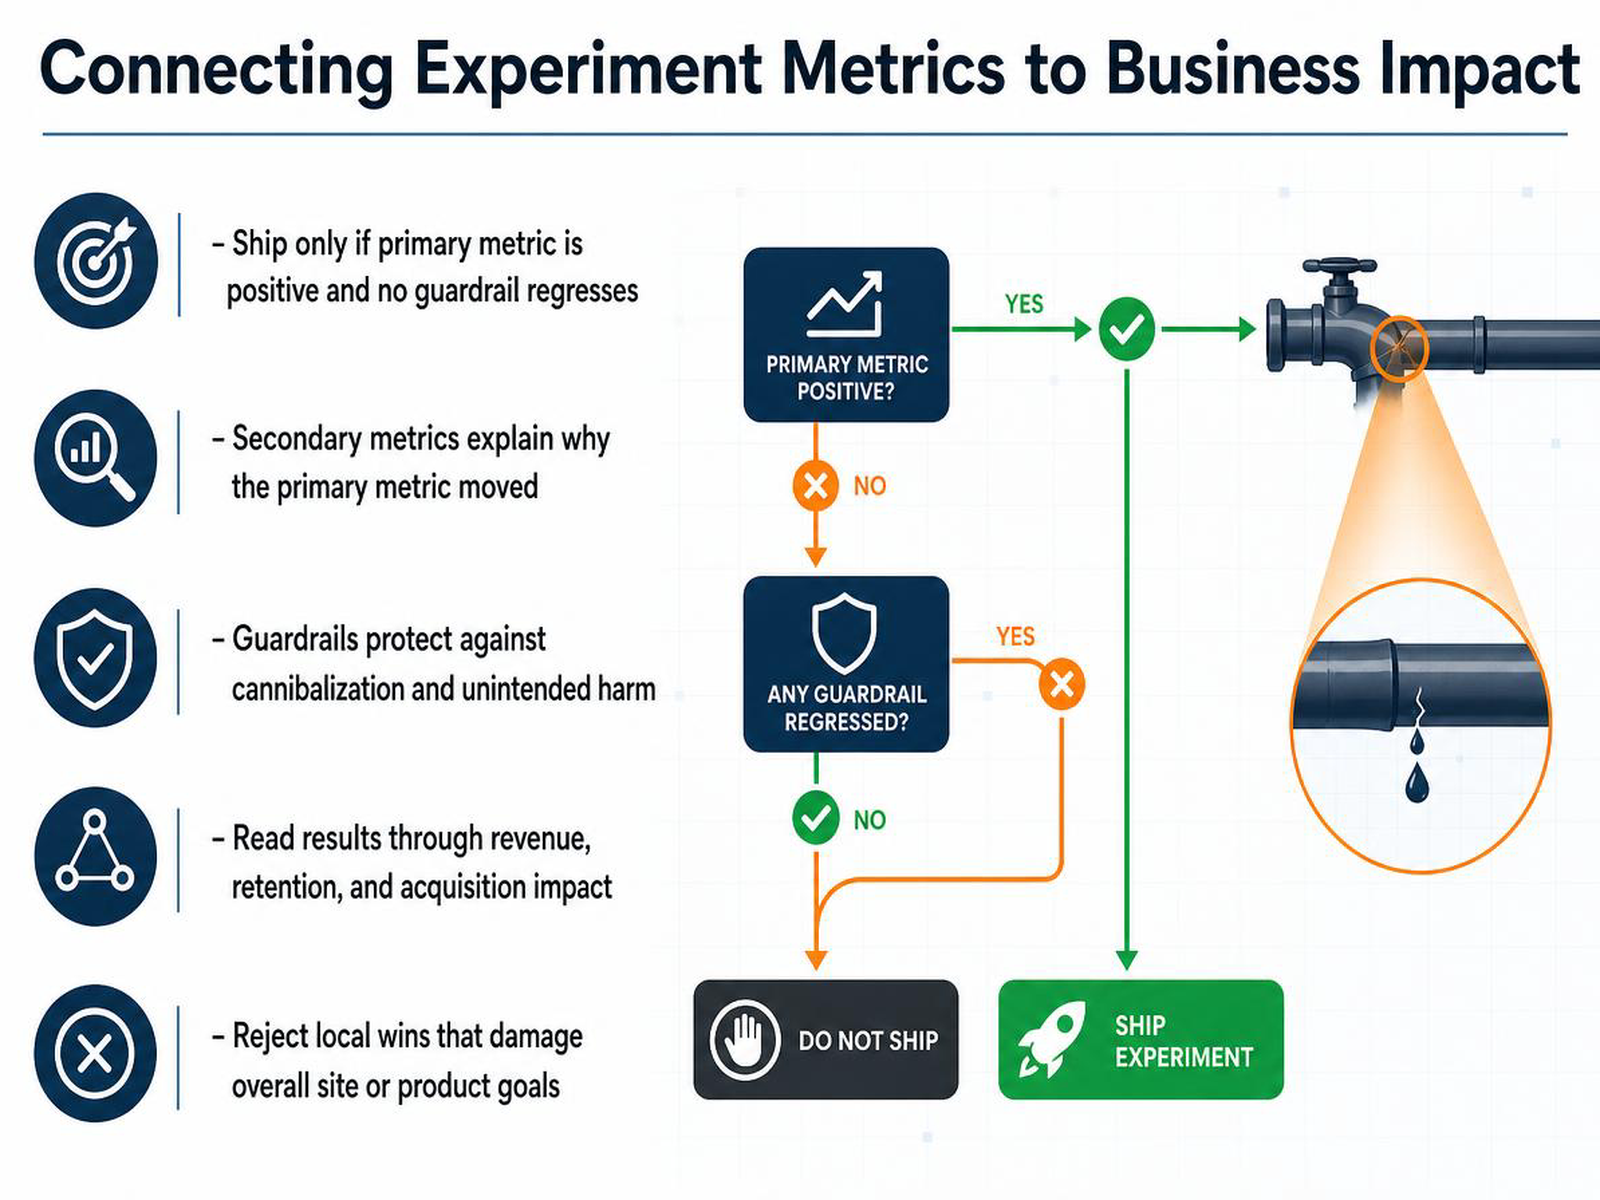
1 min - 14Connecting Experiment Metrics to Business ImpactNow let’s connect experiment metrics to real business impact. The rule is simple: ship only if your primary metric is positive and no guardrail has regressed. A lift on the surface means nothing if it breaks something else underneath. Secondary metrics explain why the primary moved. They confirm your hypothesis about user behavior, not just the outcome. For example, if checkout conversion improves, add-to-cart and cart abandonment tell you whether the change genuinely removed friction or just shifted where users drop off. Guardrails protect the rest of the business. Put other teams’ primary metrics into your guardrail bucket so a win for you never silently becomes a loss for them. Read every result through revenue, retention, and acquisition impact. A short-term conversion win that damages repeat purchase or cannibalizes another funnel is a local win and a global loss. Reject those. The discipline is to decide before launch which metrics matter, then trust that decision when results are in. That is how you turn test data into durable growth. Up next, we’ll walk through building a CRO measurement dashboard that keeps these guardrails visible every day.
 revenueflows.aigetshogun.compulsecro.com+22 min
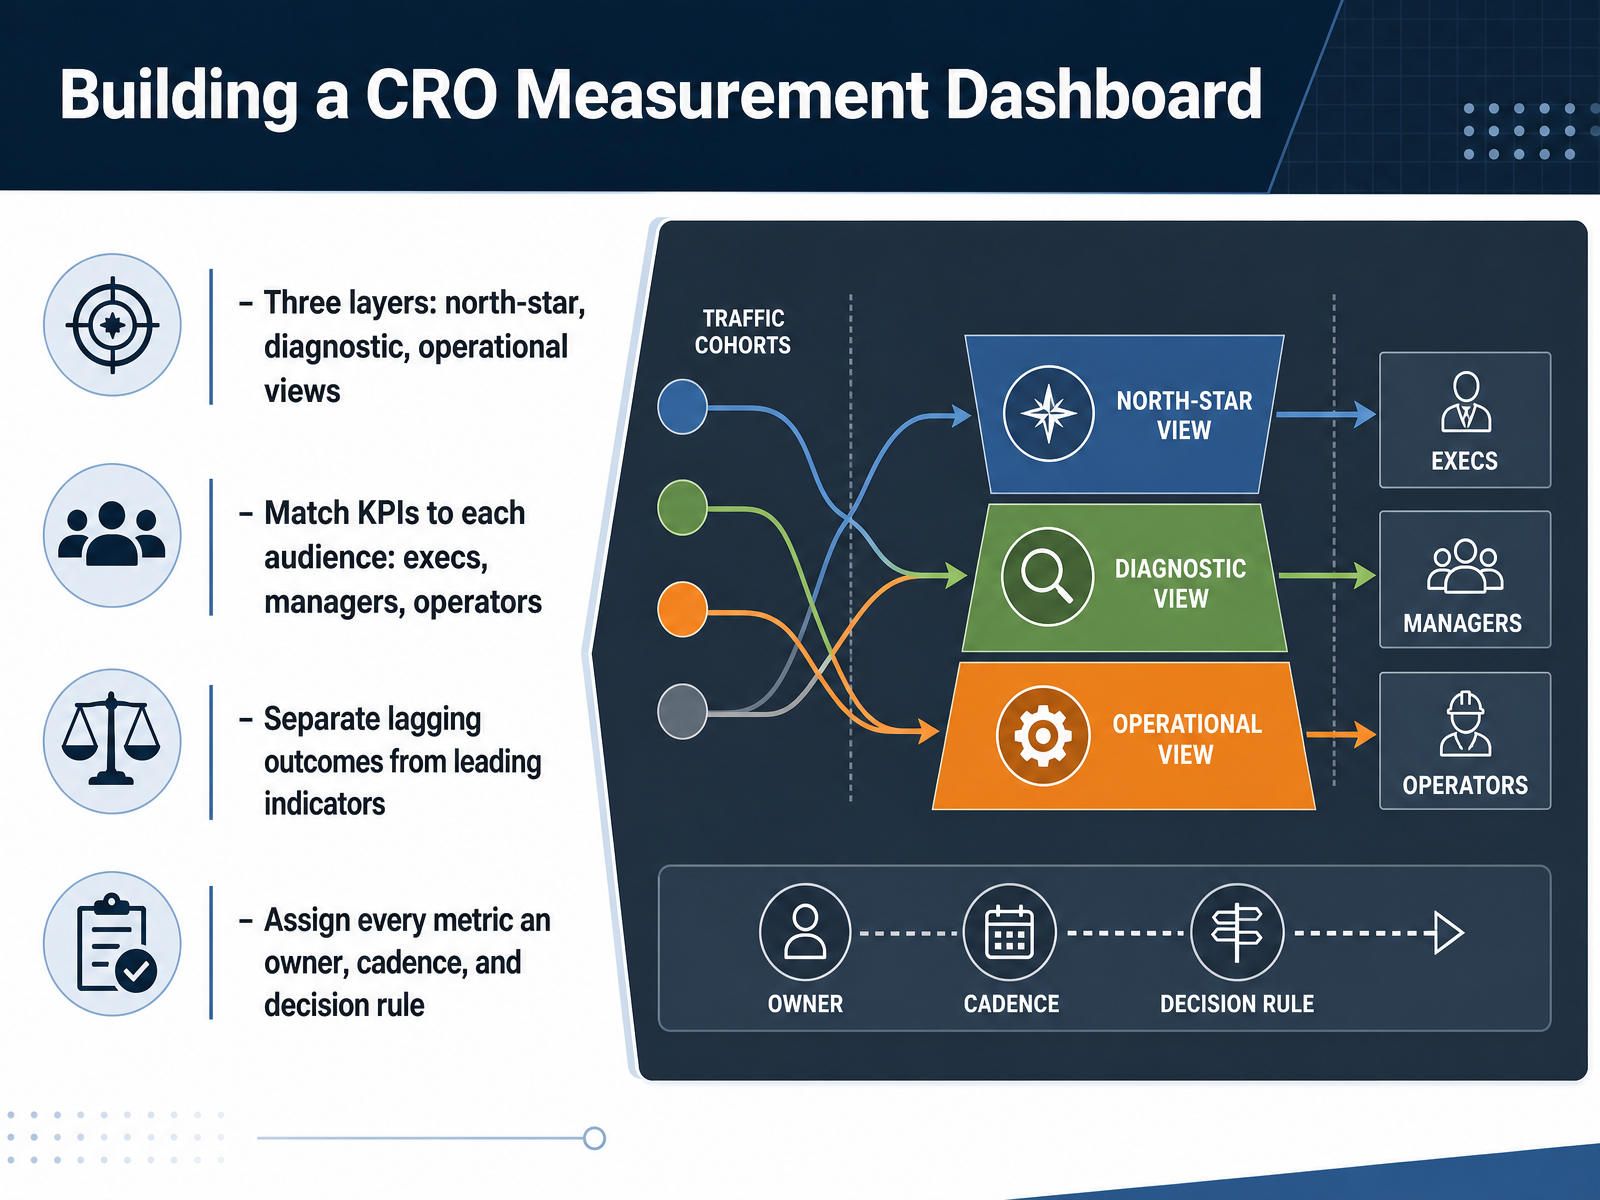
 - 15Building a CRO Measurement DashboardAs we close, let’s turn all these metrics into one clear system. Your dashboard needs three layers. The north star shows the board whether revenue is on plan. The diagnostic layer shows managers why that number moved—where the funnel leaks, which segments lag, which tests won. The operational layer shows your team what to do today: which experiments to launch, which pages to fix, which leads to chase. Match each KPI to its audience, and separate lagging outcomes like conversion rate from leading indicators like CTA clicks. Finally, assign every metric an owner, a review cadence, and a decision rule. If conversion drops below a threshold, who acts—and what do they do? Clarity beats categories. When every number has an owner and a rule, the dashboard stops being a report and becomes a control panel. Thank you for your attention. Go build it, and let your conversion data drive the next decision.
 1 min
1 min
Take the deck with you
Download this course as a file — free, no sign-up needed.
- PDF handoutEvery slide page, ready to print or share.16 pages · 3.8 MBDownload
- Narrated PowerPointThe deck that presents itself — every slide carries the digital human's narration video.16 pages · 15.7 MBDownload
- PowerPoint slidesThe full deck as a .pptx — open it in PowerPoint, Keynote, or Google Slides.16 pages · 3.7 MBDownload
Free to use in your own training — please keep the PersonWise credit page at the end.
Have your own deck? Turn it into a course
Sources consulted
Web sources consulted while building this course.
- Macro vs Micro Conversion — omniconvert.com
- Macro vs. Micro Conversions — nngroup.com
- What Is a Conversion? Micro-Conversions and Macro-Conversions | Space Ads Knowledge base — spaceads.agency
- Micro Conversions vs Macro Conversions: What Matters Most? - Conversion Bros — conversionbros.com
- Micro Conversions Explained: How Small Actions Drive CRO Wins | Power Digital — powerdigitalmarketing.com
- How to Calculate Conversion Rate: Formulas, Benchmarks, and Tips — kissmetrics.io
- What is a Retail Website's Conversion Rate Calculated As? (2026) - Shopify — shopify.com
- Conversion Rate Formula: Calculator & Worked Examples — metricuno.com
- CRO Metrics & Measurement: Conversion Rate, | Digital Codex — clarigital.com
- How to Figure Out Conversion Rate: Step-by-Step | Otter — otterab.com
- [GA4] Engagement rate and bounce rate - Analytics Help - Google Help — support.google.com
- GA4 Bounce Rate vs Engagement Rate: What Actually Changed (And Why It Matters) — nicelookingdata.com
- Bounce Rate vs Engagement Rate in GA4: A Practical Guide for Web Analytics - Webeyez Insights — webeyez.com
- 2026 Web Analytics Benchmarks: Bounce Rate, Session Duration, Conversion Rate | Sleek Analytics — getsleek.io
- What Is Engagement Rate in GA4? + How to Improve It — semrush.com
- Revenue Per Visitor vs Conversion Rate: Track the Right One | RevenueFlows Blog — revenueflows.ai
- Conversion Rate vs. Revenue Per Visitor: What's More Useful? — getshogun.com
- Revenue per Visitor vs Conversion Rate: What A/B Tests Should Actually Optimize | PulseCRO — pulsecro.com
- How to Increase Revenue per Visitor (RPV) in eCommerce [2026 Guide] — omniconvert.com
- Revenue Per Visitor (RPV): A Complete Guide for 2026 — DataSaaS — datasaas.co