Understanding Data Lineage
Begin
13 pages · ~26 min
Understanding Data Lineage
This training helps data professionals trace data from source to output, understanding how transformations affect data quality and governance.
What you’ll learn
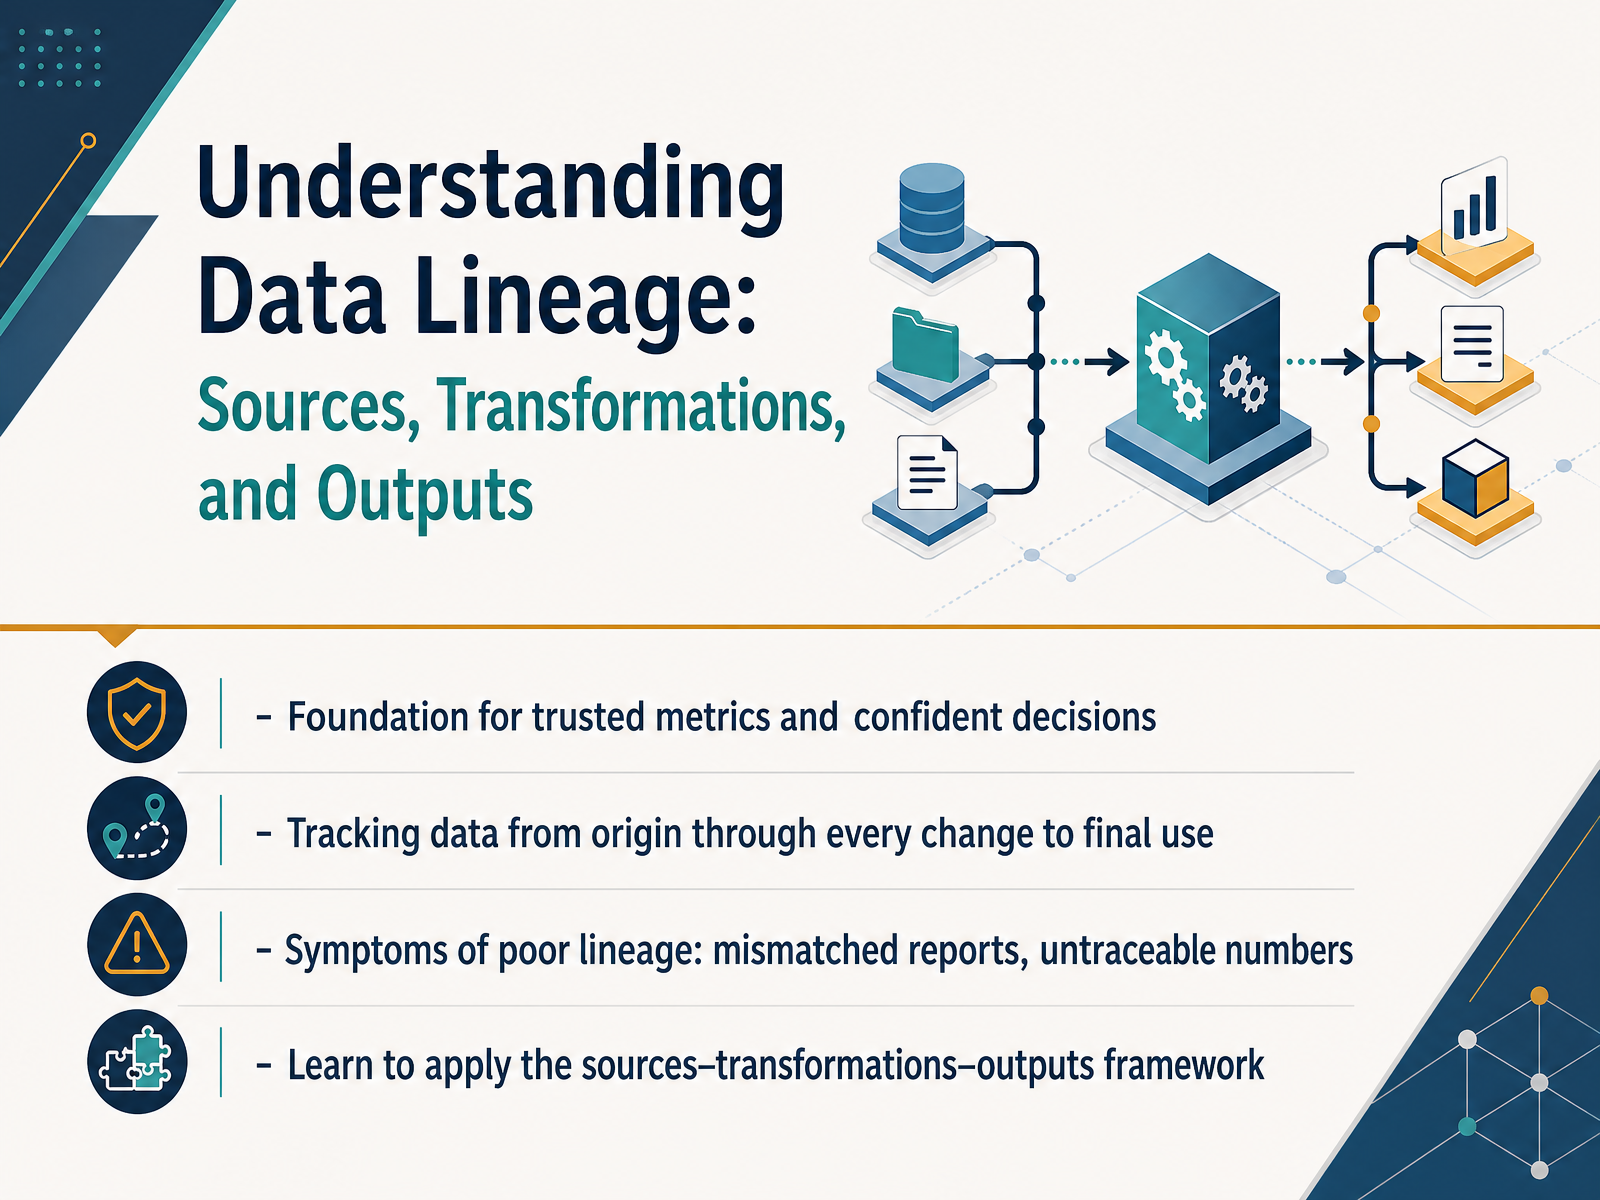
- 01Understanding Data Lineage: Sources, Transformations, and OutputsWelcome. Today we are exploring data lineage, the practice that helps you track a metric’s entire conceptual path from its original sources, through every transformation, right to its final output. In this course, you will learn a clear sources, transformations, and outputs framework. Think of data lineage as the foundation for trusted metrics and confident business decisions. Without it, teams often face mismatched reports, untraceable numbers, and endless fire drills. By the end, you will be able to visually trace a metric’s journey and explain each step to any stakeholder. Let us begin by looking at the business case for data lineage.docs.cloud.google.comgithub.commetaplane.dev+22 min
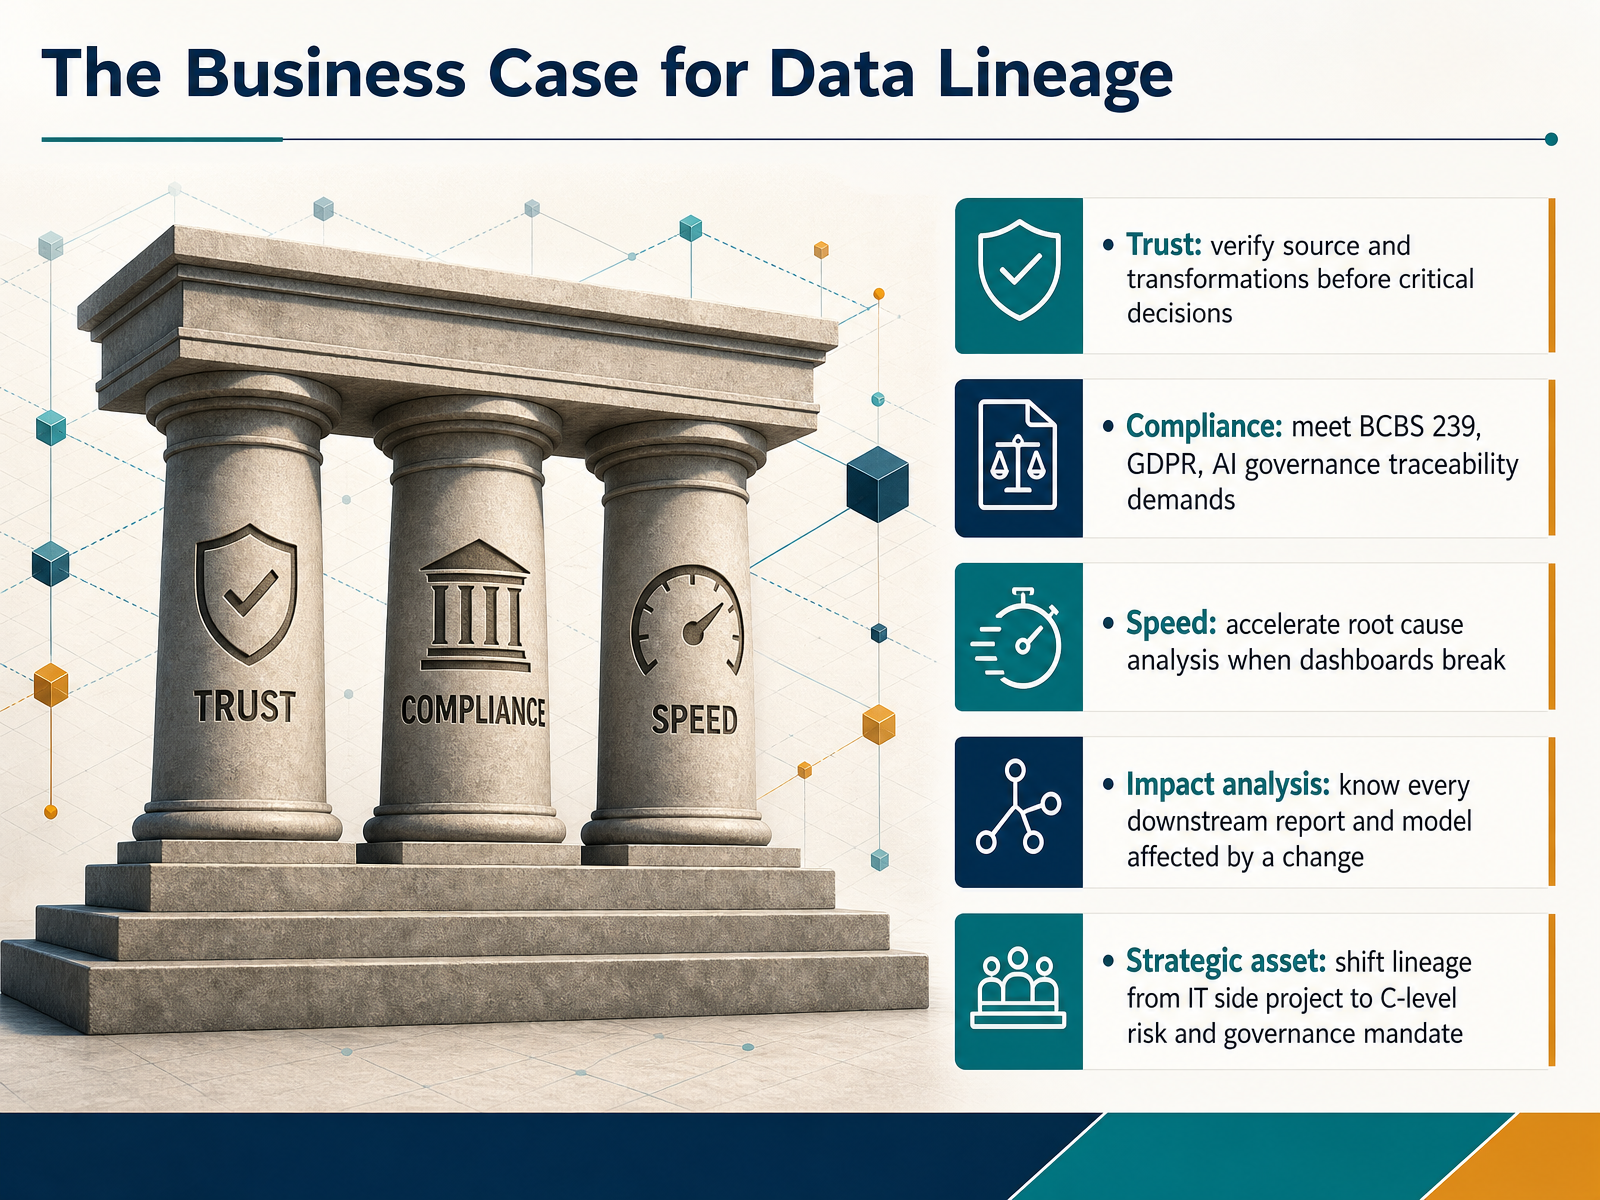
- 02The Business Case for Data LineageNow, let's examine why data lineage has become a strategic business priority. First, trust. Decision-makers can verify the source and full transformation history of a metric, replacing gut feelings with hard evidence. Second, compliance. Regulations like BCBS 239, GDPR, and emerging AI governance rules demand an auditable, end-to-end trace of your data. Third, speed. When a dashboard breaks, lineage accelerates root cause analysis, often reducing resolution time by ninety percent. Fourth, impact analysis. Before making a change, you can instantly see every downstream report, model, and dashboard that depends on that data point. Finally, and most importantly, lineage is no longer an IT side project. It has shifted into a C-level risk and governance mandate—a strategic asset that underpins data integrity and artificial intelligence accountability. Next, we will formalize this view by exploring the core concepts of nodes, edges, and granularity.
 datacrossroads.nlcdn.builtin.comuplatz.com+22 min
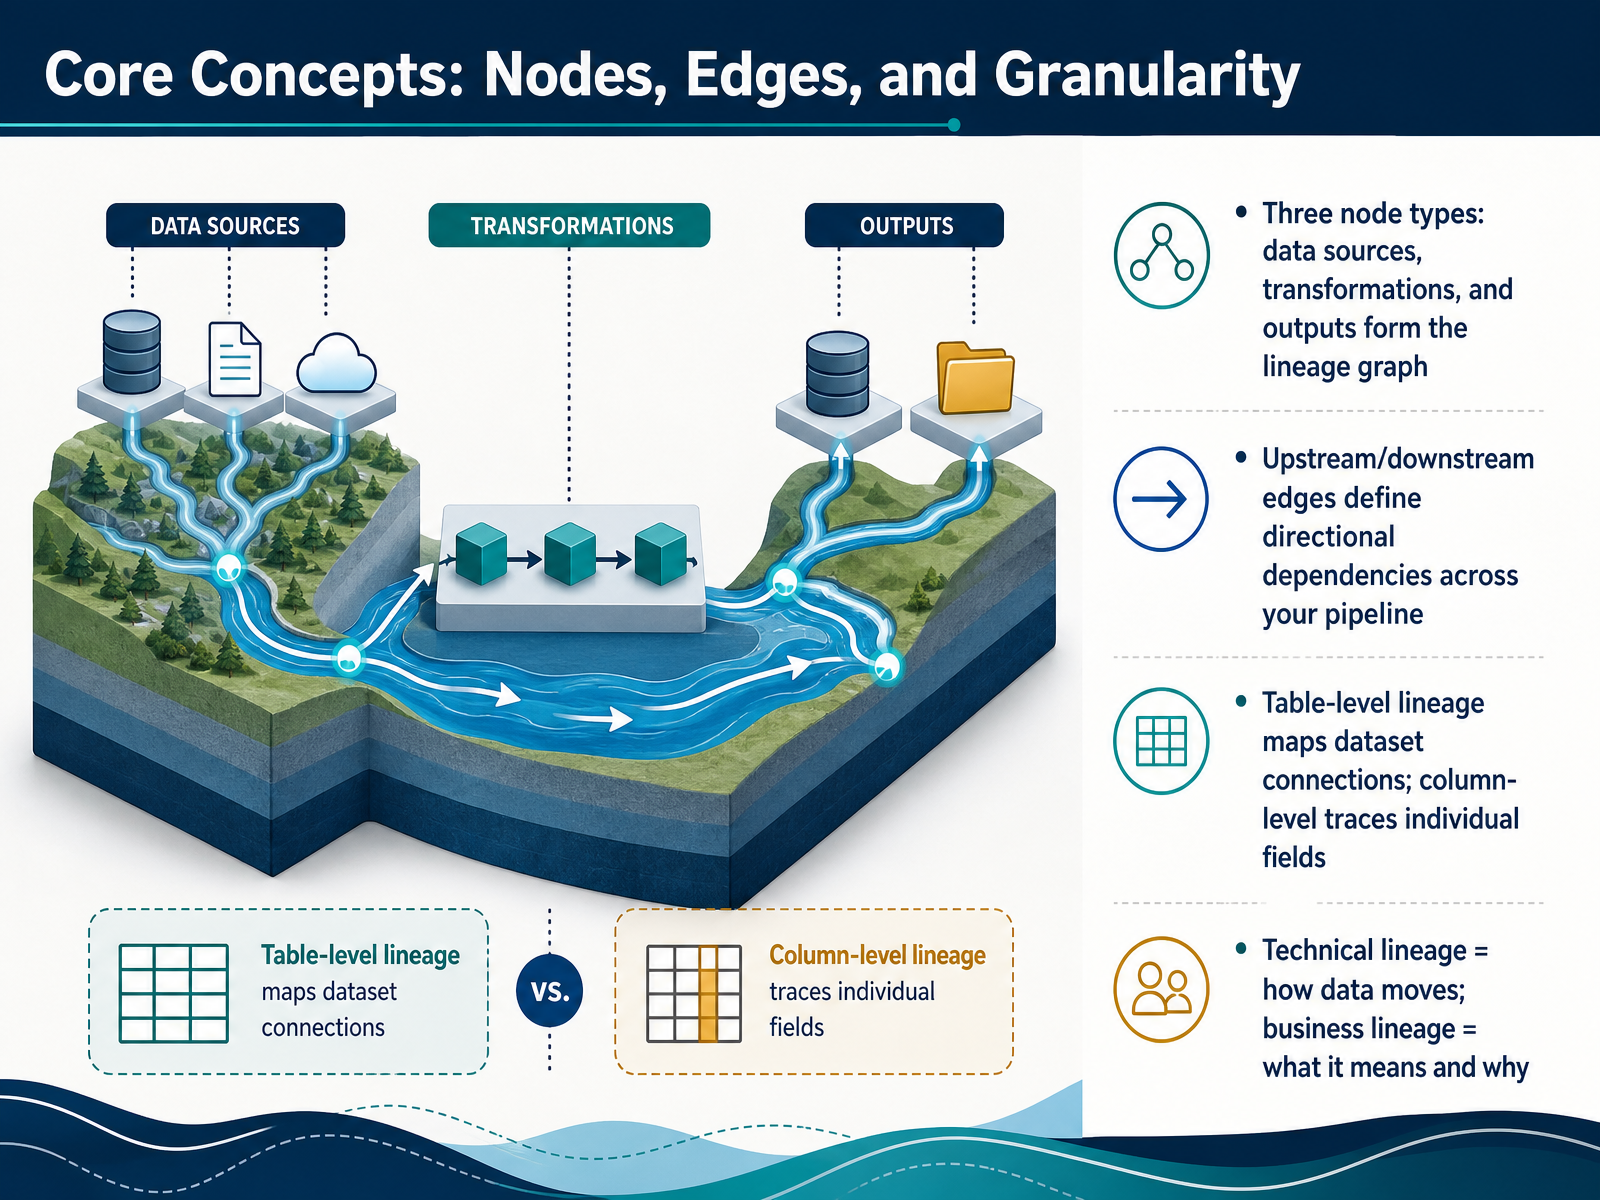
 - 03Core Concepts: Nodes, Edges, and GranularityNow let's unpack the core building blocks of a lineage graph. Think of it as a map made up of three types of nodes. First, data sources, where the journey begins. Second, transformations, the steps where data gets cleaned or calculated. And third, outputs, such as dashboards or reports. The connecting arrows between these nodes are called edges, and they define the directional flow. An upstream change flows downstream, potentially impacting everything in its path. The level of detail in this map is its granularity. Table-level lineage shows you that one dataset feeds another. But column-level lineage zooms in much further. It traces a single field, like a revenue number, through every join and calculation. We layer purpose on top of this with two views. Technical lineage shows exactly how the data moves. Business lineage explains what the data means and why it matters to the organization. Up next, we will apply these concepts by identifying and documenting data sources.
 coalesce.iomontecarlo.aiatlan.com+22 min
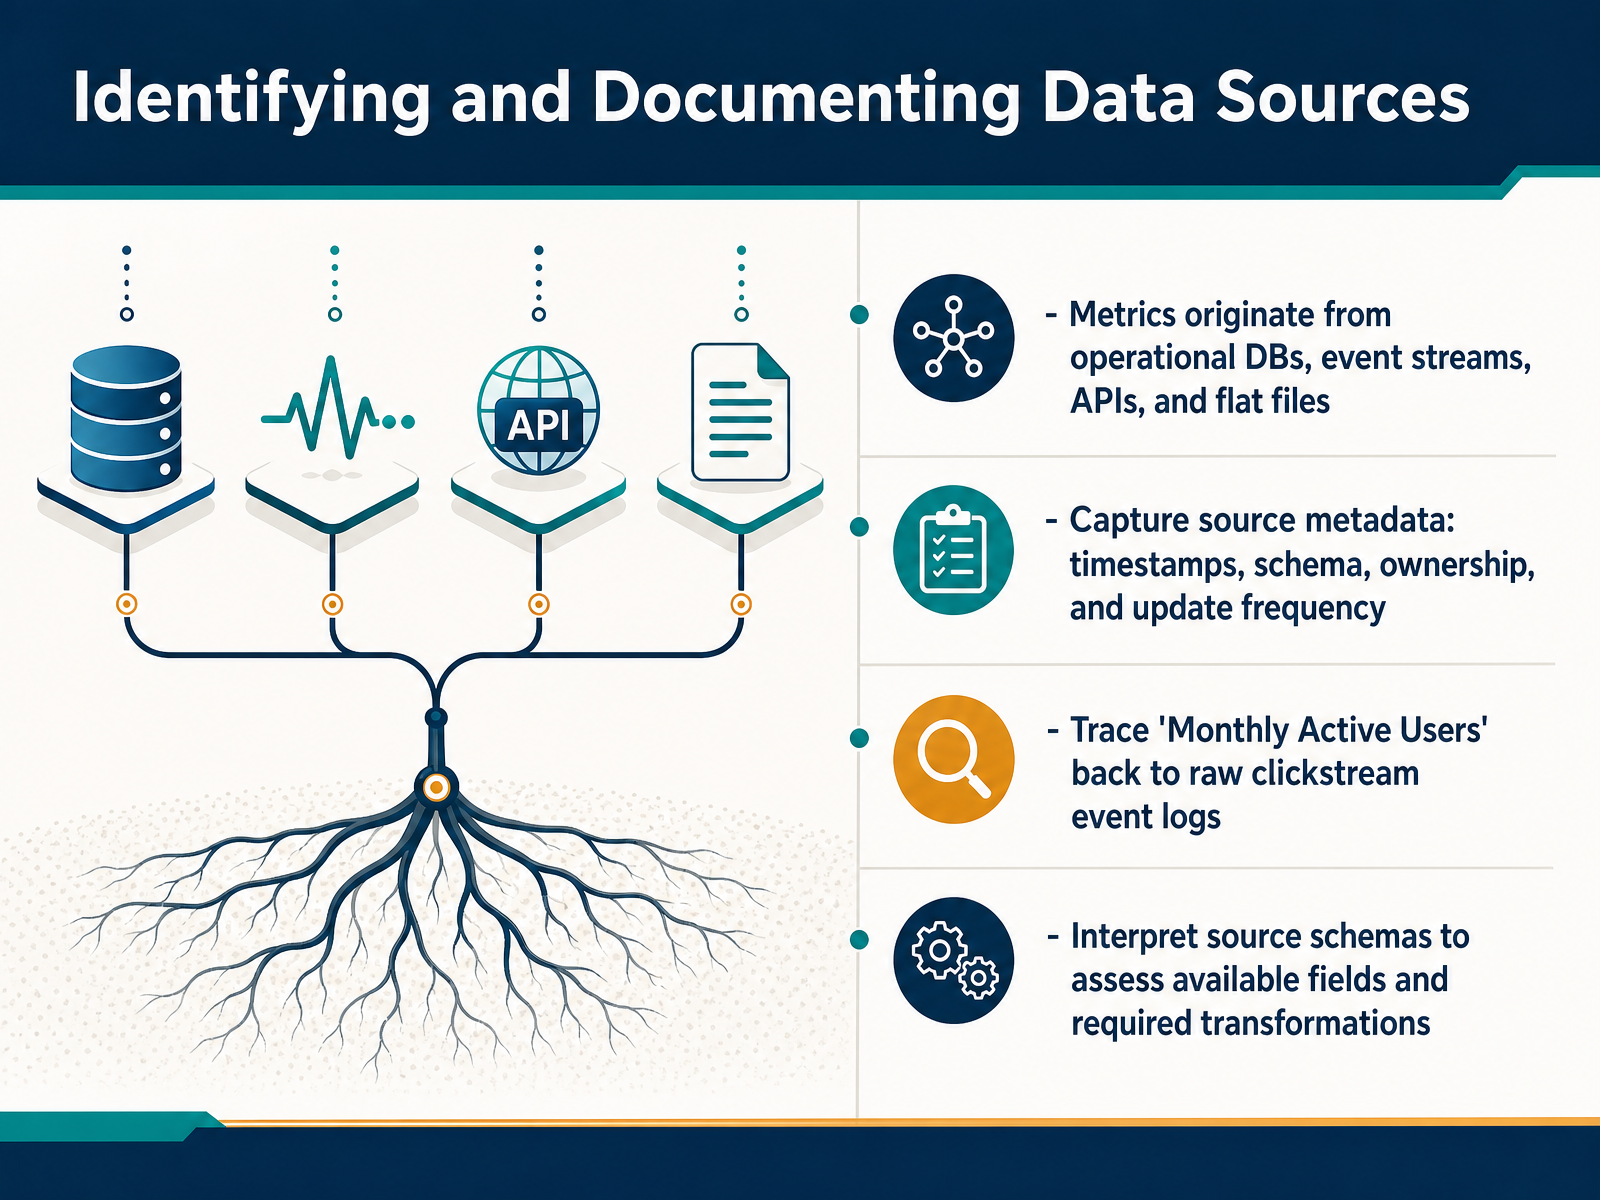
 - 04Identifying and Documenting Data SourcesSo, where does a metric actually begin? Every number you see on a dashboard originates from a raw data source. These sources are often operational databases that run your business applications, real-time event streams that capture user clicks and interactions, external APIs pulling data from third-party services, or even flat files like CSV exports and logs. To trust the metric, you must first document the source. This means capturing critical metadata: the last update timestamp, the schema structure that defines the allowed fields, the owner who is accountable for the data, and the refresh frequency. Let's take the metric 'Monthly Active Users' as a concrete example. To trace it, you follow the path backward. It doesn't start as a polished number; it comes from raw, disaggregated clickstream event logs, where every single page view or app launch is recorded. By interpreting the source schema, you assess what fields are available. You might find a user identifier, a timestamp, and an event type. Right there, you can see what transformations will be necessary to filter, deduplicate, and aggregate those raw logs into a meaningful count of unique users. Understanding this starting point makes the entire transformation journey visible. Next, we will actually walk through tracing those transformations step by step.
 docs.getdbt.commedium.comgetdbt.com+22 min
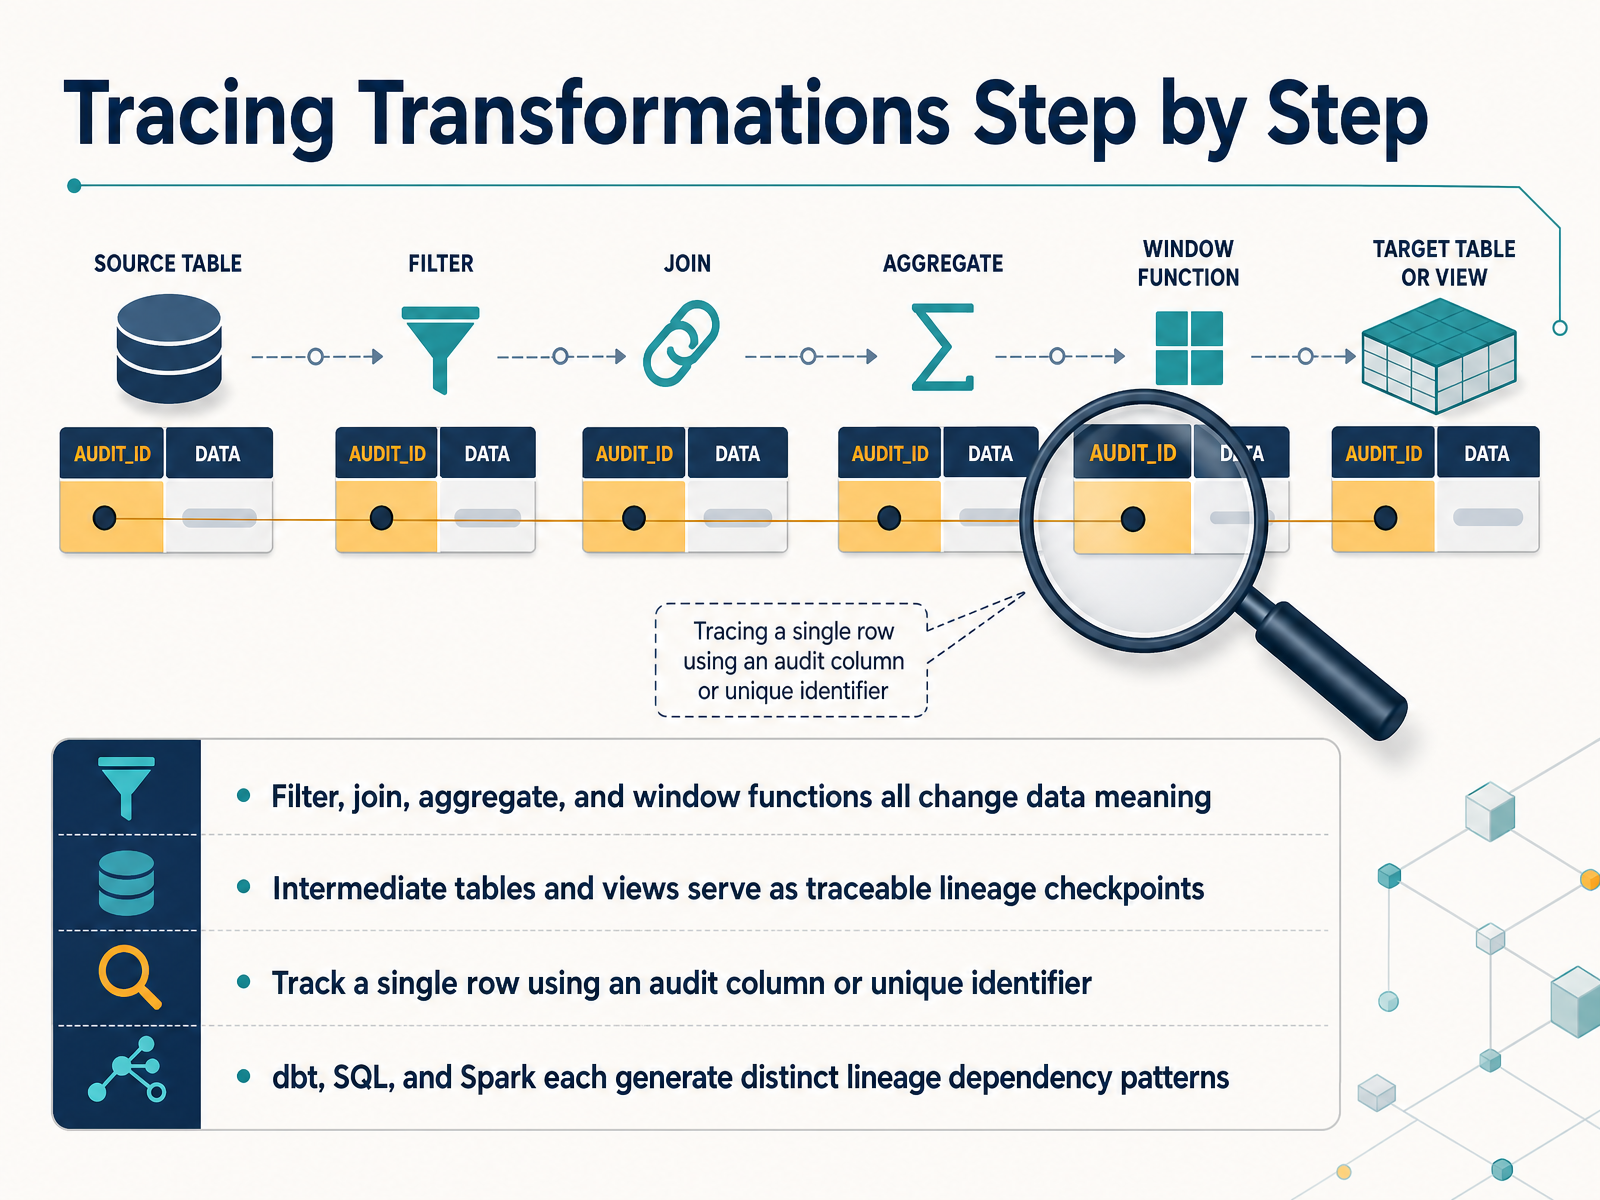
 - 05Tracing Transformations Step by StepNow, let's walk through what actually happens inside a transformation, step by step. When we talk about changing data, we are referring to specific operations: filtering rows, joining tables together, aggregating values, or applying window functions. Each of these actions fundamentally alters the meaning of the data. Without a clear trail, it's easy to lose sight of how a raw value became the final number in a report. To build that trail, think of intermediate tables and staging views as checkpoints. They are traceable stops on a journey, not just clutter in the database. You can track a single row across these checkpoints by using a unique identifier or a dedicated audit column. This lets you follow a specific customer or transaction from start to finish. The patterns of these trails change depending on the tool. This is a key distinction: dbt, Spark, and handwritten SQL each produce different dependency structures. dbt links models together with explicit references, Spark parses execution plans, and generic SQL often requires manual parsing. Next, we will see how dbt automates this dependency mapping for you.
 docs.getdbt.commedium.comgetdbt.com+22 min
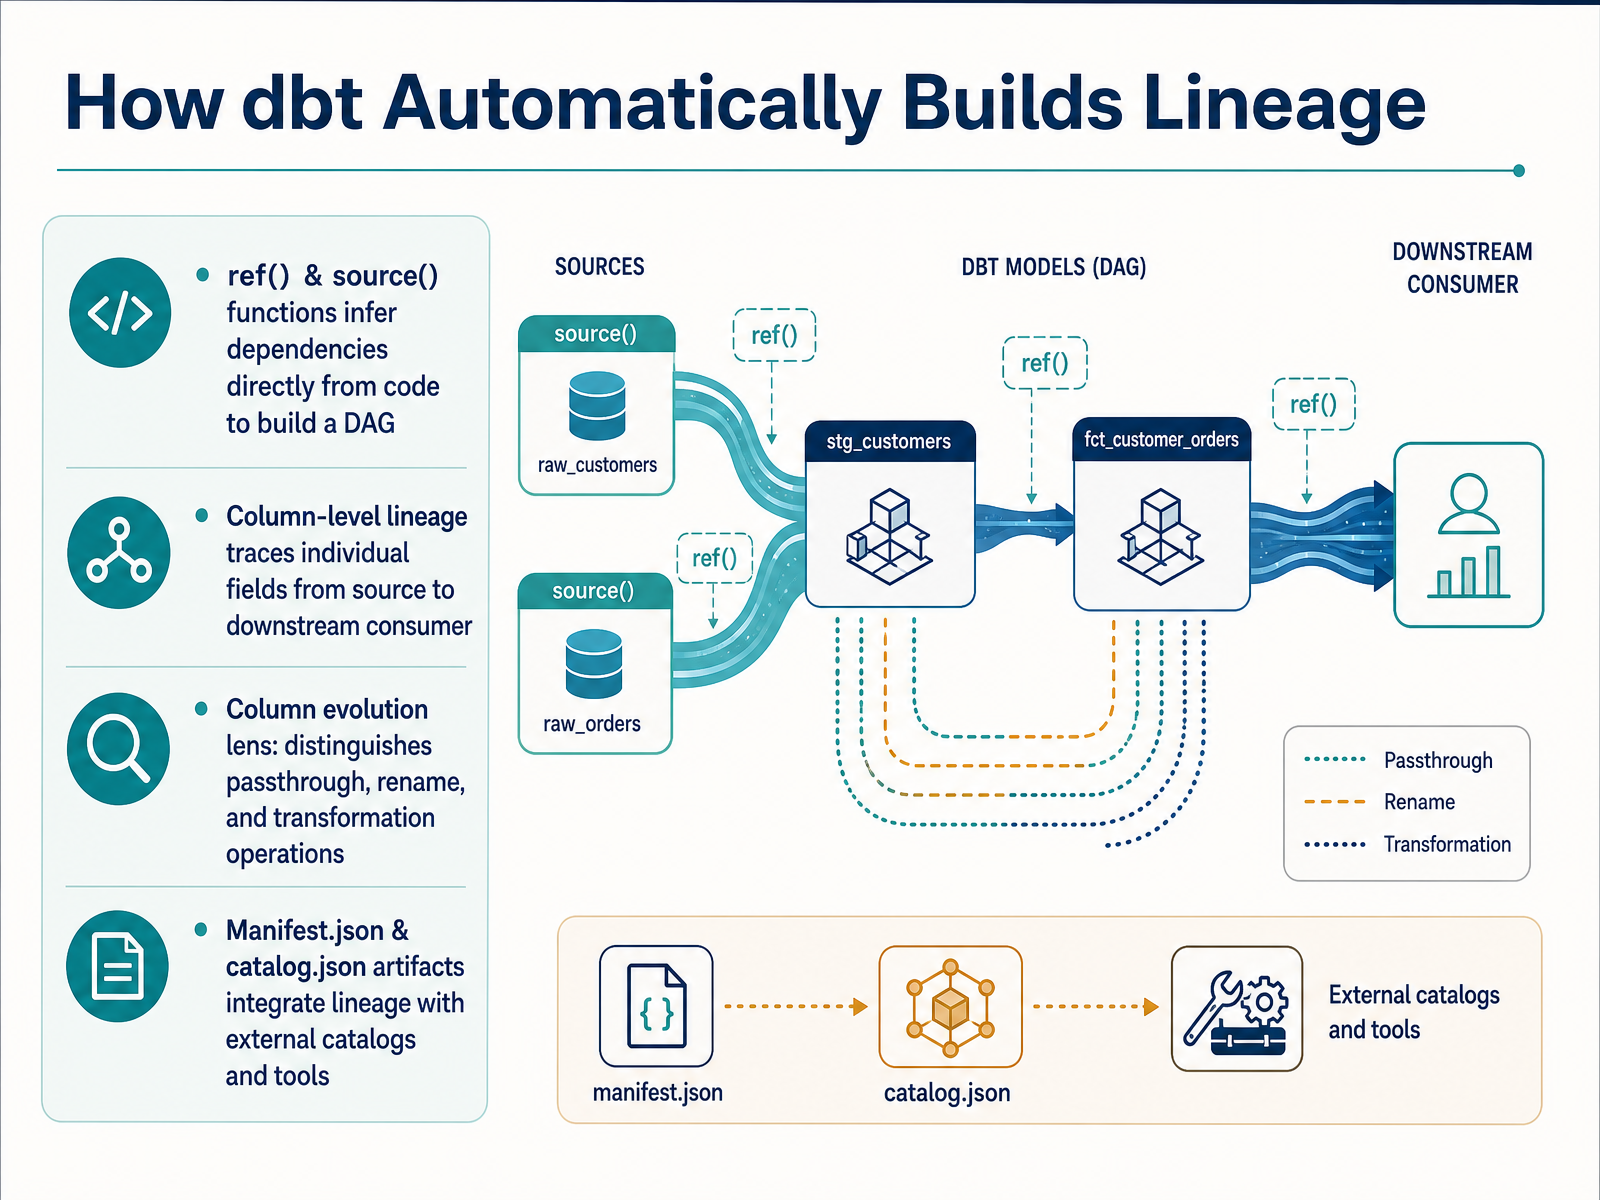
 - 06How dbt Automatically Builds LineageLet's unpack the actual mechanism dbt uses to build lineage automatically. The foundation of this traceability starts with two simple functions: ref and source. When you use ref to call one model from another, or source to pull from a raw data table, dbt infers a dependency directly from your code. It reads those relationships and constructs a directed acyclic graph, or DAG, without any manual mapping. This graph then powers a deeper capability: column-level lineage. Instead of just showing that a table depends on another table, we can now trace an individual field, like a customer ID, from its original source column all the way to a downstream metric. A feature called the column evolution lens adds another layer of context. It automatically distinguishes between three operations. A passthrough means the column flows through unchanged. A rename tracks a clear label update without altering the data. A transformation flags actual logic changes, such as a calculation or aggregation. Finally, every dbt run generates rich metadata artifacts, primarily the manifest and catalog JSON files. These act as the blueprint, allowing external data catalogs and governance tools to ingest the lineage and integrate it into a broader observability strategy. Now that we've seen how lineage is automatically traced, let's move to the final step: Outputs, or how those metrics actually reach decision-makers.
 docs.getdbt.commedium.comgetdbt.com+22 min
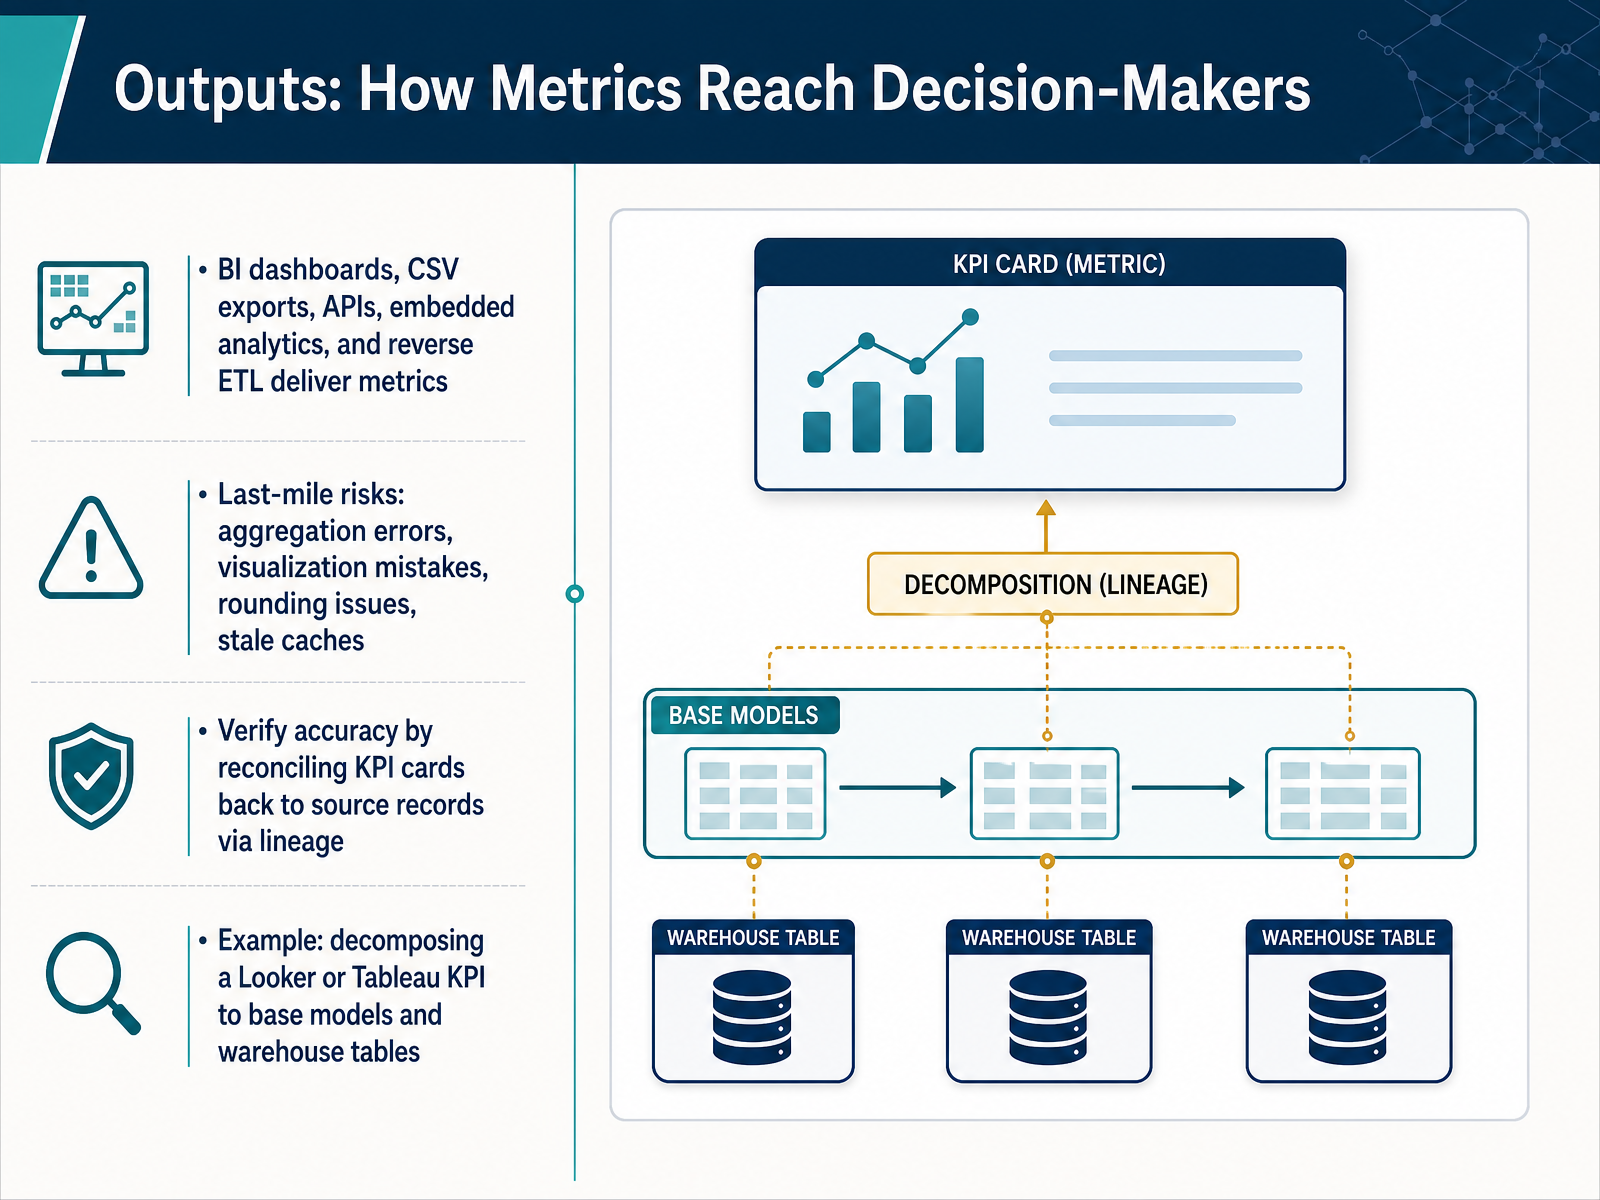
 - 07Outputs: How Metrics Reach Decision-MakersNow let's look at how metrics actually reach the people who need them. From BI dashboards like Looker and Tableau, to CSV exports, APIs, and embedded analytics, these are the last mile. And it's a mile where small mistakes can cause serious business impact. Aggregation errors, stale caches, rounding problems, or a simple visualization misconfiguration can all distort a decision-maker's view. This is why verification is essential. A practical step is to reconcile a KPI card back to its source records through lineage. For example, in Looker or Tableau, you can decompose a single number—like total monthly revenue—down to the base model, the underlying explore, and then all the way to the specific warehouse tables and columns that built it. This direct trace proves the number is accurate, not just a dashboard bug. Next, we will translate this logic into building a conceptual lineage map without specialized tools.
 docs.cloud.google.comgithub.commetaplane.dev+21 min
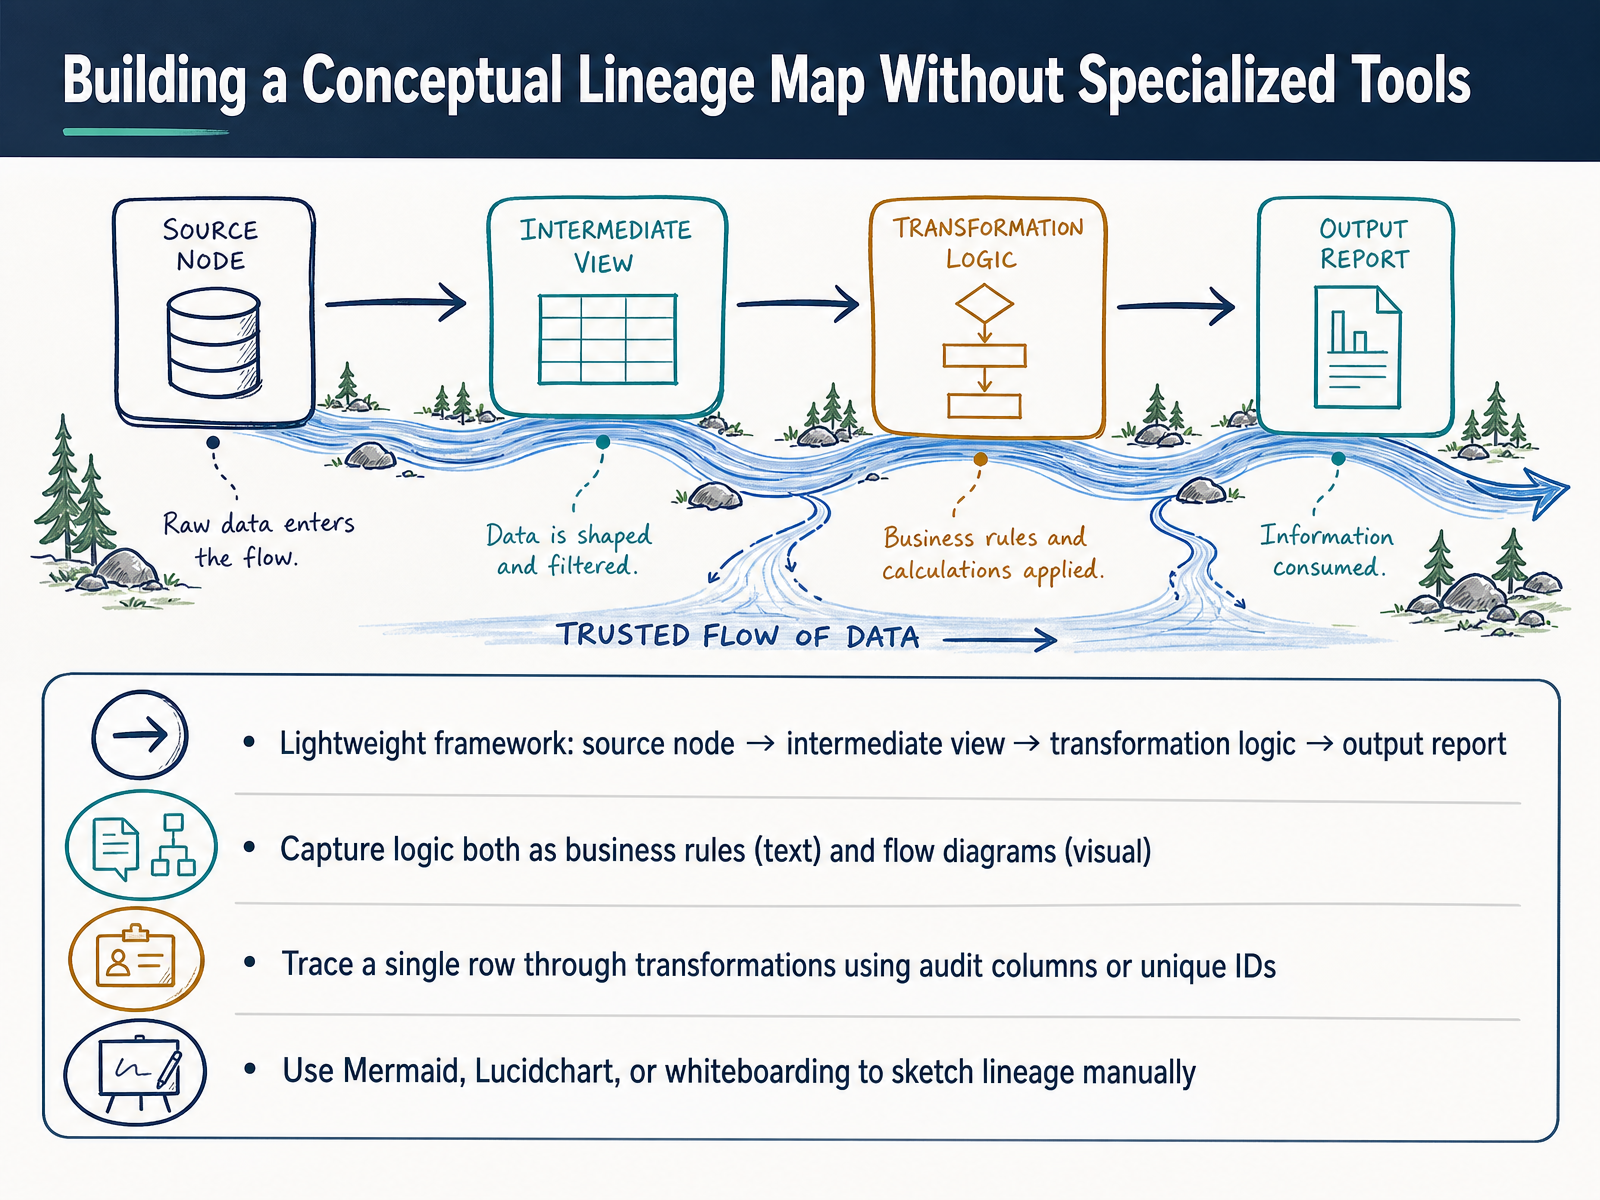
 - 08Building a Conceptual Lineage Map Without Specialized ToolsNow let's talk about building a conceptual lineage map, even when you don't have specialized tools. The core framework is straightforward. You start with a source node, follow the data into an intermediate view, document the transformation logic, and end with the output report. Capture this logic in two forms. First, write it as clear business rules. Second, sketch it as a visual flow diagram. To trace a single row through your pipeline, rely on audit columns or unique identifiers. These fields let you follow one record from source to final output. For the visual side, you can use tools like Mermaid, Lucidchart, or even a simple whiteboard. The goal is to manually sketch the journey so your team can see exactly how data moves and changes. This lightweight approach builds shared understanding and trust before you invest in automated tooling. Next, we'll explore automated lineage tools and the modern data stack.
 docs.getdbt.commedium.comgetdbt.com+21 min
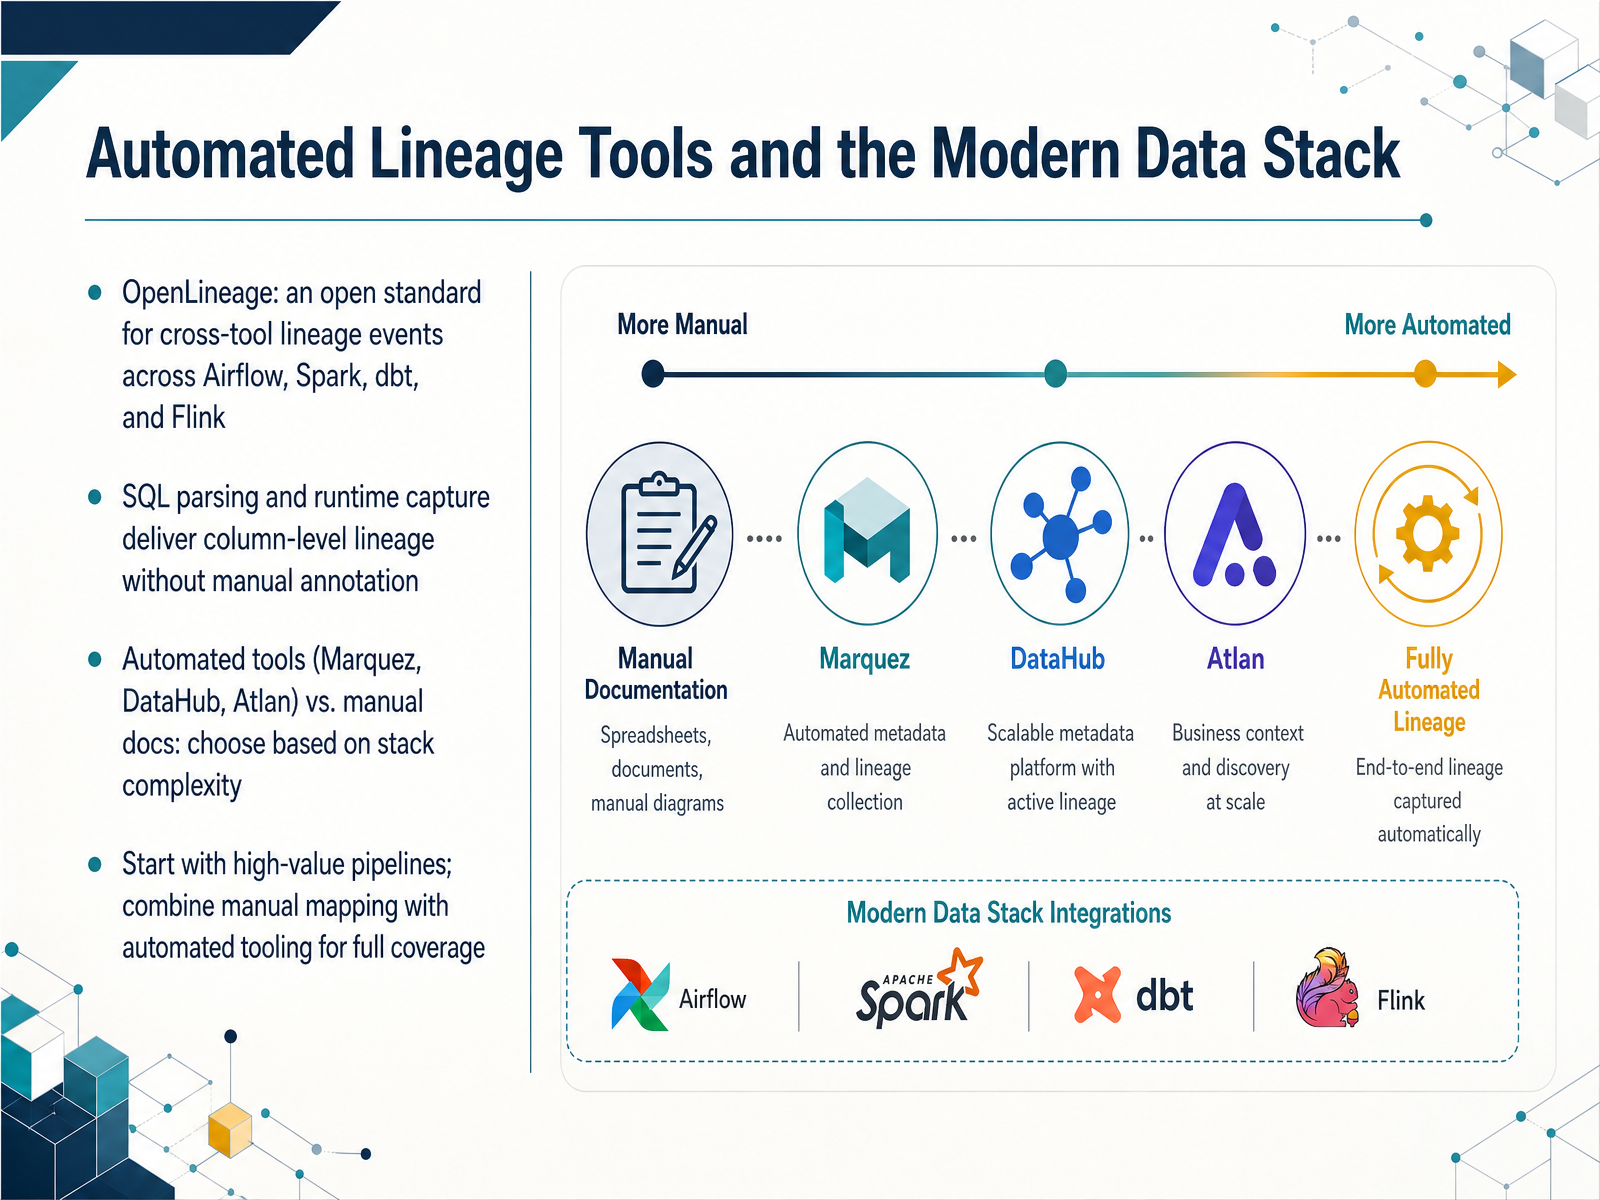
 - 09Automated Lineage Tools and the Modern Data StackNext, let's talk about the tools that make lineage happen automatically, without manual effort. In the modern data stack, we rely heavily on the OpenLineage standard. Think of it as a universal connector that lets tools like Airflow, Spark, dbt, and Flink emit structured lineage events as they run. No custom code needed. The real power here is in automatic, column-level lineage. SQL parsing and runtime capture trace exactly which source column feeds which report metric, without you writing a single annotation. When choosing a dedicated tool like Marquez, DataHub, or Atlan, the complexity of your stack is your guide. A simple stack might be fine with manual documentation. But as pipelines multiply, automated tools become essential. My advice? Start small. Pick one high-value pipeline. Combine automatic captures with a bit of manual mapping to fill the gaps, and then expand. This gets you trustworthy coverage quickly. Let's look now at common pitfalls that break lineage.
 docs.getdbt.commedium.comgetdbt.com+22 min
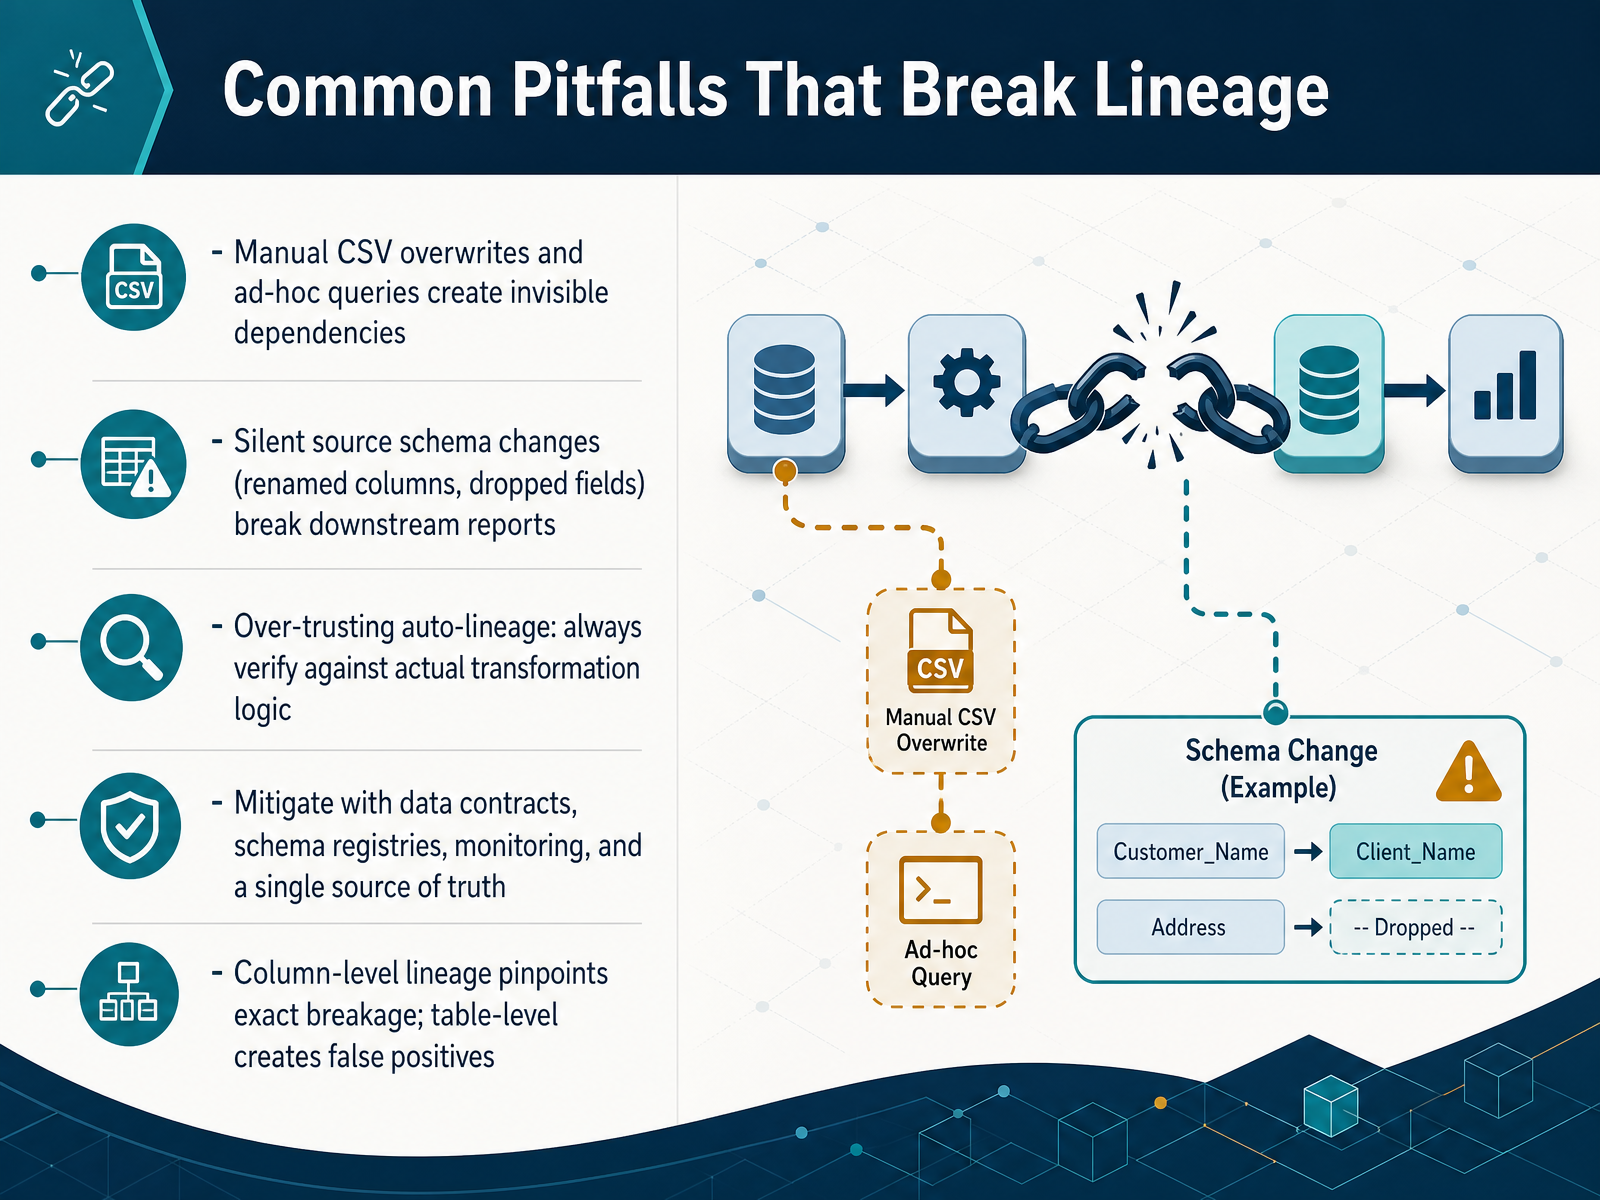
 - 10Common Pitfalls That Break LineageNow, even with solid lineage in place, certain common pitfalls can still break that traceability. Let's walk through the most frequent ones. First, manual CSV overwrites and ad-hoc queries. These create invisible dependencies because they bypass your documented pipelines entirely. Second, silent source schema changes, like a renamed column or a dropped field. These break downstream reports instantly, and you might not notice until a dashboard shows wrong numbers. Third, over-trusting auto-lineage. Automated tools are powerful, but you must still verify the output against your actual transformation logic. To mitigate these risks, adopt data contracts, schema registries, continuous monitoring, and maintain a single source of truth. Finally, remember the precision of column-level lineage. It pinpoints the exact breakage, whereas table-level lineage often creates false positives, flagging many unaffected assets. Up next, we will apply all these concepts in an end-to-end walkthrough, tracing Gross Merchandise Value, or GMV.
 datacrossroads.nlcdn.builtin.comuplatz.com+22 min
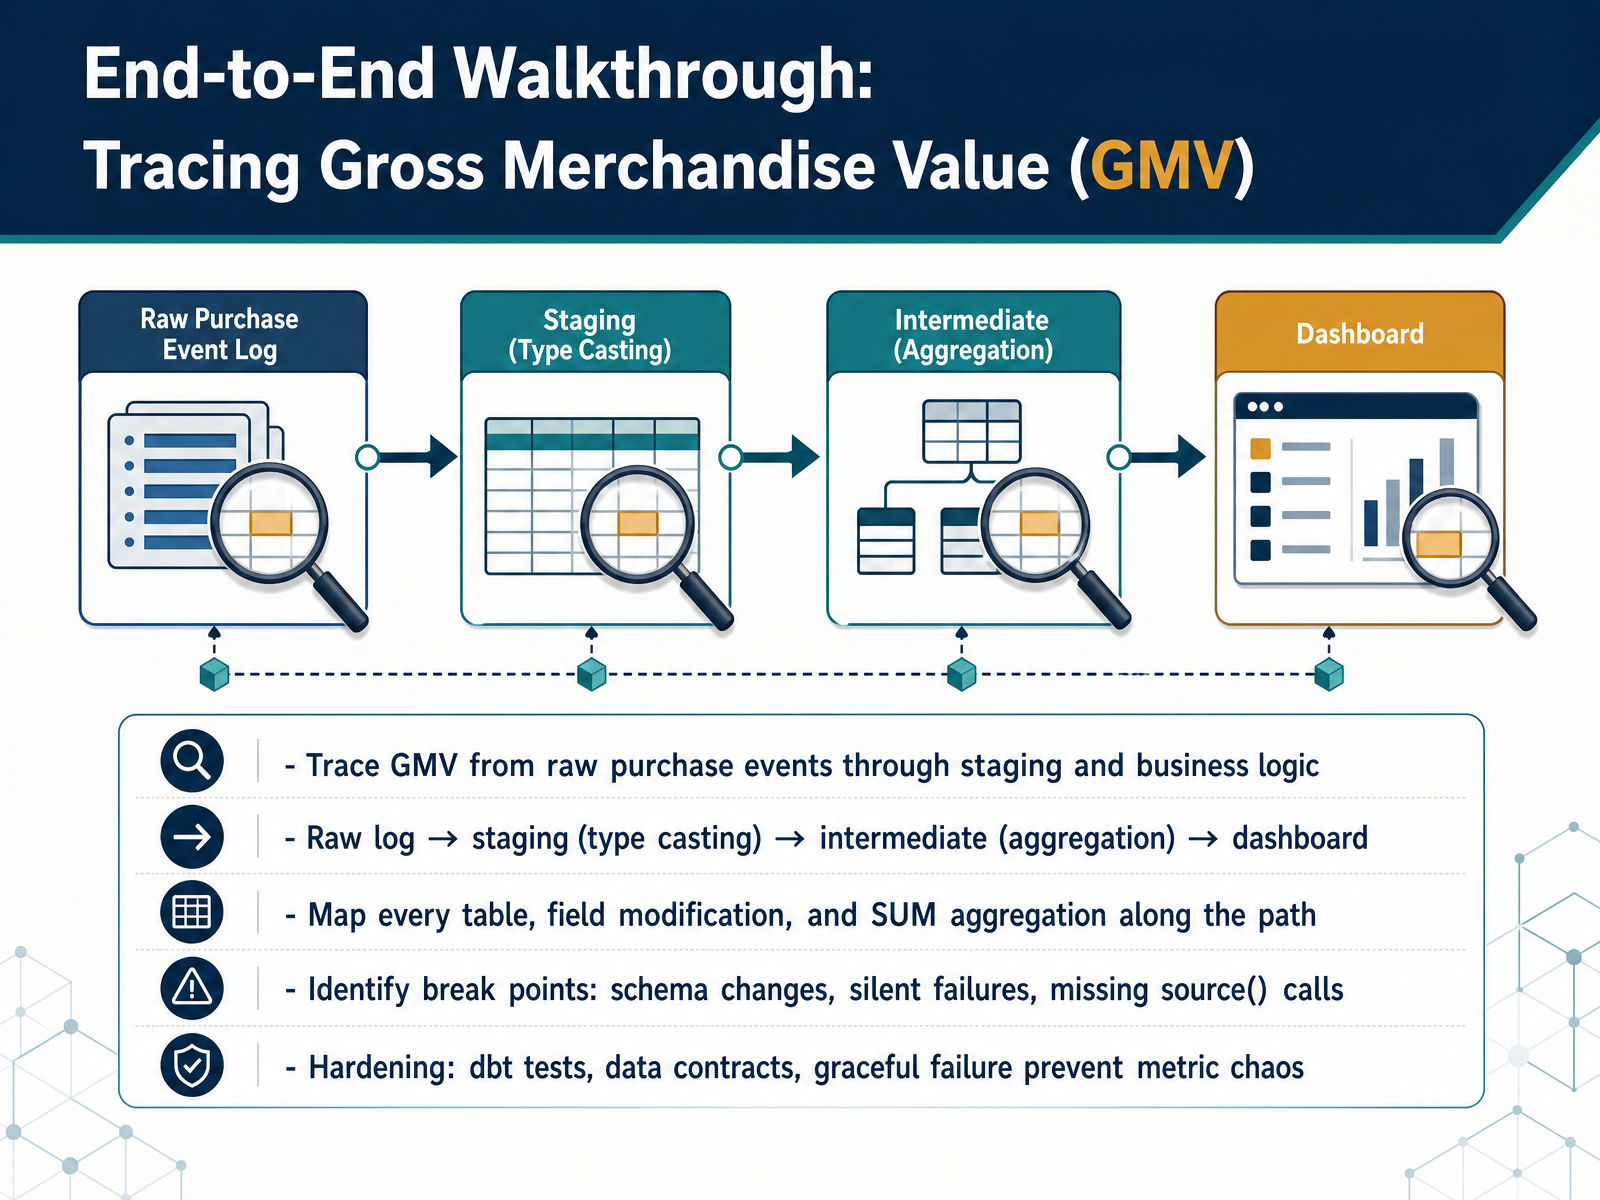
 - 11End-to-End Walkthrough: Tracing Gross Merchandise Value (GMV)Now, let's walk through a complete end-to-end example by tracing Gross Merchandise Value, or GMV. Imagine a raw clickstream log recording every purchase event. First, it lands in a staging table where data types are cast, and simple filters are applied. Next, an intermediate aggregation model sums up the purchase amounts by day and by product category. Finally, this aggregated metric travels into the business intelligence dashboard. At each hop, you can pinpoint every table, field modification, and the SUM aggregation that produced the final number. Mapping this path also helps you identify break points, such as unexpected schema changes in the raw log, a silent failure in the aggregation step, or a missing source function call in your code. To prevent metric chaos, you harden the pipeline with data tests in dbt, define explicit data contracts between layers, and implement graceful failure handling so one broken stage does not corrupt the entire report. Understanding this complete journey turns a black box metric into a traceable, trustworthy asset.
 docs.getdbt.commedium.comgetdbt.com+22 min
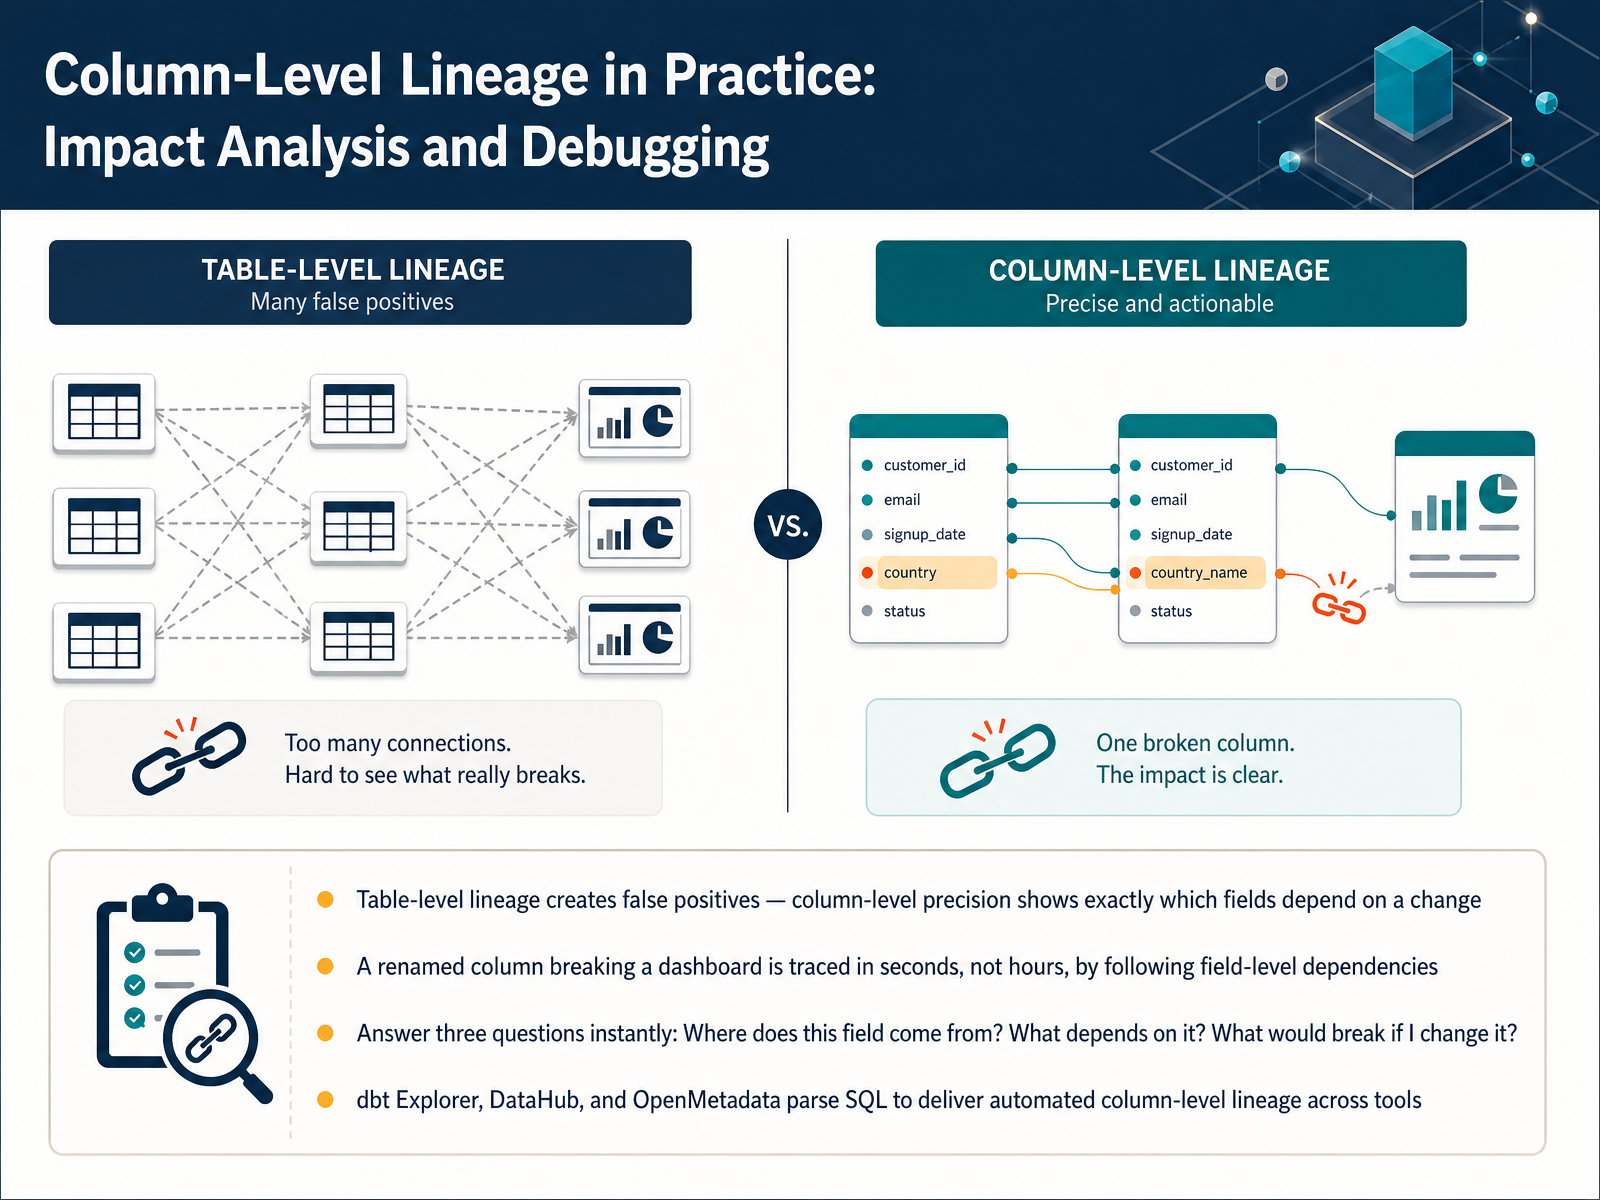
 - 12Column-Level Lineage in Practice: Impact Analysis and DebuggingLet's see how column-level lineage transforms our day-to-day debugging and impact analysis. Table-level lineage tells you that a dashboard depends on four tables, but that creates a lot of false positives. Column-level precision shows exactly which fields depend on the change you are about to make. Imagine you rename a column in a staging table. With table lineage, you see five downstream tables and have to investigate all of them. With column-level lineage, you see immediately that the rename breaks one fact table and the customer-facing dashboard it feeds. You find the problem in seconds, not hours. This precision lets you answer three critical questions instantly. First, where does this field come from? Trace upstream to the exact source columns and transformations. Second, what depends on it? Identify every downstream asset, from models to dashboards. Third, what would break if I change it? See the full blast radius before you deploy. Tools like dbt Explorer, DataHub, and OpenMetadata parse your SQL automatically to deliver this column-level lineage across your entire data stack. They replace guesswork with an operational map you can trust. Next, let's consolidate everything with our final slide: Key Takeaways and Your Action Plan.
 coalesce.iomontecarlo.aiatlan.com+22 min
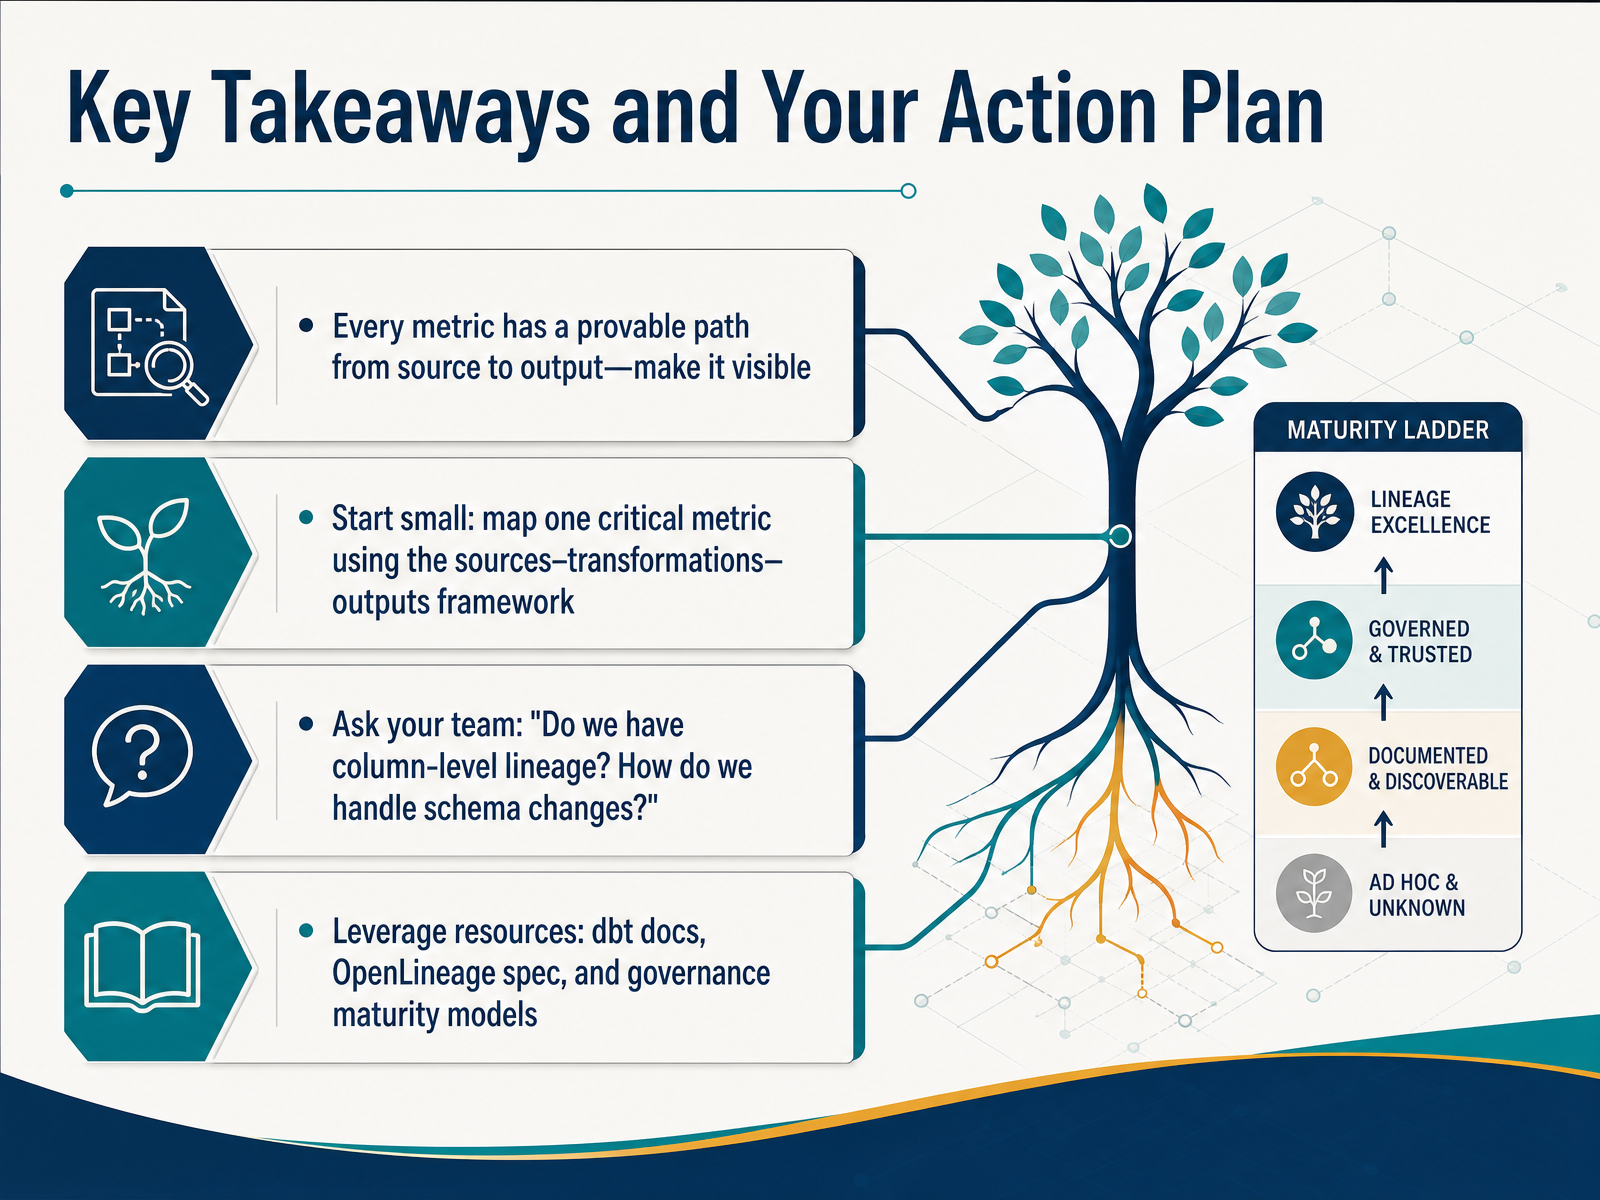
 - 13Key Takeaways and Your Action PlanLet's wrap up with your action plan. First, remember the core principle: every metric has a provable path from source to output. Your job is to make that path visible. Start small. Pick one critical metric and map it using the sources, transformations, and outputs framework we discussed. Next, drive the conversation with your team. Ask direct questions like, 'Do we have column-level lineage? And how do we handle schema changes?' These questions turn theory into practice. Finally, leverage the resources available to you. Use dbt docs for transformation-level lineage, explore the OpenLineage spec for cross-tool standards, and consult governance maturity models to guide your growth. You now have the tools to trace any metric back to its origin with confidence. Thank you for joining, and I encourage you to go make your data's journey transparent.
 datacrossroads.nlcdn.builtin.comuplatz.com+21 min
Take the deck with you
Download this course as a file — free, no sign-up needed.
- PDF handoutEvery slide page, ready to print or share.14 pages · 3.6 MBDownload
- Narrated PowerPointThe deck that presents itself — every slide carries the digital human's narration video.14 pages · 14.8 MBDownload
- PowerPoint slidesThe full deck as a .pptx — open it in PowerPoint, Keynote, or Google Slides.14 pages · 3.5 MBDownload
Free to use in your own training — please keep the PersonWise credit page at the end.
Have your own deck? Turn it into a course
Sources consulted
Web sources consulted while building this course.
- Track data lineage with Knowledge Catalog | Looker — docs.cloud.google.com
- Add: Looker explore to view Column Lineage · Pull Request #21504 · open-metadata/OpenMetadata — github.com
- Integration update: Looker lineage now includes View and Explore fields — metaplane.dev
- Add the Looker technical lineage capability — productresources.collibra.com
- https://learn.microsoft.com/en-au/purview/register-scan-looker-source — learn.microsoft.com
- Data Lineage: Challenges and Trends 2025. Part 1. Why Data Lineage Matters—And How the Landscape Is Shifting. - Data Crossroads — datacrossroads.nl
- Data Lineage Explained: How It Works and Why It Matters | Built In — cdn.builtin.com
- The Lineage Imperative: A Strategic Report on Data's Lifecycle for Governance, Observability, and Business Value | Uplatz Blog — uplatz.com
- What is Data Lineage? Techniques, Use Cases, & More | Alation — alation.com
- Data Lineage in 2025: Examples, Techniques, and Best Practices | Seemore Data — seemoredata.io
- Computing Dataset Lineage and Field Lineage? | Coalesce — coalesce.io
- Table-Level Vs. Field-Level Data Lineage - Monte Carlo Data — montecarlo.ai
- Column-Level Lineage: What It Is and How To Use It — atlan.com
- What is Data Lineage? Complete Guide for 2025 | Definition, Types, Tools & Best Practices — datadef.io
- Column-Level Lineage: What It Is and How It Works | DataHub — datahub.com
- Column-level lineage | dbt Developer Hub — docs.getdbt.com
- dbt and Data Lineage: End-to-End Visibility for Analytics Engineering (2025) | by Abhishek Kumar Gupta | Tech with Abhishek | Medium — medium.com
- Getting started with data lineage — getdbt.com
- How AI improved data lineage and governance | dbt Labs — getdbt.com
- 🧬 The Evolution of dbt Lineage: What You Need to Know in 2025 — blog.dataengineerthings.org