Employee Onboarding Success Metrics
Begin
14 pages · ~28 min
Employee Onboarding Success Metrics
This training teaches HR professionals and managers to measure and interpret employee onboarding success metrics to improve new hire outcomes.
What you’ll learn
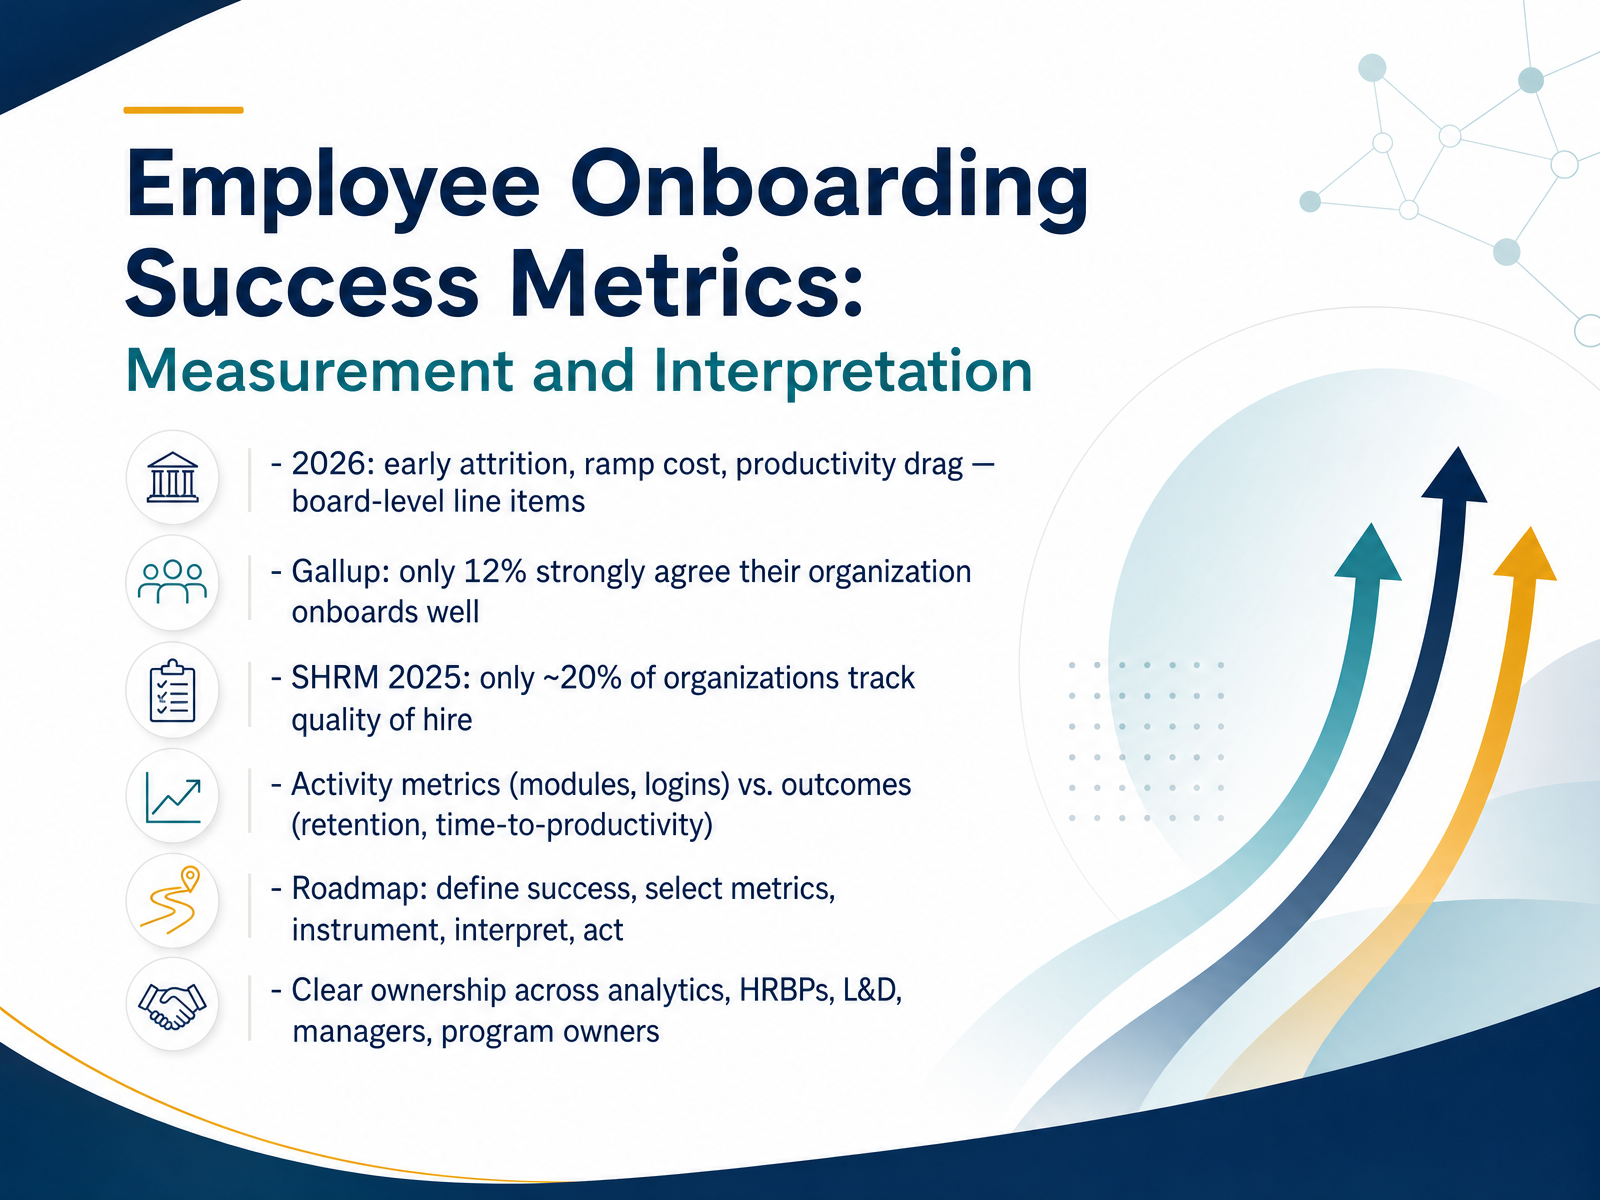
- 01Employee Onboarding Success Metrics: Measurement and InterpretationWelcome. If you own onboarding in any form, this course is for you, whether you sit in people analytics, HR business partnering, learning and development, or you manage a team that hires. Together we will learn how to measure onboarding success and, just as importantly, how to interpret what the numbers actually mean. Start with why this deserves attention. By 2026, early attrition, ramp cost, and productivity drag are board level line items, not just HR housekeeping. And the gap is real. Gallup finds only twelve percent of employees strongly agree their organization onboards well. SHRM's twenty twenty five research shows only about twenty percent of organizations track quality of hire at all. That leaves most of you interpreting outcomes without a clean signal. So we will separate activity metrics, like modules completed or logins, from true outcomes, like retention and time to productivity. Then we will walk a practical roadmap. Define success. Select metrics. Instrument your data. Interpret results. And act on them. We will also sort out ownership across analytics, HR business partners, learning and development, managers, and program owners, because shared metrics without clear ownership rarely move. By the end, you should be able to explain your onboarding results to managers and executives with confidence, including the trade offs and the limits of your data. Let's get oriented with the course map and how to use this deck.2 min
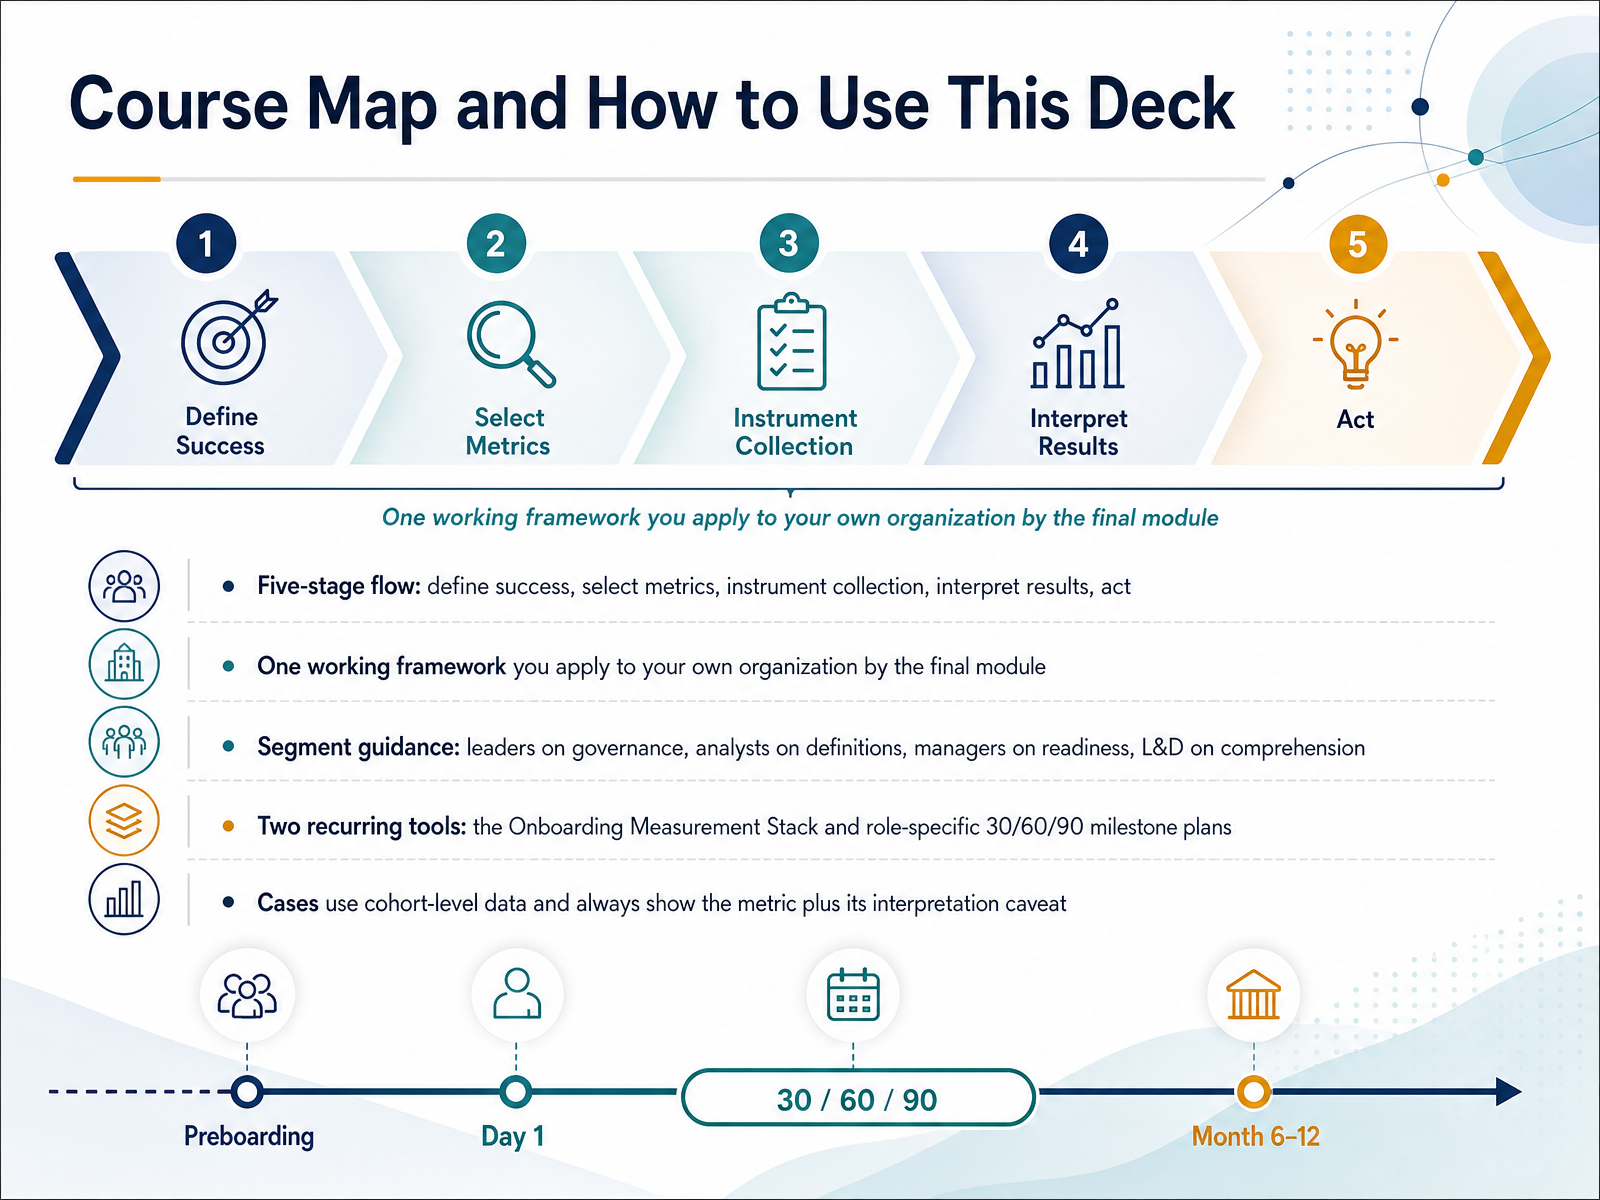
- 02Course Map and How to Use This DeckNow, let's get oriented with the course map. This deck follows a five-stage flow. First, define success. Then select metrics. Then instrument collection. After that, interpret results. And finally, act on what you learned. You are not just collecting concepts here. You build one working framework that you apply to your own organization by the final module. The guidance is segmented by role. Leaders focus on governance. Analysts focus on definitions. Managers focus on readiness. And L and D teams focus on comprehension. Two tools recur throughout. The Onboarding Measurement Stack, and role-specific thirty sixty ninety milestone plans. Our cases use cohort-level data, and each one always shows the metric alongside its interpretation caveat, so you learn where a number can mislead you. Next, we move into defining onboarding success across stakeholders.
 1 min
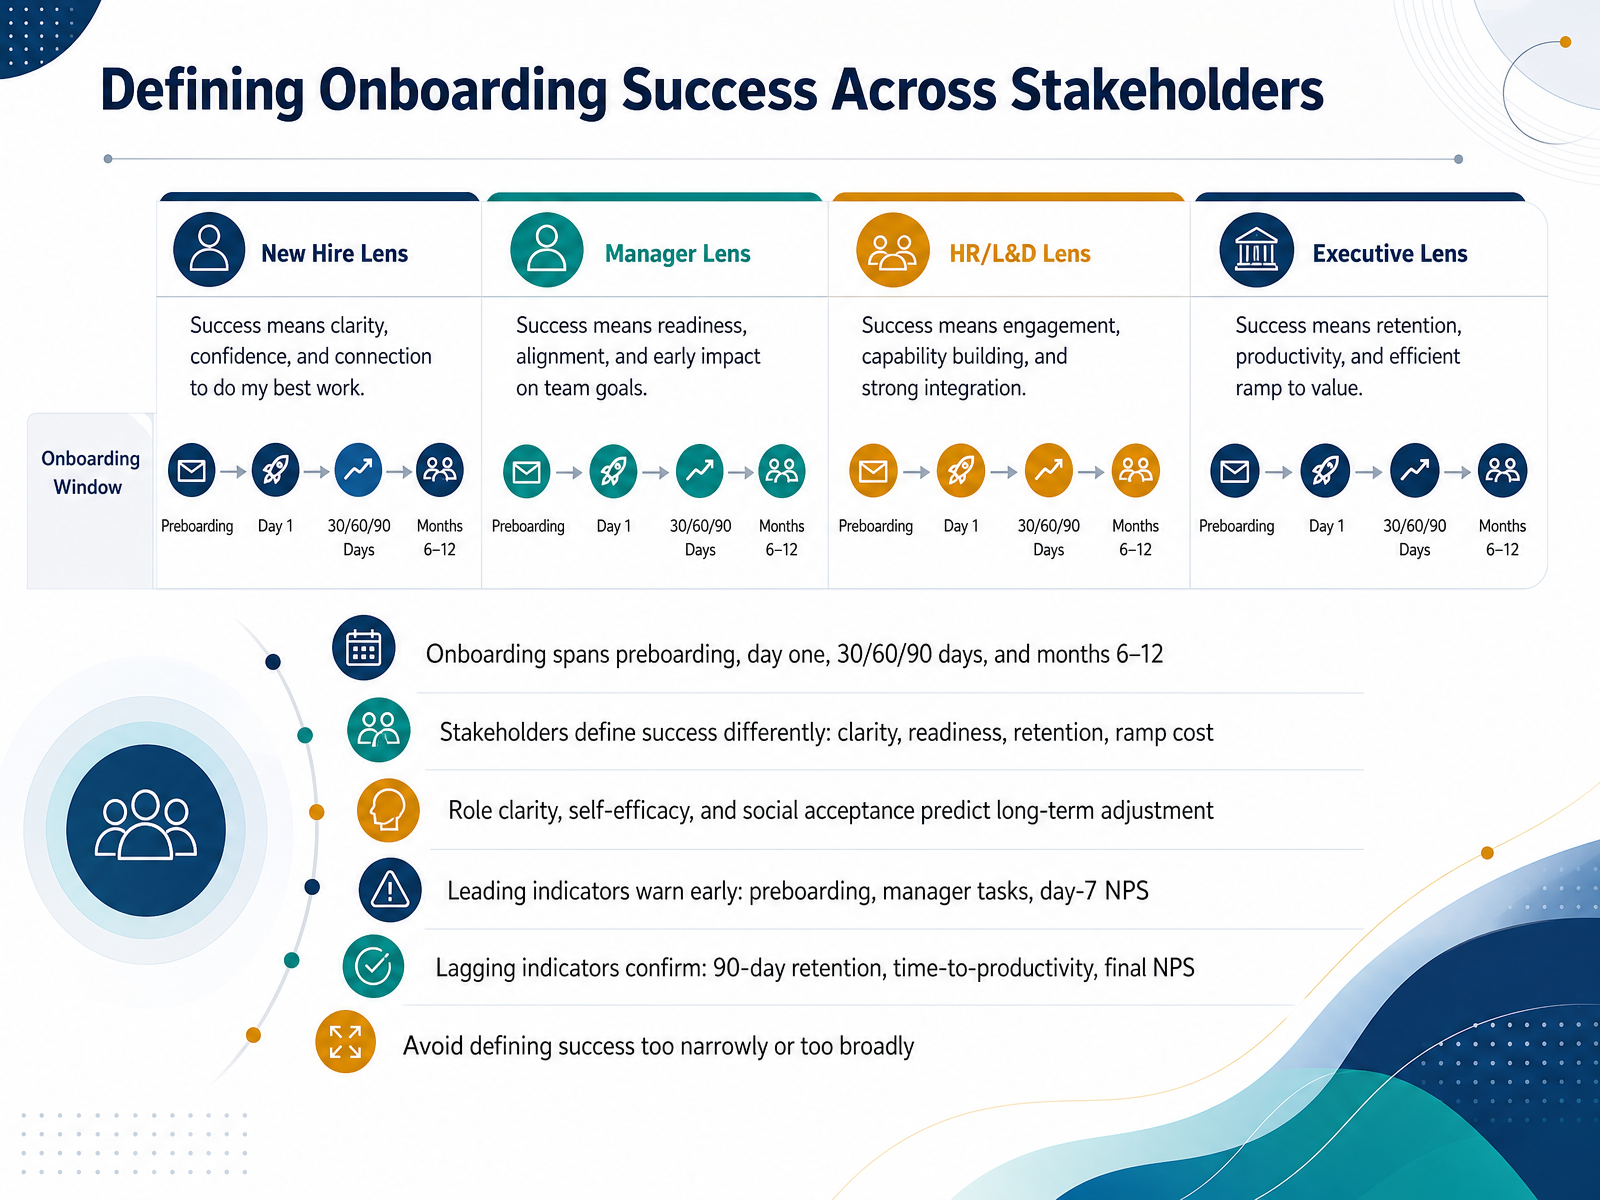
1 min - 03Defining Onboarding Success Across StakeholdersNow let's define what onboarding success actually means. Onboarding spans preboarding, day one, the thirty, sixty, and ninety day marks, and continues through months six to twelve. Your stakeholders often define success differently: new hires want clarity, managers want readiness, executives want retention, and finance watches ramp cost. Your job is to align those definitions before you measure anything. Research shows three predictors of long-term adjustment: role clarity, self-efficacy, and social acceptance. Leading indicators warn you early, such as preboarding completion, manager task completion, and day-seven NPS. Lagging indicators confirm outcomes, including ninety-day retention, time-to-productivity, and final NPS. Avoid defining success too narrowly, which hides context, or too broadly, which dilutes accountability. Pick a balanced set tied to stakeholders. Next, let's look at measurement framework design with a balanced metric set.
 1 min
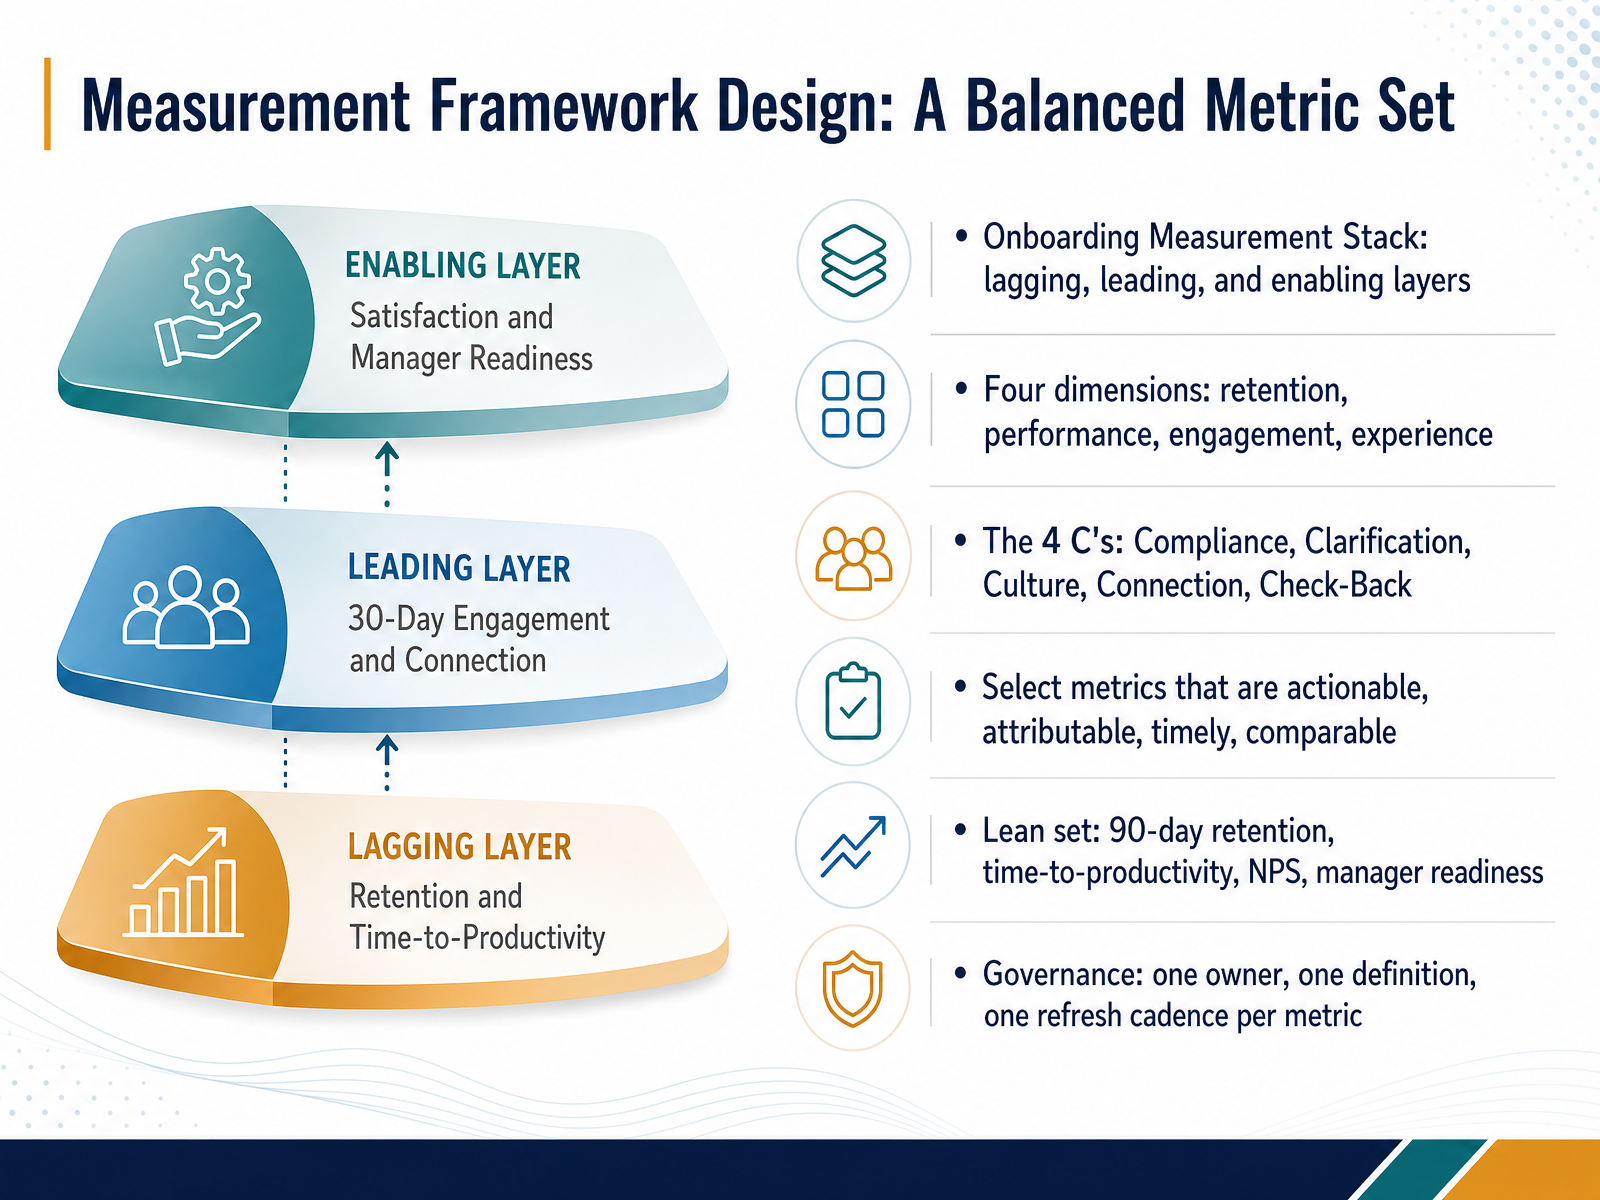
1 min - 04Measurement Framework Design: A Balanced Metric SetNow let's build your measurement framework. Think of a three-layer stack: lagging metrics like ninety-day retention tell you what happened. Leading metrics like time-to-productivity predict what's coming. Enabling metrics like manager readiness tell you whether the conditions are in place. Cover four dimensions: retention, performance, engagement, and experience. The five C's give you another lens: Compliance, Clarification, Culture, Connection, and Check-Back. For each metric, test four things. Is it actionable, meaning a manager can respond to it. Is it attributable, meaning onboarding plausibly influenced it. Is it timely, meaning you see results before the damage compounds. And is it comparable, meaning you can benchmark across cohorts and roles. A lean set works well: ninety-day retention, time-to-productivity, new-hire net promoter score, and manager readiness. Resist the urge to measure everything. Then set governance: one owner, one definition, and one refresh cadence per metric. That discipline is what makes your numbers credible with executives. Next, we'll look at core metrics and operational definitions.
 2 min
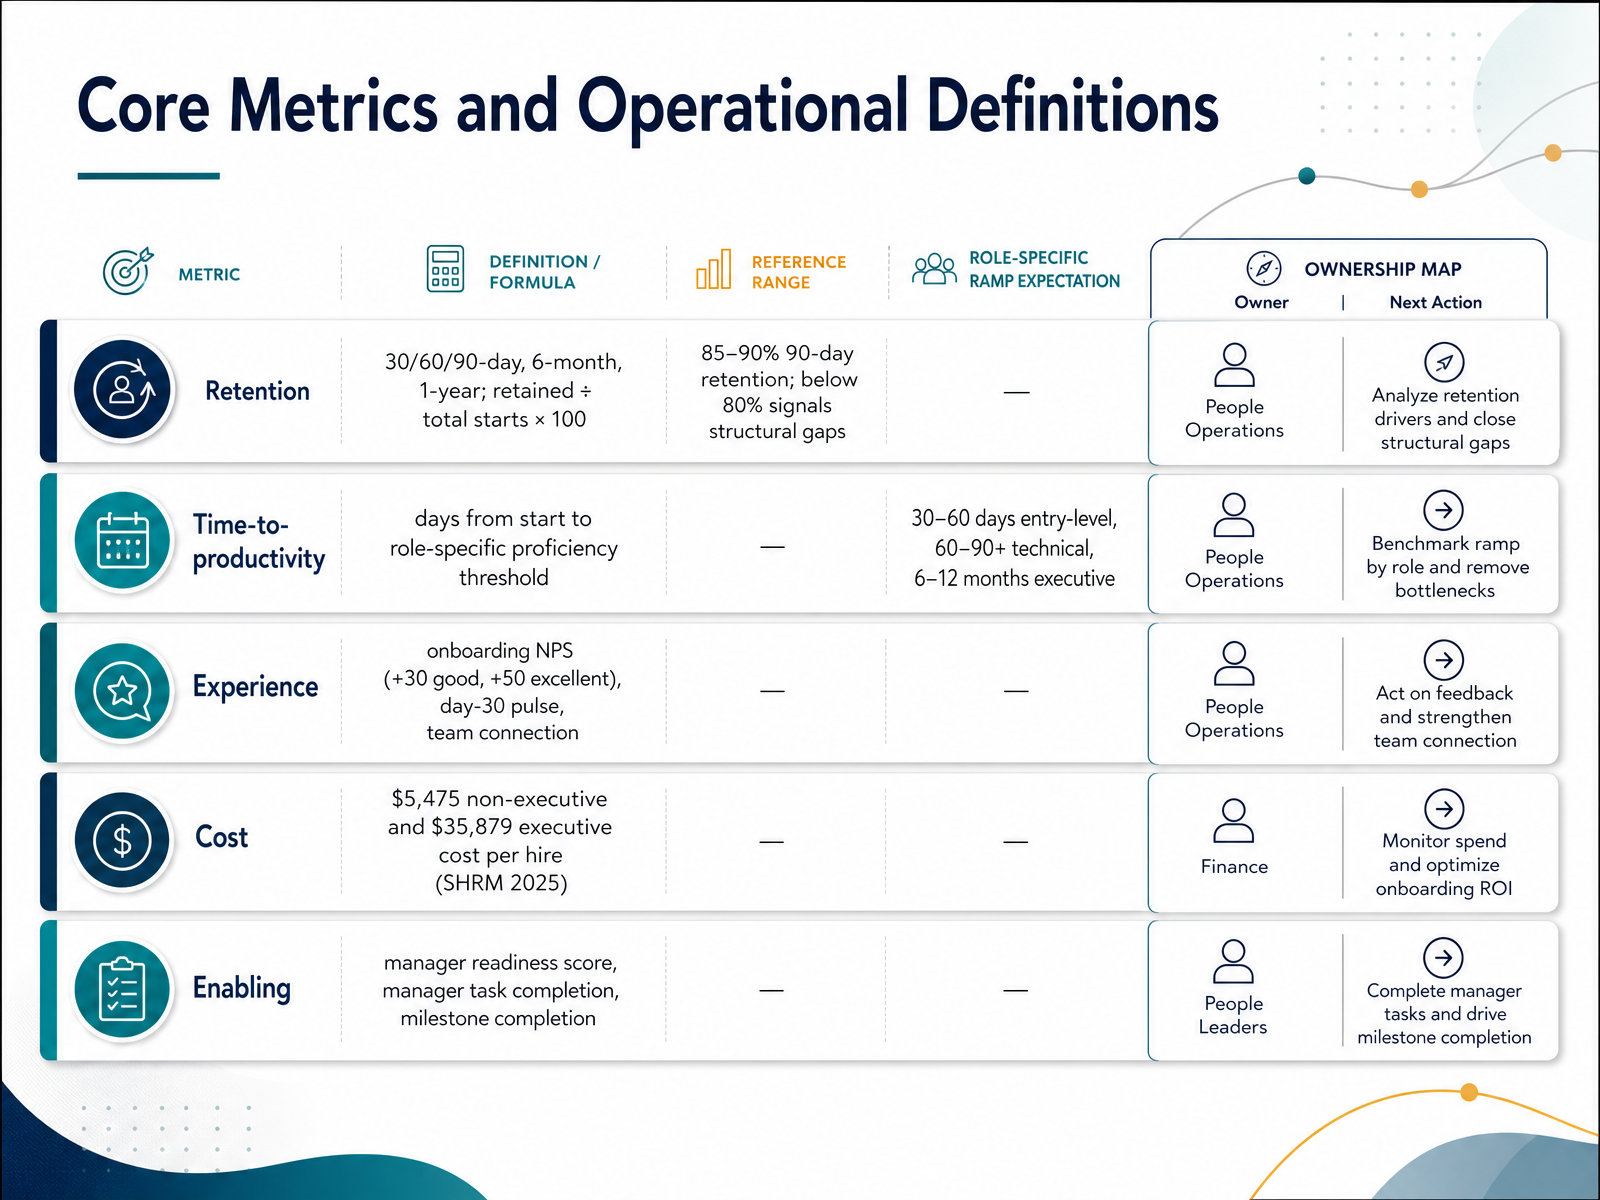
2 min - 05Core Metrics and Operational DefinitionsLet's look at the core metrics and the operational definitions that make them comparable. Retention is the anchor. Measure it at thirty, sixty, and ninety days, then at six months and one year, using retained employees divided by total starts times one hundred. A common reference range is eighty-five to ninety percent ninety-day retention. Below eighty percent usually signals structural gaps in hiring or onboarding, not individual performance. Time-to-productivity is the number of days from start to a role-specific proficiency threshold. That ramp differs by role: thirty to sixty days for entry-level, sixty to ninety or more for technical roles, and six to twelve months for executives. Experience metrics include onboarding Net Promoter Score, where plus thirty is good and plus fifty is excellent, a day-thirty pulse, and team connection. Cost matters too, at five thousand four hundred seventy-five dollars per non-executive hire and thirty-five thousand eight hundred seventy-nine dollars per executive hire. Finally, track enabling metrics like manager readiness, manager task completion, and milestone completion. Now let's examine benchmarks that hold up and ones to retire.
 2 min
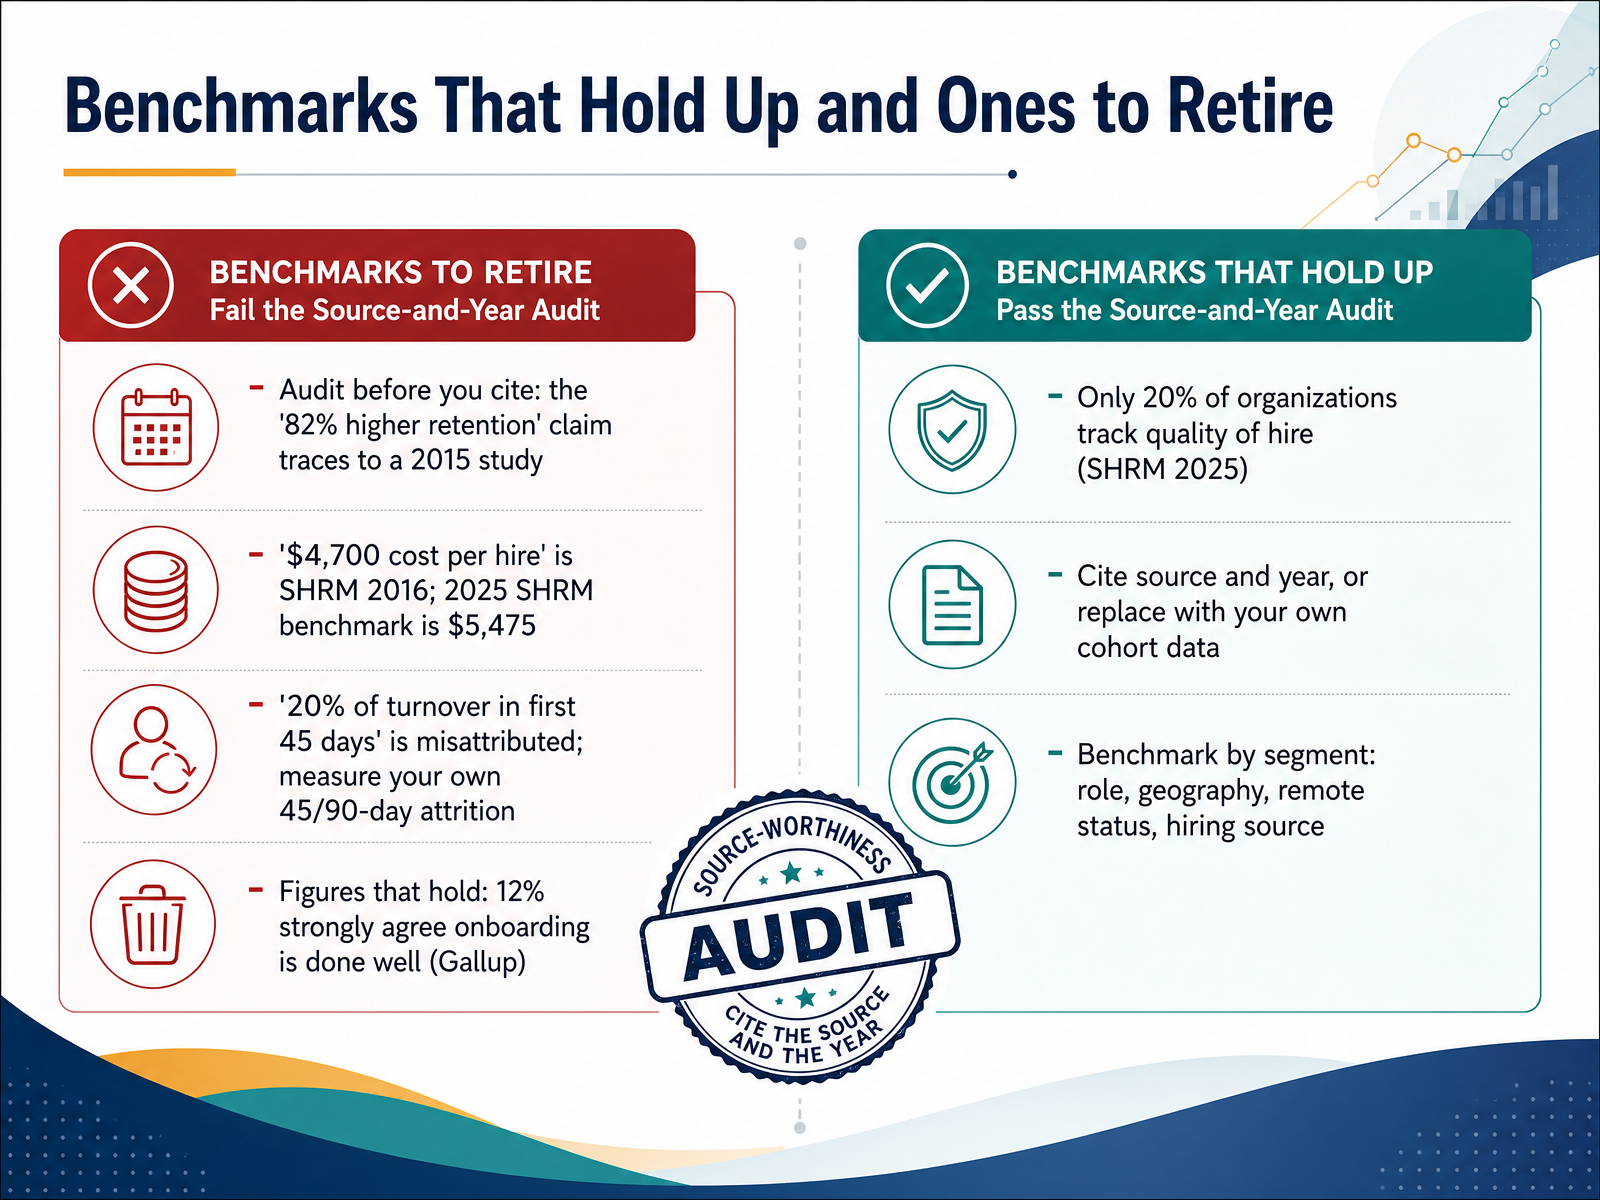
2 min - 06Benchmarks That Hold Up and Ones to RetireSo before you cite any onboarding benchmark, audit it. Many numbers that circulate widely are stale or misattributed. The often-quoted claim that onboarding produces eighty-two percent higher retention traces back to a single study from two thousand fifteen. The four thousand seven hundred dollar cost per hire figure comes from a SHRM report published in two thousand sixteen. The current SHRM benchmark for twenty twenty-five is five thousand four hundred seventy-five dollars. And the claim that twenty percent of turnover happens in the first forty-five days is misattributed, so measure your own forty-five and ninety-day attrition instead.
Some figures do hold up. Gallup finds that only twelve percent of employees strongly agree their onboarding was done well. And in twenty twenty-five, SHRM reported that just twenty percent of organizations track quality of hire at all. That gap is an opportunity, not just a limitation.
So here is your rule. Cite source and year, or replace the number with your own cohort data. Then benchmark by segment: role, geography, remote status, and hiring source, because a single blended number hides the real story.
Next, let us look at data collection and instrumentation.
 2 min
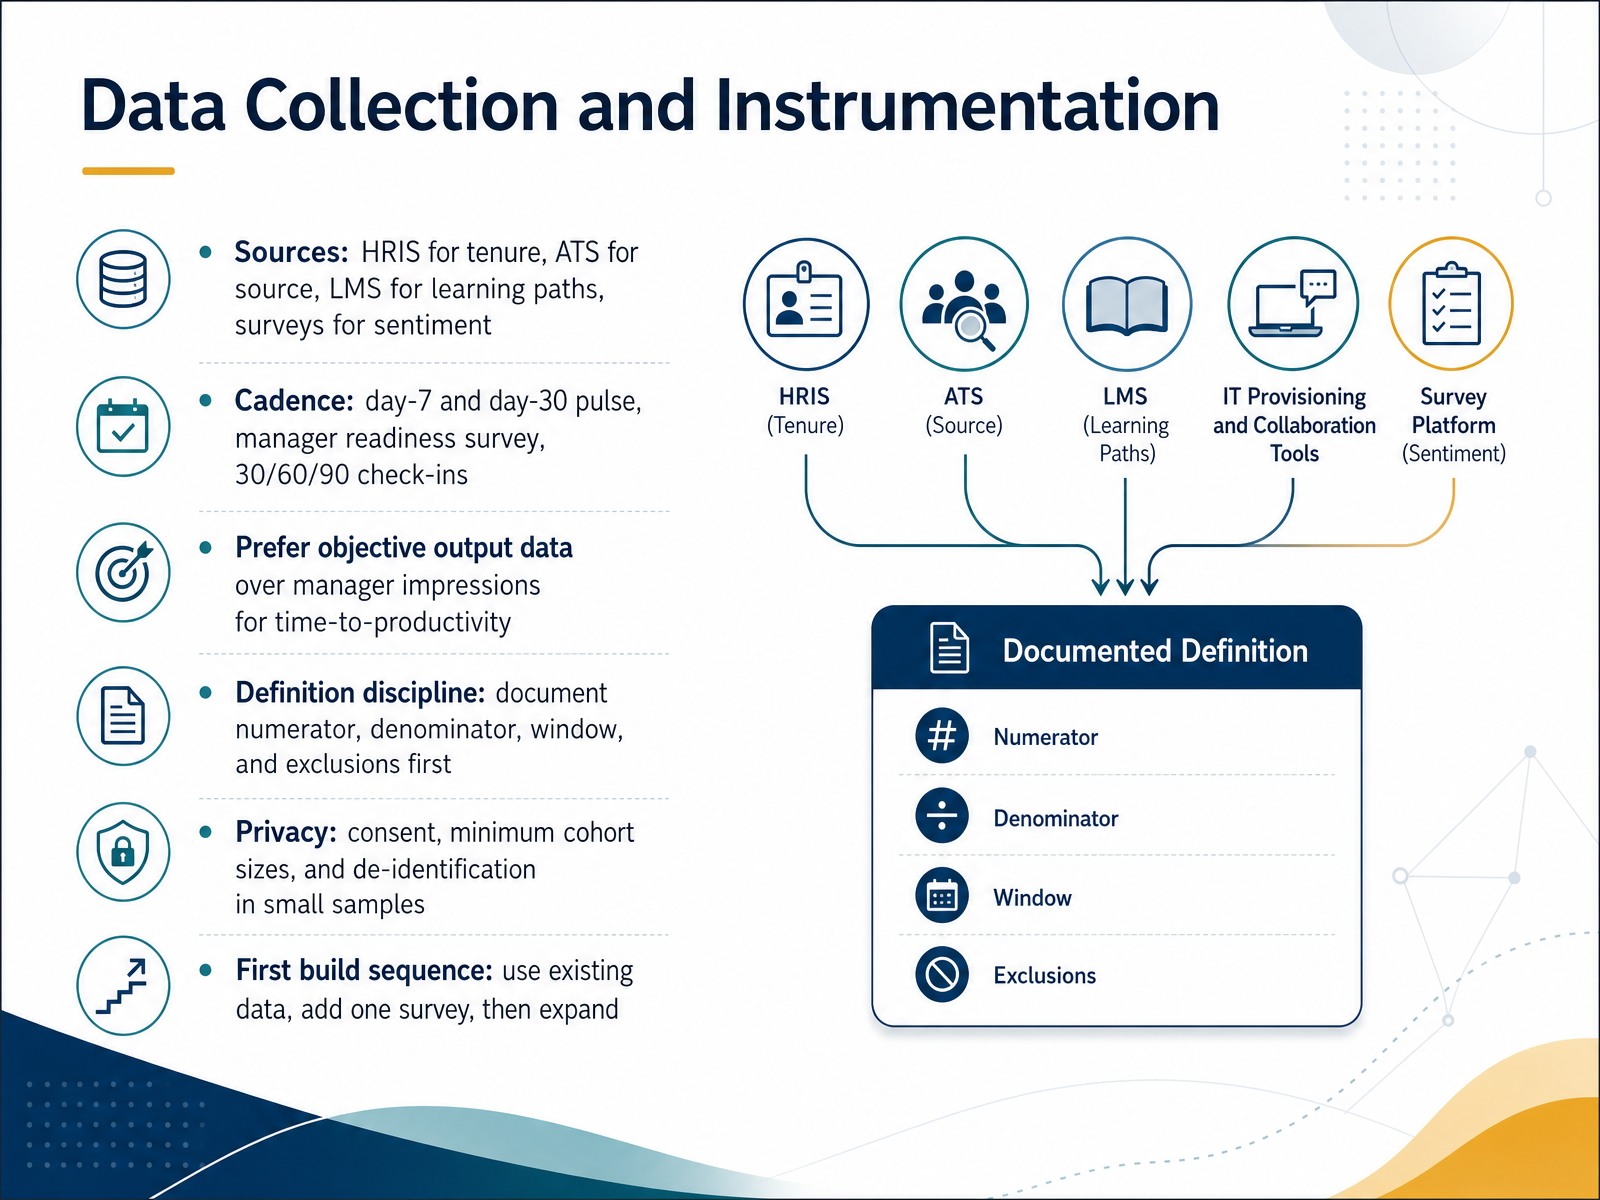
2 min - 07Data Collection and InstrumentationNow let's talk about where your data actually comes from. Four sources do most of the work. Your H R I S gives you tenure. Your A T S gives you source. Your L M S shows learning paths, and surveys capture sentiment. On cadence, a day seven and day thirty pulse plus a manager readiness survey and thirty, sixty, ninety day check-ins will cover the journey. Here's a decision rule. For time to productivity, prefer objective output data over manager impressions. Builders and systems tell you when someone is contributing. Impressions tell you how it felt. You need both, but don't confuse them. Then enforce definition discipline. Document the numerator, denominator, window, and exclusions before you pull a single number. On privacy, get consent, set minimum cohort sizes, and de-identify small samples. When you build, sequence it. Use existing data first, add one survey second, then expand. That gives you defensible numbers early. Next, interpreting results without misleading signals.
 2 min
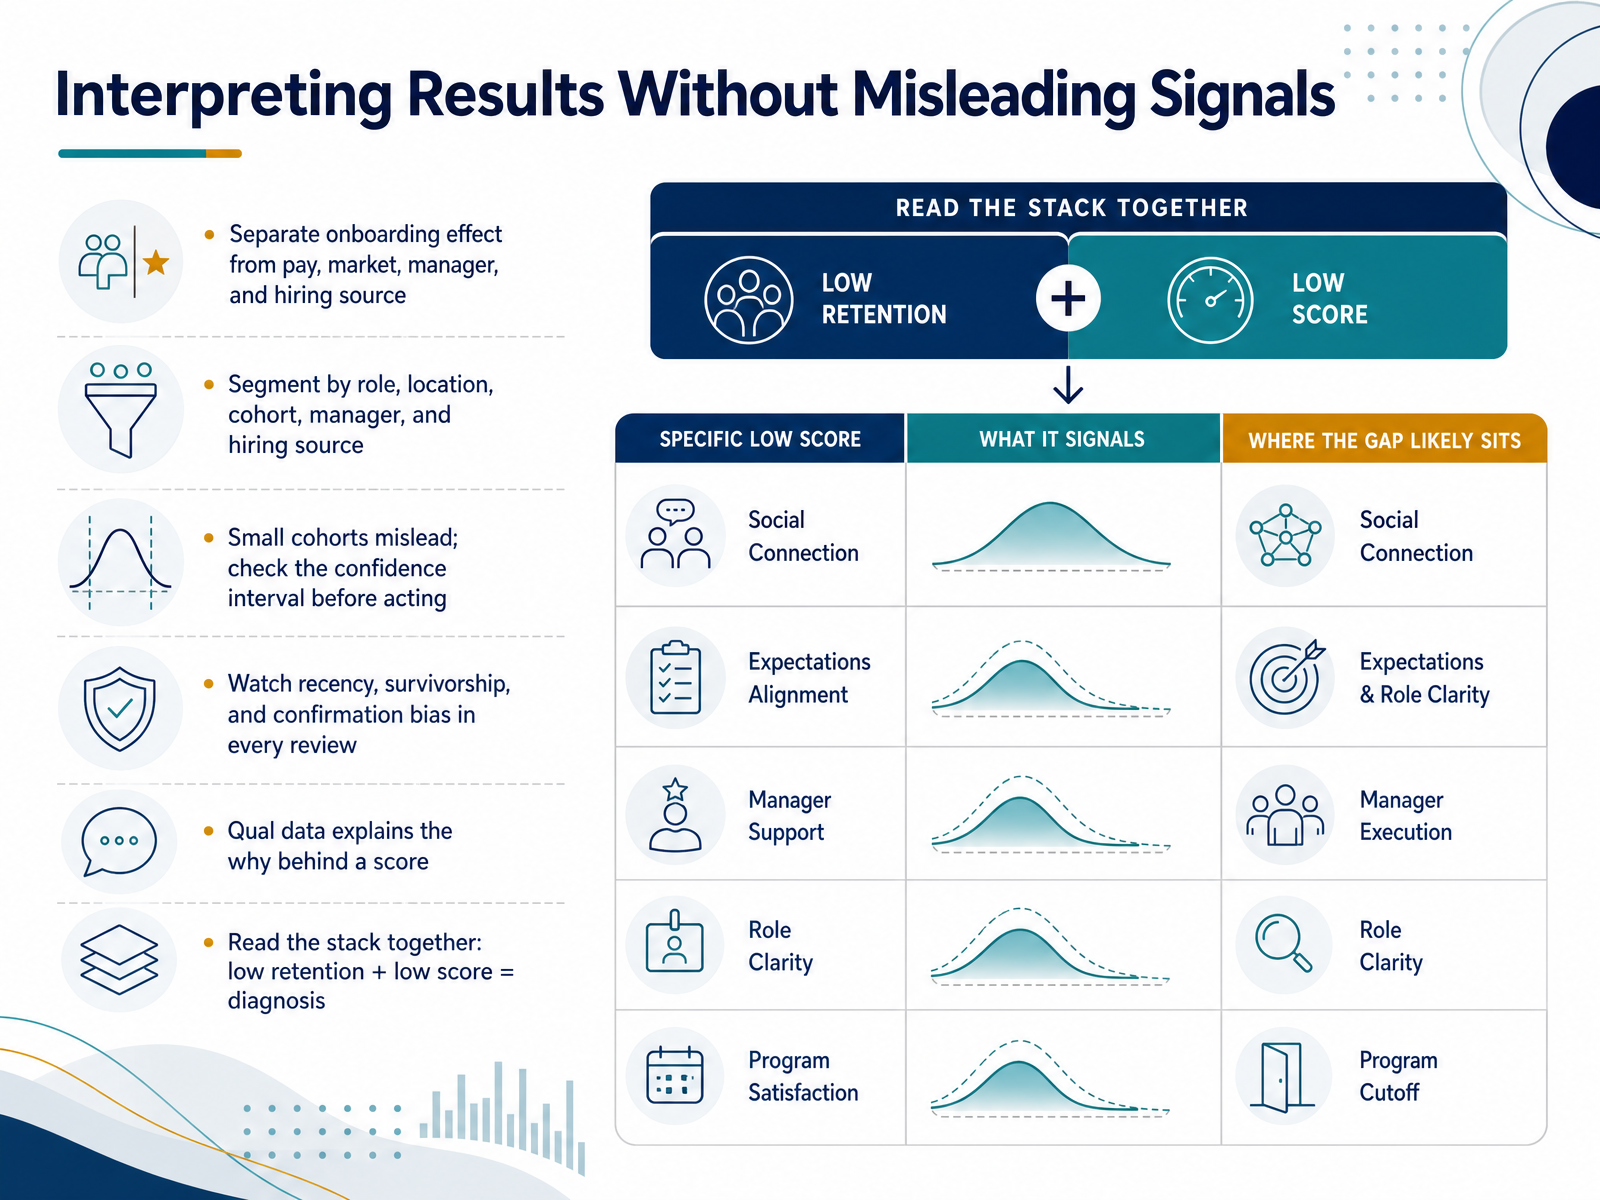
2 min - 08Interpreting Results Without Misleading SignalsNow that you have the numbers, the real work is interpretation. Start by separating the onboarding effect from everything else that drives outcomes, like pay, market conditions, manager quality, and hiring source. If you skip that step, you will give onboarding credit for a problem it did not cause. Next, segment. Look at results by role, location, cohort, manager, and hiring source. Small cohorts mislead, so check the confidence interval before you act. A difference of a few points across twelve hires is usually noise, not a signal. As you review, watch for recency bias, survivorship bias, and confirmation bias. These quietly distort what you conclude, so name them in every readout. Then bring in qualitative data. Survey comments and exit interviews explain the why behind a score, which numbers alone cannot. Finally, read the stack together. Low retention plus a low onboarding score points to a diagnosis, not a coincidence. So interpret in layers, check the confidence interval, and never act on a single metric by itself. That prepares us for the next step, From Metrics to Evidence-Based Interventions.
 2 min
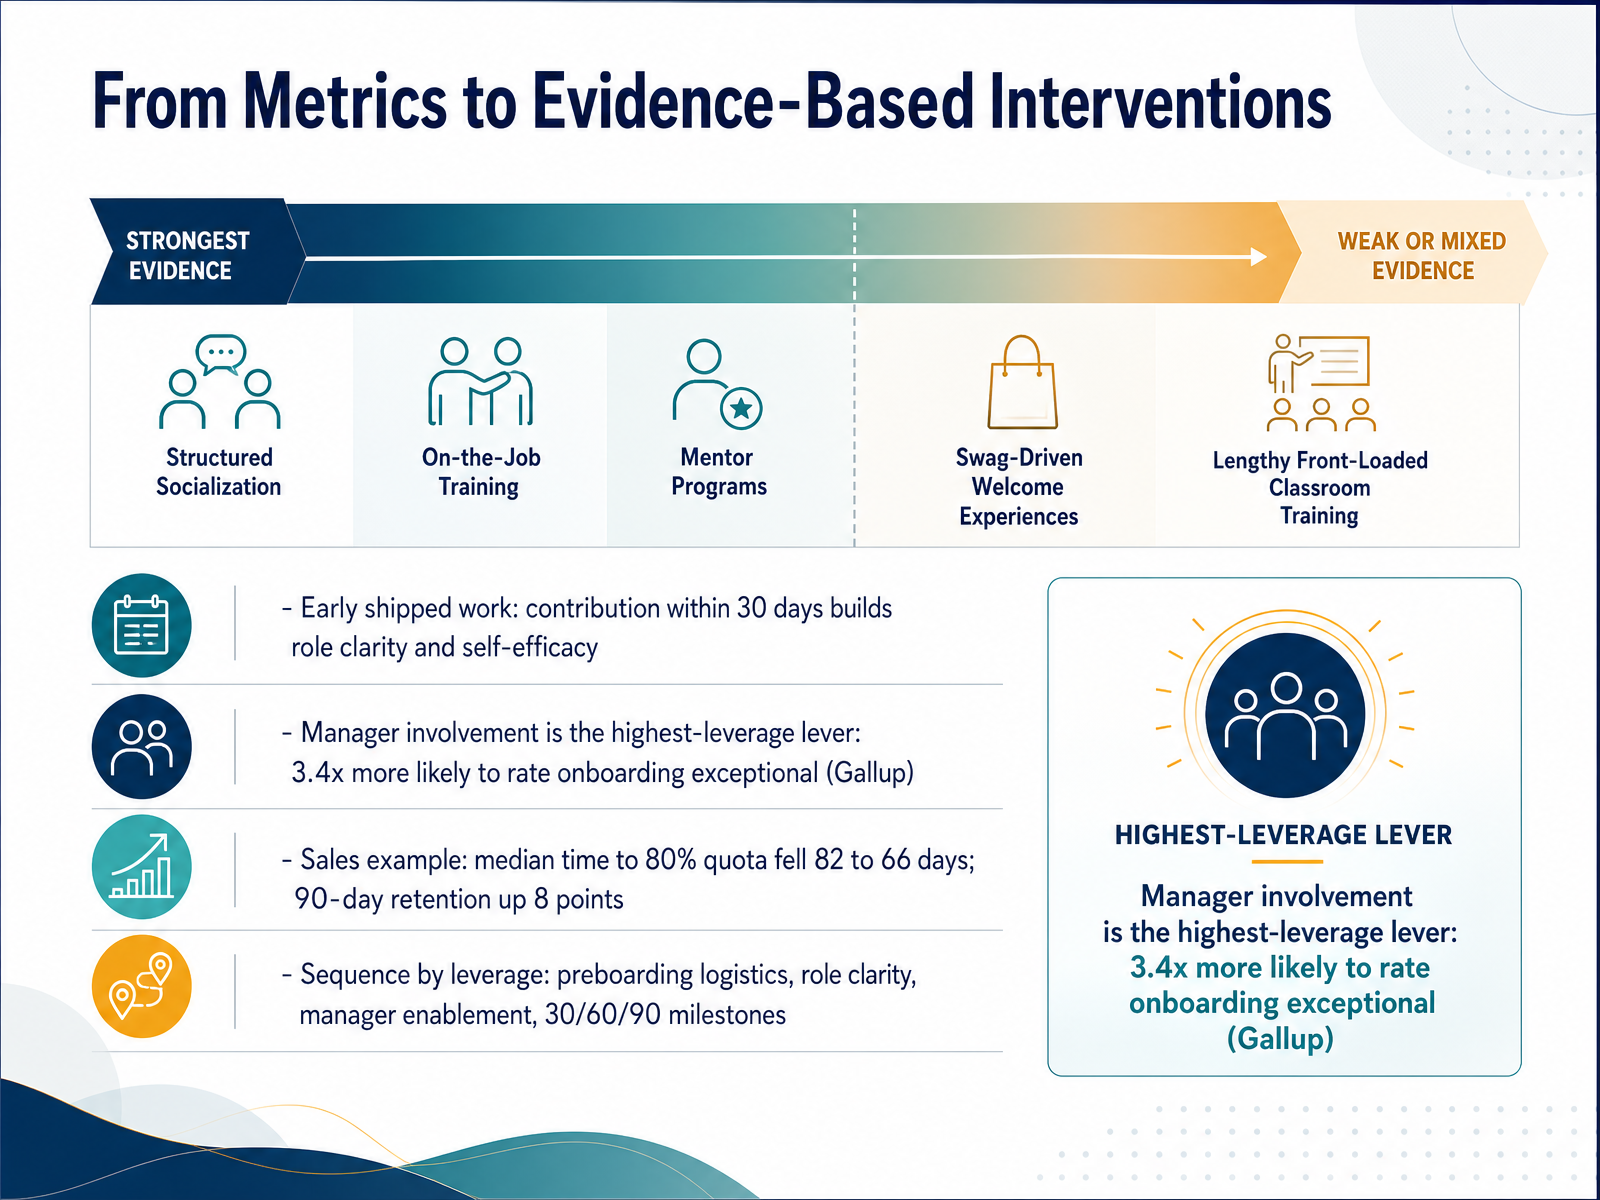
2 min - 09From Metrics to Evidence-Based InterventionsNow let's turn metrics into evidence-based interventions. Not every popular onboarding tactic has strong evidence behind it. The strongest evidence supports structured socialization, on-the-job training, and mentor programs. The weakest or most mixed evidence covers swag-heavy welcome experiences and lengthy front-loaded classroom training. A more reliable lever is early shipped work. When a new hire contributes something real within thirty days, role clarity and self-efficacy rise. Manager involvement matters even more. Gallup found employees are three point four times more likely to rate onboarding exceptional when their manager is deeply involved. In sales, one program cut median time to eighty percent quota from eighty-two days to sixty-six, and ninety-day retention rose eight points. So sequence by leverage: preboarding logistics, role clarity, manager enablement, then thirty, sixty, and ninety-day milestones. Next, we look at common pitfalls: vanity metrics and equity blind spots.
 2 min
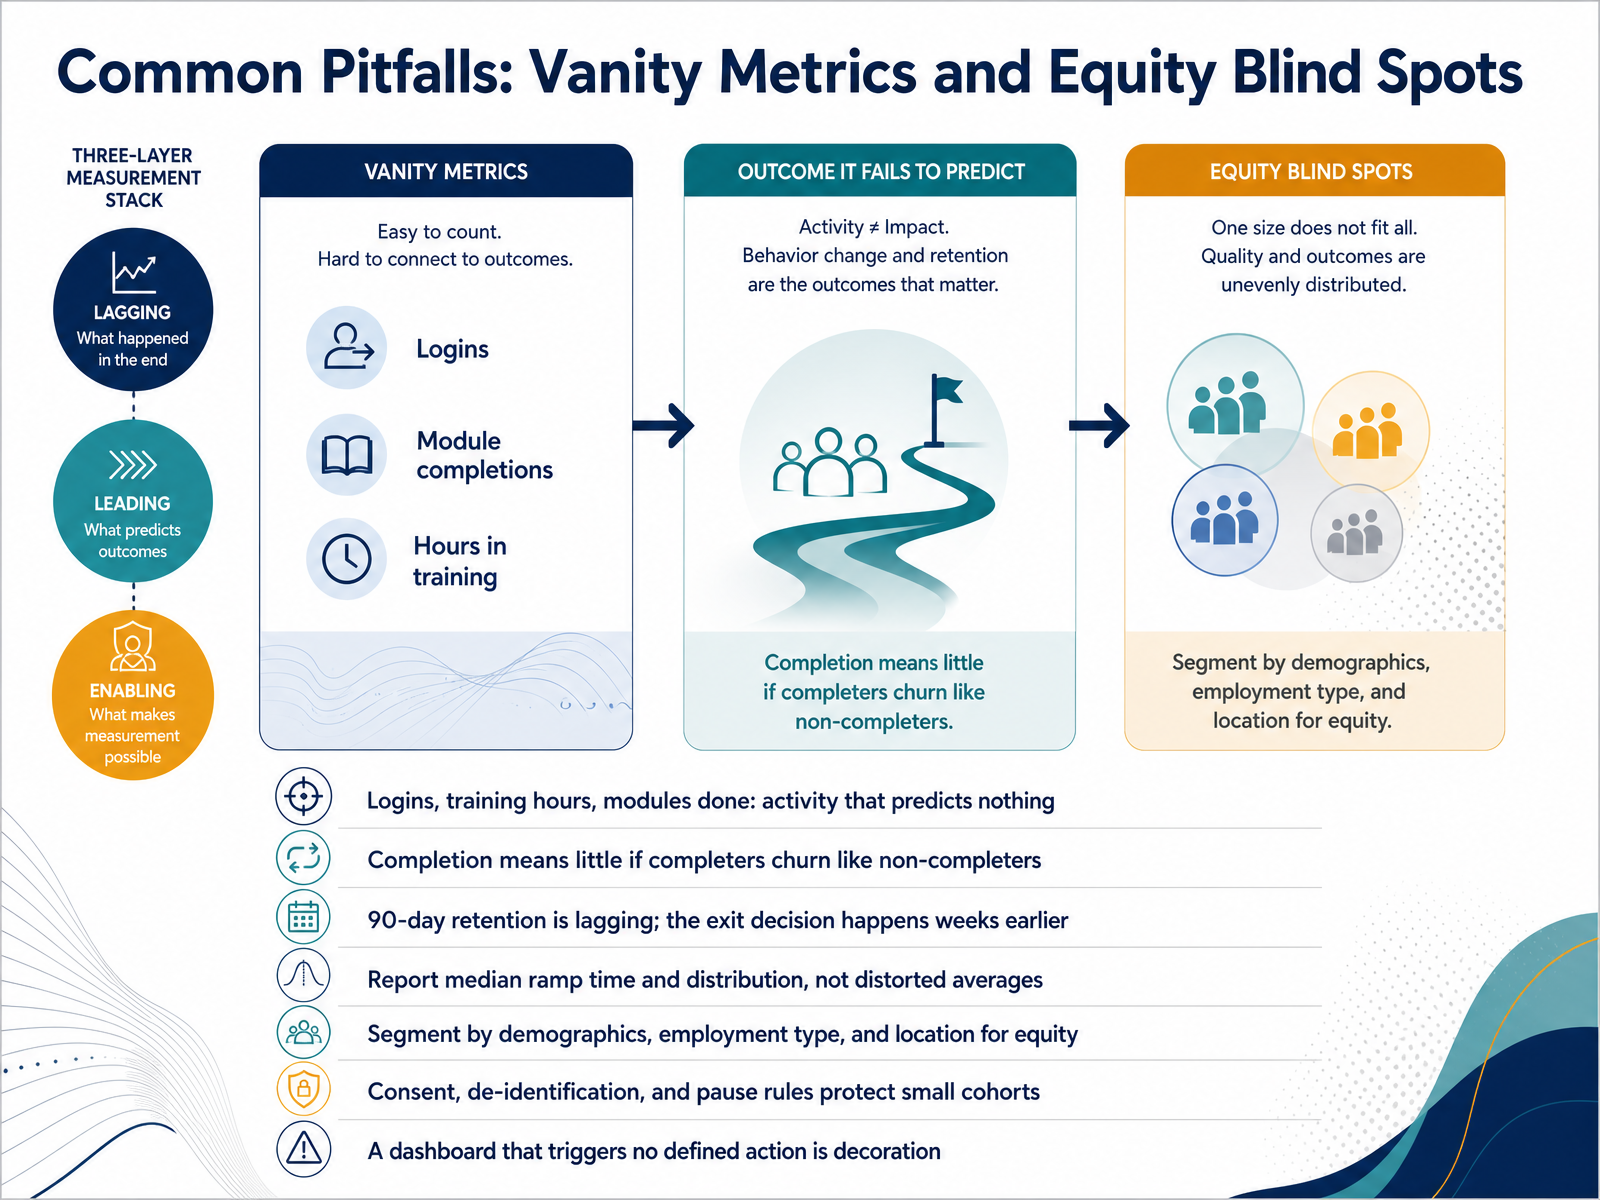
2 min - 10Common Pitfalls: Vanity Metrics and Equity Blind SpotsNow let's talk about common pitfalls. Vanity metrics are the first trap. Logins, training hours, and modules completed measure activity, not outcomes. They predict almost nothing about whether a new hire will perform or stay. Completion rates mean little if completers churn at the same rate as non-completers. And ninety-day retention is a lagging indicator. The real exit decision usually happens weeks earlier, often in the first manager one-on-ones. So what should you report? Median ramp time and the distribution around it, not a distorted average. One slow team can skew the mean and hide a systemic problem. Then segment everything by demographics, employment type, and location to surface equity blind spots. Protect small cohorts with consent, de-identification, and pause rules; without them, you risk re-identifying individuals. Finally, remember that a dashboard which triggers no defined action is just decoration. Every metric needs an owner and a decision it informs. In the next section, we'll cover building a measurement practice and operating cadence.
 1 min
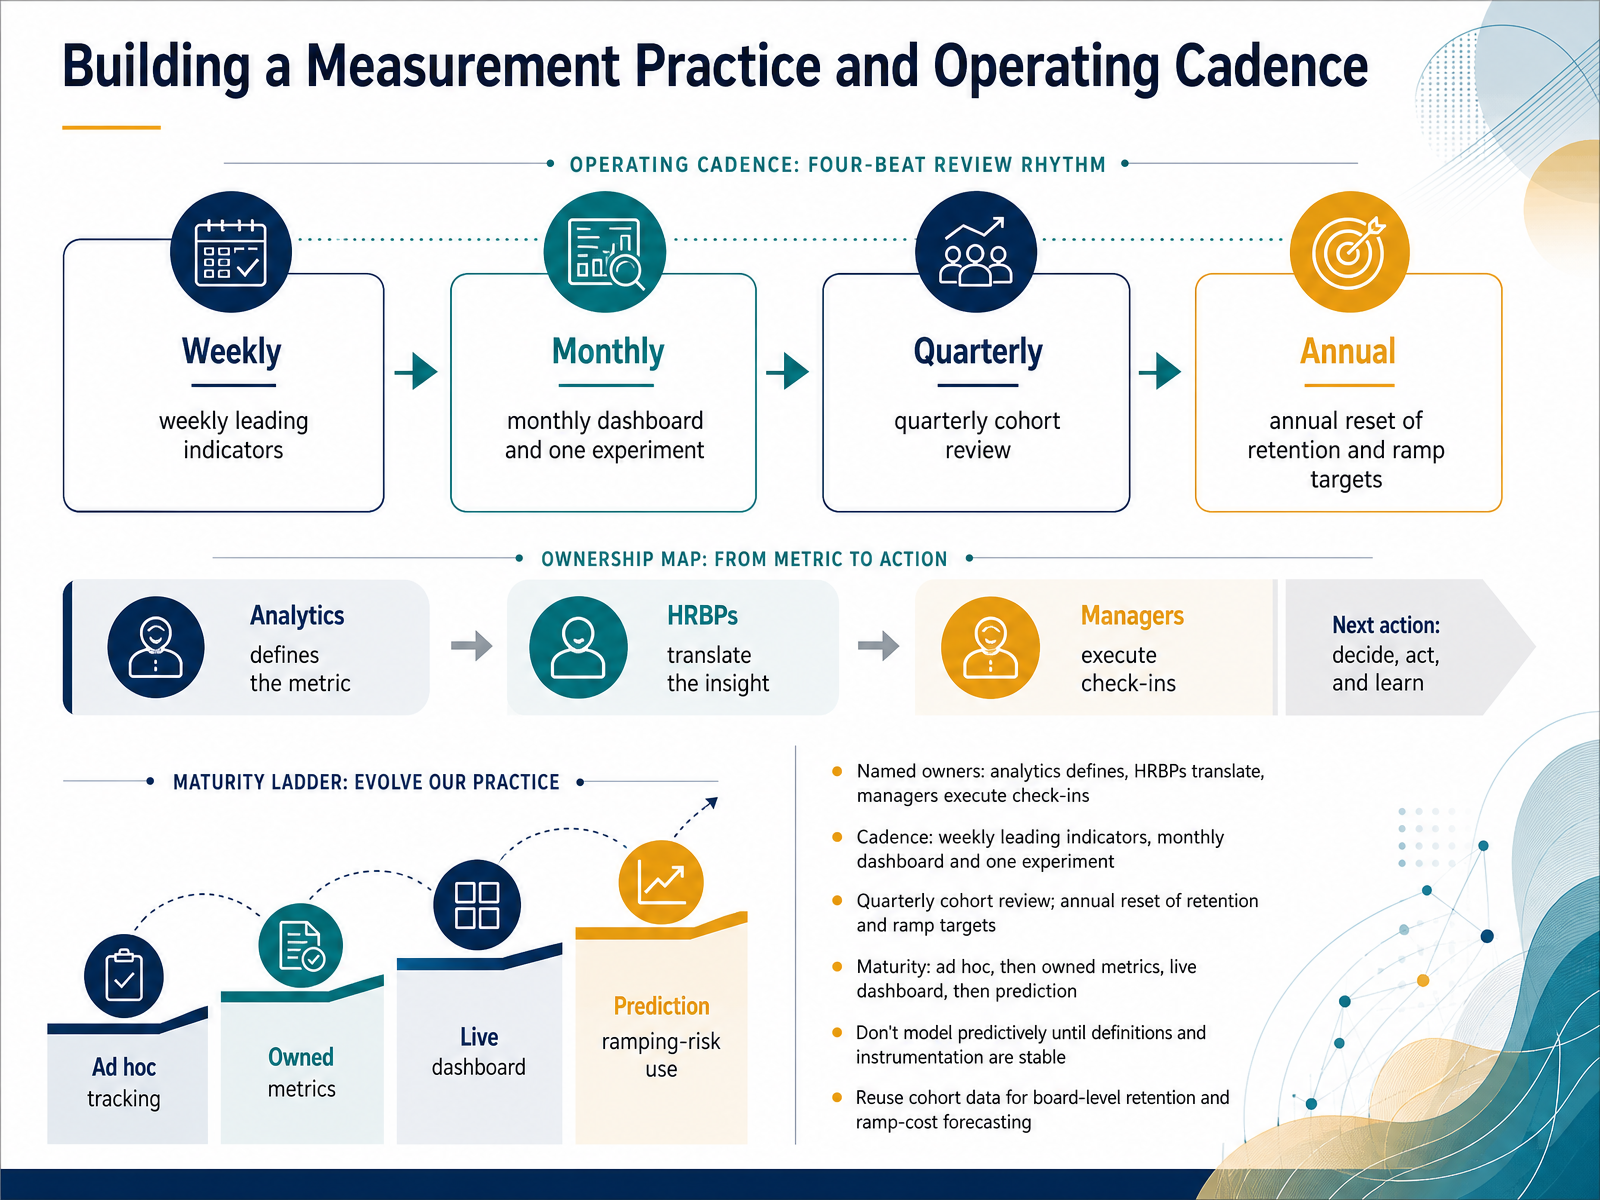
1 min - 11Building a Measurement Practice and Operating CadenceLet's turn all of this into a measurement practice with a rhythm your organization can sustain. Start with named owners. Analytics defines the metrics. Human resource business partners translate them for the business. Managers execute the check-ins. When ownership is vague, metrics stall. Next, set your cadence. Review leading indicators weekly. Publish a monthly dashboard with one experiment attached to it. Then hold a quarterly cohort review and reset retention and ramp targets annually. That sequence keeps you from chasing noise. Think about maturity as a progression. You move from ad hoc reporting, to owned metrics, to a live dashboard, and only then to prediction. A quick example helps here. If new hire first week login data is captured inconsistently, any predictive model will learn garbage, so fix definitions and instrumentation first. One more payoff. Reuse your cohort data for board level retention and ramp cost forecasting, so onboarding becomes part of the business narrative. Now let's apply this in a scenario walkthrough, diagnosing a ninety day retention problem.
 2 min
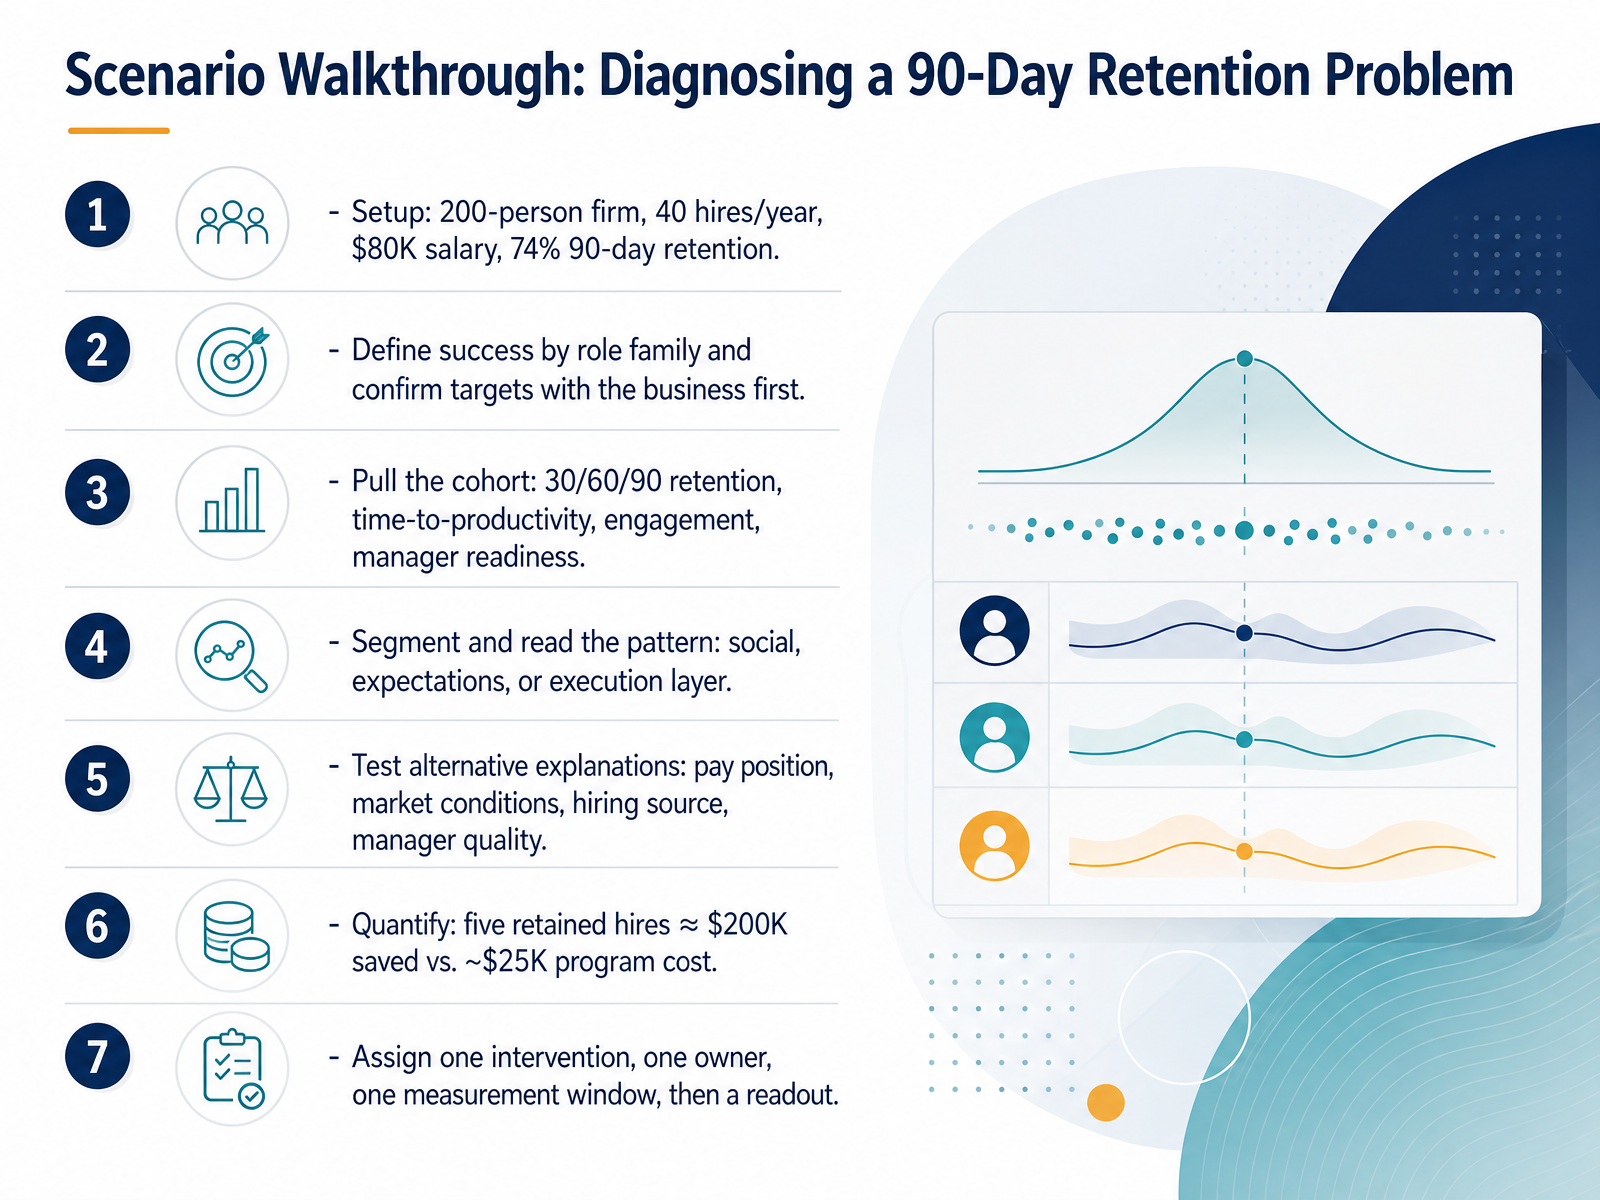
2 min - 12Scenario Walkthrough: Diagnosing a 90-Day Retention ProblemLet's put all of this into a real scenario. Picture a two hundred person firm hiring forty people a year at an eighty thousand dollar salary, with ninety day retention sitting at seventy four percent. Before you diagnose anything, define success by role family, and confirm those targets with the business first. Then pull the cohort data: thirty, sixty, and ninety day retention, time to productivity, engagement, and manager readiness. Segment it and read the pattern. Is this a social layer problem, an expectations problem, or an execution problem? Test alternative explanations too: pay position, market conditions, hiring source, and manager quality. Then quantify the case. Retaining just five more hires is roughly two hundred thousand dollars saved against a program cost near twenty five thousand. Finally, assign one intervention, one owner, one measurement window, and schedule the readout. That discipline is what turns a retention number into a decision. Next, we'll look at improving time to productivity for a distributed team.
 2 min
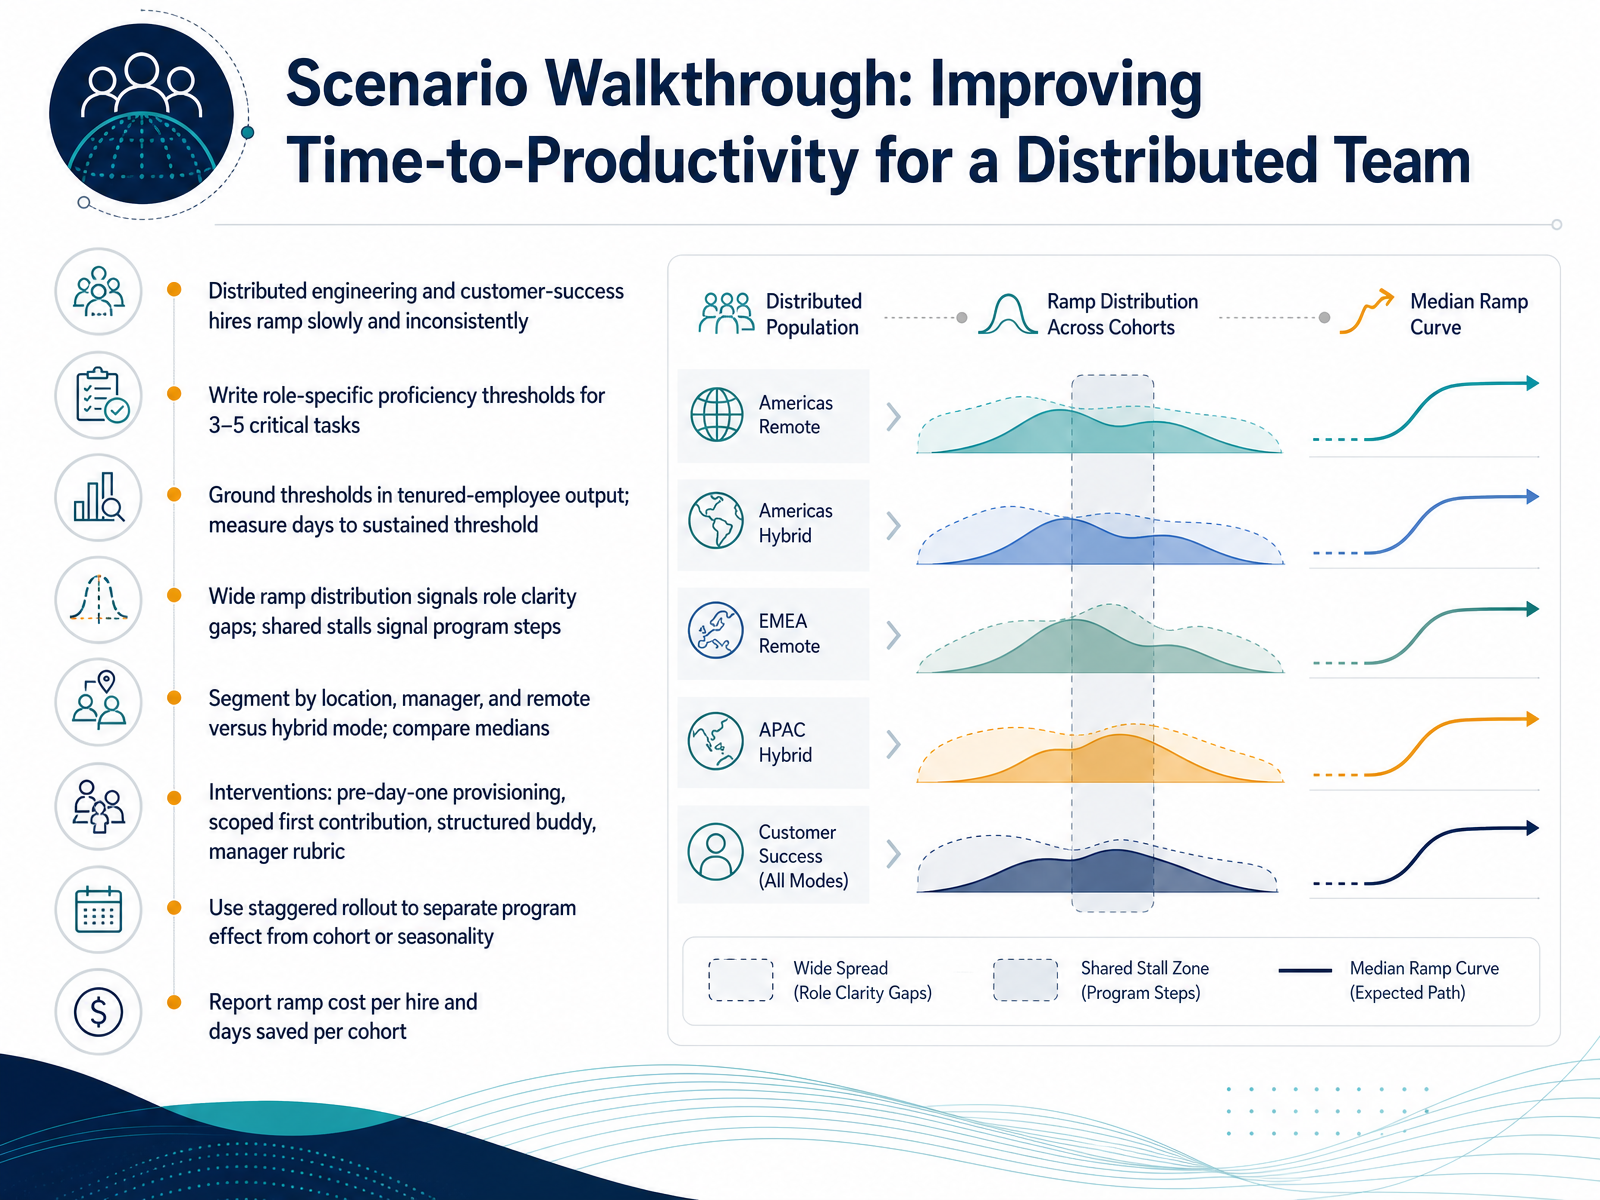
2 min - 13Scenario Walkthrough: Improving Time-to-Productivity for a Distributed TeamNow let's bring this to life with a scenario. A distributed team finds that its engineering and customer-success hires ramp slowly and inconsistently. Start by writing role-specific proficiency thresholds for three to five critical tasks. Ground those thresholds in the output of tenured employees, then measure days to sustained threshold. When ramp times are widely spread, suspect role clarity gaps. When everyone stalls at the same point, suspect a program step. Segment results by location, manager, and remote versus hybrid mode, and compare medians, not averages, so outliers do not distort the picture. Common interventions include pre-day-one provisioning, a scoped first contribution, a structured buddy, and a manager rubric. Use a staggered rollout to separate program effect from cohort or seasonality. Finally, report ramp cost per hire and days saved per cohort. That earns executive attention. Next, let's turn these ideas into an action plan.
 2 min
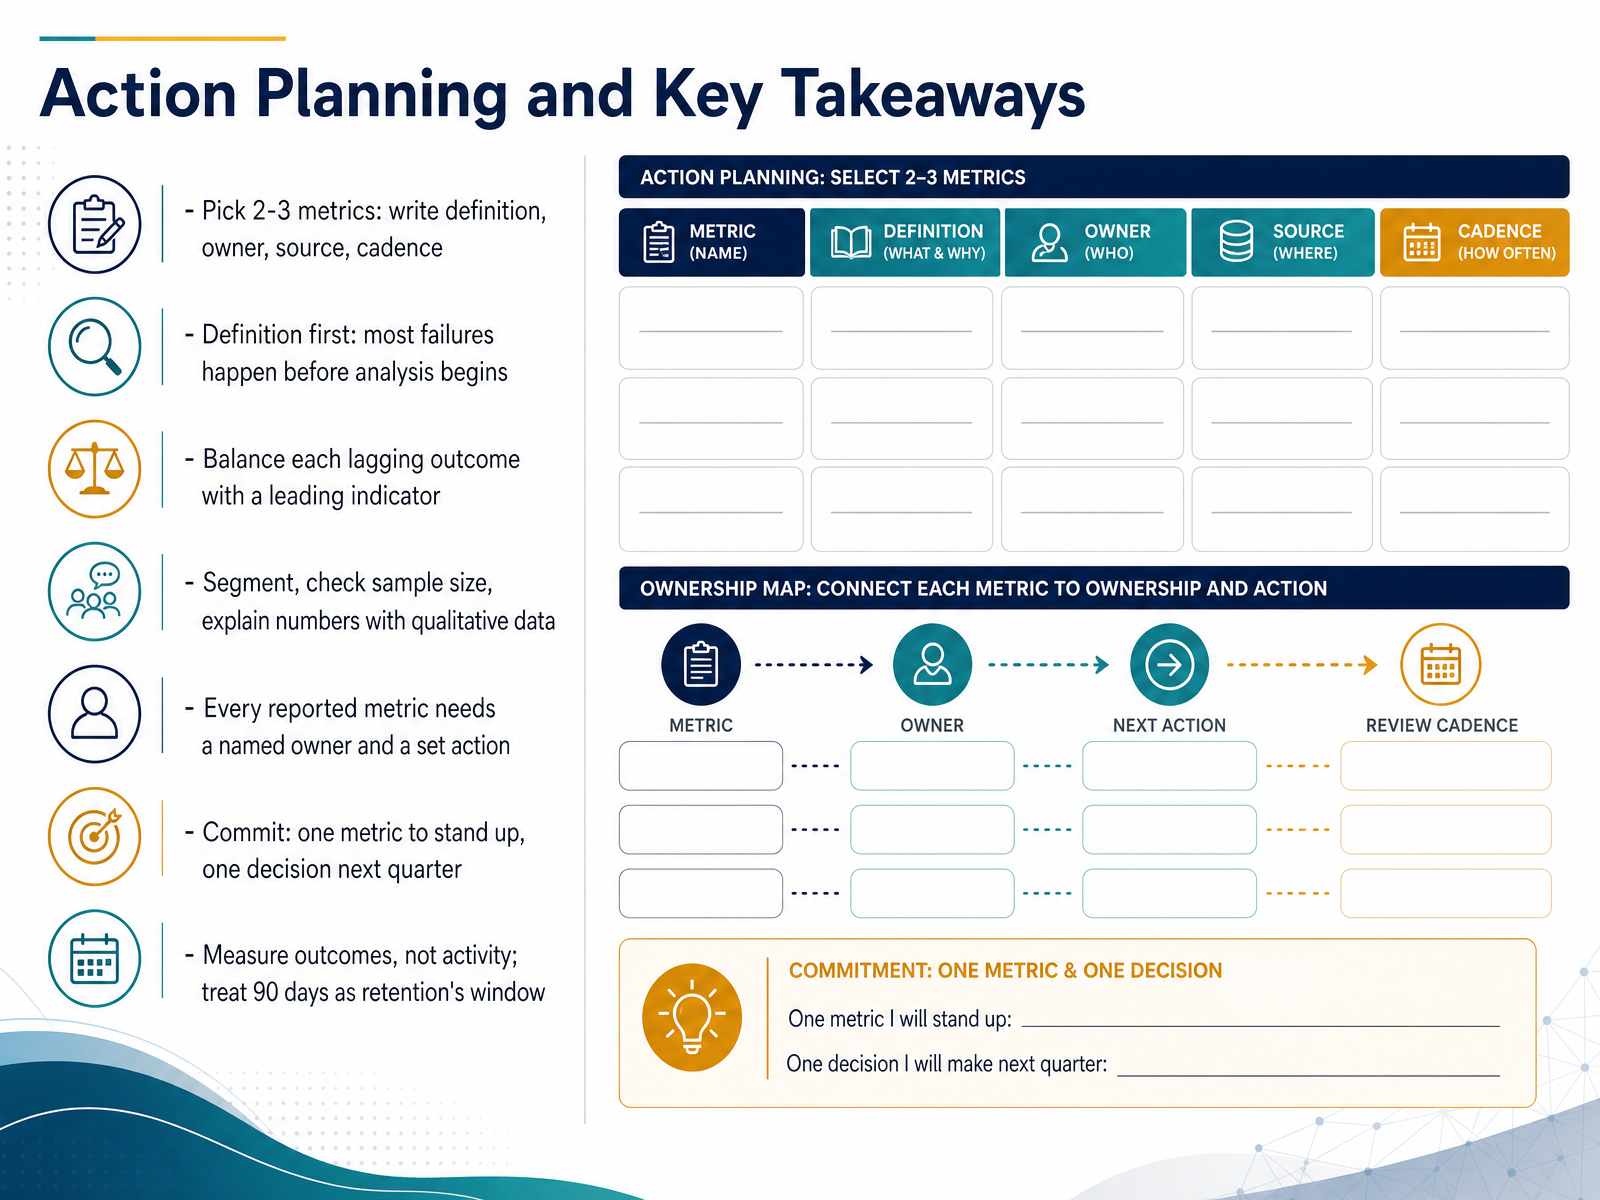
2 min - 14Action Planning and Key TakeawaysLet's close with the decisions that make all of this operational. Start small: pick two or three metrics, and for each one, write a definition, a named owner, a data source, and a review cadence. Definition first, because most measurement failures happen before analysis begins. For example, decide whether time to productivity means ninety days or one hundred eighty, then apply that choice consistently.
Next, balance each lagging outcome, like first-year retention, with a leading indicator such as day-thirty engagement. Segment your data, check sample size, and explain the numbers with qualitative input. Every reported metric needs an owner and a set action, or it is just trivia.
So commit to one metric you will stand up this quarter, and one decision it will inform next quarter. Measure outcomes, not activity, and treat ninety days as retention's true window. You now have the framework to act. Thank you for your attention, and go make your data decision-ready.
 2 min
2 min
Take the deck with you
Download this course as a file — free, no sign-up needed.
- PDF handoutEvery slide page, ready to print or share.15 pages · 3.8 MBDownload
- Narrated PowerPointThe deck that presents itself — every slide carries the digital human's narration video.15 pages · 14.2 MBDownload
- PowerPoint slidesThe full deck as a .pptx — open it in PowerPoint, Keynote, or Google Slides.15 pages · 3.6 MBDownload
Free to use in your own training — please keep the PersonWise credit page at the end.
Have your own deck? Turn it into a course