P-Value Concepts and Applications
Begin
14 pages · ~28 min
P-Value Concepts and Applications
This training explains the concept of p-value in statistics, its purpose in hypothesis testing, and practical examples for learners seeking to interpret statistical significance.
What you’ll learn
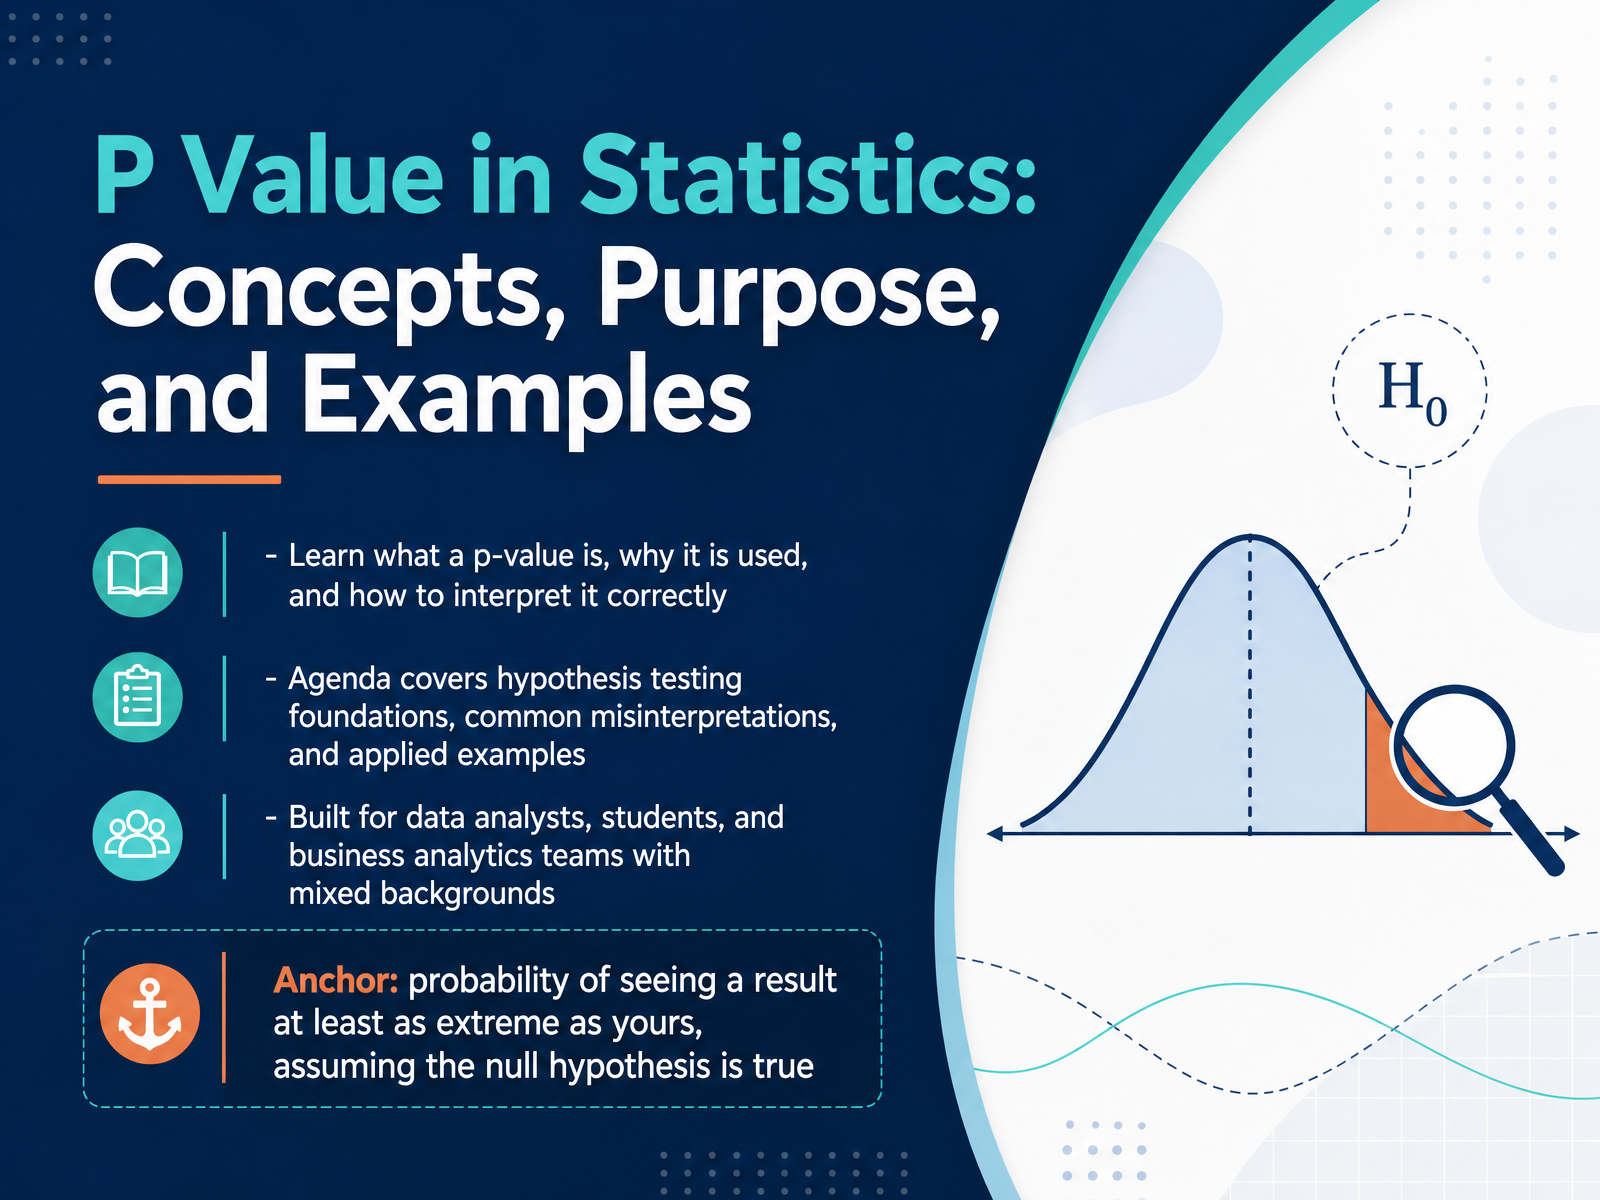
- 01P Value in Statistics: Concepts, Purpose, and ExamplesWelcome to this session on understanding P values. If you work with data, analyze experiments, or make business decisions, this number shows up everywhere, and it is also one of the most misunderstood numbers in statistics. So our goal today is simple: we want to take the mystery out of it. We will start by defining what a P value actually measures. Then we will look at why we use it and how to interpret it correctly. We will also cover the common misinterpretations that trip people up, and we will apply these ideas to real world business examples, like testing a new website layout or comparing sales between two regions. Here is the core idea we are anchoring on: imagine there is truly no difference, no effect, nothing happening. That assumption is called the null hypothesis. A P value tells you how surprised you would be to see a result as extreme as yours, purely by chance, under that assumption of no effect. Think of it as a surprise meter for your data. Now let's take a step back and understand why we even need this tool in the first place. Next up, we explore the problem of sampling variability.michaelnocito.github.ioatticusli.comcasrai.org+21 min
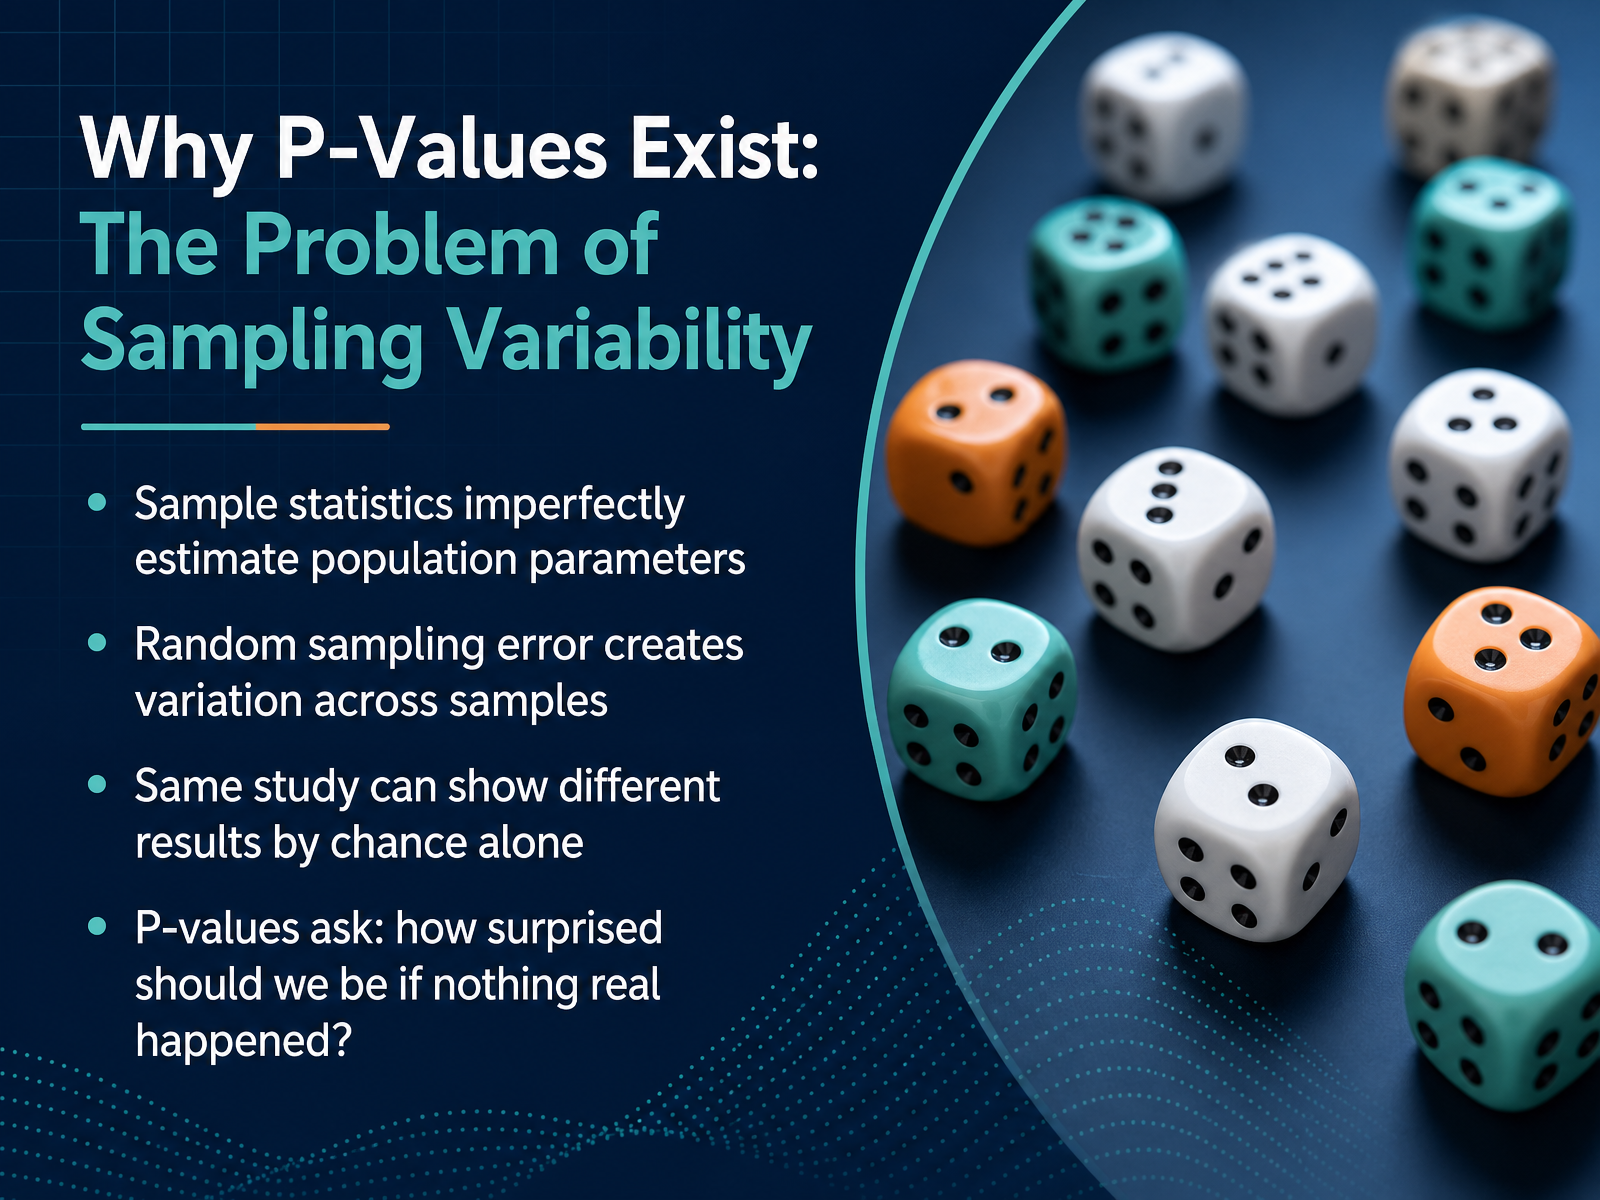
- 02Why P-Values Exist: The Problem of Sampling VariabilityNow, let’s talk about why we need the p-value in the first place. The core issue is something called sampling variability. Think of it this way: when we calculate an average from a sample, like a survey of a few hundred customers, we’re really making an estimate about the entire customer base. That sample average is our statistic, but the true average for everyone is the population parameter we actually want to know. The problem is, our sample is just one of many possible samples we could have taken. Because of random chance, different samples will give us slightly different averages. This is what we call sampling error. It’s not a mistake we made; it’s just the natural variation you get from drawing samples. So, if we run the same study twice, we might see different results simply by chance. This leads to the big question a p-value is designed to answer: if nothing real was happening, if there was no true effect in the population, how surprised should we be to see the results we got in our sample? That’s the concept we’ll unpack next, as we look at the framework for this type of testing.
 kpu.pressbooks.pubstatisticsbyjim.comopentext.wsu.edu+21 min
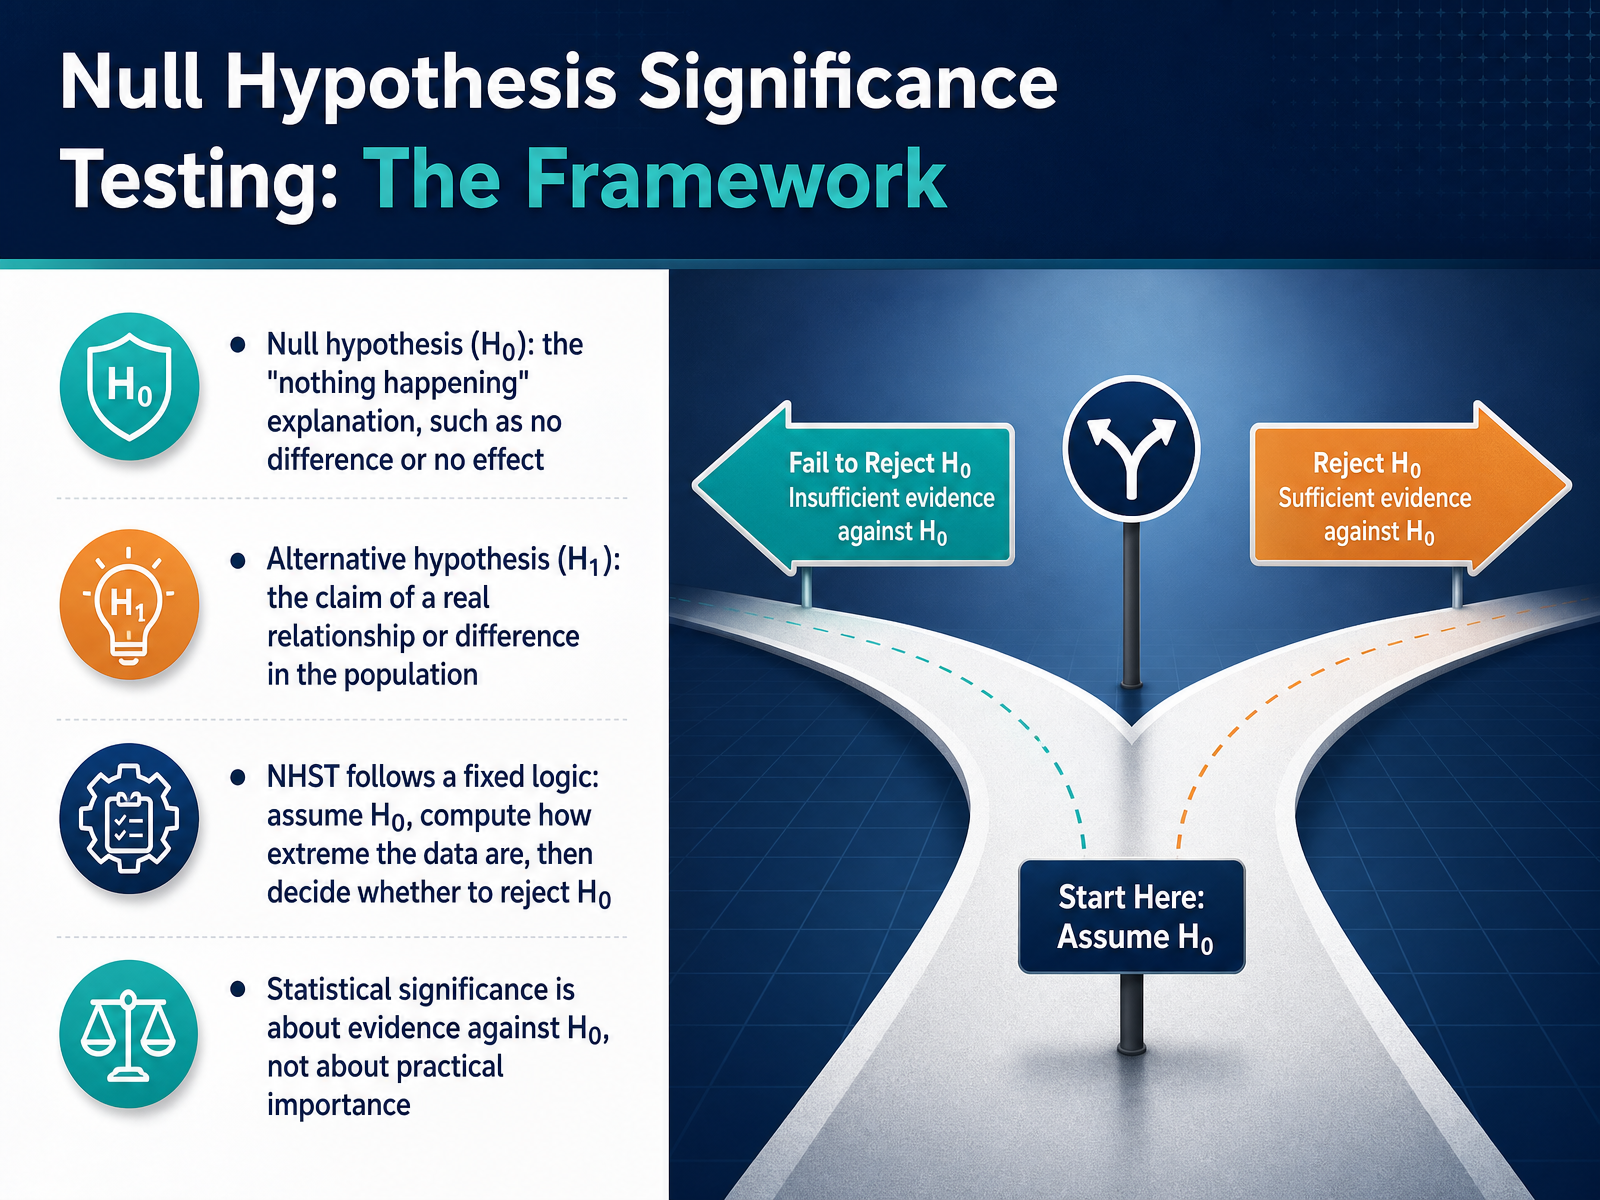
 - 03Null Hypothesis Significance Testing: The FrameworkNow that we know the p-value is a tool for decision-making, let's step back and look at the framework it lives in. It's called Null Hypothesis Significance Testing, or NHST. Think of it as a structured conversation between two competing ideas. First, we have the null hypothesis, often written as H zero. This is the 'nothing happening' explanation. It claims there is no real difference, no real effect. For example, a new website design has no impact on sales. The alternative hypothesis, written as H one, is the opposite. It claims there is a real relationship or difference in the population. So in our example, the new design does impact sales. The logic of NHST is always the same. We start by assuming the null hypothesis is true. That's our default position. Then we ask, simply, how surprising is our data under this assumption? If our data would be very unlikely to occur if there were no real effect, we start to doubt the null. That doubt is what leads us to reject it. But here's a critical point to remember. Statistical significance is about evidence against the null hypothesis. It tells us the effect is probably real, but it does not tell us if the effect is big or important in a practical sense. That's a question for another time. Next, let's look at how we measure that surprise with test statistics and a threshold called alpha.
 kpu.pressbooks.pubstatisticsbyjim.comopentext.wsu.edu+22 min
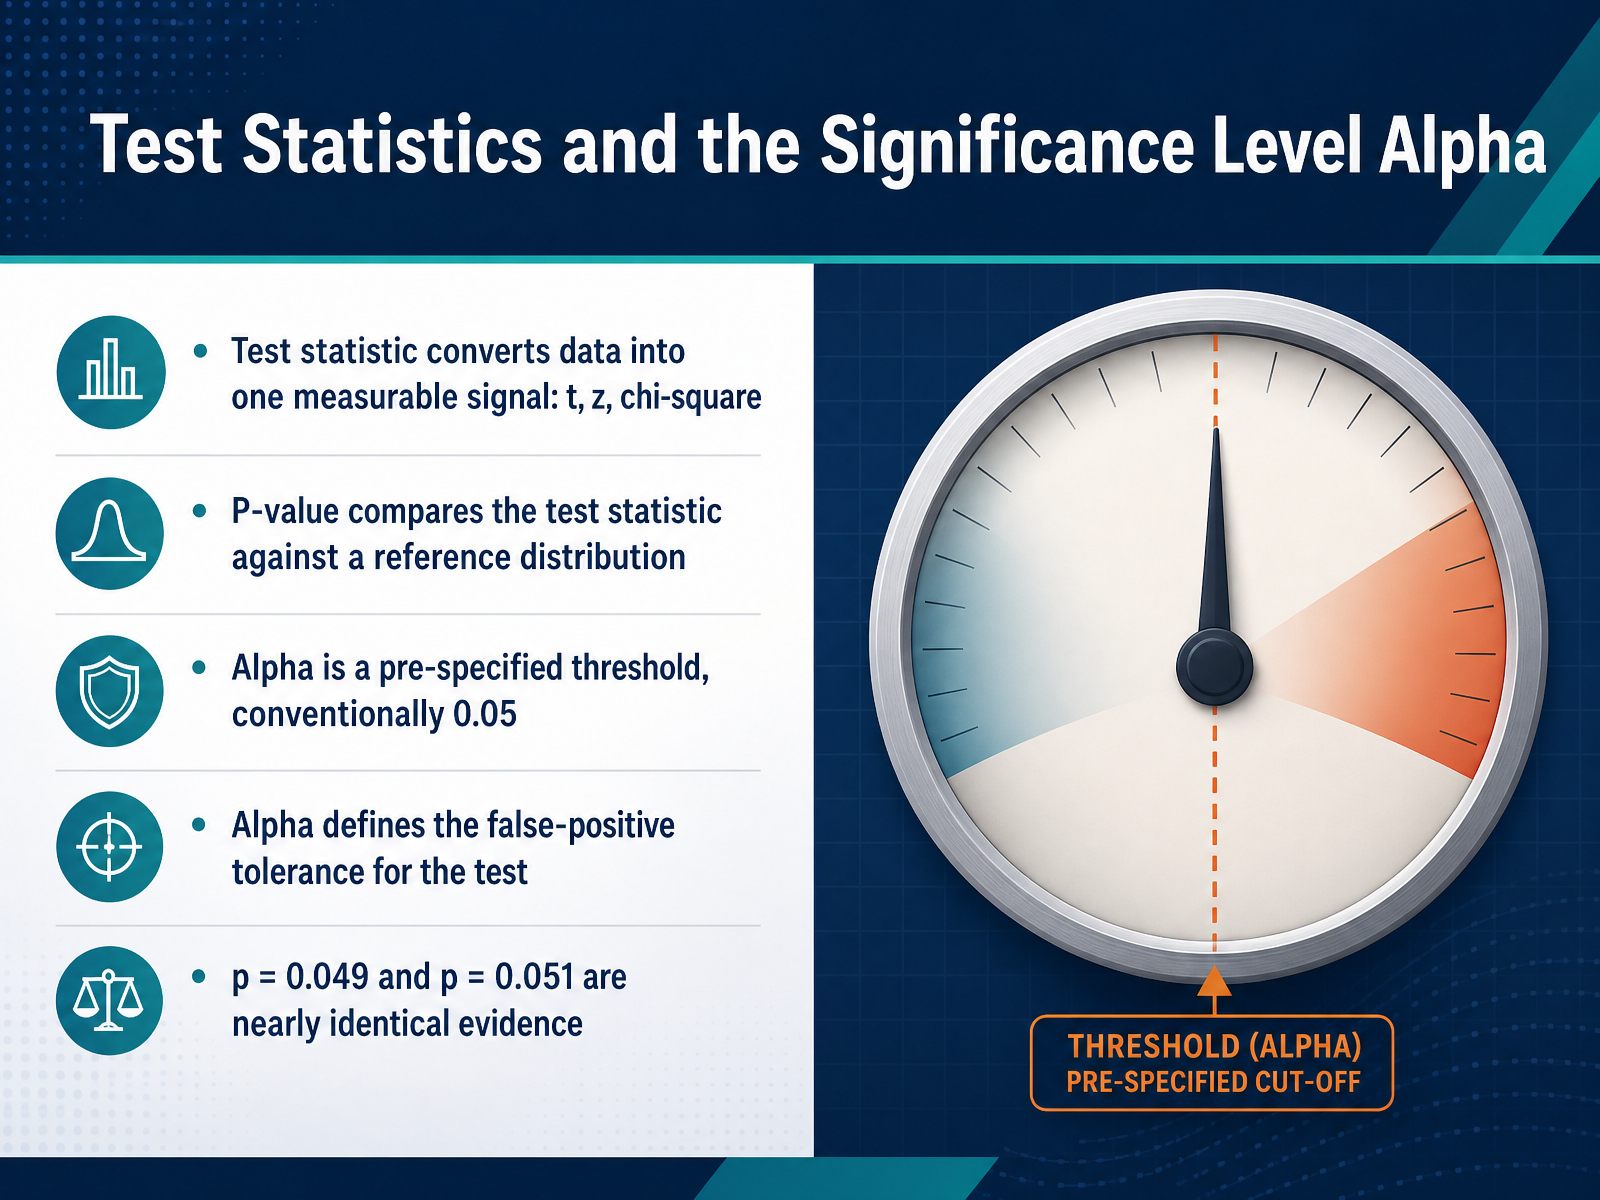
 - 04Test Statistics and the Significance Level AlphaNow let us talk about test statistics and the significance level, or alpha. First, the test statistic. That is simply a way to turn your messy data into one single, measurable signal. Depending on your test, that number could be a t, a z, or a chi-square value. So what does this actually mean? Instead of comparing hundreds of data points, the test statistic lets you compare one number for your whole dataset. Then the p-value takes over. It compares that test statistic against a reference distribution. In plain terms, the p-value asks how unusual your single number is, assuming nothing interesting is going on. Alpha is a different piece. Alpha is a threshold you decide in advance, and by convention, it is often set at point zero five. Think of it as your false-positive tolerance. It is the risk you are willing to accept for seeing an effect that is not really there. And here is a practical point. A p-value of zero point zero four nine and zero point zero five one are nearly identical evidence. The world does not suddenly change at the line. Next, we will define the p-value with precision.
 kpu.pressbooks.pubstatisticsbyjim.comopentext.wsu.edu+21 min
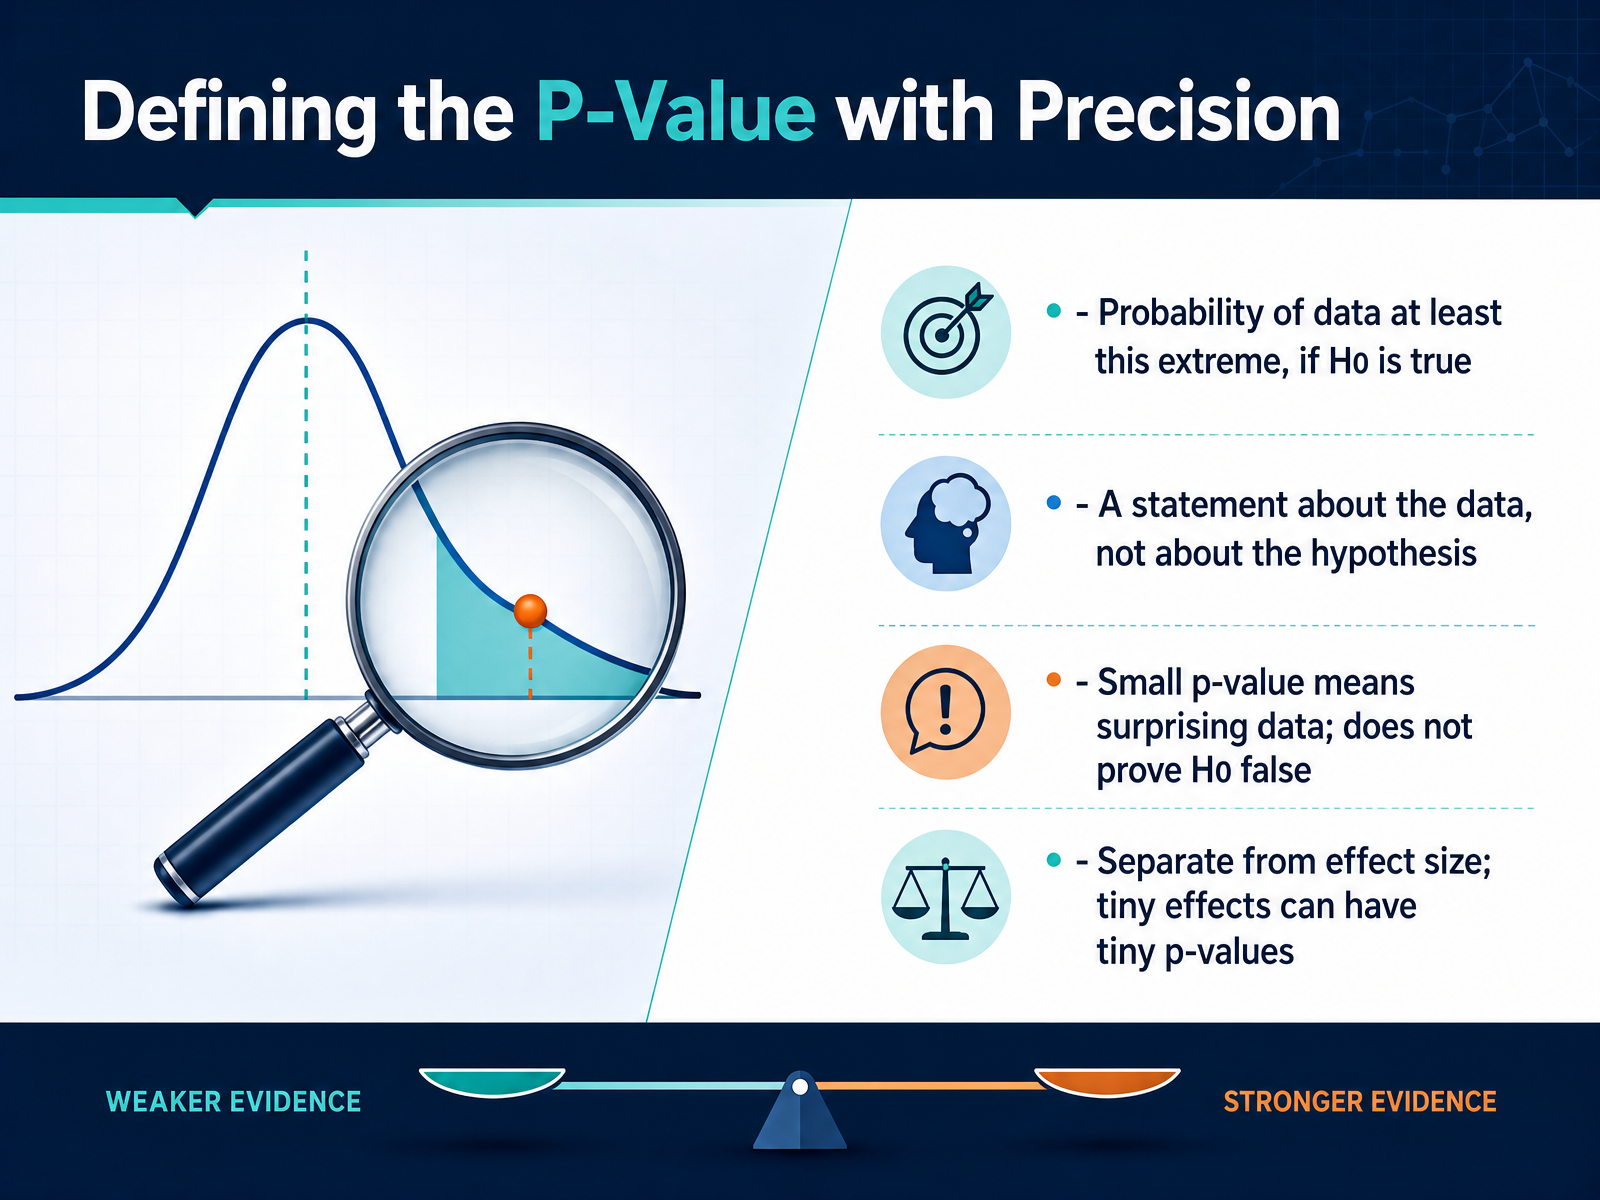
 - 05Defining the P-Value with PrecisionNow we are ready for a precise definition. A p value is the probability of getting data at least as extreme as what you observed, assuming the null hypothesis is true. In simpler terms, it asks, if nothing is really going on, how often would I see a result this surprising? Think of it as a surprise meter for your data, not a truth meter for your idea. The p value is a statement about the data, not about the hypothesis. So a small p value like point zero one means your data would be unusual if the null were true. It does not prove the null is false. And here is a key point for business: a small p value also does not mean a big effect. With a huge sample, even a tiny, useless difference can produce a very small p value. That is why we always look at the actual business impact alongside the p value. A small p value is surprising data, nothing more. Next, we will look at why analysts rely on p values in the first place.
 pubmed.ncbi.nlm.nih.govpmc.ncbi.nlm.nih.govstatisticsdonewrong.com+21 min
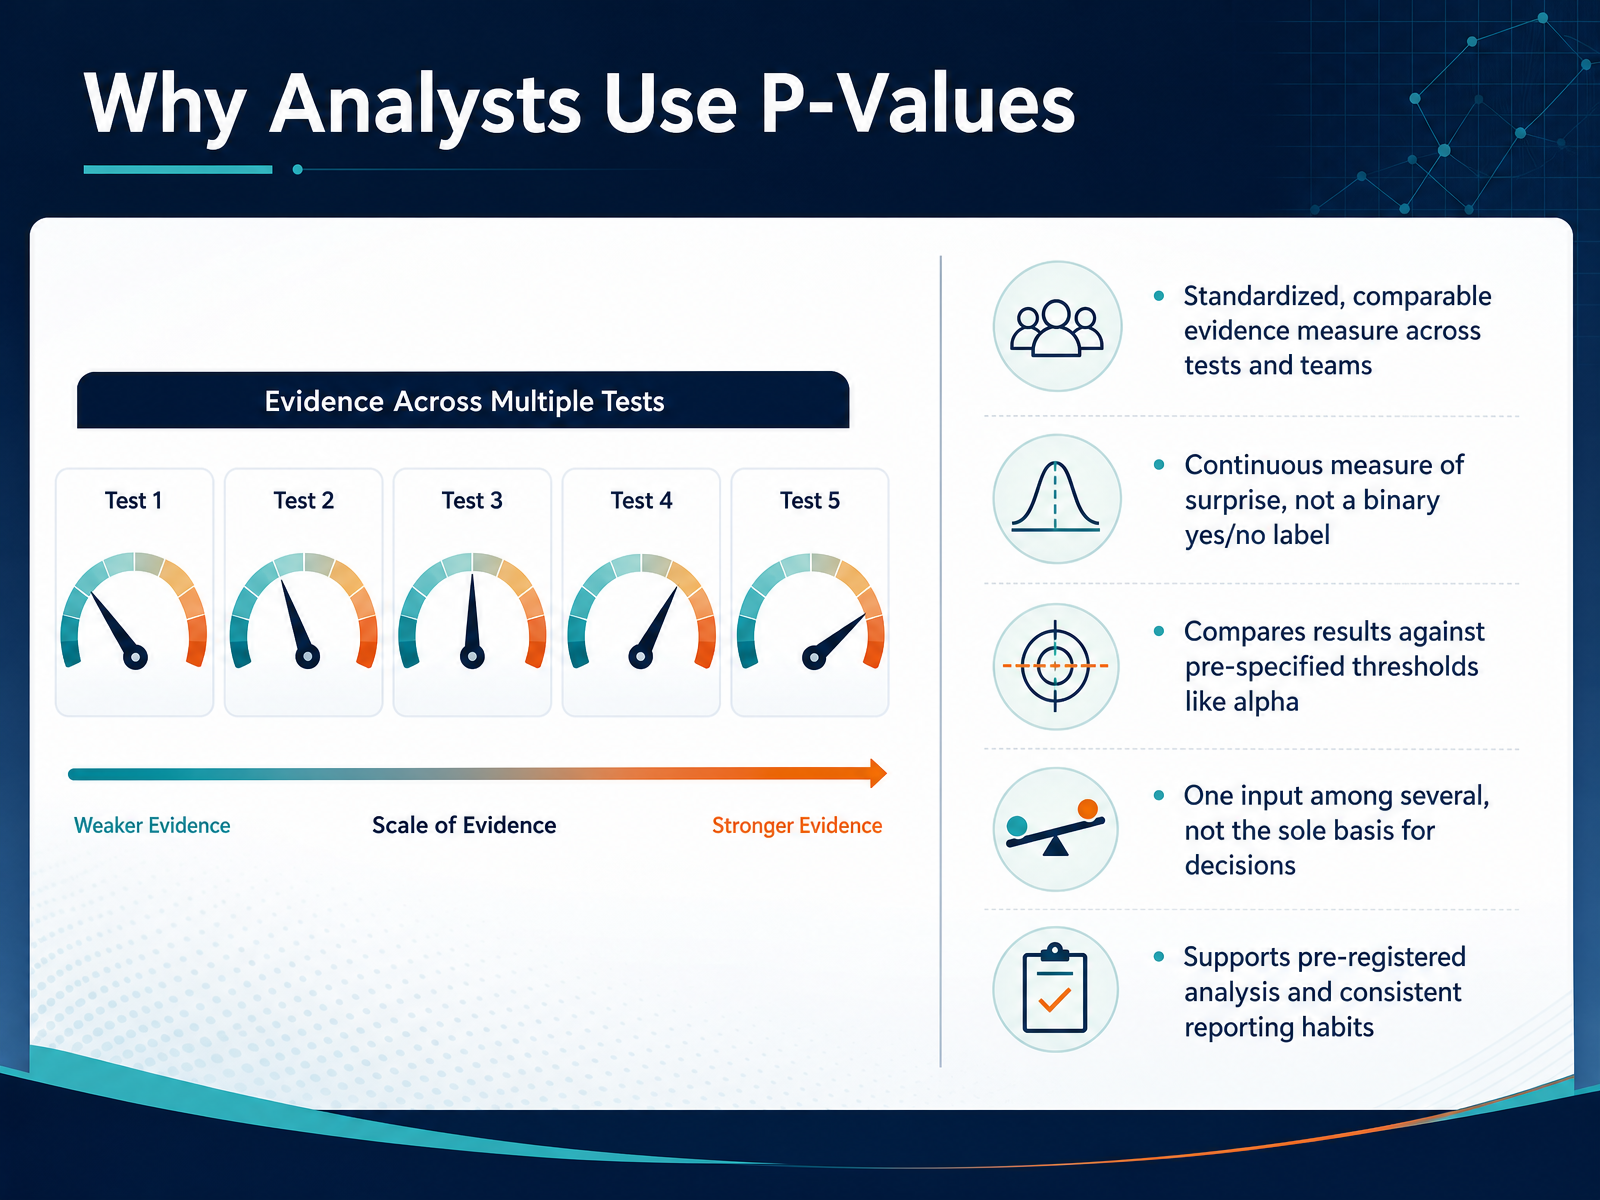
 - 06Why Analysts Use P-ValuesSo let’s step back and ask a practical question. Why do analysts rely on p-values so much in everyday work? The first reason is consistency. A p-value gives every test a common score, so one team’s result can be compared against another team’s result without everyone inventing their own standard. Think of it as a shared measuring stick for evidence. Second, a p-value is a continuous measure of surprise, not a yes or no label. A result with a p-value of point zero zero one is more surprising than one at point zero four, even if both cross the usual threshold. Third, p-values are always read against a pre-specified alpha, like point zero five. That comparison is what turns evidence into a clear decision rule. But here is the important part. A p-value is only one input. It should sit alongside the effect size, the confidence interval, and the business context. On its own, it cannot tell you whether a difference is big enough to matter. Finally, p-values support better habits. When a team agrees on the threshold, the test, and the reporting approach before looking at data, it is much harder to drift into cherry-picking, and much easier to keep results honest and repeatable over time. Up next, we need to address one of the most common misunderstandings. What a p-value is not, and why the inverse probability fallacy causes so many bad decisions.
 michaelnocito.github.ioatticusli.comcasrai.org+22 min
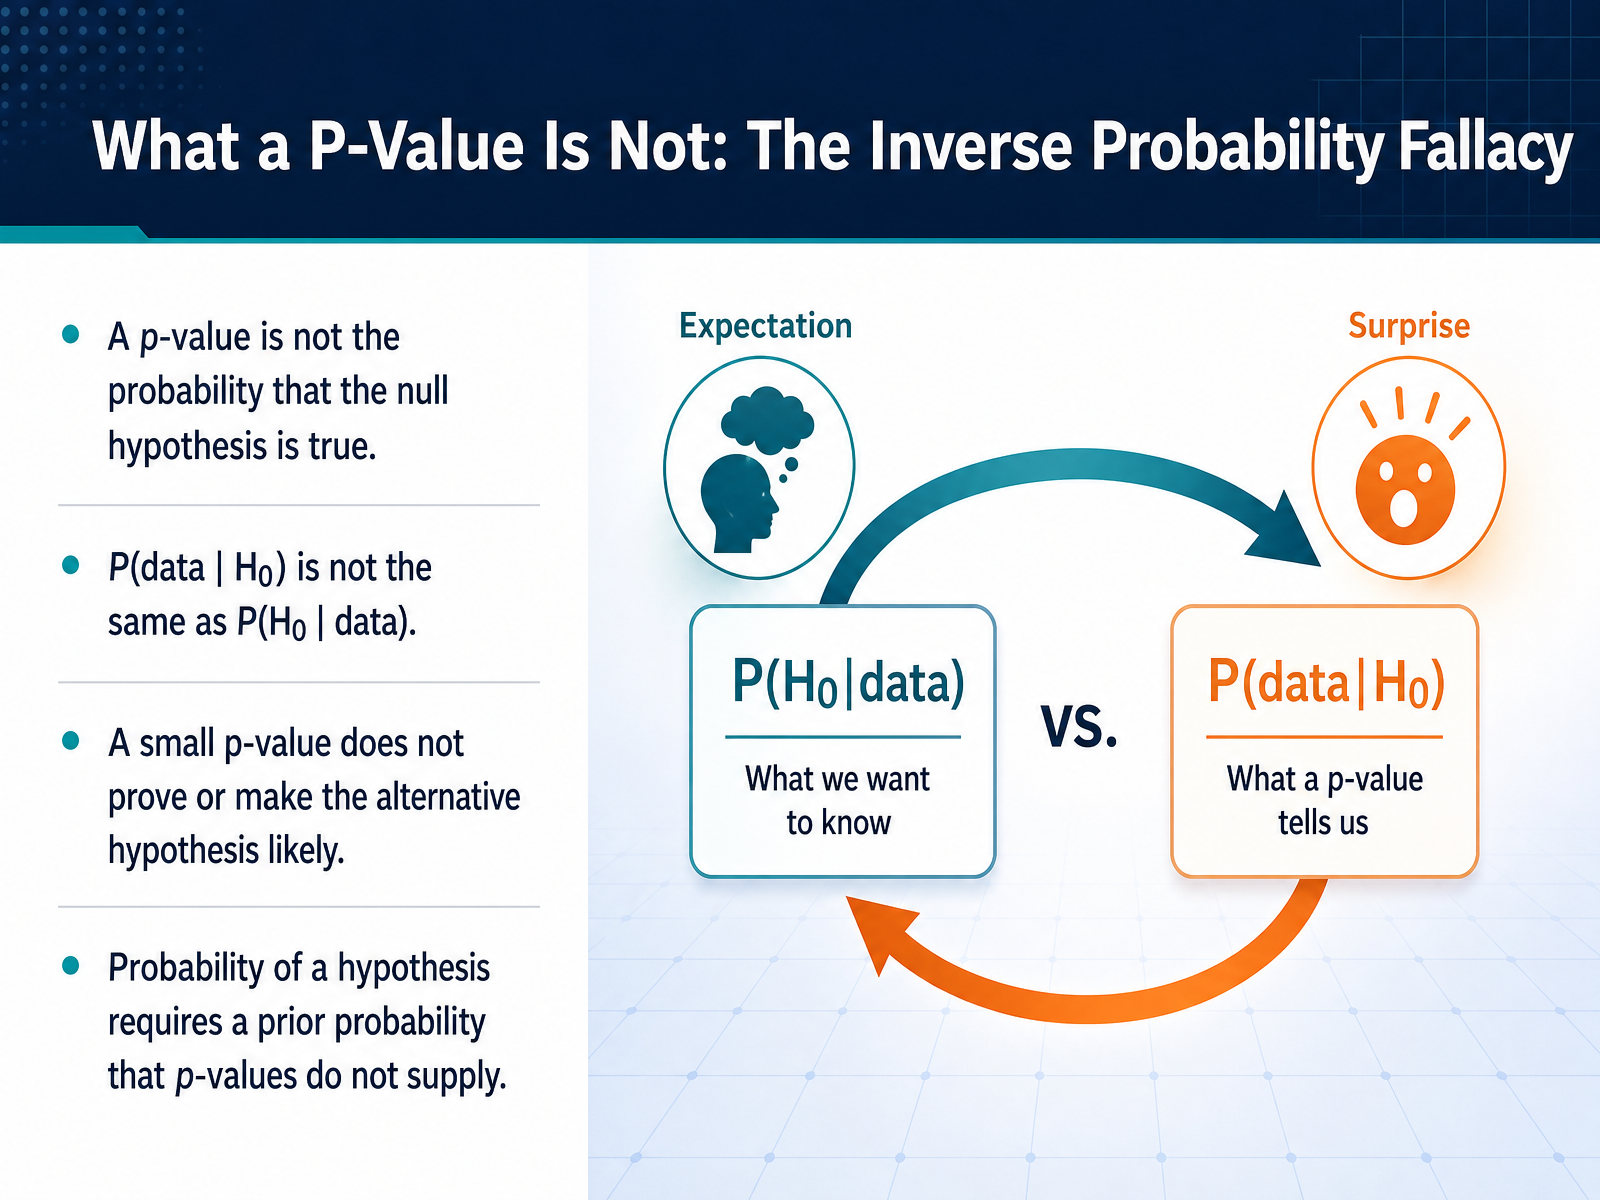
 - 07What a P-Value Is Not: The Inverse Probability FallacyNow, before we go further, we need to clear up the biggest mistake people make with this number. A p-value is not the probability that the null hypothesis is true. Let me say that again, because it is that important. It is not a measure of whether our baseline assumption is likely or unlikely. Statistically speaking, calculating the probability of the data, given the null hypothesis, is not the same as calculating the probability of the null hypothesis, given the data. So what does this actually mean? Imagine a p-value of point zero three. That does not mean there is a three percent chance the null hypothesis is correct. It simply means that if the null hypothesis were true, the data we saw would be rare. And a small p-value does not prove the alternative hypothesis is real. If you want to know the probability that a hypothesis is correct, you need a starting belief, called a prior probability. A p-value never supplies that. So, treat the p-value as a data compatibility check, not a verdict. Next, let’s look at how these misinterpretations play out in everyday business decisions.
 pubmed.ncbi.nlm.nih.govpmc.ncbi.nlm.nih.govstatisticsdonewrong.com+21 min
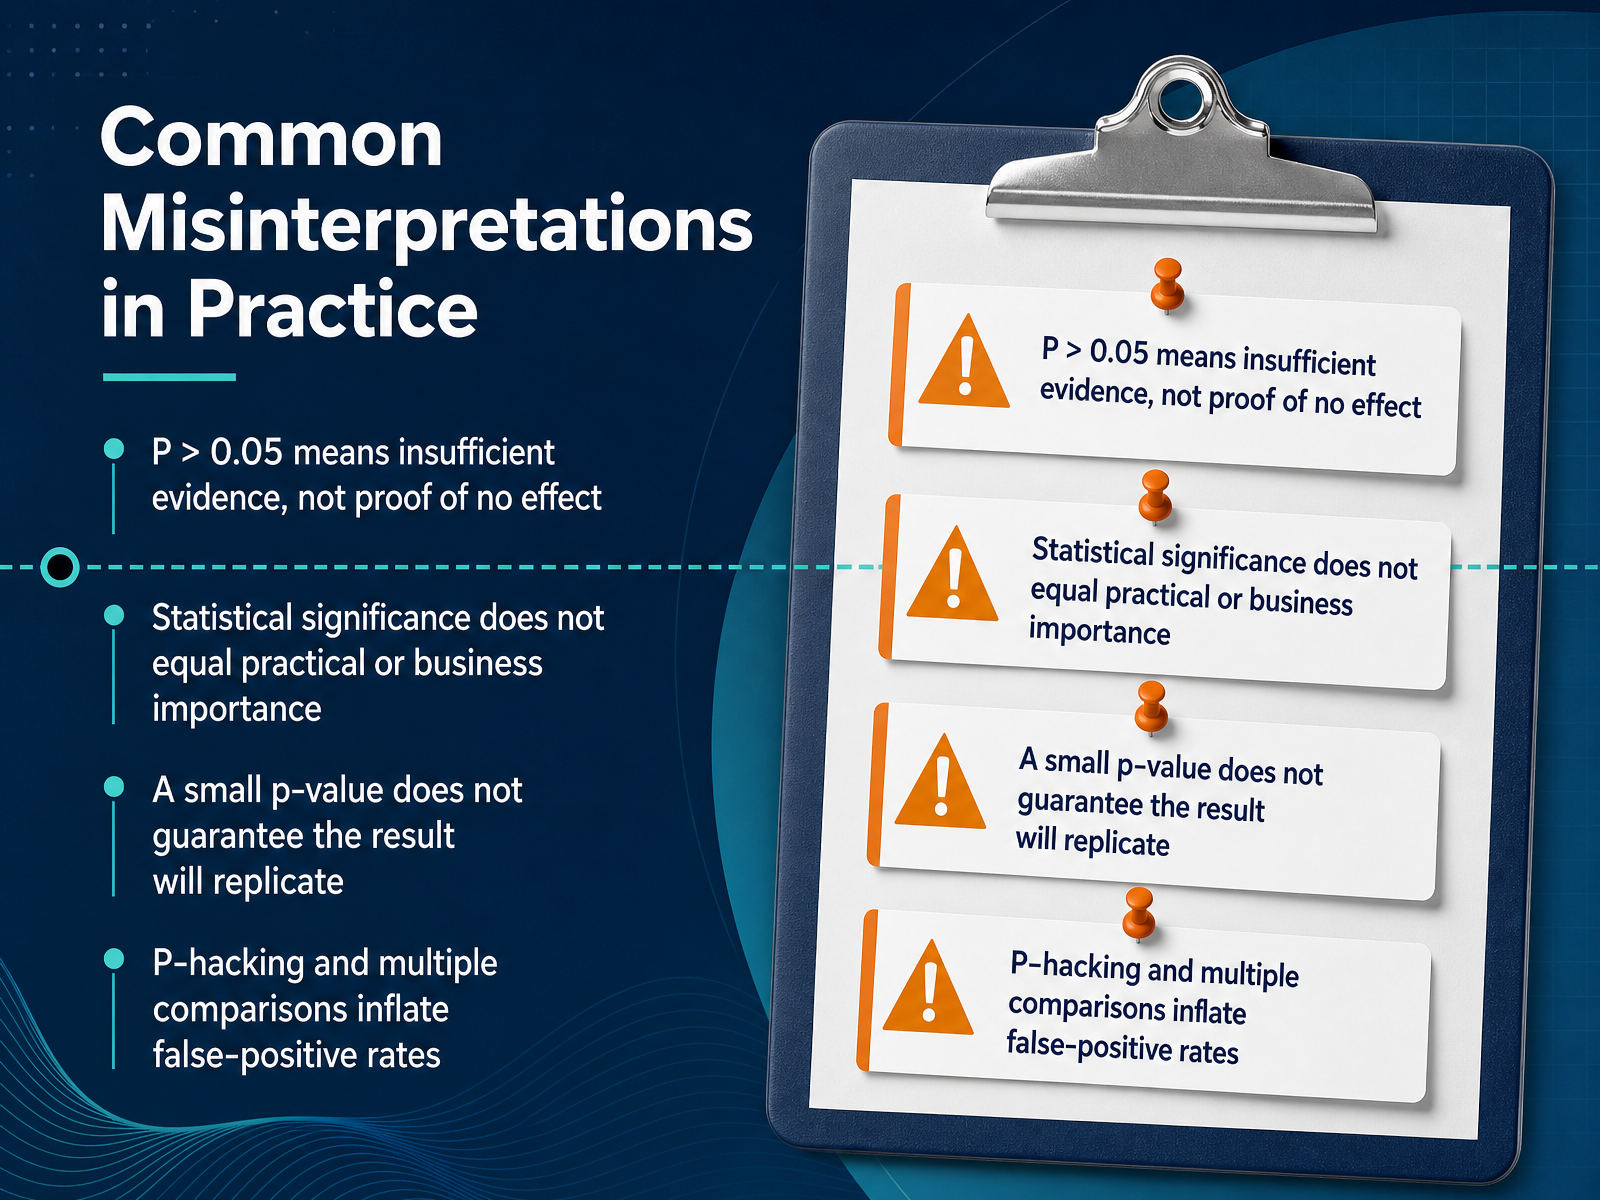
 - 08Common Misinterpretations in PracticeNow let's talk about the ways p-values often get misinterpreted in practice, because these mistakes can quietly change good analysis into bad decisions. The first one is big. If your p-value is greater than zero point zero five, that does not prove there is no effect. It only means you do not have enough evidence to conclude there is one. Think of it as a weak signal, not a clean bill of no change. The next point is that statistical significance is not the same as practical importance. A very small difference can become statistically significant with a very large sample, but that difference may not matter for the business at all. So always ask: how big is the effect, not just how surprising is the data. Third, a small p-value does not guarantee that the same result will appear in the next study or the next test. Replication depends on things like effect size, sample size, and study design. And finally, be careful with p-hacking and multiple comparisons. If you keep checking the data or run many tests and only report the ones that pass, you inflate the chance of a false positive. So hold on to these reminders, because next we will walk through a worked example of an A and B test on conversion rate.
 pubmed.ncbi.nlm.nih.govamstat.orgnature.com+21 min
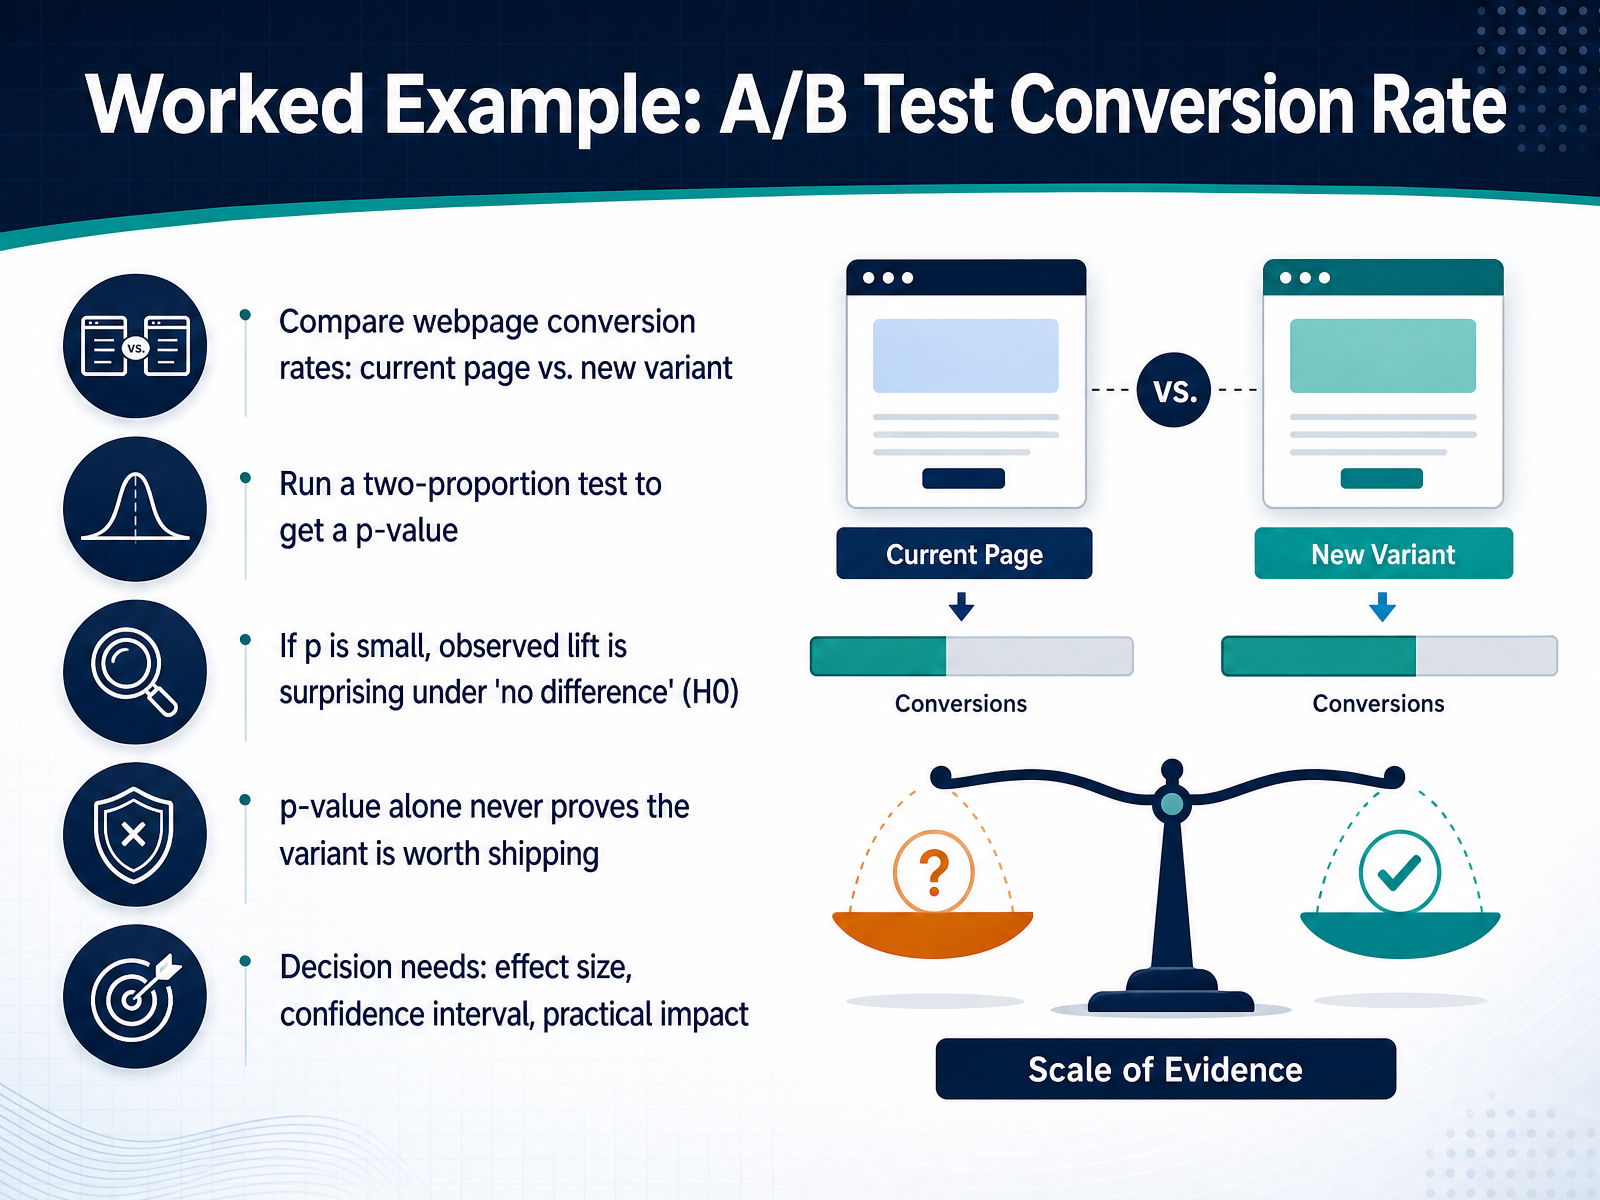
 - 09Worked Example: A/B Test Conversion RateNow let's put this into practice with a common scenario, a webpage A B test. Imagine you compare conversion rates between your current page and a new variant. You run a two proportion test, which gives you a p value. If that p value is small, it means the observed lift you saw would be surprising under the assumption that there is no real difference between the two pages. But here's the critical takeaway. That small p value alone never proves the variant is worth shipping. It only tells you the result is unusual if nothing changed. To make a smart decision, you need more context. You need the effect size to see how big the change actually is. You need the confidence interval to understand the plausible range of that change. And you need practical impact to judge whether the lift is large enough to justify the engineering effort. So when you look at a test result, lead with the lift, then consider uncertainty, and save the p value for the appendix. Next, we'll walk through a worked example comparing group means.
 michaelnocito.github.ioatticusli.comcasrai.org+21 min
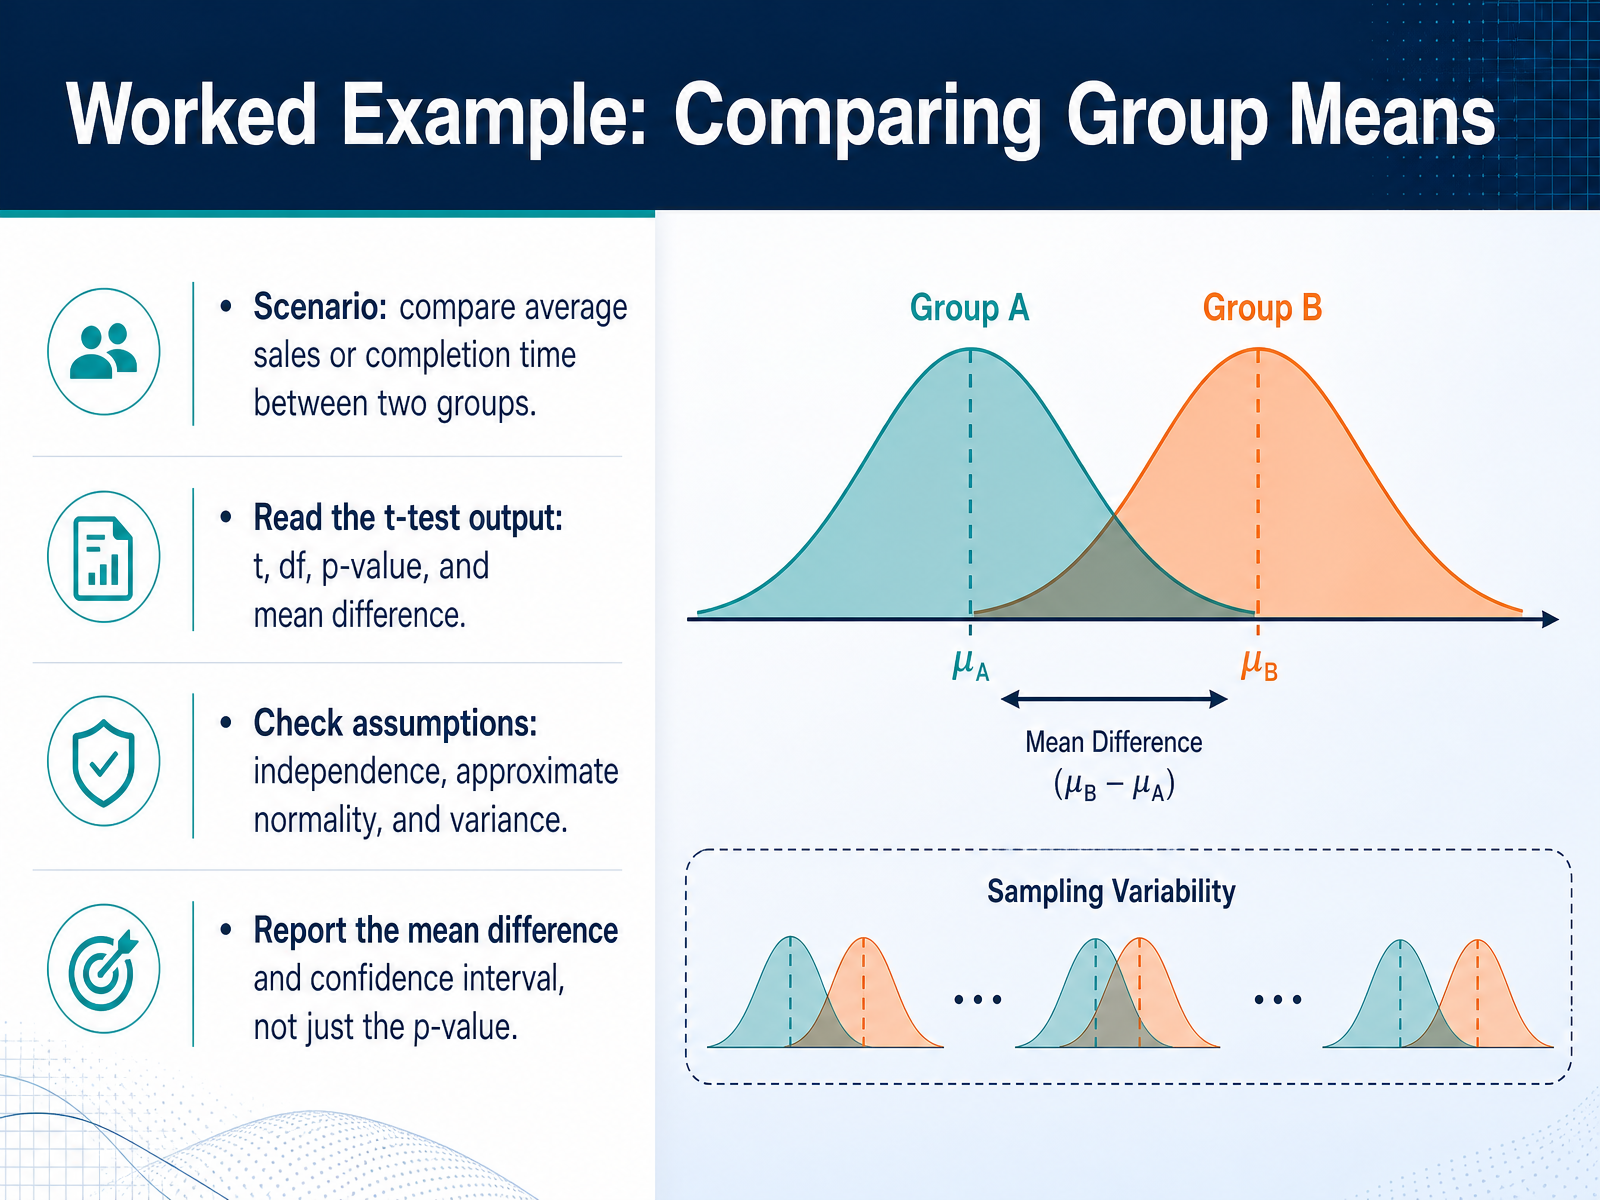
 - 10Worked Example: Comparing Group MeansNow let's walk through a worked example where we compare two group means, like average sales between groups. First, look at the t-test output. You will see the t statistic, the degrees of freedom, the p-value, and the mean difference. Then check the assumptions: independence between groups, approximate normality of the data, and roughly equal variance. Once those are satisfied, report the mean difference with its confidence interval instead of only the p-value. For example, say the new process increased average weekly sales by twelve units, with a plausible range of three to twenty-one units. That gives the business context to act on. Next we will look at p-hacking, peeking, and multiple comparisons.
 statstest.commetricuno.commetricuno.com+11 min
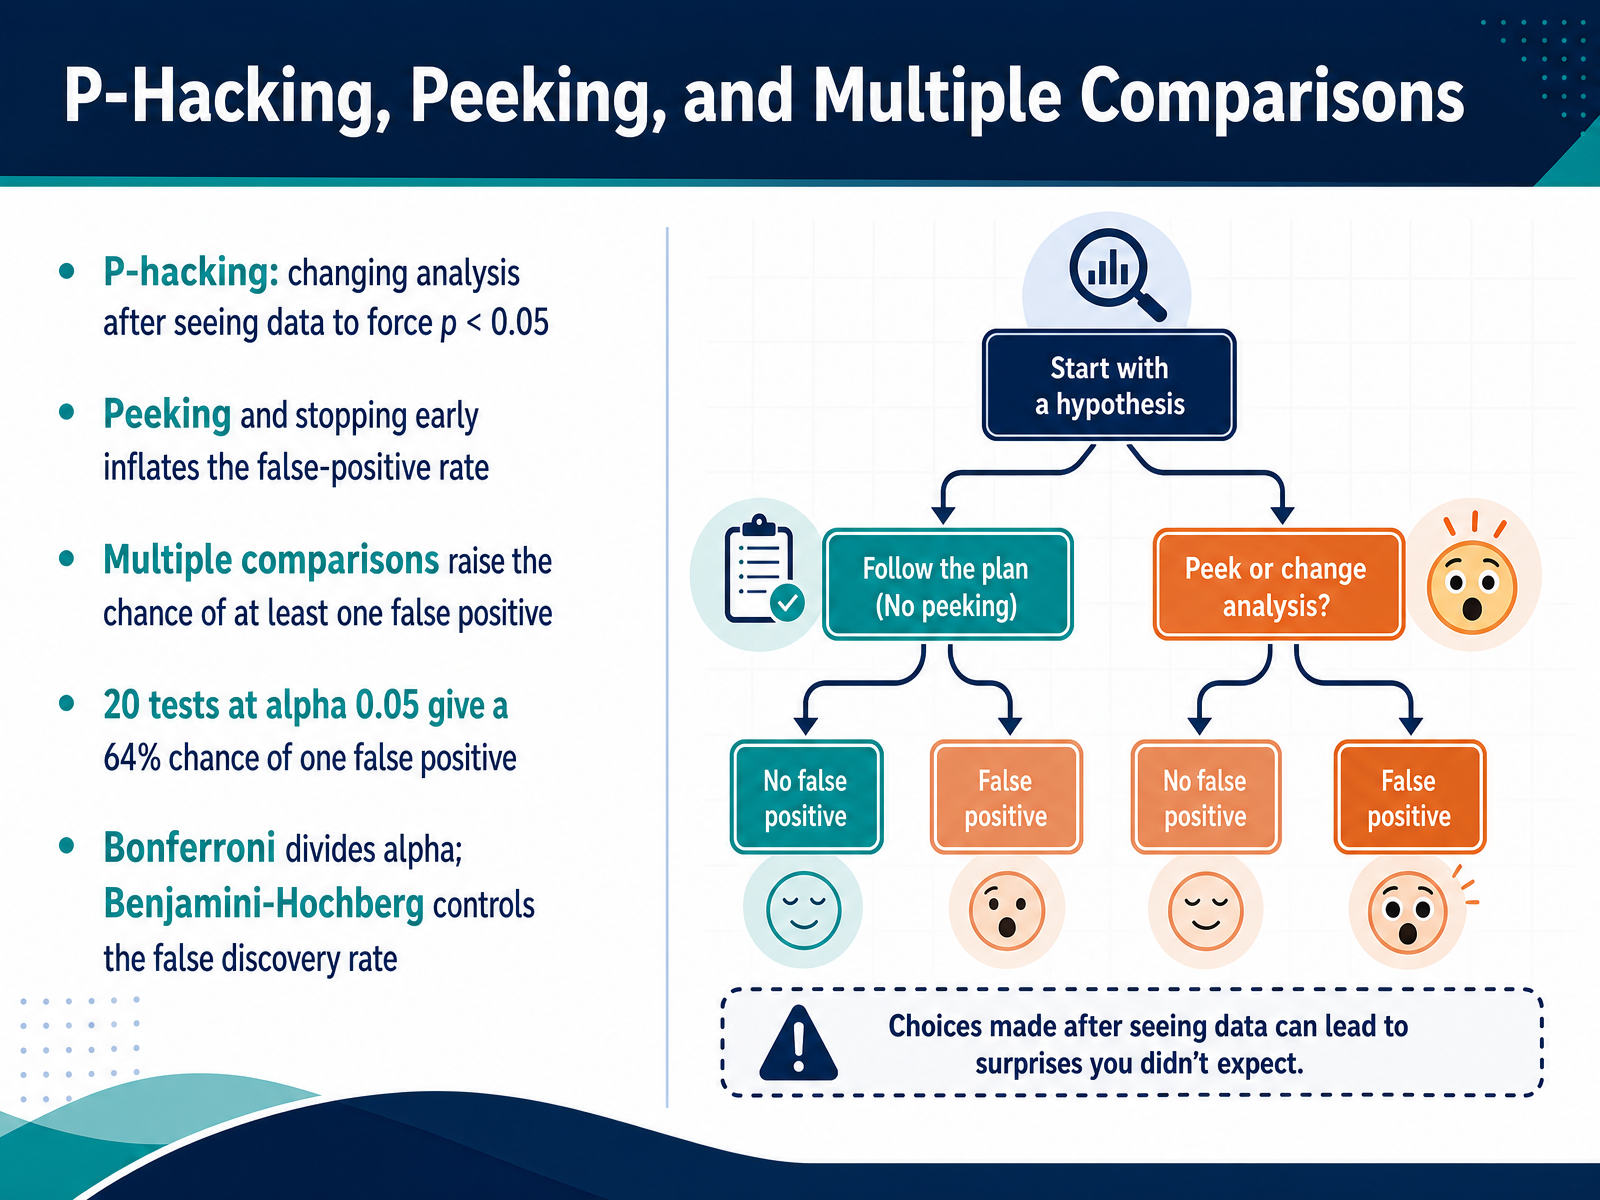
 - 11P-Hacking, Peeking, and Multiple ComparisonsNext, let's look at three habits that quietly break p-values. P-hacking means changing your analysis after seeing the data, just to force the p-value below point zero five. In plain terms, you keep adjusting the rules until the result looks significant. Peeking is similar. If you check the data early and stop the moment the p-value crosses the line, you inflate the chance of a false positive. And when you run many tests, each one carries that five percent risk. Run twenty tests at alpha point zero five, and the chance that at least one is a false positive jumps to about sixty-four percent. That is nearly two out of three. So what can you do? The Bonferroni correction divides your alpha by the number of tests, making each threshold stricter. The Benjamini-Hochberg method instead controls the false discovery rate, balancing sensitivity with control. Up next, we will cover practical reporting strategies for analysts.
 pubmed.ncbi.nlm.nih.govamstat.orgnature.com+22 min
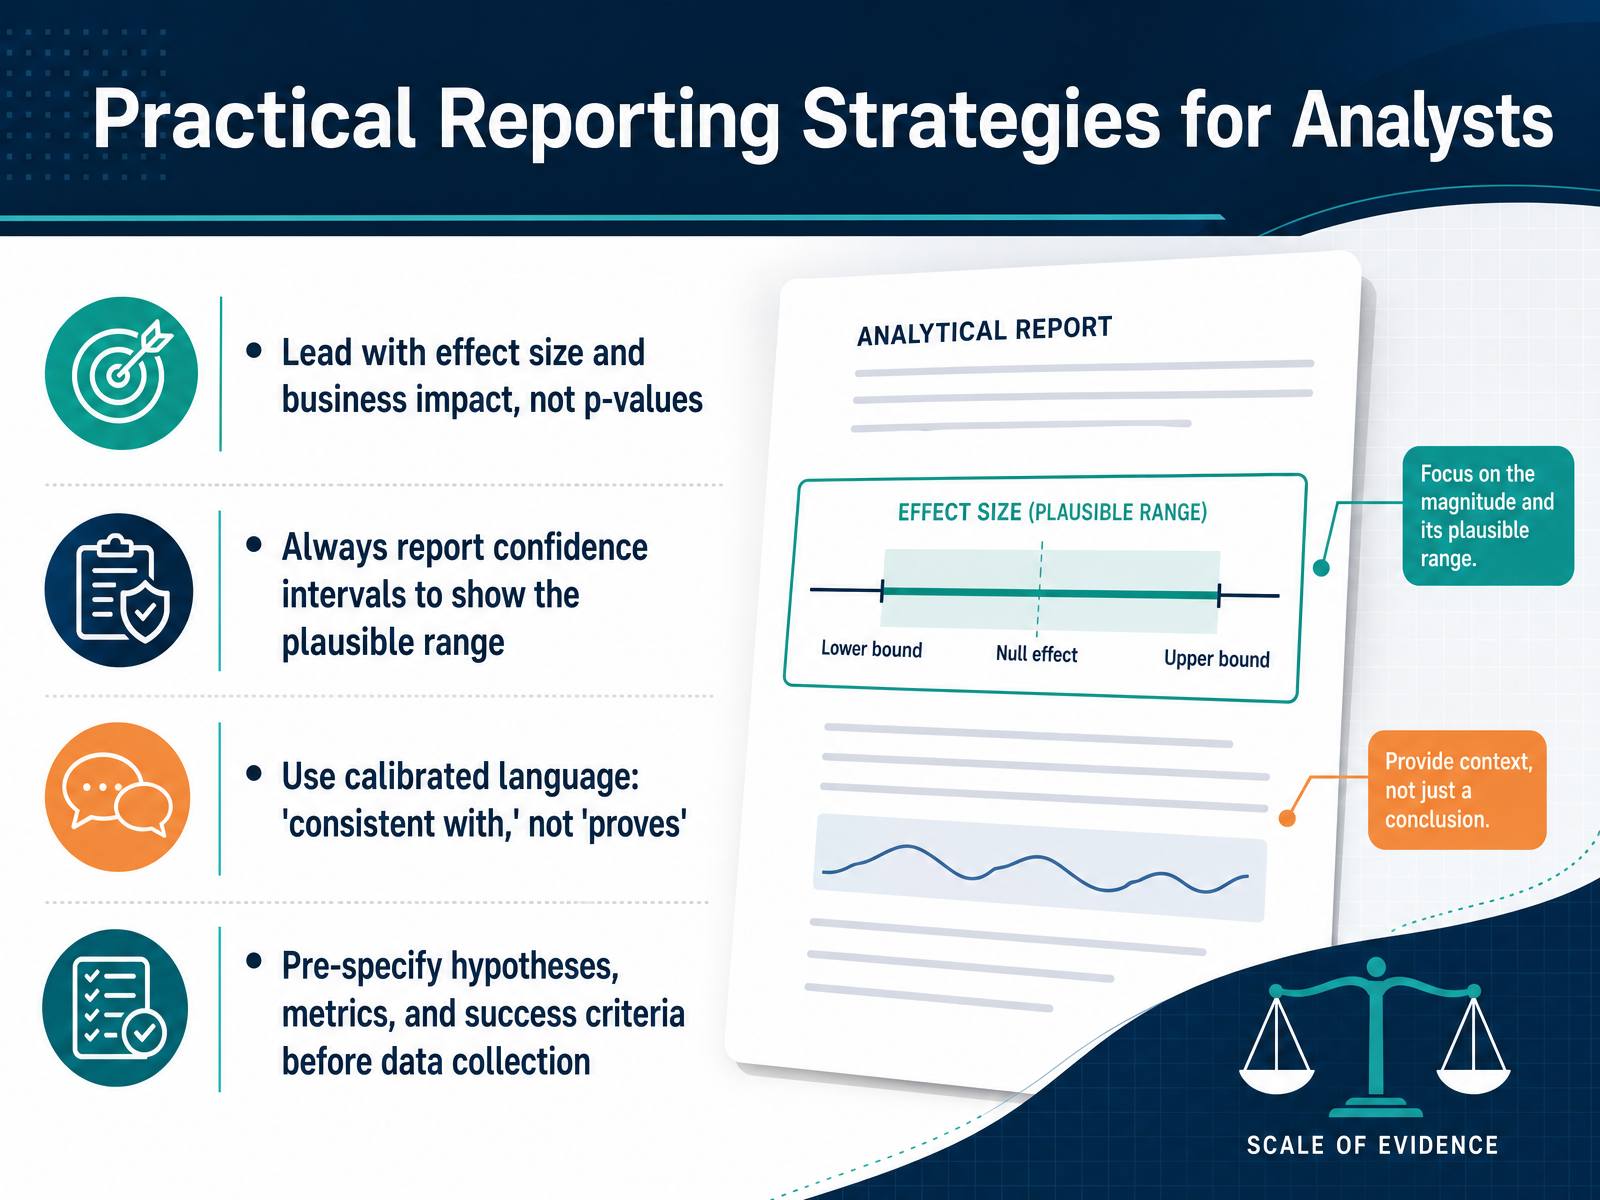
 - 12Practical Reporting Strategies for AnalystsNow let's talk about how to actually report these numbers to other people. The most important habit is to lead with the effect size and the business impact, not the p value. In other words, tell your stakeholders what changed and why it matters, before you mention any statistics. You should also always include a confidence interval, because that shows the plausible range of the effect, not just a single point estimate. For example, say the lift is five to fifteen percent, rather than just ten percent. Next, watch your language. Use phrases like consistent with or suggests, not proves or confirms. This keeps your claims honest and protects your credibility. Finally, pre specify your hypotheses, metrics, and success criteria before you collect data. This simple habit prevents p hacking and makes your results much easier to defend. So the takeaway is this: good reporting translates statistics into clear, decision ready language. Up next, we will walk through a practical decision checklist for reading any p value.
 statstest.commetricuno.commetricuno.com+12 min
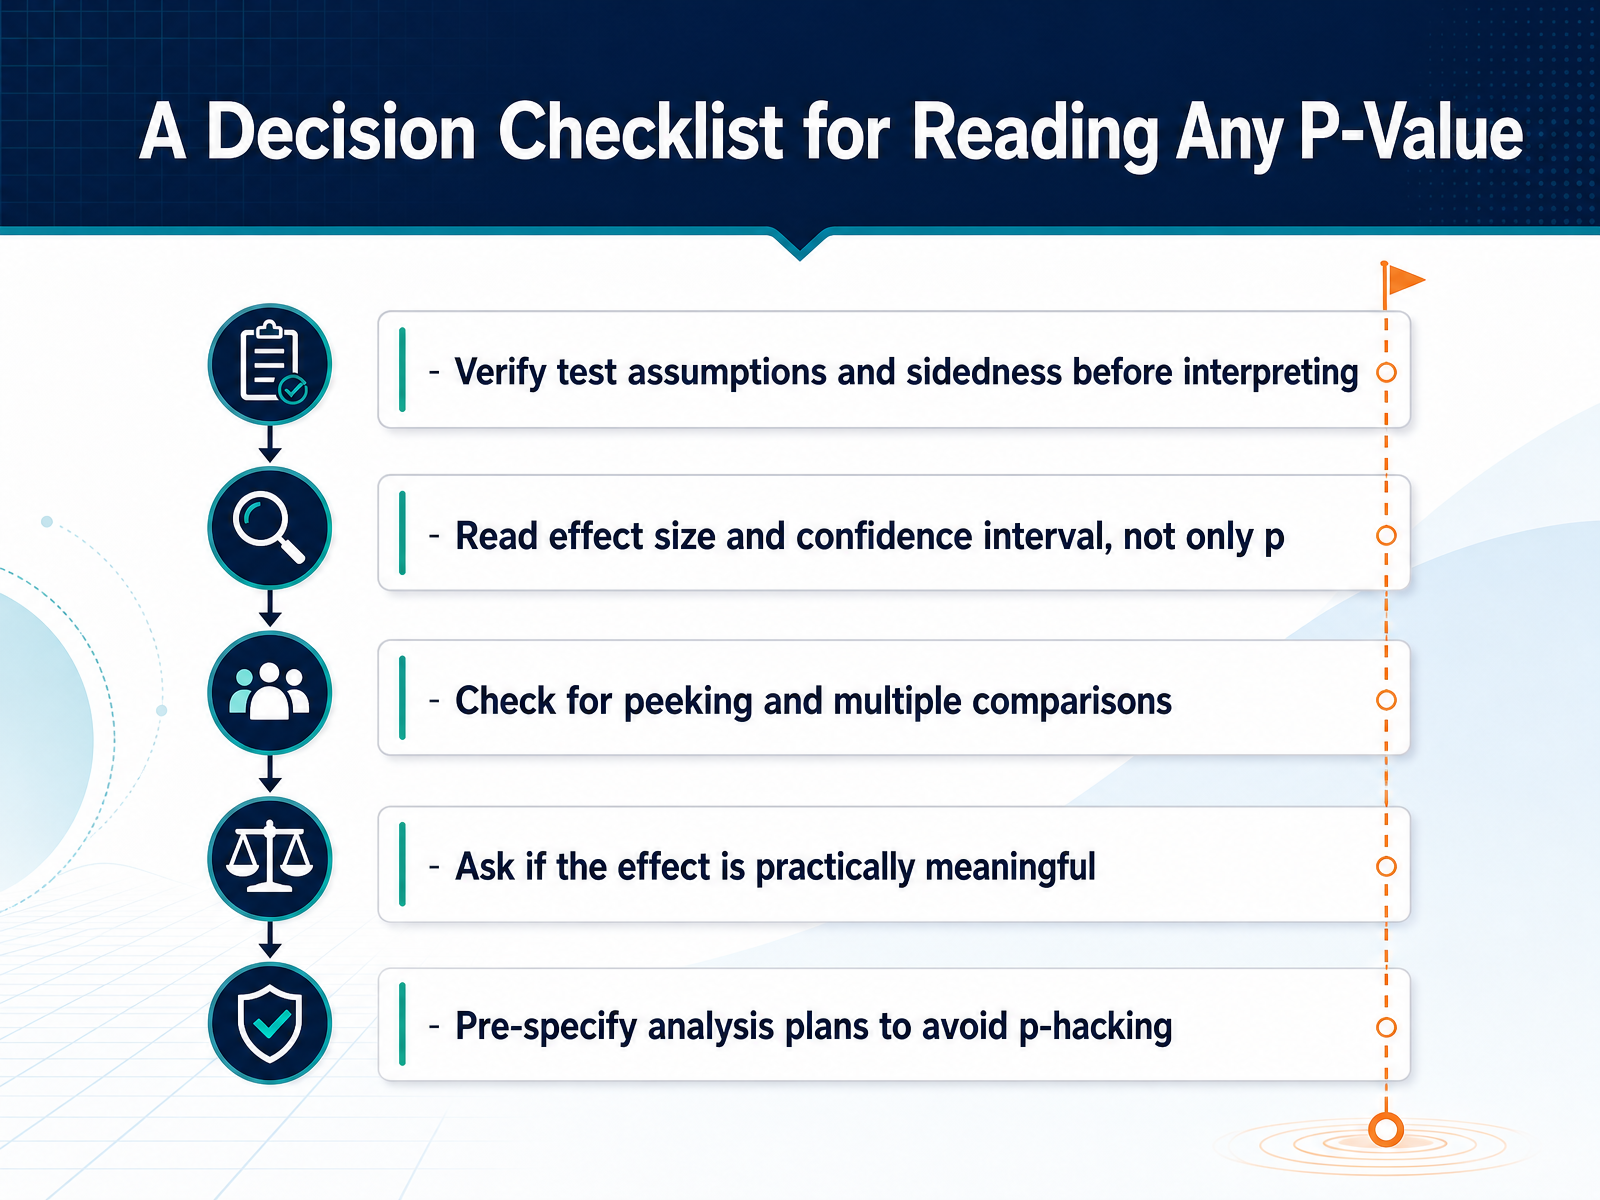
 - 13A Decision Checklist for Reading Any P-ValueNow let's put everything together into a simple checklist you can run through any time you see a p-value. First, before you interpret anything, confirm the test assumptions and whether it was one sided or two sided. A p-value is only meaningful when the underlying test actually fits the data. Second, look beyond the p-value itself. Read the effect size and the confidence interval, because the p-value tells you whether a result is unlikely under no effect, not how large or useful the effect is. Third, check for peeking and multiple comparisons. If someone looked at the data repeatedly or ran many tests, their p-value may be misleading. Fourth, ask whether the effect is practically meaningful. A tiny lift can be statistically significant and still not justify the cost of implementation. Finally, pre-specify your analysis plan before collecting data. This protects against p-hacking and keeps your conclusions credible. So whenever you read a p-value, treat it as one piece of evidence, not a final verdict. Let's move to the final slide for a brief summary and next steps.
 statstest.commetricuno.commetricuno.com+22 min
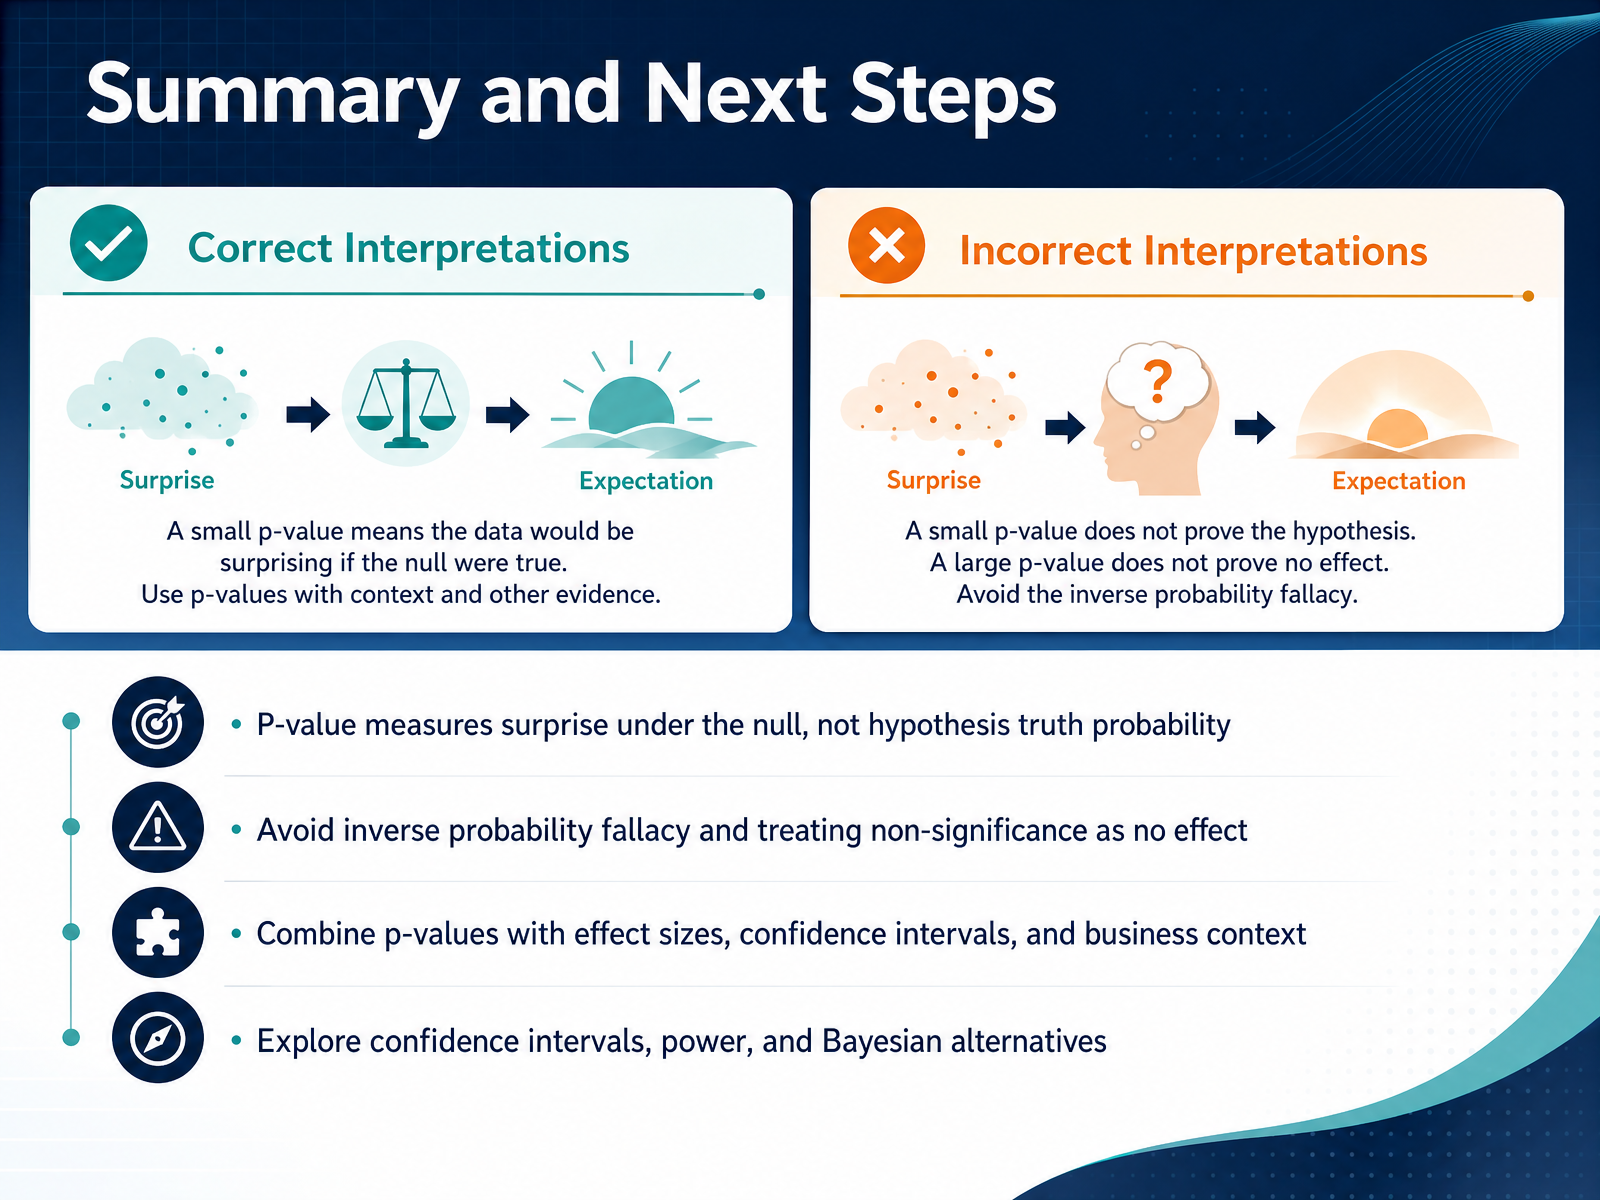
 - 14Summary and Next StepsLet's tie everything together with the key takeaways before you go. First, remember what a p-value really measures. It is the surprise factor in your data, assuming the null hypothesis is true. So what does this actually mean? It does not tell you the probability that your hypothesis is true or false. That is the inverse probability fallacy, and avoiding it will save you from a lot of statistical heartache. Second, do not treat a non-significant result as proof of no effect. It usually just means the data was not strong enough to detect a difference. When you make a decision, do not stop at the p-value. Pair it with the effect size and a confidence interval to understand the magnitude and precision of your result. In a business context, ask if the effect is practically significant, not just statistically significant. A tiny lift might be a fluke, but a statistically significant five percent increase in conversion could be a real win. To keep growing, explore confidence intervals, statistical power, and Bayesian alternatives. These tools will make you a more thoughtful analyst. You now have a solid foundation. Thank you for learning with me, and good luck with your analysis.
 pubmed.ncbi.nlm.nih.govpmc.ncbi.nlm.nih.govstatisticsdonewrong.com+22 min
Take the deck with you
Download this course as a file — free, no sign-up needed.
- PDF handoutEvery slide page, ready to print or share.15 pages · 3.5 MBDownload
- Narrated PowerPointThe deck that presents itself — every slide carries the digital human's narration video.15 pages · 15.1 MBDownload
- PowerPoint slidesThe full deck as a .pptx — open it in PowerPoint, Keynote, or Google Slides.15 pages · 3.4 MBDownload
Free to use in your own training — please keep the PersonWise credit page at the end.
Have your own deck? Turn it into a course
Sources consulted
Web sources consulted while building this course.
- What Is a P-Value? Worked by Shuffling Nine Real Orders 126 Ways — Analyst Prep Kit — michaelnocito.github.io
- P-Values Explained for A/B Testing (Without the PhD) | Atticus Li — atticusli.com
- What Is a P Value? Definition & Mistakes — CASRAI — casrai.org
- P-Values in A/B Testing: Definition & How to Read Them — metricuno.com
- P-Value Interpretation: A Step-by-Step Guide | Growthbook — growthbook.io
- Understanding Null Hypothesis Testing – Research Methods in Psychology — kpu.pressbooks.pub
- Hypothesis Testing: Uses, Steps & Example - Statistics By Jim — statisticsbyjim.com
- 13.1 Understanding Null Hypothesis Testing – Research Methods in Psychology — opentext.wsu.edu
- Null hypothesis significance testing: a short tutorial - PMC - NIH — pmc.ncbi.nlm.nih.gov
- 10 Hypothesis Testing – STAT 100 | Statistical Concepts and Reasoning — online.stat.psu.edu
- Statistical tests, P values, confidence intervals, and power: a guide to misinterpretations — pubmed.ncbi.nlm.nih.gov
- Misinterpretations of P-values and statistical tests persists ... — pmc.ncbi.nlm.nih.gov
- The p value and the base rate fallacy — Statistics Done Wrong — statisticsdonewrong.com
- P-Values, Error Rates, and False Positives - Statistics By Jim — statisticsbyjim.com
- American Statistical Association Releases Statement on Statistical Significance and P-Values — amstat.org
- The tyranny of the p: when significance misleads - Nature — nature.com
- 2026 | What is a p‑value? An expert explains the most misunderstood number in science - University of Wollongong – UOW — uow.edu.au
- 5 Common Mistakes When Interpreting P-Values (And How to Avoid Them) — statology.org
- Reporting Templates: Stakeholder Language Without Overclaiming | StatsTest Blog — statstest.com
- Experiment Reporting: A Practical Guide for CRO Teams — metricuno.com