Begin
14 pages · ~28 min
Data Science Maturity Models
A concise overview of data science maturity models for analytics professionals, explaining stages, assessment criteria, and how to evaluate and advance organizational data science capabilities.
A digital instructor presents all 14 pages. Hold “Ask” at any point and ask out loud — the answer comes from this course. No sign-up needed.
What you’ll learn
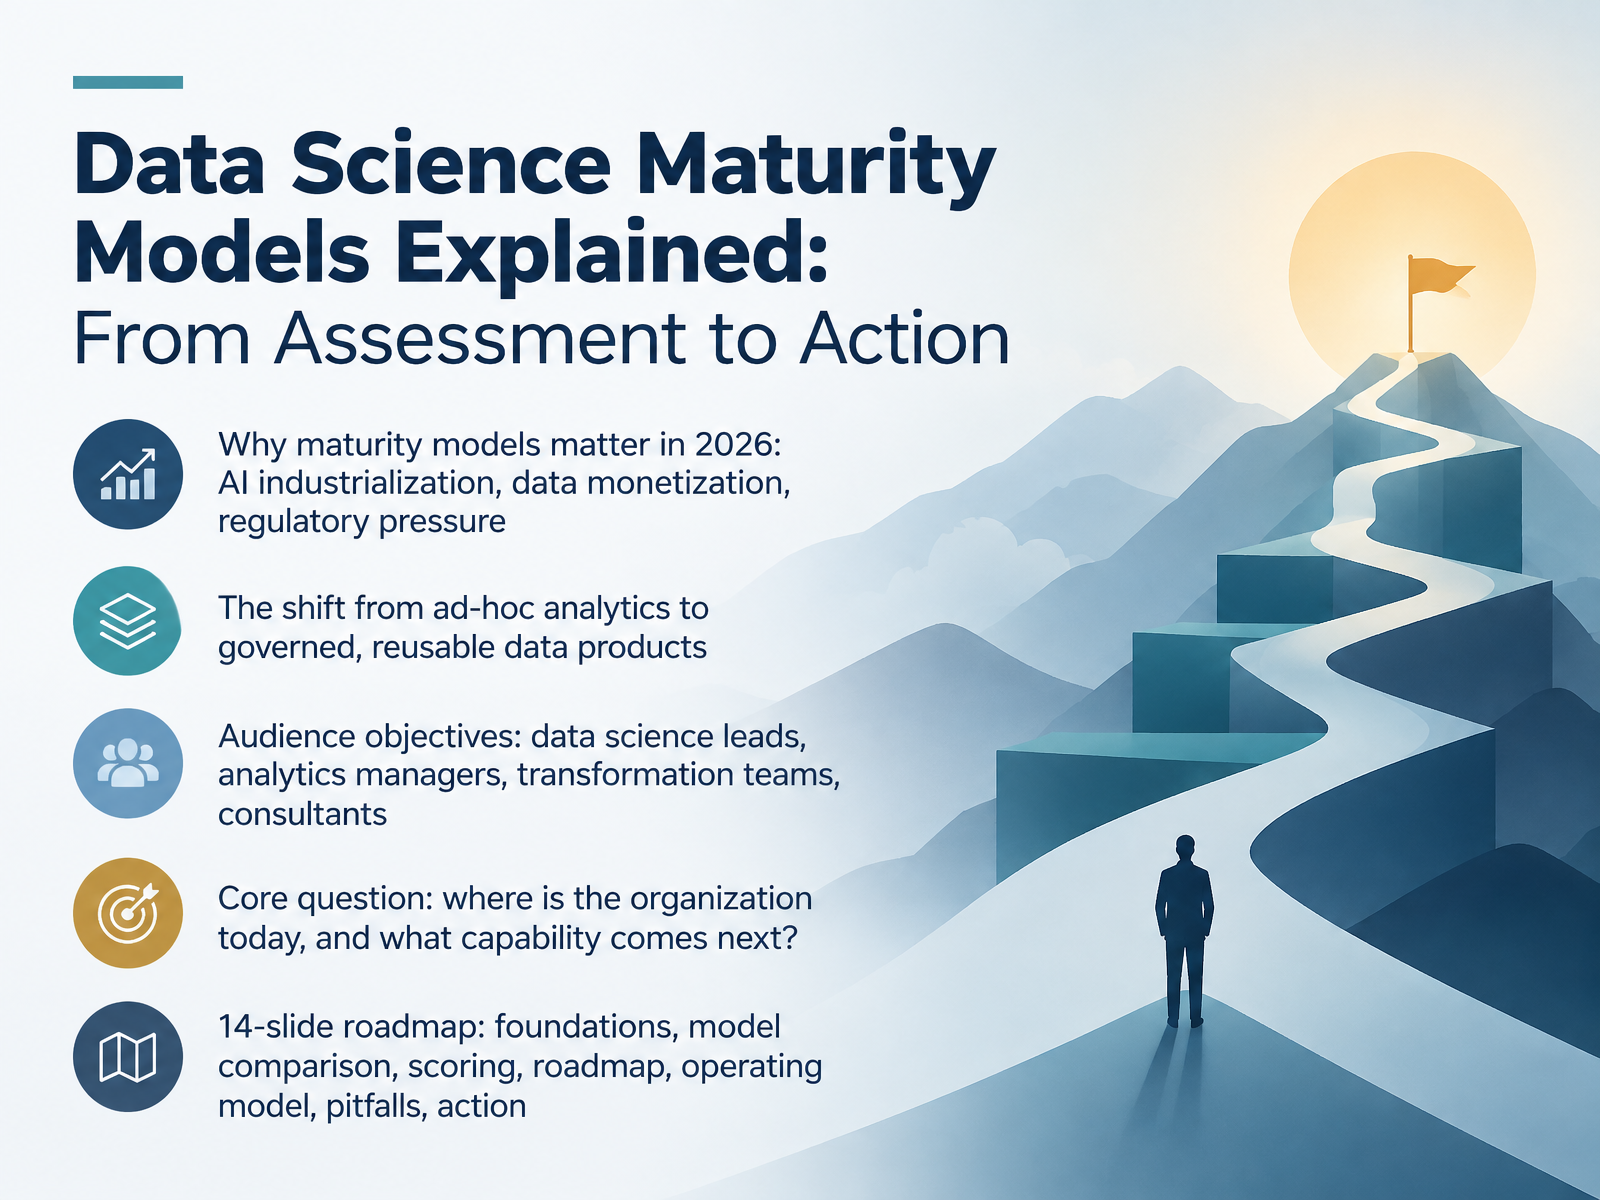
- 01Data Science Maturity Models Explained: From Assessment to ActionWelcome. I'm glad you're here. Over the next fourteen slides, we'll work through one practical question: where is your organization today, and what capability comes next? This is for data science leads, analytics managers, transformation teams, and consultants who need to benchmark capability, diagnose gaps, and justify the next stage of investment. So let's start with why maturity models matter in twenty twenty-six. Three pressures are converging: AI industrialization, meaning the shift from pilots to reliable, repeatable systems; data monetization, where data must earn its place on the balance sheet; and regulatory pressure, which turns governance from a checkbox into a license to operate. Underneath all three sits a deeper shift, from ad hoc analytics to governed, reusable data products. Across this course we'll cover foundations, model comparison, scoring, roadmap, operating model, pitfalls, and action. My goal is simple: by the end, you should be able to place your team on the model and name the single next capability worth funding. Let's begin with why these models exist and what they solve.oracle.comdoi.orggartner.com+21 min
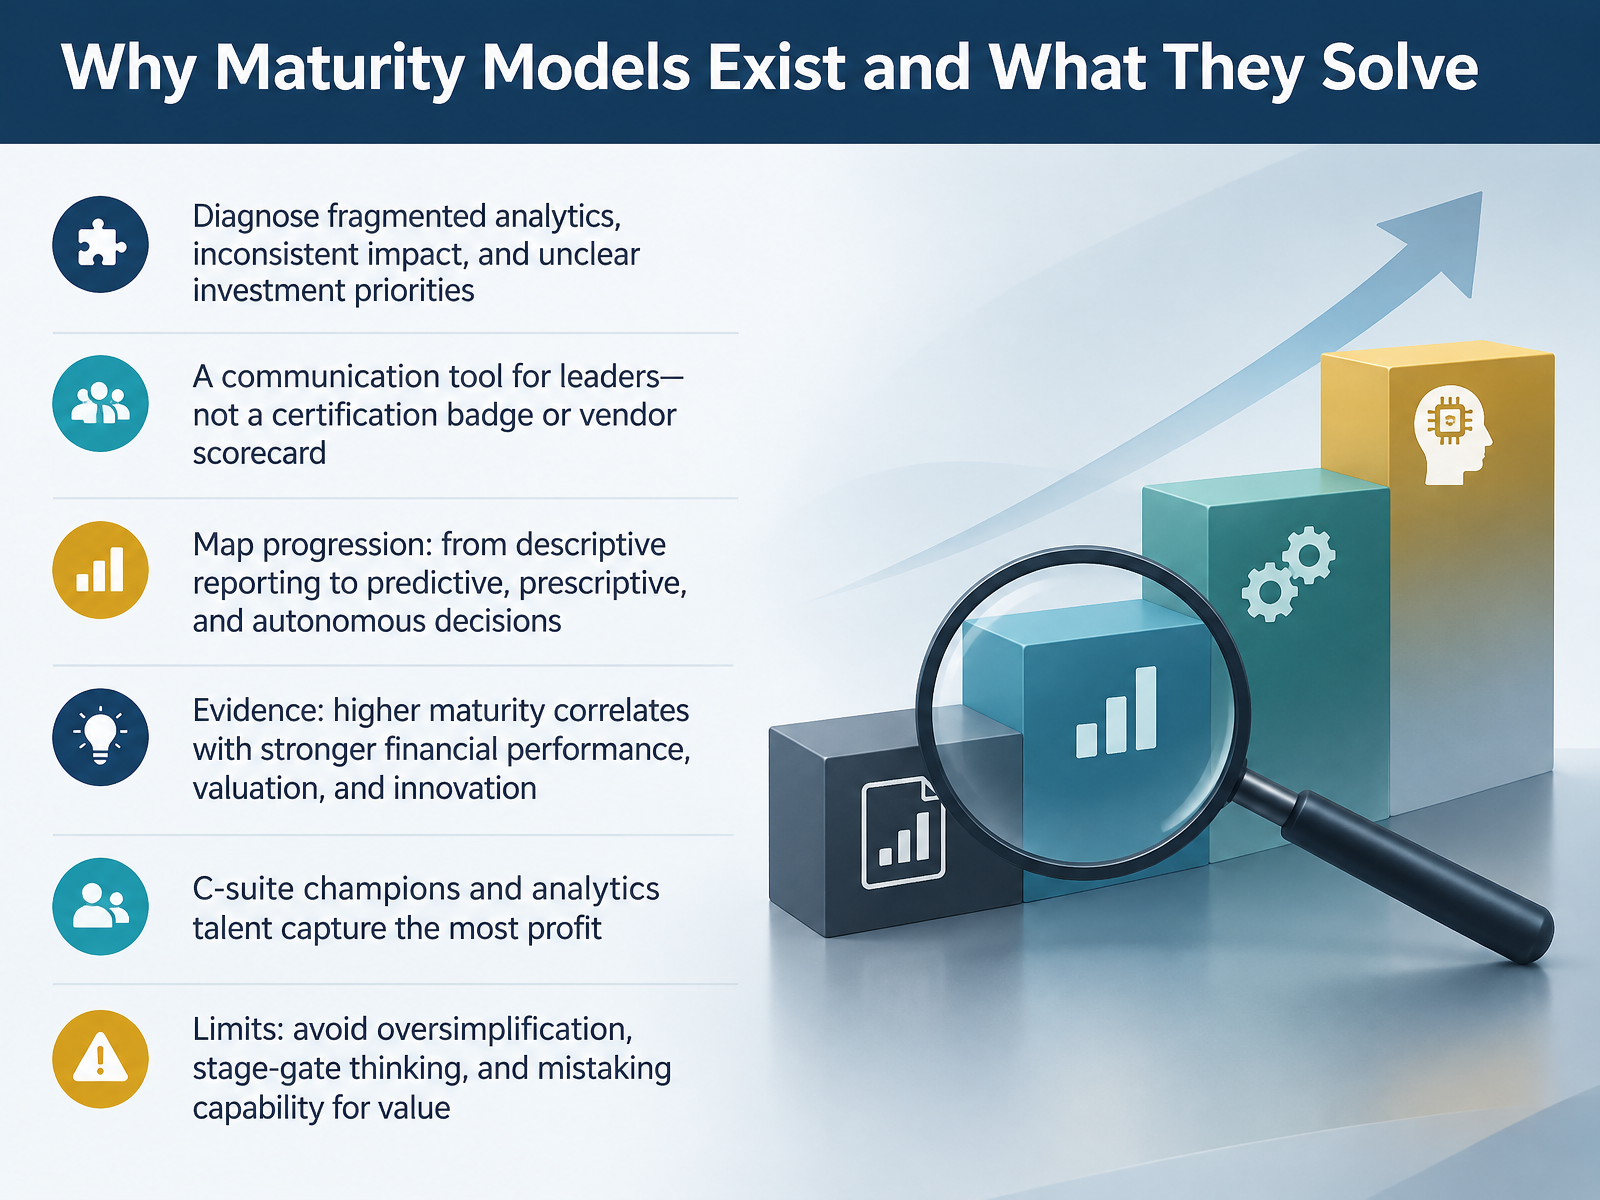
- 02Why Maturity Models Exist and What They SolveLet's talk about why maturity models exist, and what they actually solve. As data science leads and analytics managers, you're often asked to explain fragmented reporting, inconsistent impact, and unclear investment priorities. A maturity model gives you a shared language for that diagnosis. It's a communication tool for leaders, not a certification badge or a vendor scorecard. The progression is practical: from descriptive reporting, to predictive, prescriptive, and eventually autonomous decisions. And the evidence is encouraging. The IIA study found that higher maturity correlates with stronger financial performance, valuation, and innovation. The same study found organizations with C-suite champions and strong analytics talent capture the most profit, with the most mature firms significantly outperforming less mature peers on market valuation. But keep the limits in view. Avoid oversimplifying, avoid rigid stage-gate thinking, and never mistake capability for realized value. So the takeaway is this: use the model to benchmark honestly, then target the next stage where your constraints actually sit. That leads us into the model landscape, a comparative map of major frameworks.
 pages.dataiku.comdoi.orgmbs.edu+22 min
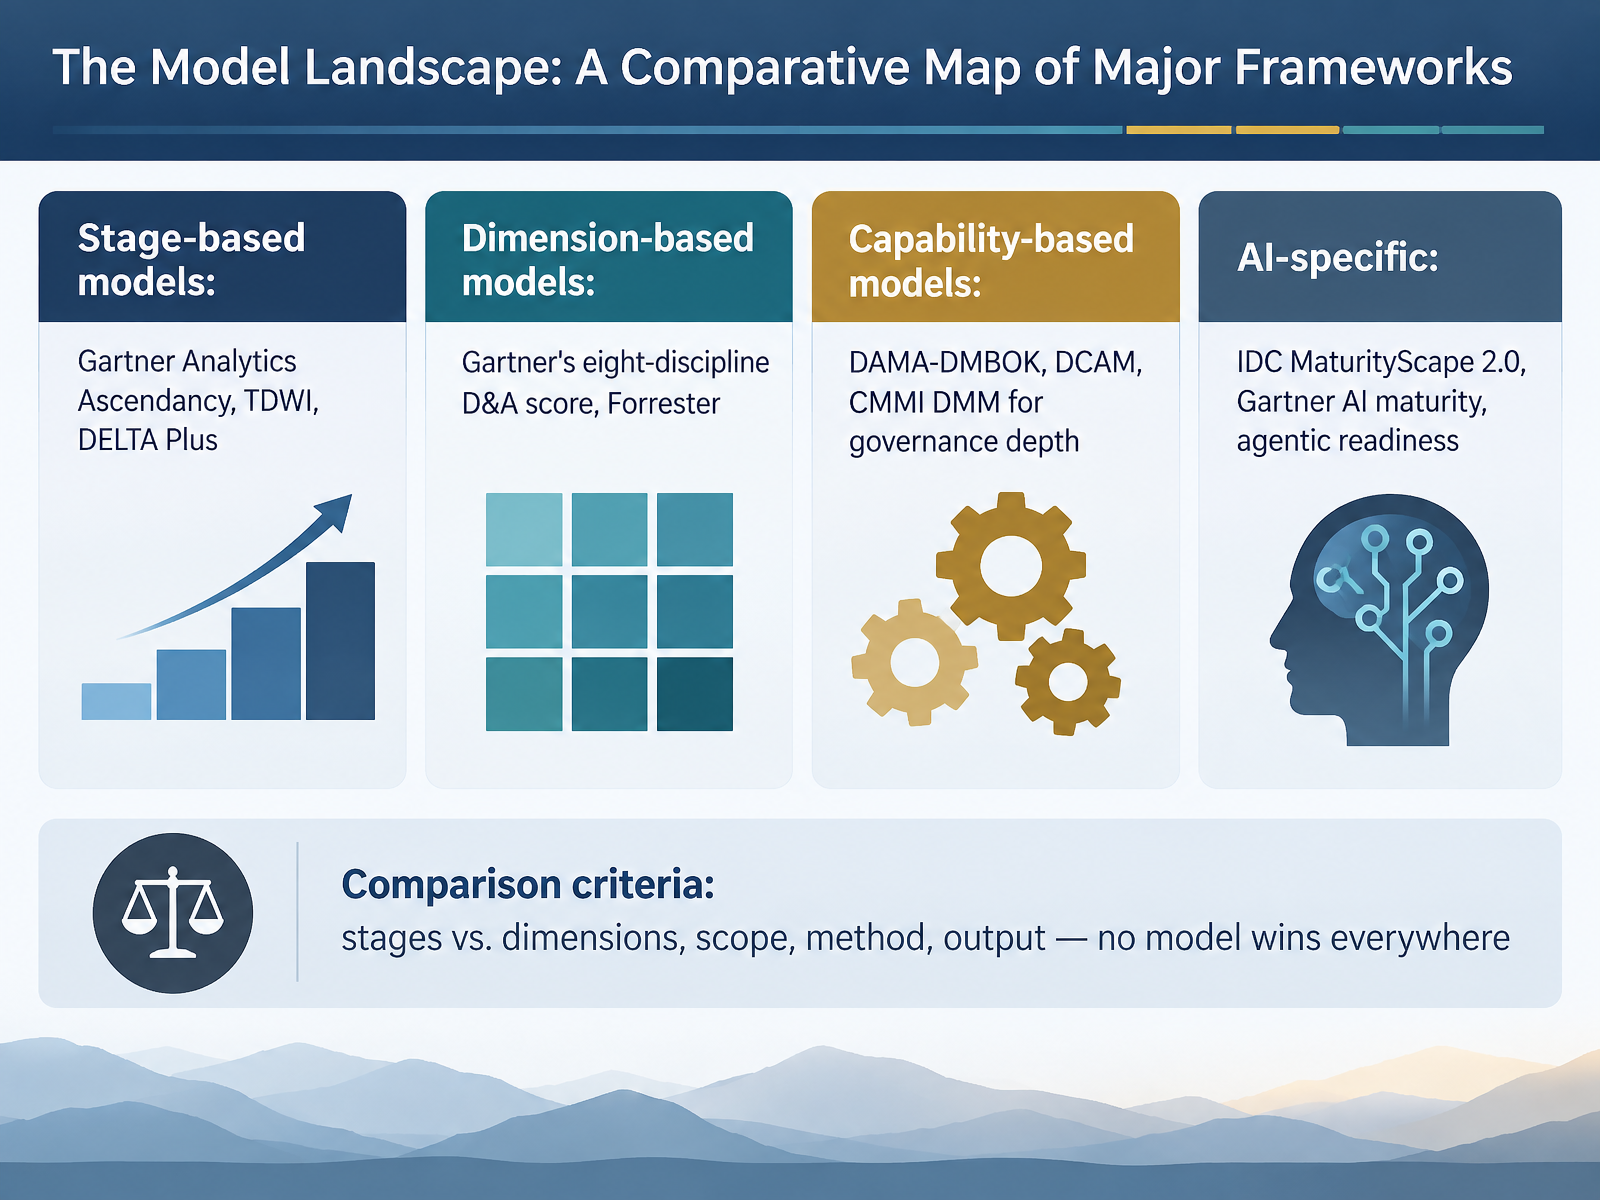
- 03The Model Landscape: A Comparative Map of Major FrameworksLet's move on to the model landscape, and how to compare the major frameworks without getting lost in branding. Broadly, they fall into four families. First, stage-based models, like Gartner Analytics Ascendancy, T D W I, and DELTA Plus. These walk you up a ladder from descriptive to prescriptive, and they're useful for communicating progress to executives. Second, dimension-based models, such as Gartner's eight-discipline data and analytics score, and Forrester's approach. These assess breadth across strategy, governance, talent, and technology, so you get a profile rather than a single level. Third, capability-based models, including DAMA-DMBOK, DCAM, and CMMI's data management maturity model. These go deep on governance, lineage, and controls, which is exactly what regulators and auditors ask for. Fourth, AI-specific models, like IDC MaturityScape 2.0, Gartner's AI maturity work, and emerging agentic readiness assessments. Compare them on four criteria: stages versus dimensions, scope, method, and output. No single model wins everywhere. Next, we'll look at what actually gets assessed: the core dimensions.
 oracle.comdoi.orggartner.com+22 min
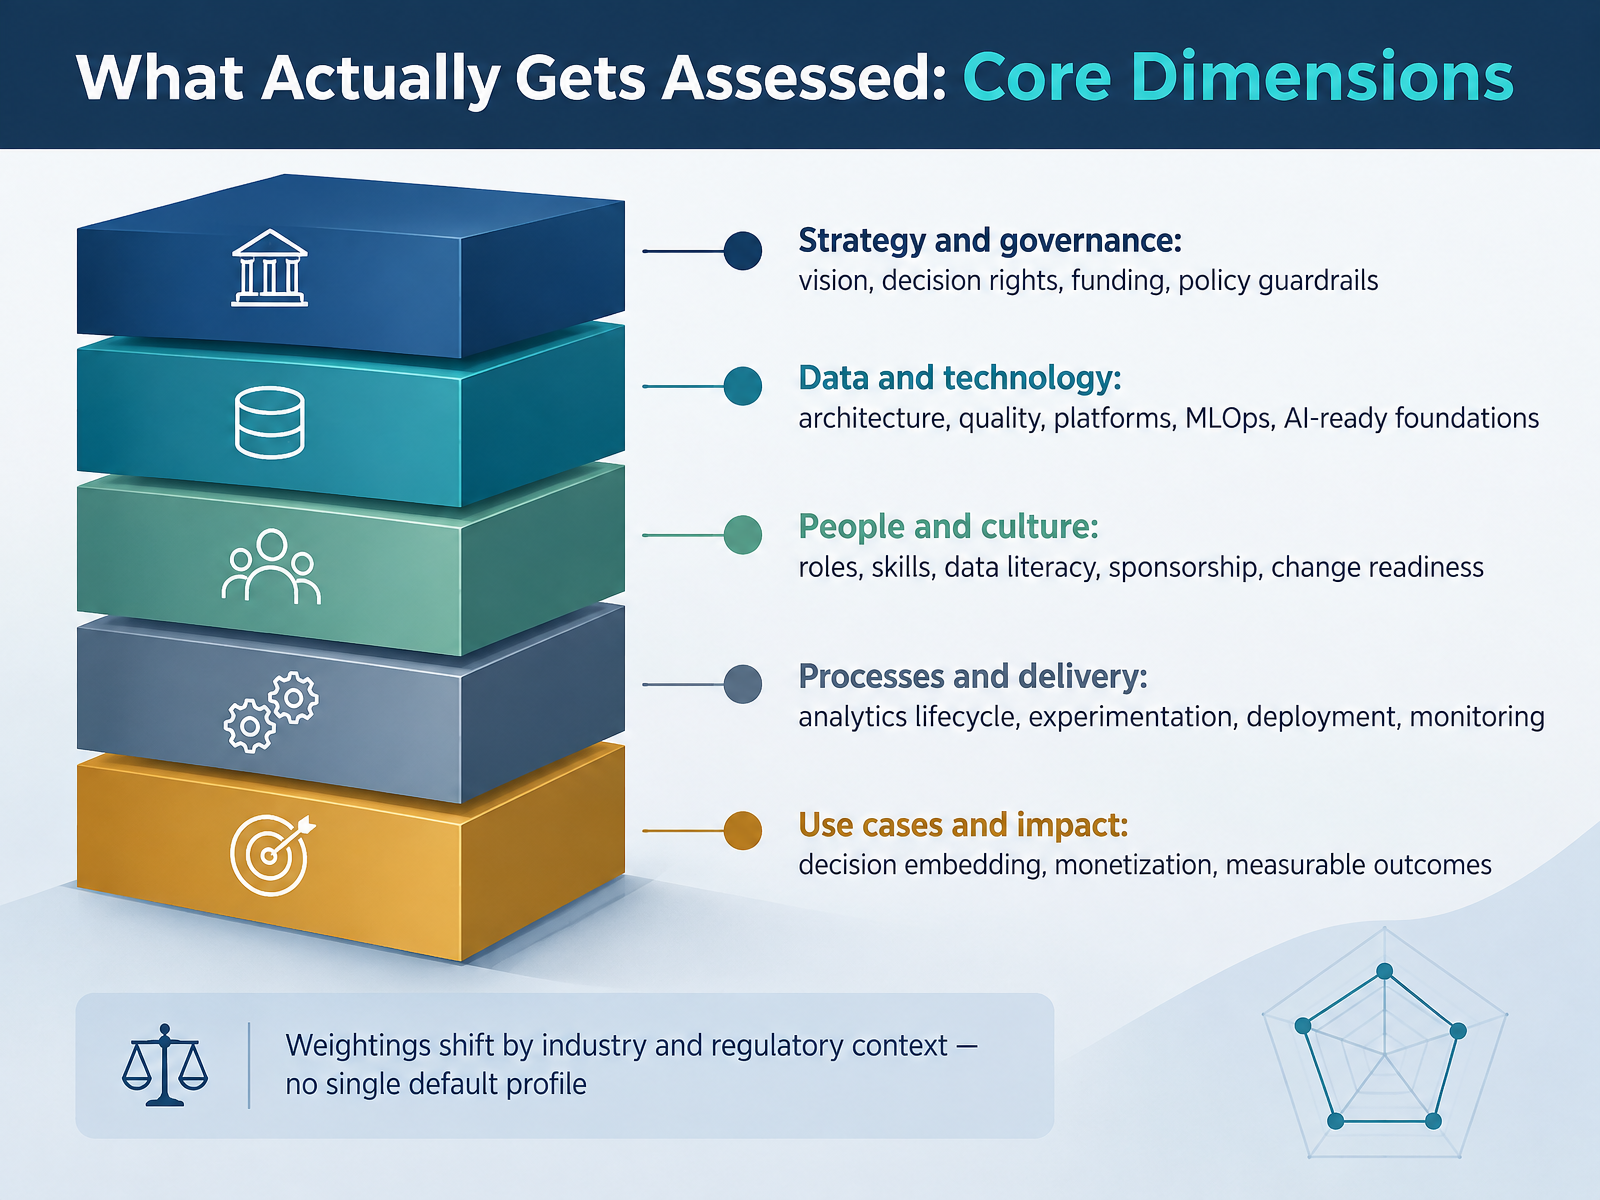
- 04What Actually Gets Assessed: Core DimensionsSo what actually gets assessed? Most credible models converge on five core dimensions. First, strategy and governance: the vision, who holds decision rights, how funding flows, and what policy guardrails exist. Second, data and technology: architecture, data quality, platforms, MLOps, and AI-ready foundations. Third, people and culture: defined roles, skills, data literacy, executive sponsorship, and genuine change readiness. Fourth, processes and delivery: the analytics lifecycle from experimentation through deployment and ongoing monitoring. Fifth, use cases and impact: whether insight is truly embedded in decisions, monetized, and tied to measurable outcomes. Here is your key takeaway. These dimensions are not equally weighted. Industry and regulatory context shift the emphasis. A bank will weight governance and traceability heavily; a consumer platform may weight experimentation and speed. So before you score anything, agree on your weighting profile. That prevents a generic benchmark from distorting your investment case. Next, we move from dimensions to levels, with Stage Definitions: What Changes Between Levels.
 go.tdwi.organalyticsmaturity.informs.orglink.springer.com+22 min
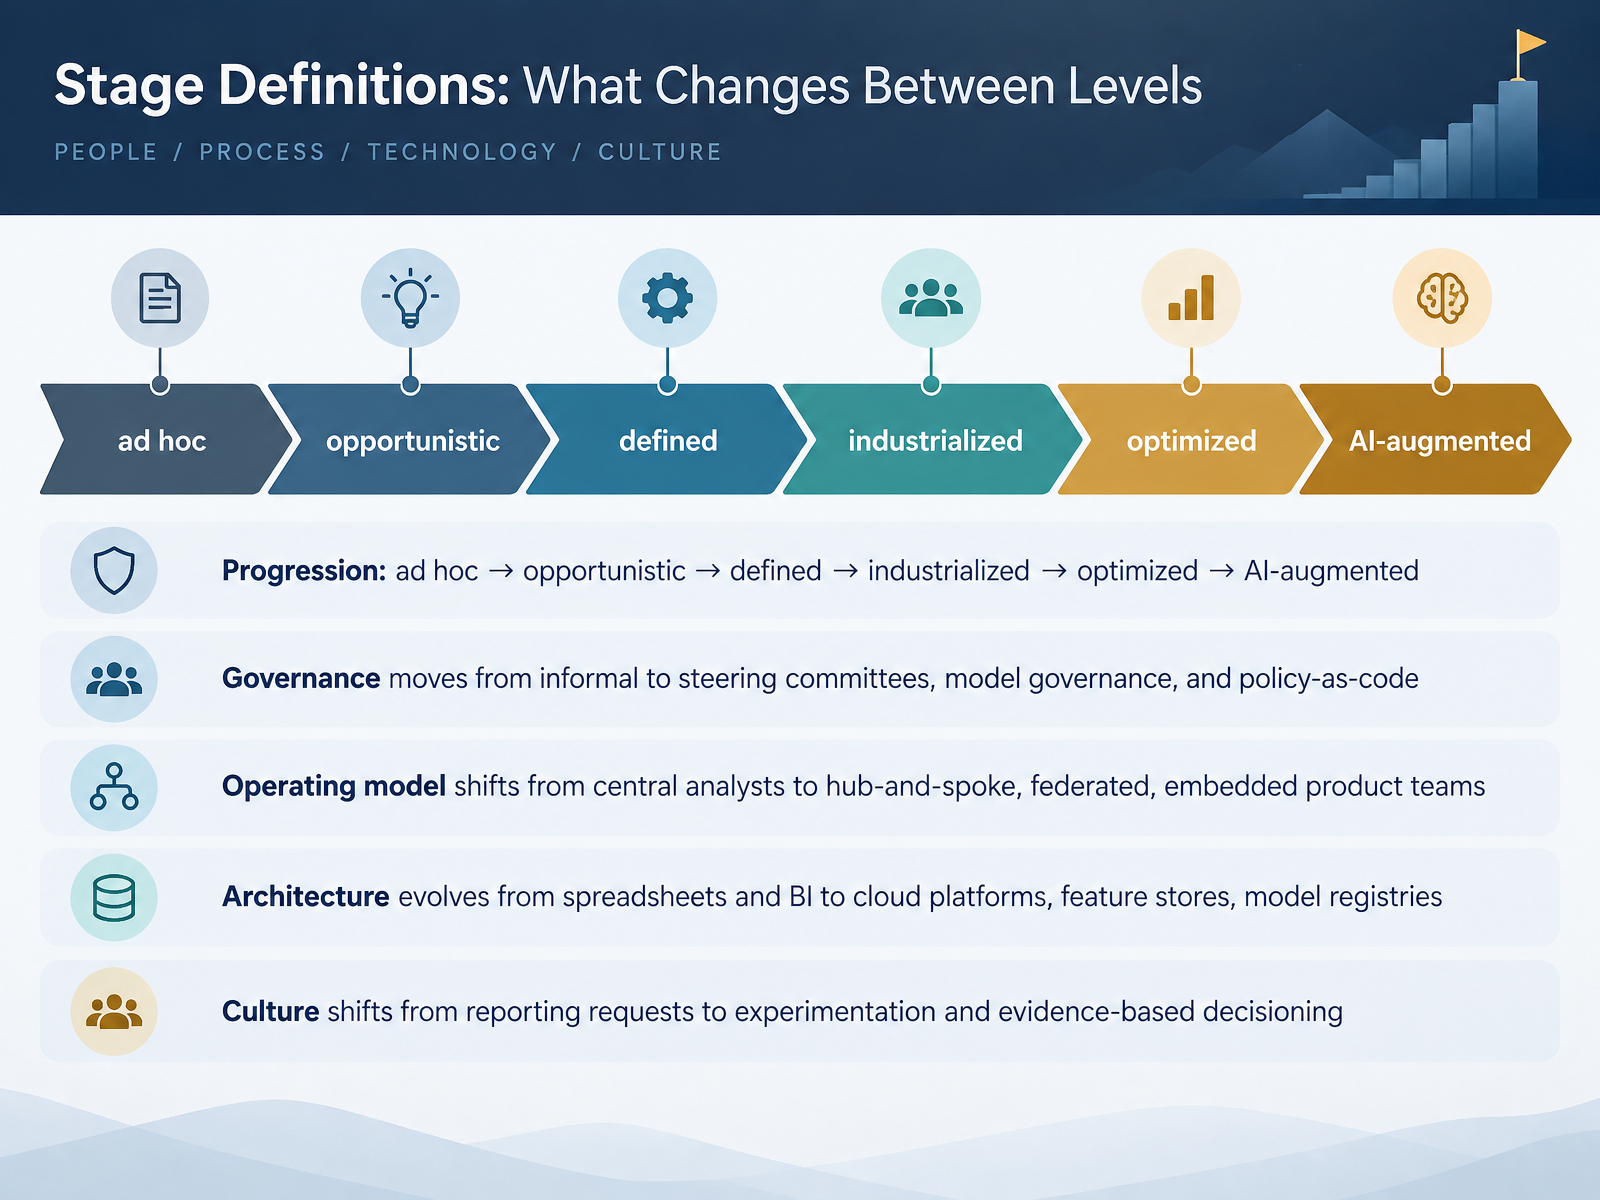
- 05Stage Definitions: What Changes Between LevelsLet's walk through the stages themselves, and more importantly, what actually changes as you move up. The progression runs from ad hoc, to opportunistic, to defined, to industrialized, to optimized, and finally to AI-augmented. Don't treat those as labels. Treat them as shifts in four things you can observe. First, governance. Early on, it's informal, whoever owns the data decides. Later, you get steering committees, model governance, and eventually policy as code. Second, operating model. You move from a central pool of analysts to a hub-and-spoke or federated structure, and eventually to embedded product teams. Third, architecture. Spreadsheets and BI give way to cloud platforms, feature stores, and model registries. Fourth, culture. The shift is from taking reporting requests to running experiments and making evidence-based decisions. Notice that technology alone never moves you a stage. Governance and operating model usually do. Next, let's look at where most organizations actually stand in 2026.
 go.tdwi.organalyticsmaturity.informs.orglink.springer.com+22 min
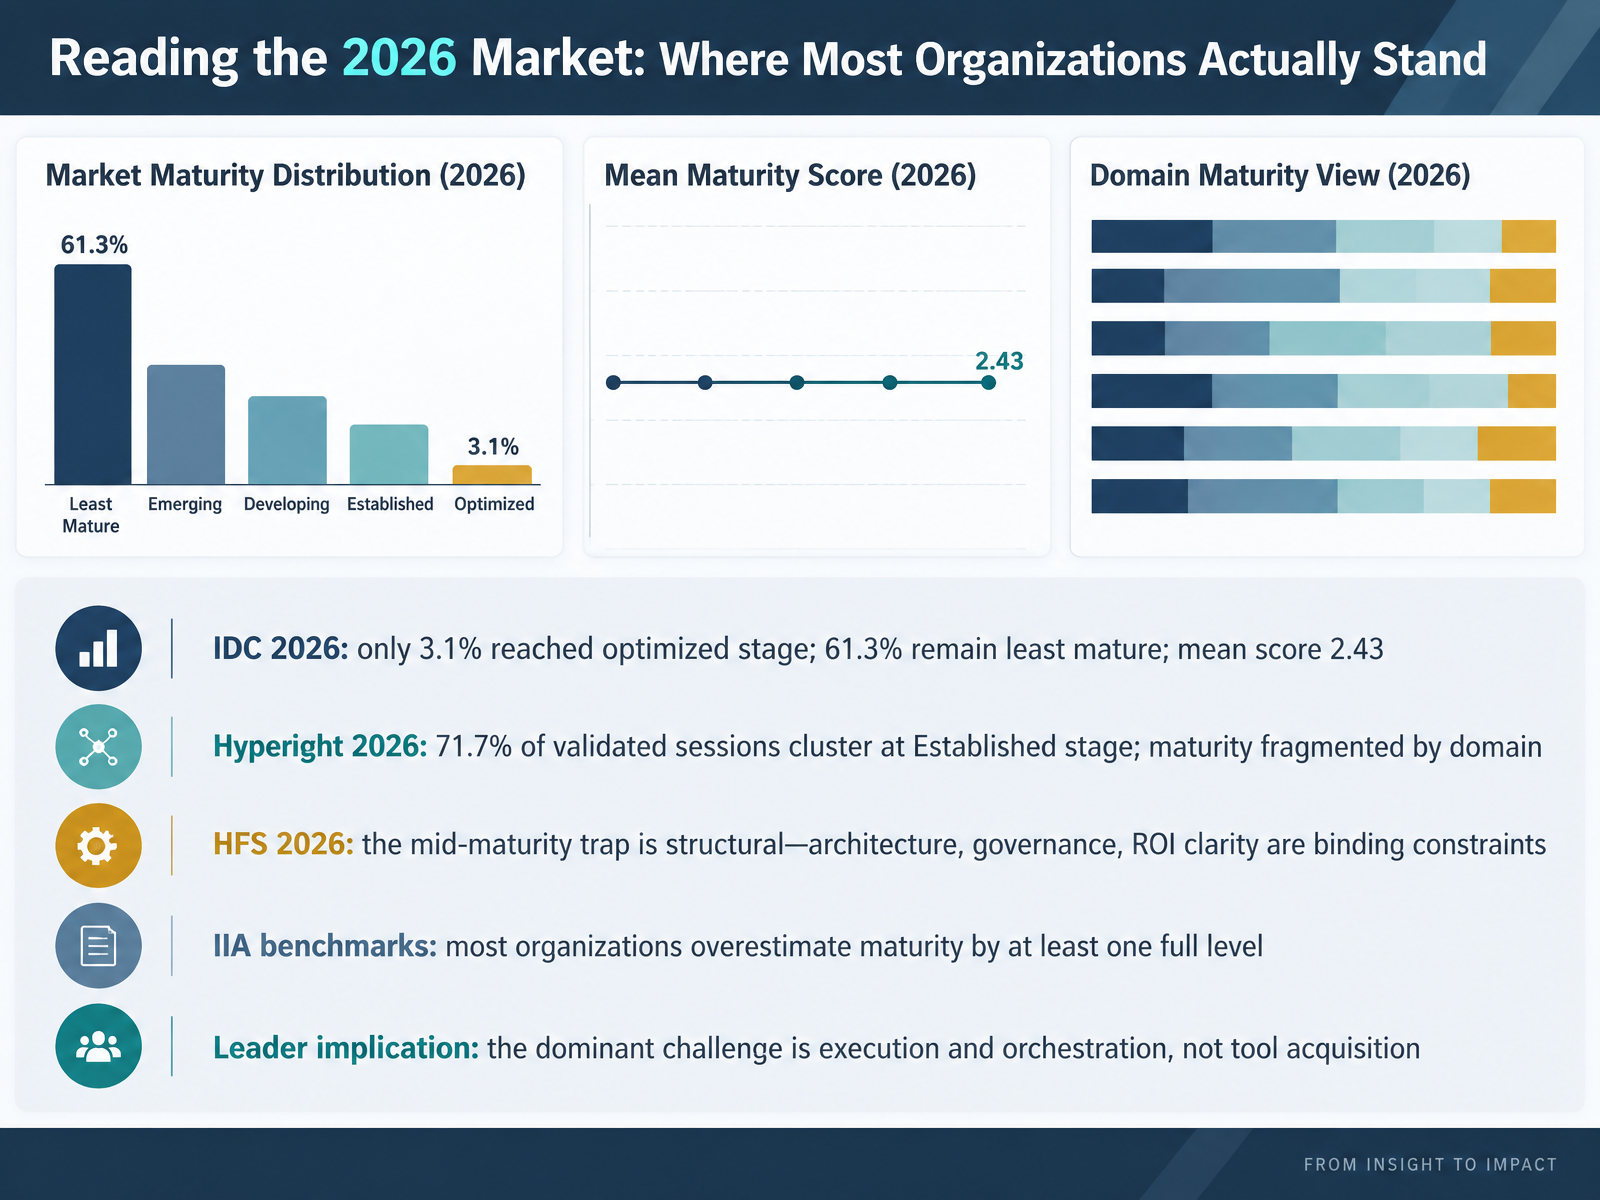
- 06Reading the 2026 Market: Where Most Organizations Actually StandLet's ground this in what the 2026 data actually shows. IDC surveyed nineteen hundred organizations and found only three point one percent reached the optimized stage. Sixty one percent sit in the two least mature stages. The worldwide mean score was two point four three, barely up from two point three nine the year before. Hyperight's research tells a similar story. About seventy two percent of validated sessions clustered at the Established stage, and maturity is fragmented by domain. You might have strong experimentation in one area and unresolved data quality in another. HFS calls this the mid-maturity trap, and they argue it is structural. Architecture, governance, and ROI clarity are the binding constraints, not tooling. And here is the uncomfortable part. IIA benchmarks show most organizations overestimate their maturity by at least one full level. So when you look at your own team, the dominant challenge is execution and orchestration, not tool acquisition. Next, we turn to the methods and instruments for running a maturity assessment.
 oracle.comdoi.orggartner.com+21 min
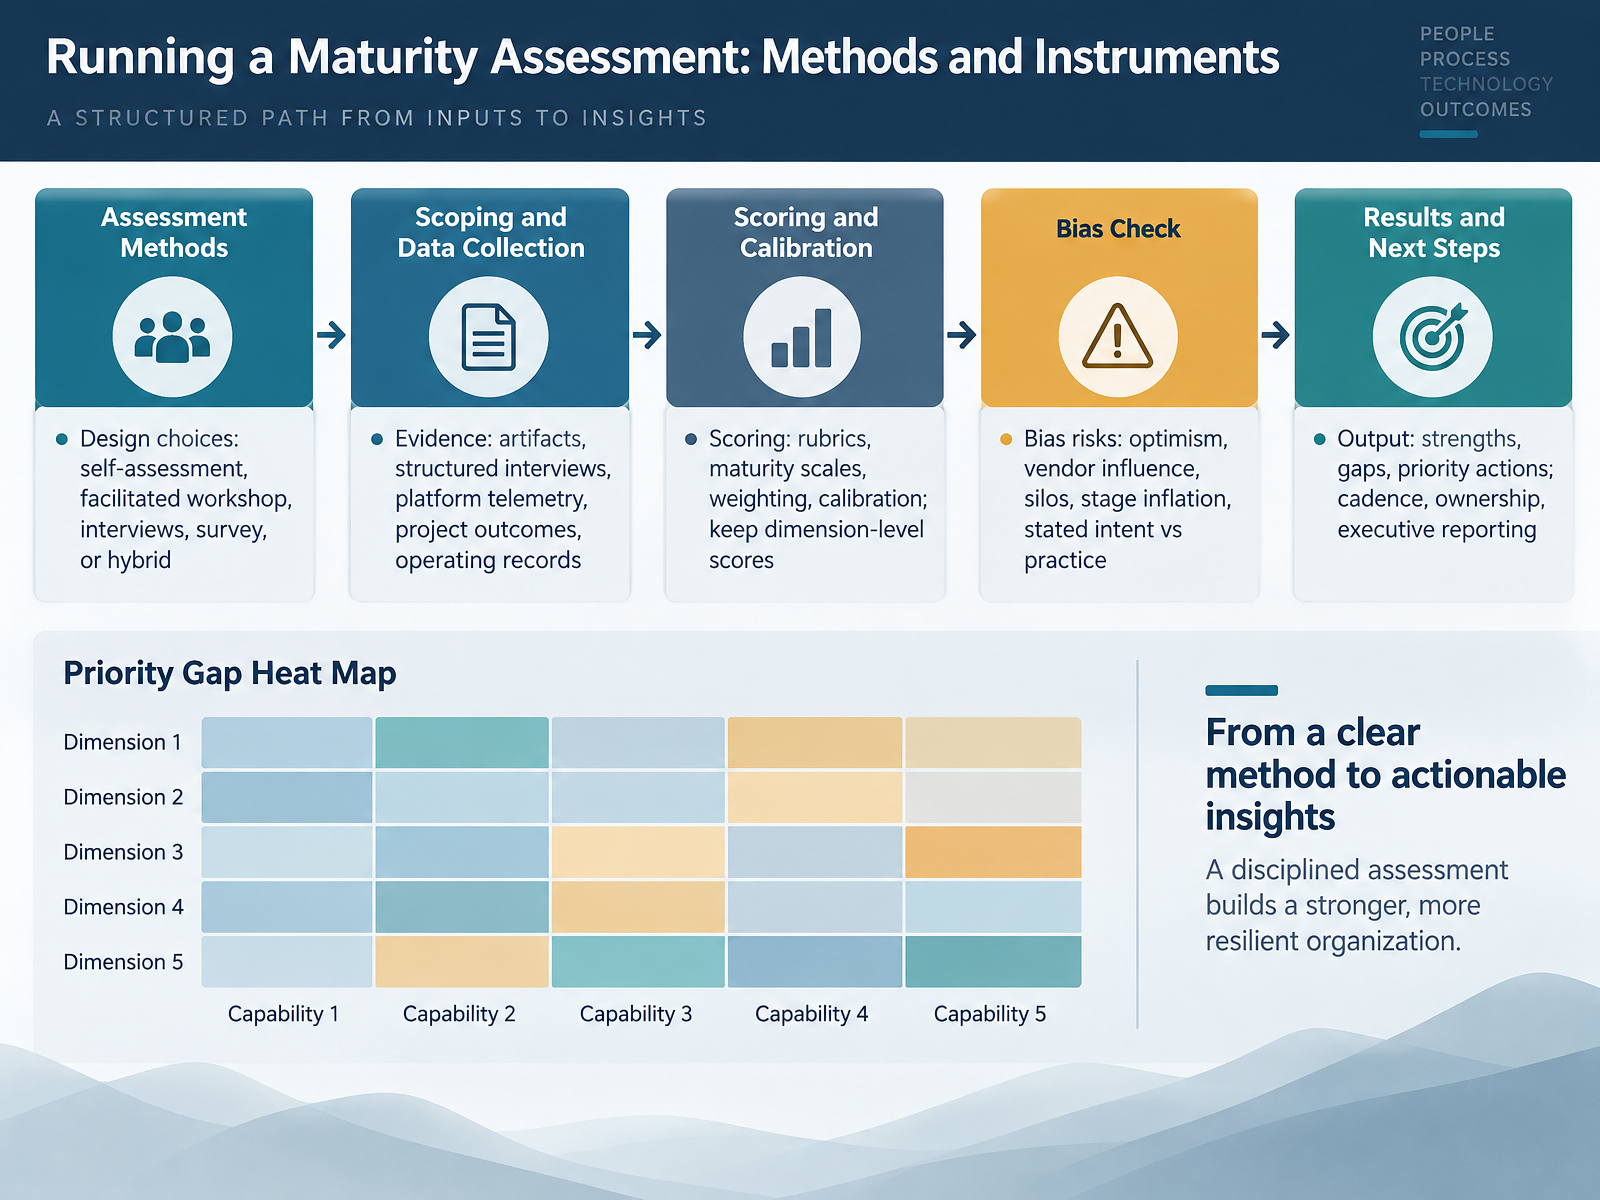
- 07Running a Maturity Assessment: Methods and InstrumentsLet's now look at how you actually run a maturity assessment, the methods and the instruments. First, the design choice. You can use a self-assessment, a facilitated workshop, structured interviews, a broad survey, or a hybrid. Most credible programs combine a survey for breadth with interviews to probe what the numbers surface. Second, scoring. Define your rubric before you collect anything, and keep scores at the dimension level. A single enterprise average of three can hide a level one in governance and a level five in analytics. Third, evidence. A score should trace to artifacts, platform telemetry, operating records, and project outcomes, not just stated intent. Fourth, watch the biases. Optimism, vendor influence, silos, and stage inflation all distort results. Ask for examples from the last reporting cycle. Finally, the output: strengths, gaps, priority actions, clear ownership, a reassessment cadence, and executive reporting. So the assessment itself must be governed as rigorously as the capabilities it measures. That brings us to turning all of this into action. From Scores to Roadmap: Prioritizing Capability Gaps.
 carlsonschool.umn.edutdwi.orghelp.sap.com+22 min
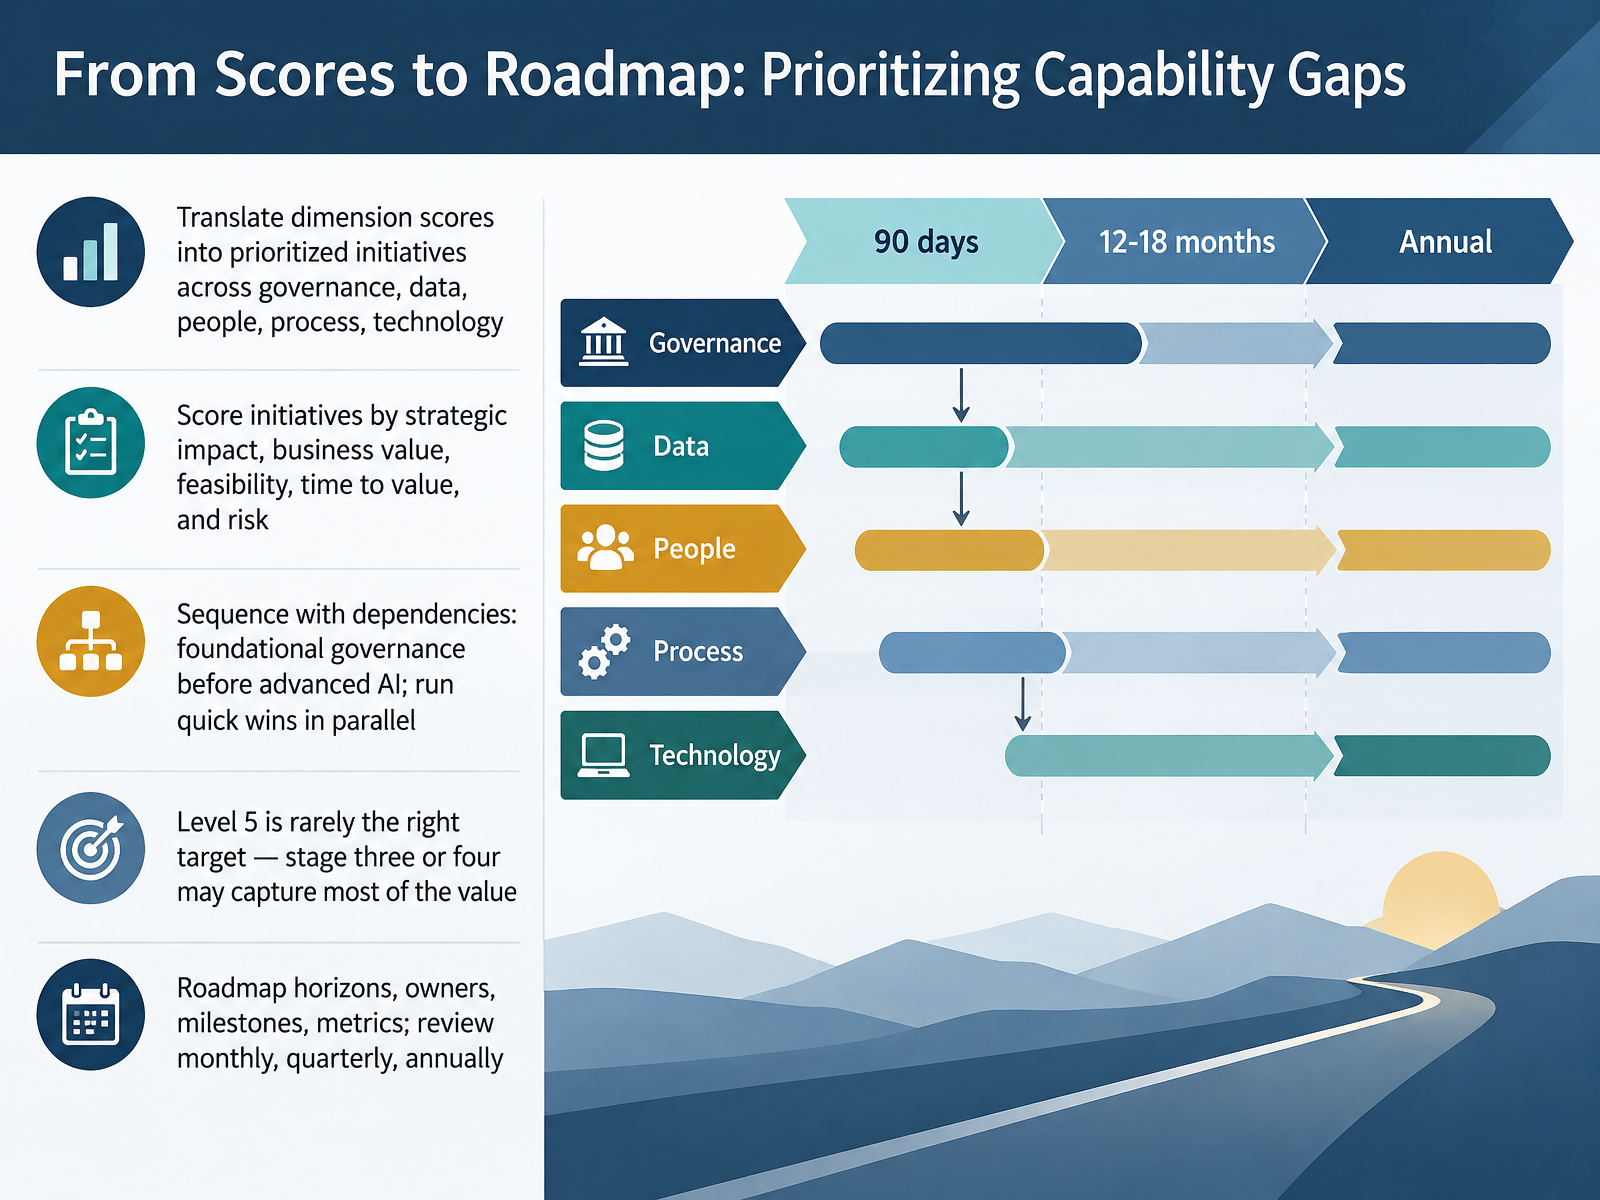
- 08From Scores to Roadmap: Prioritizing Capability GapsNow let's turn those maturity scores into an actual roadmap. Start by translating your dimension scores into a prioritized set of initiatives across five areas: governance, data, people, process, and technology. Then score each initiative on strategic impact, business value, feasibility, time to value, and risk. That scoring is what keeps prioritization transparent, and it is what keeps the loudest voice in the room from deciding the sequence. Next, sequence with dependencies in mind. Foundational governance and data quality come before advanced AI, but you can run quick wins in parallel to build momentum. And here is the part worth saying plainly: Level Five is rarely the right target. For many organizations, reaching stage three or four captures most of the value at a fraction of the cost. Finally, build the roadmap with clear horizons, named owners, milestones, and metrics, then review it monthly, quarterly, and annually. Coming up next, Operating Models and Organization Design by Stage.
 help.sap.comgartner.comcarlsonschool.umn.edu+22 min
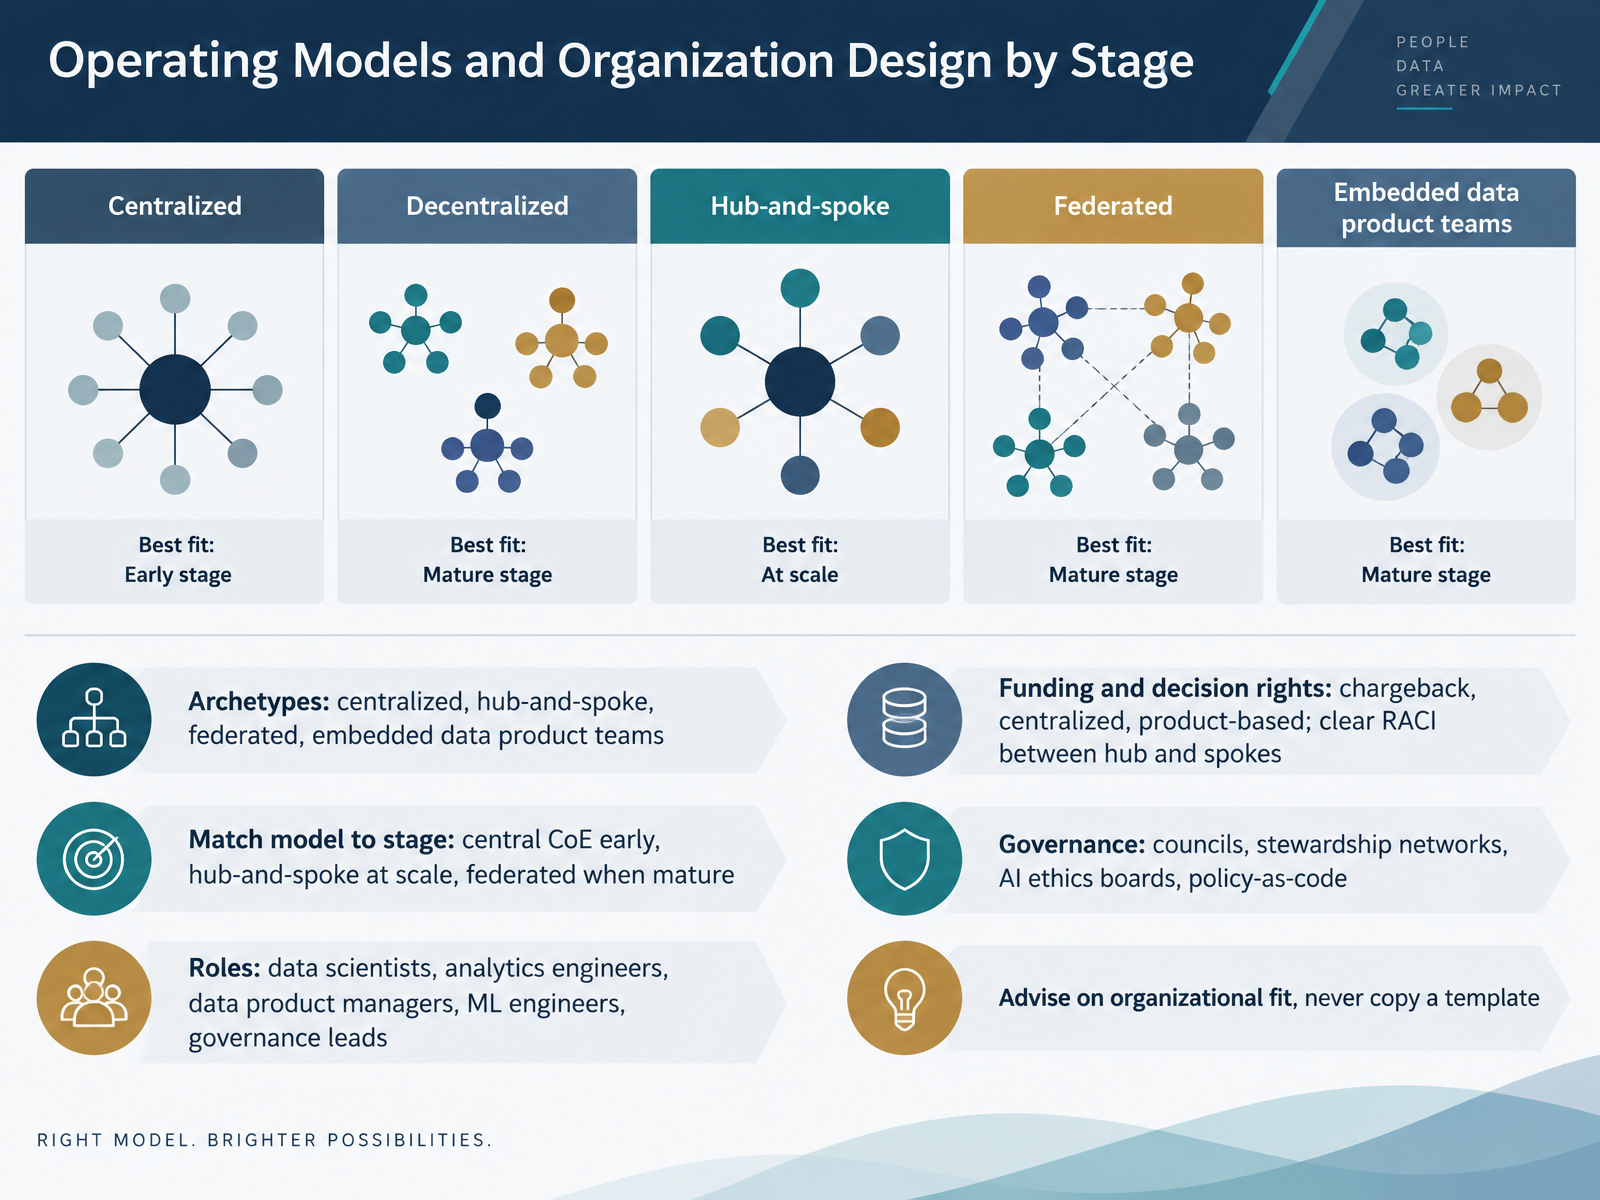
- 09Operating Models and Organization Design by StageNow let's connect maturity to structure. No single operating model is right forever. Centralized centers of excellence fit early stages, when scarce talent needs a home. Hub and spoke fits scale: a central hub owns standards, platform, and policy automation, while domain spokes own delivery. Federated or embedded data product teams fit mature organizations with strong guardrails.
Roles shift with the model: data scientists, analytics engineers, data product managers, machine learning engineers, and governance leads. Funding changes too, from centralized to chargeback to product-based, with clear RACI between hub and spokes. Governance matures from councils to stewardship networks, ethics boards, and policy-as-code.
The key advice: design for organizational fit. Never copy a template. Let's look at common pitfalls next.
 go.tdwi.organalyticsmaturity.informs.orglink.springer.com+22 min
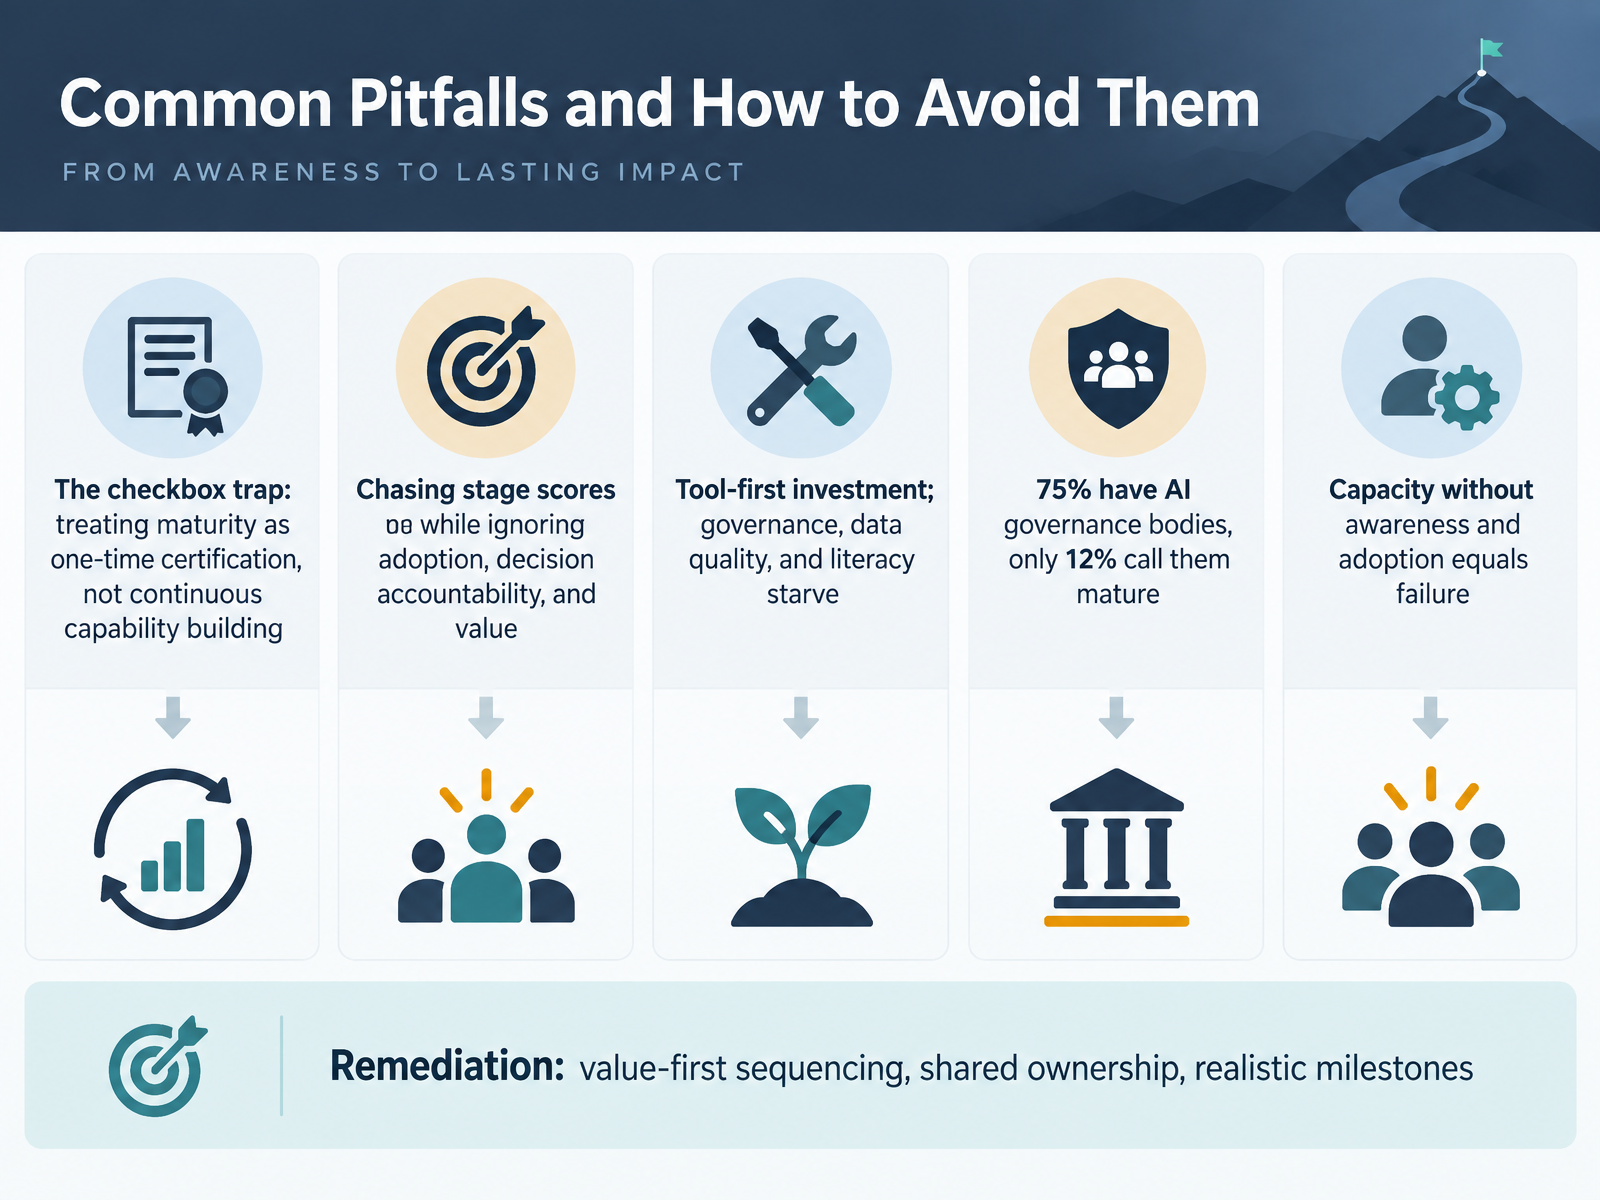
- 10Common Pitfalls and How to Avoid ThemLet's talk about the pitfalls that quietly derail maturity programs. The first is the checkbox trap: treating maturity as a one-time certification rather than continuous capability building. The second is chasing stage scores while ignoring adoption, decision accountability, and value. Remember the data: seventy-five percent of organizations have AI governance bodies, but only twelve percent describe them as mature. And here's the hard lesson from the field. Capability without awareness and adoption equals failure. Teams build impressive platforms, but if stakeholders never see the progress or change how they decide, nothing scales. The remediation is straightforward, though not easy. Sequence value first, not tools. Share ownership between business and technical teams. Set realistic milestones that measure adoption and decisions, not just deployment. As you benchmark your own program, ask which of these traps you're closest to. Next, we move into AI-specific maturity: governance, agentic readiness, and trust.
 pages.dataiku.comdoi.orgmbs.edu+22 min
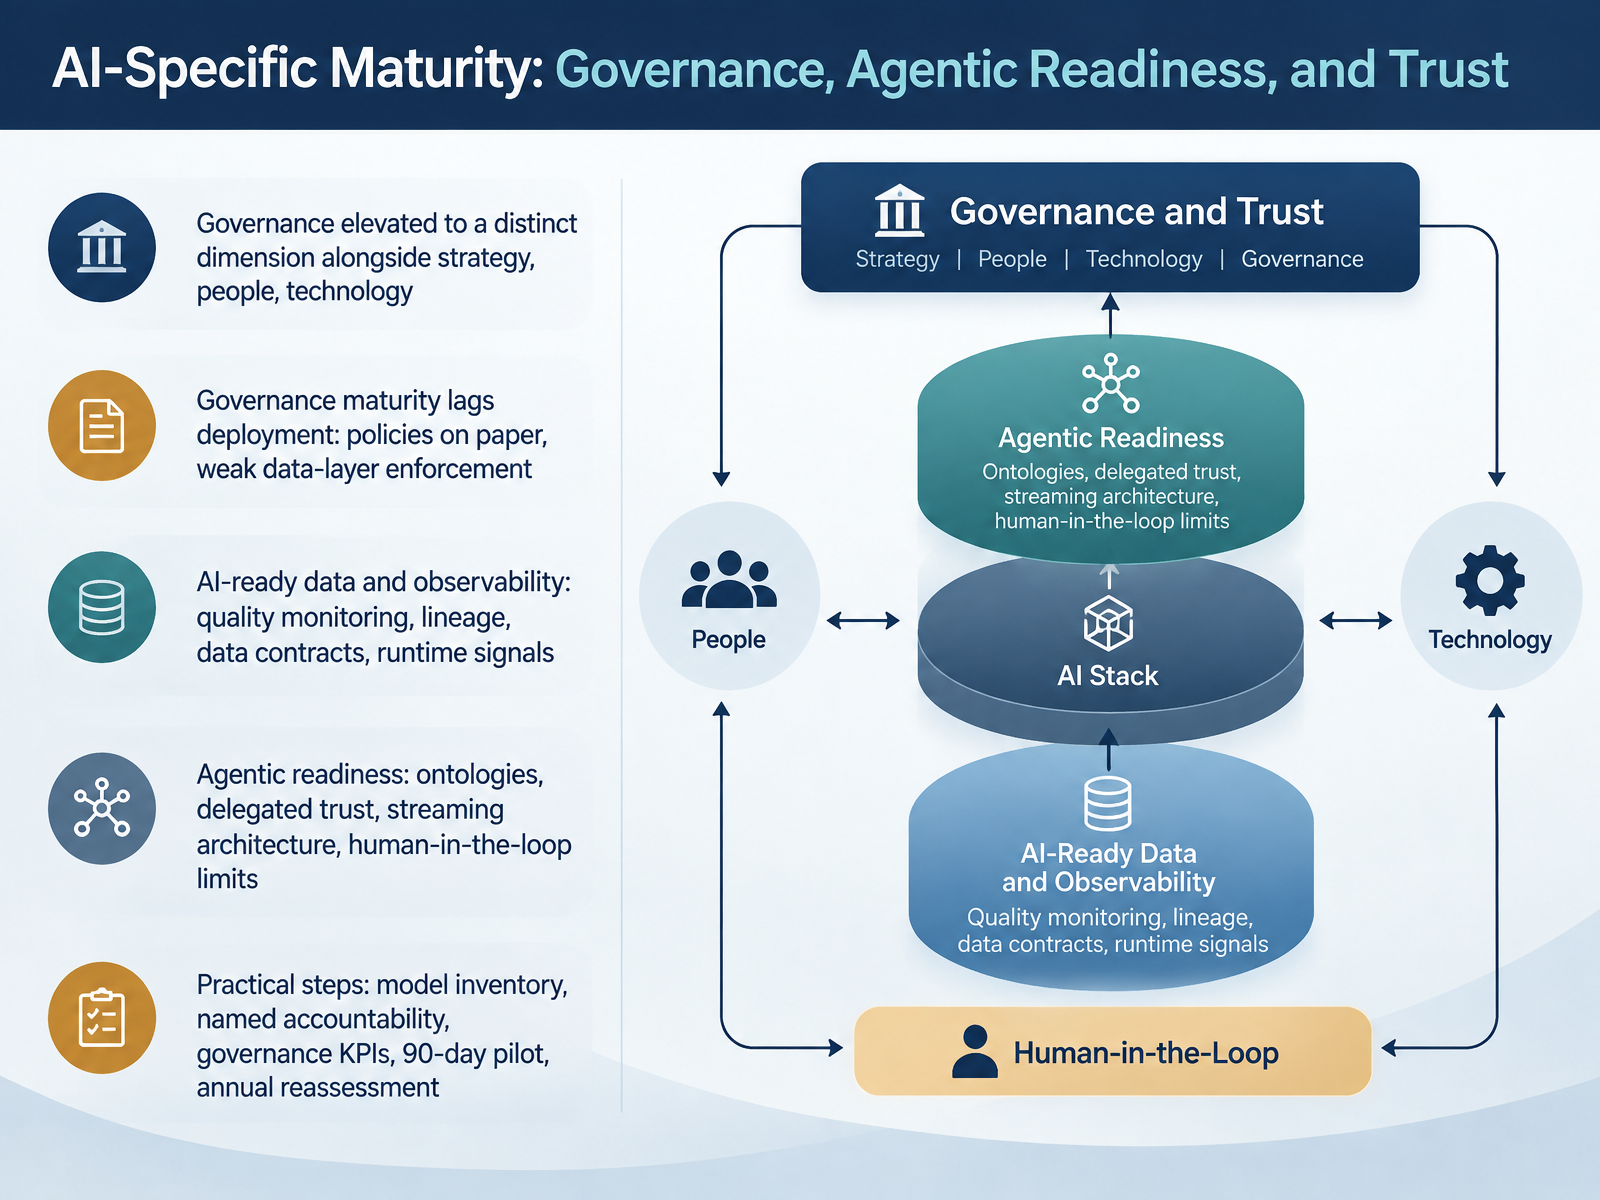
- 11AI-Specific Maturity: Governance, Agentic Readiness, and TrustLet's look at what changes once AI enters the picture. Governance is now treated as a distinct dimension in its own right, sitting alongside strategy, people, and technology. That elevation matters, because trust and risk management have become prerequisites for scaling, not afterthoughts. In practice, governance maturity lags deployment. Most organizations have policies on paper, but weak enforcement at the data layer. So make the data layer real. Focus on AI-ready data and observability: quality monitoring, lineage, data contracts, and runtime signals. Then agentic readiness, which means ontologies so agents understand your entities, delegated trust with defined limits, streaming architecture instead of yesterday's batch data, and clear human-in-the-loop boundaries. For practical steps, build a model inventory, name accountable individuals, define governance KPIs, run a ninety-day pilot on your highest-risk systems, and reassess annually. Next, we look at adapting models to context: industry, size, and regulation.
 oracle.comdoi.orggartner.com+22 min
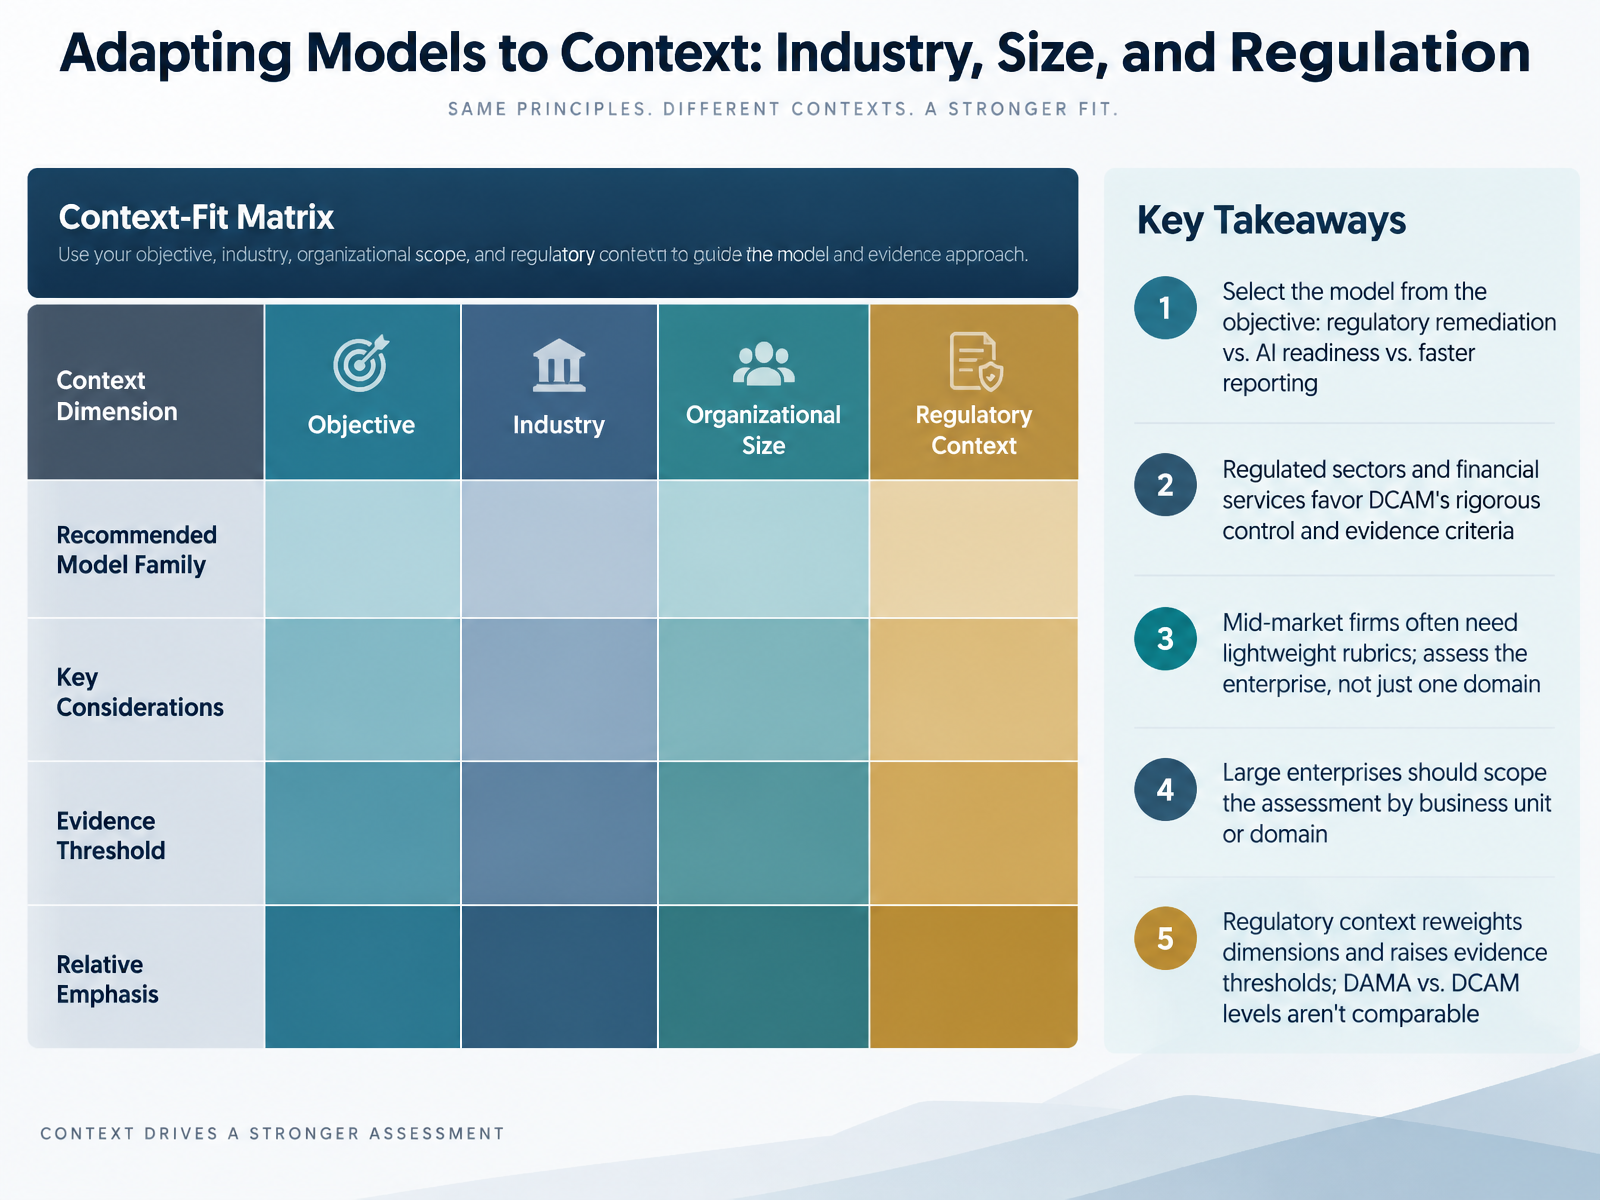
- 12Adapting Models to Context: Industry, Size, and RegulationNow let's talk about adapting models to context, because no single framework fits every organization. Start with your objective. Are you remediating a regulatory finding, preparing for AI, or simply trying to speed up reporting? That answer should drive your framework choice. If you're in financial services or another regulated sector, DCAM tends to be the better fit. Its rigorous control and evidence criteria align closely with what regulators expect. Mid-market firms usually don't need that weight. A lightweight rubric works well, and you can assess the whole enterprise rather than one domain. Large enterprises face a different challenge. Scope your assessment by business unit or domain, because maturity varies widely across a single company. One more thing to keep in mind: regulatory context reweights your dimensions and raises the evidence threshold. And remember that DAMA and DCAM levels are not directly comparable. They define levels differently, so don't treat them as interchangeable. Next, we'll look at measuring progress through metrics and leading indicators.
 carlsonschool.umn.edutdwi.orghelp.sap.com+22 min
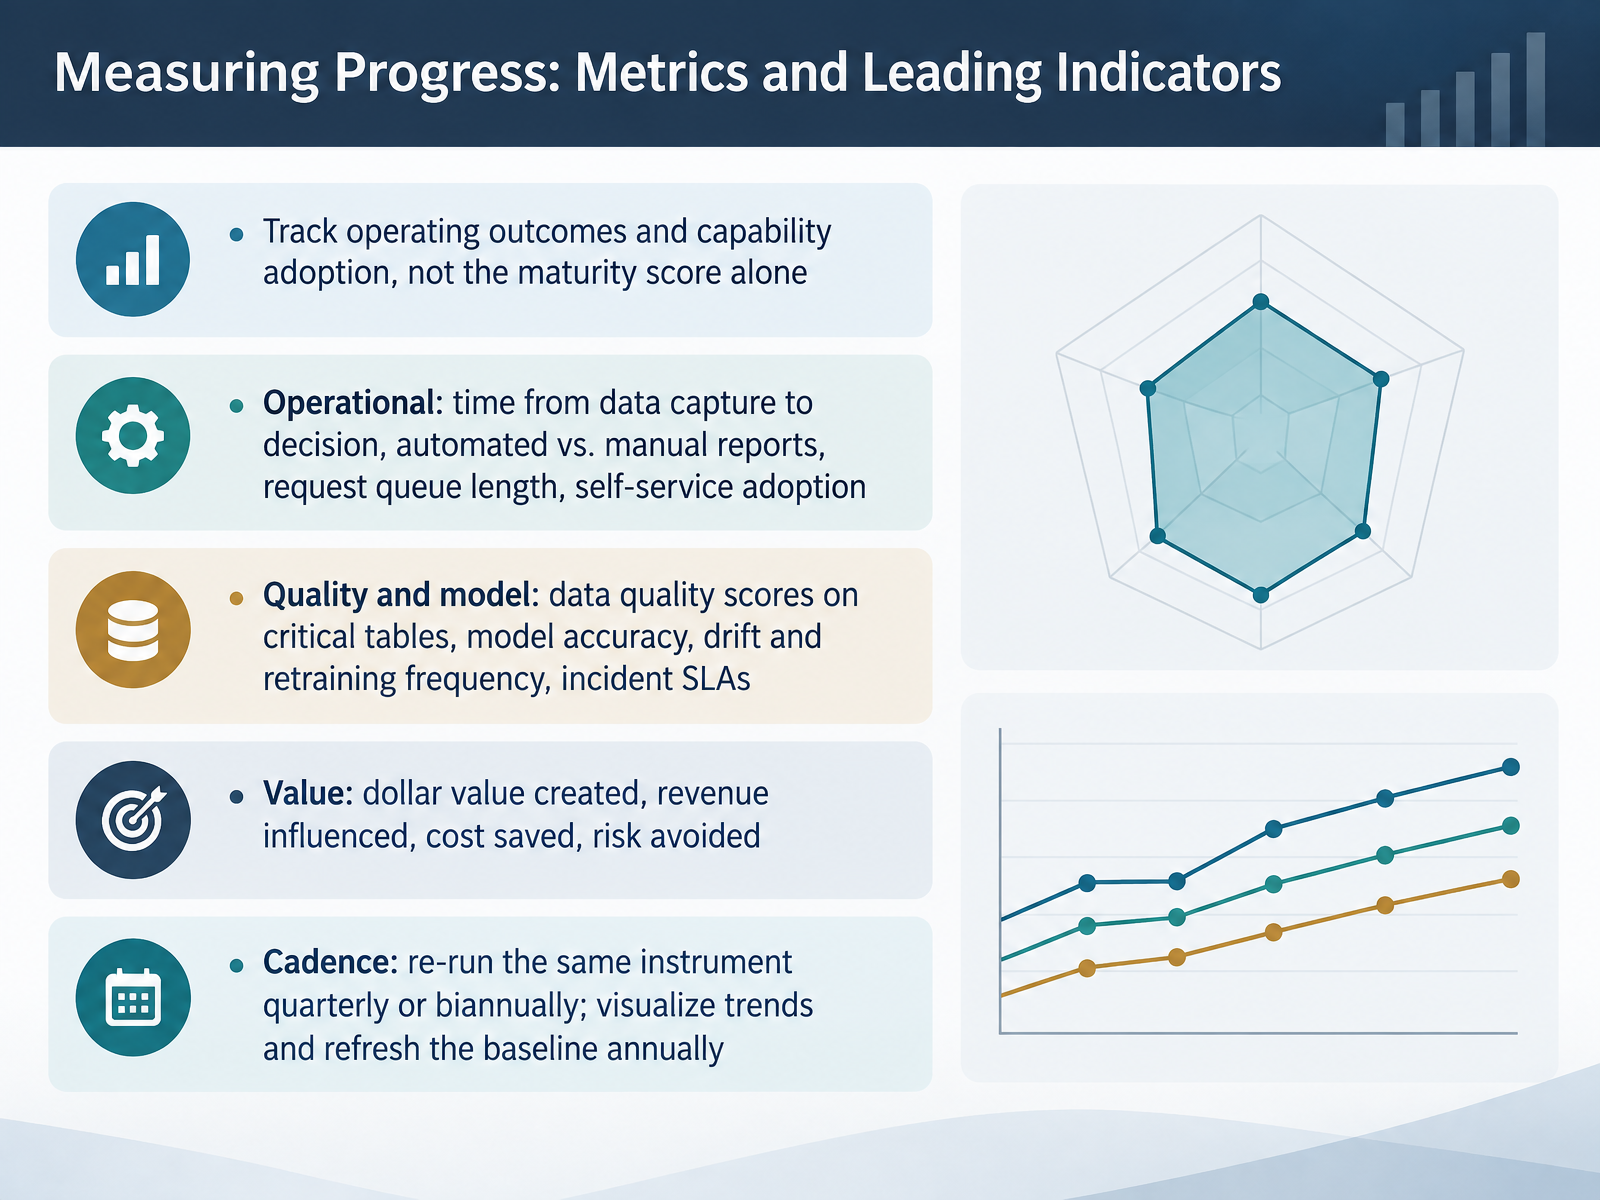
- 13Measuring Progress: Metrics and Leading IndicatorsLet's talk about measuring progress. The first principle is simple: do not manage to the maturity score itself. Track operating outcomes and capability adoption instead. On the operational side, watch time from data capture to decision, the ratio of automated to manual reports, request queue length, and self-service adoption. On quality and models, watch data quality scores on critical tables, model accuracy, drift and retraining frequency, and incident service-level agreements. Then connect it all to value: dollars created, revenue influenced, cost saved, risk avoided. For cadence, re-run the same instrument quarterly or twice a year, visualize the trend, and refresh the baseline annually. Same questions, same scoring, over time. That is how you prove movement and justify the next stage of investment. Next, we'll turn this into an action plan.
 airbyte.comanalyticsmaturity.informs.orgfygurs.com+22 min
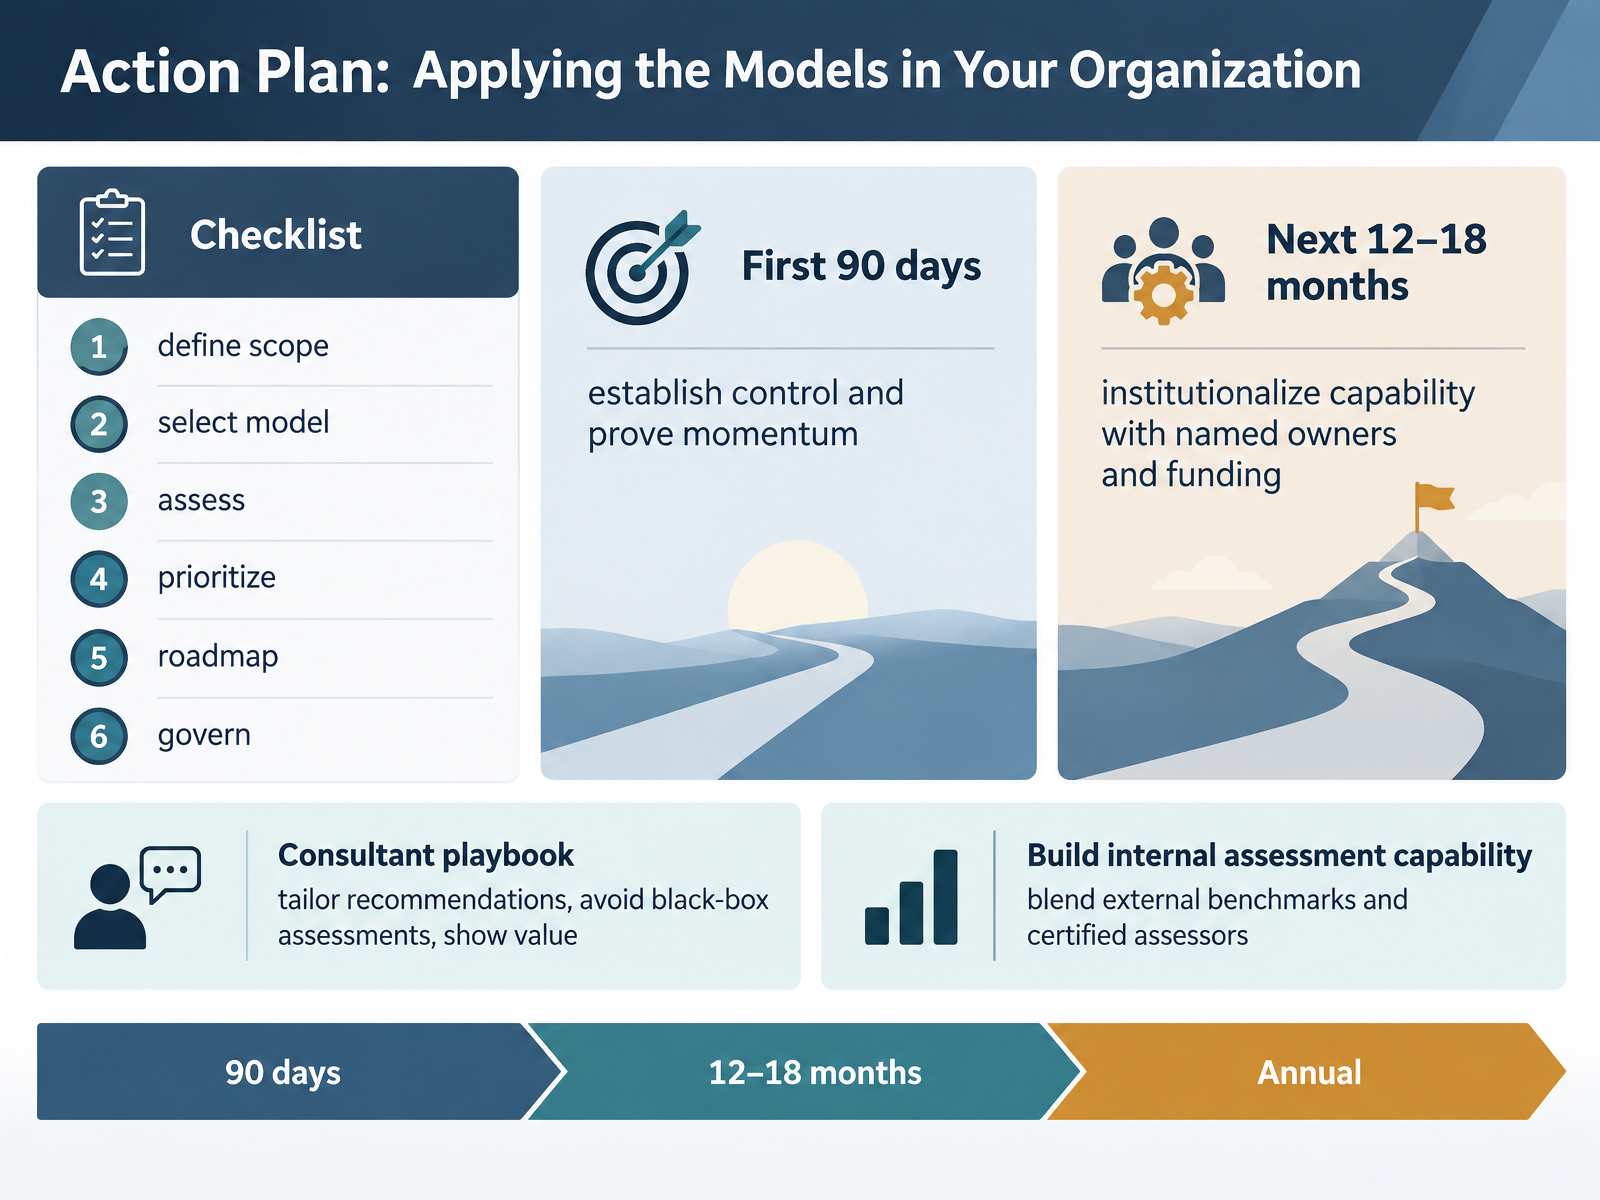
- 14Action Plan: Applying the Models in Your OrganizationLet's close with the action plan, because a model only earns its keep when it changes what you fund next quarter. Run the checklist in order. Define scope, whether one business unit or the enterprise. Select the model that fits your objective. Assess with evidence, not consensus. Prioritize by business impact and dependency. Then build the roadmap and stand up governance. In the first ninety days, establish control and prove momentum. Pick two or three initiatives with measurable outcomes and named owners. Over the next twelve to eighteen months, institutionalize capability with funded owners, quarterly reassessments, and KPIs the CFO recognizes. If you are a consultant, tailor recommendations to the client's context, avoid black-box scoring, and show value early. And build internal assessment capability over time, blending external benchmarks with certified assessors so the method stays yours. Assess honestly, prioritize ruthlessly, and fund the first horizon before you close the report. Thank you for working through all fourteen slides. You now have the vocabulary, the stages, and the plan. Go benchmark your organization, and start with one decision this month.
 airbyte.comanalyticsmaturity.informs.orgfygurs.com+22 min
Take the deck with you
Download this course as a file — free, no sign-up needed.
- PDF handoutEvery slide page, ready to print or share.15 pages · 3.2 MBDownload
- Narrated PowerPointThe deck that presents itself — every slide carries the digital human's narration video.15 pages · 13.7 MBDownload
- PowerPoint slidesThe full deck as a .pptx — open it in PowerPoint, Keynote, or Google Slides.15 pages · 3.1 MBDownload
Free to use in your own training — please keep the PersonWise credit page at the end.
Have your own deck? Turn it into a course
Sources consulted
Web sources consulted while building this course.
- A Data Science Maturity Model for Enterprise Assessment — oracle.com
- A model for leaders to drive AI and big data maturity — doi.org
- The Gartner Data and Analytics Maturity Assessment for ... — gartner.com
- Data & AI Transformation Maturity Report 2026 — ai-maturity.datainnovationsummit.com
- IDC MaturityScape Benchmark: AI-Fueled Organization Worldwide, 2026 — marketresearch.com
- Analytics Maturity Powers — pages.dataiku.com
- A Capability Maturity Model for Developing and Improving Advanced Data Analytics Capabilities — doi.org
- The analytics journey towards value creation — mbs.edu
- TDWI Analytics Maturity Model Assessment Guide — go.tdwi.org
- From Data Lakes to Business Value: A Capability-Based Framework for Analytics Maturity | Journal of Engineering and Computational Intelligence Review — jecir.com
- AMM User Guide — analyticsmaturity.informs.org
- Understanding Data & Analytics Maturity: A Systematic Review of Maturity Model Composition | Schmalenbach Journal of Business Research | Springer Nature Link — link.springer.com
- Guiding the integration of analytics in business operations through a maturity framework — ideas.repec.org
- Soumya Sen [email protected] Ryan Sougstad [email protected] Information & Decision Sciences Department Carlson School of Management University of Minnesota Copyright © 2022. All rights reserved. — carlsonschool.umn.edu
- TDWI Analytics Maturity Model Assessment Guide | TDWI — tdwi.org
- Data & Analytics Maturity Assessment — help.sap.com
- Analytics Maturity Model: A Complete Enterprise Assessment Guide — airbyte.com
- Data Maturity Assessment: The Complete Checklist — fygurs.com
- SAP Data & Analytics Advisory Methodology — help.sap.com
- Key Success Factors in Any Data and Analytics Strategy — gartner.com