Data Quality Fundamentals
Begin
15 pages · ~30 min
Data Quality Fundamentals
A foundational course covering data quality principles, frameworks, and best practices for professionals ensuring accurate, reliable data.
What you’ll learn
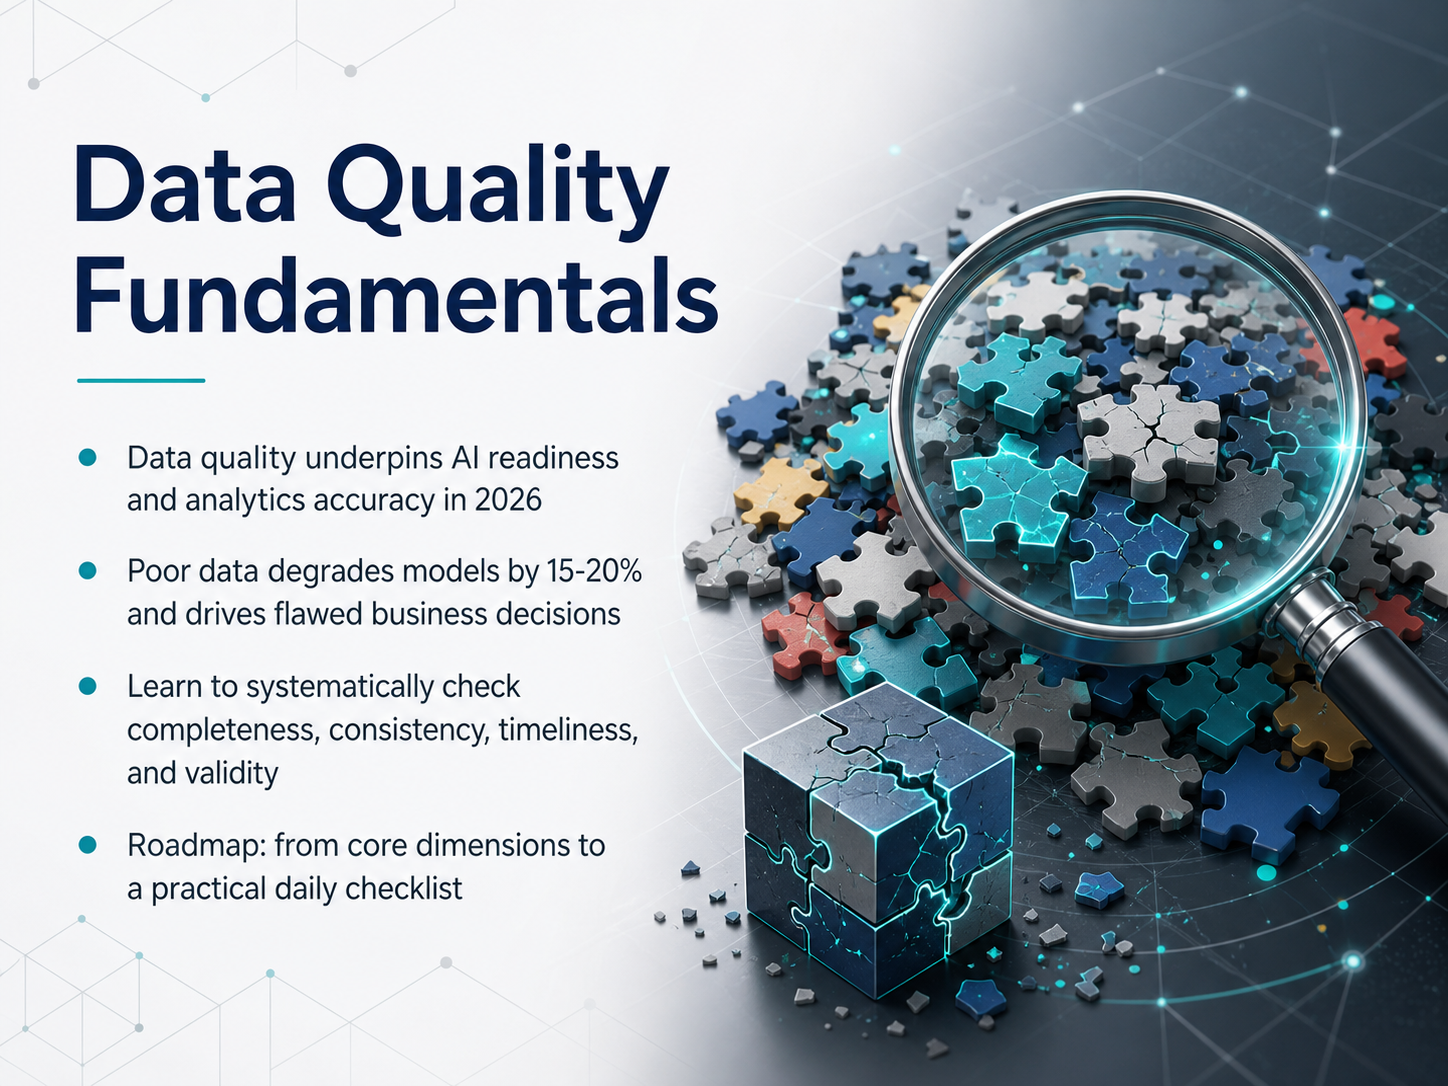
- 01Data Quality FundamentalsWelcome. This course will establish you as a gatekeeper for data quality—a role that directly protects your organization's AI readiness and analytics accuracy. In today's landscape, poor data can degrade model performance by fifteen to twenty percent and drive flawed business decisions that ripple across the enterprise. Over the next few sessions, you will learn to systematically verify that every dataset you touch is complete, consistent, timely, valid, and fit for purpose. We will start with the core dimensions of data quality and then translate them into a practical daily checklist you can apply immediately. Let's get started by exploring what 'fit for purpose' really means.training.dataversity.netudemy.comtraining.dataversity.net+21 min
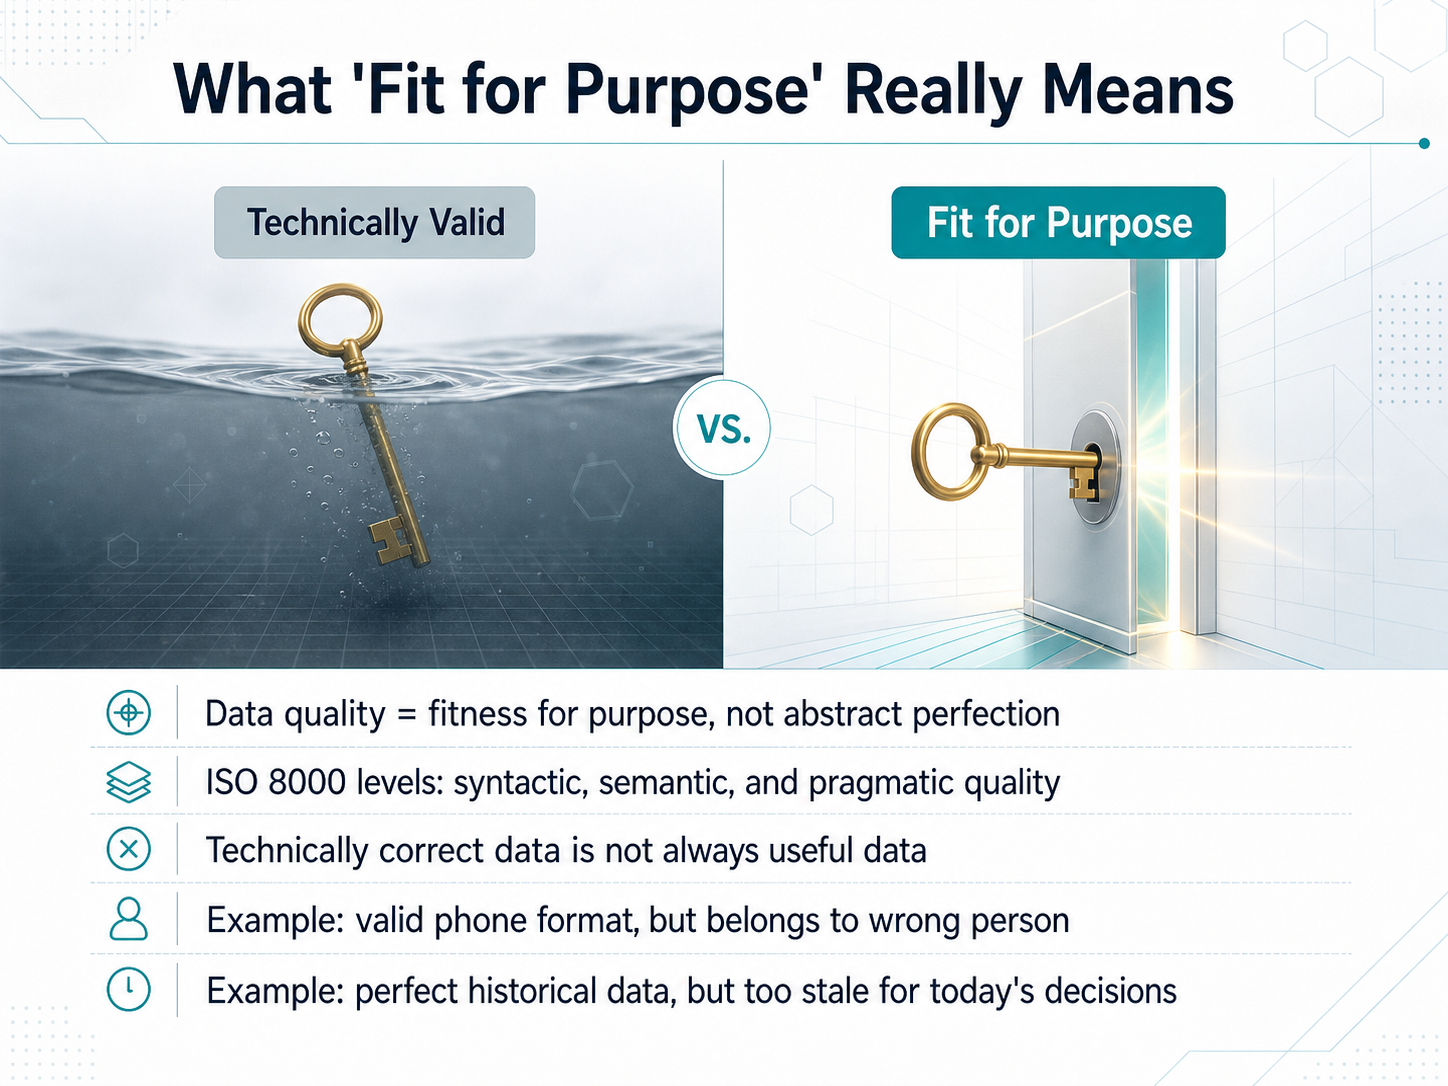
- 02What 'Fit for Purpose' Really MeansLet's anchor on a single idea that separates data professionals from data perfectionists: data quality means fitness for purpose. It is not about achieving abstract perfection. If data doesn't serve the decision at hand, it doesn't matter how clean it looks in a table. Industry models like ISO 8000 define quality across three levels. Syntactic quality checks whether data matches the expected format. Semantic quality asks if the value makes logical sense. Pragmatic quality, the one that matters most here, asks whether the data is actually useful and reliable for your specific task. Here is the trap. Technically correct data can still be completely useless. A phone number can pass every format validation check, yet belong to the wrong person. That data looks valid, but it fails pragmatic accuracy. Similarly, a dataset can contain perfect, error-free history from three years ago. If you need it to predict today's inventory demand, that data is simply too stale. It fails timeliness. Your job as a gatekeeper is to always tie the check back to the purpose. Before you run a single completeness scan, ask: will this data help the business make the decision they need to make right now? Next, we'll break down the core dimensions you'll use to answer that question.
 ibm.comibm.comdqglobal.com+22 min
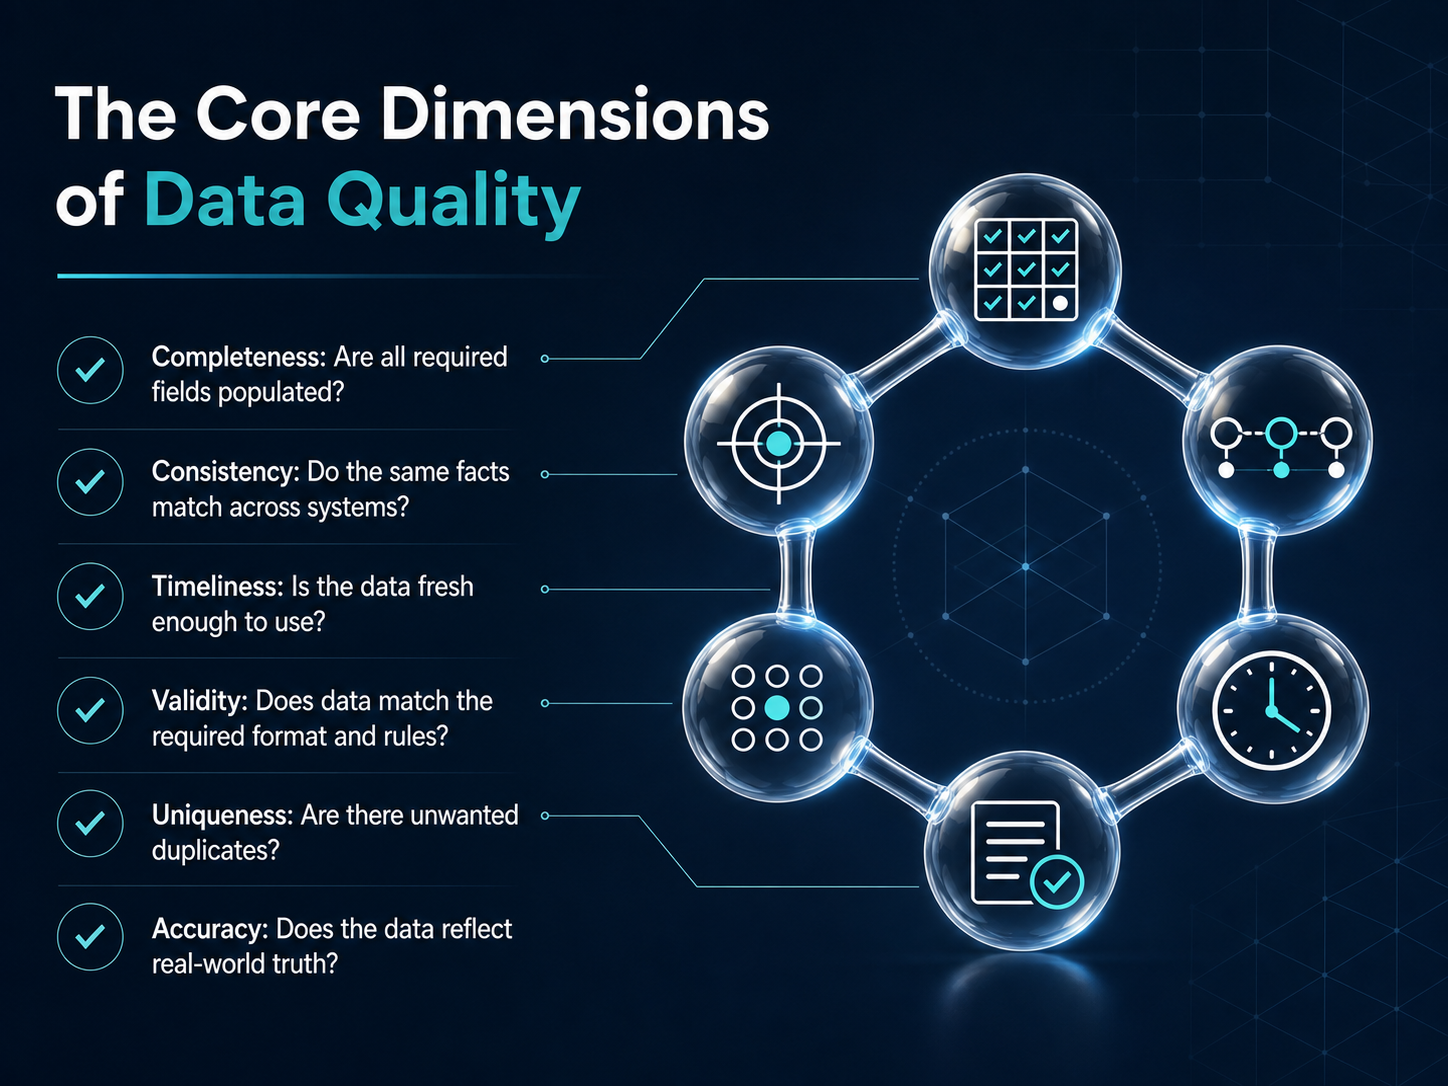
 - 03The Core Dimensions of Data QualityLet's break down the core dimensions you'll use to assess data quality. Think of these as the six key checks you apply before trusting any dataset. First, Completeness: are all required fields populated, or are we missing critical values? Second, Consistency: when the same customer record exists in your CRM and billing system, do the details match, or do you have conflicting facts? Third, Timeliness: is the data fresh enough to act on, or are you looking at yesterday's snapshot for a real-time decision? Fourth, Validity: does the data follow the defined format and rules? For example, a birthdate field should not contain future dates. Fifth, Uniqueness: are unwanted duplicates inflating your counts and breaking your joins? And finally, Accuracy: does the data reflect the real-world truth you're trying to capture? These six dimensions give you a practical checklist for methodical validation. Next, we'll zoom in on the first checkpoint: Completeness, and answer the question, 'Is everything here?'
 ibm.comibm.comdqglobal.com+22 min
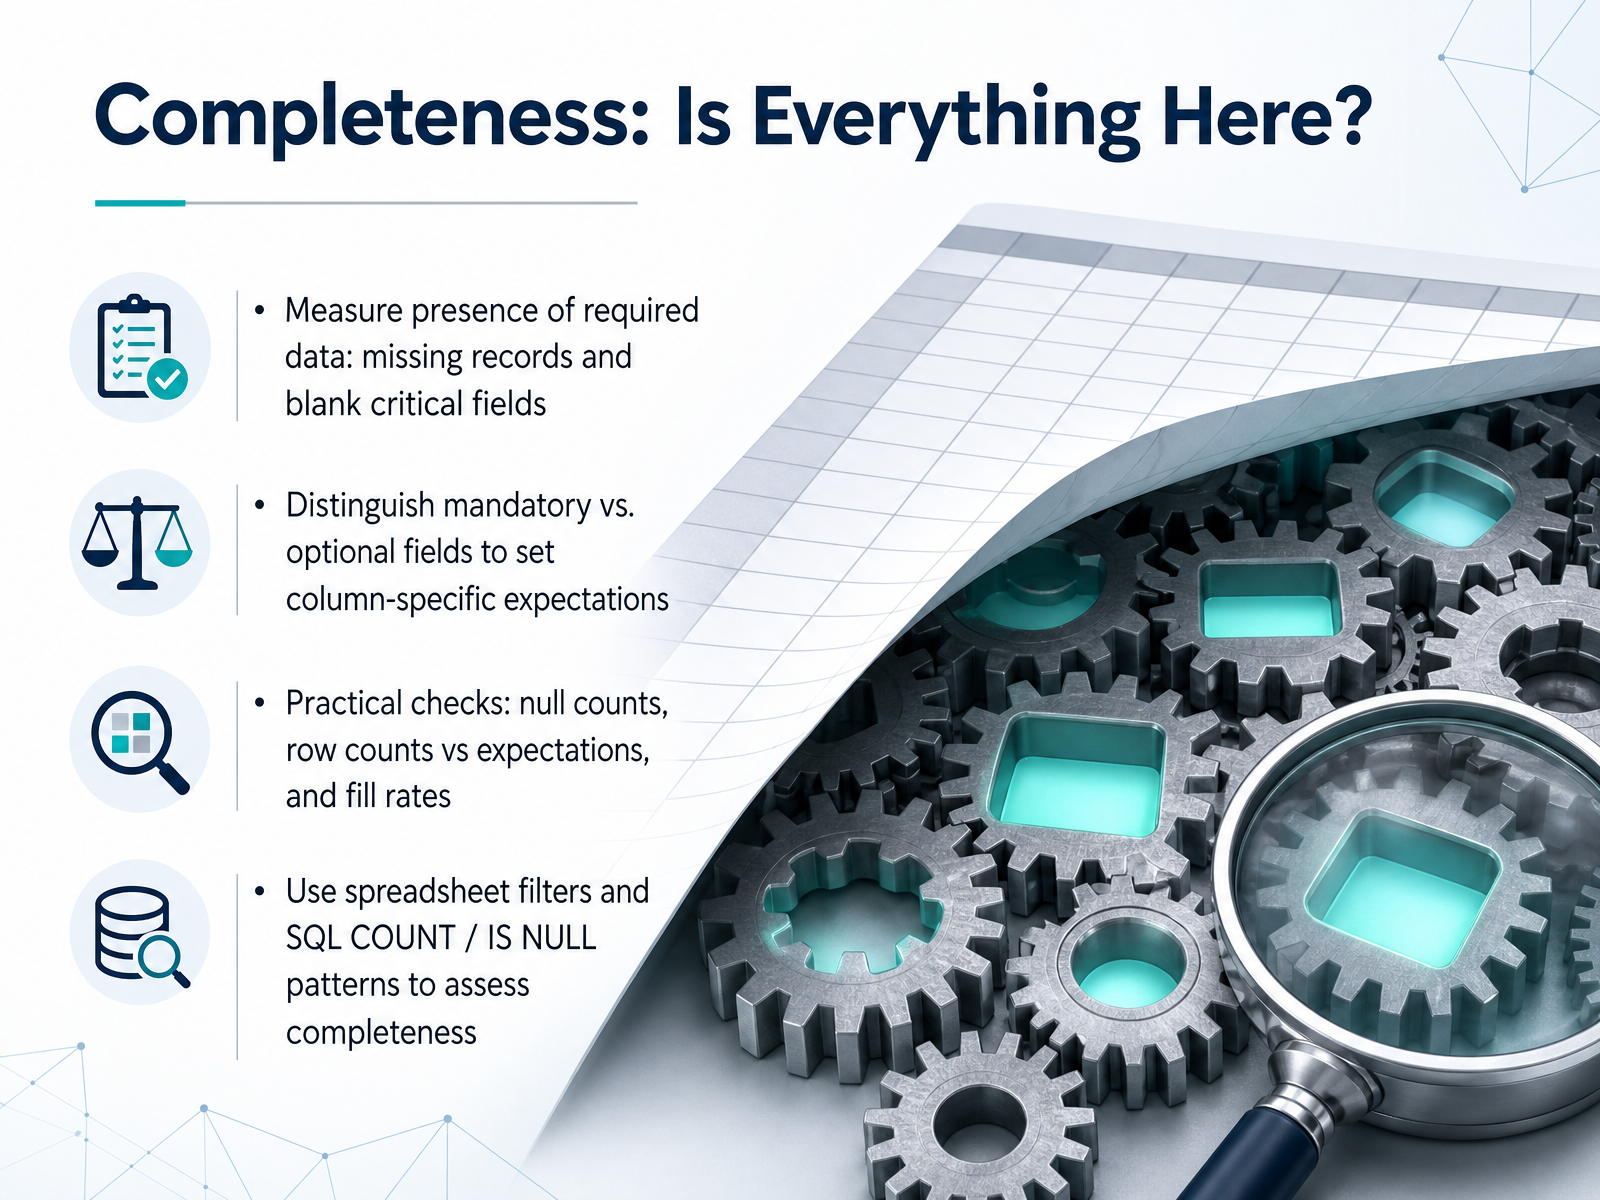
 - 04Completeness: Is Everything Here?Next, we focus on completeness. This is the most straightforward dimension to measure, and it answers one fundamental question: is everything here? Think of it as verifying the presence of required data. We do this by identifying missing records and blank critical fields. Start by distinguishing mandatory fields from optional ones. You don't want a blanket rule that flags every null, because an empty optional field is not a defect. It is expected. That distinction prevents alert fatigue and keeps your analysis sharp. For practical checks, use spreadsheet filters to visually scan for blanks, or run null counts directly in your database. Compare total row counts against your known expectations and calculate fill rates to see the percentage of populated values. In SQL, the COUNT function combined with an IS NULL condition makes this check immediate and repeatable. A high fill rate on critical columns means you have the foundation for reliable analysis. Let's now move from whether the data is present to whether it matches across systems, in our next topic, Consistency: Does It All Match?
 ibm.comibm.comdqglobal.com+22 min
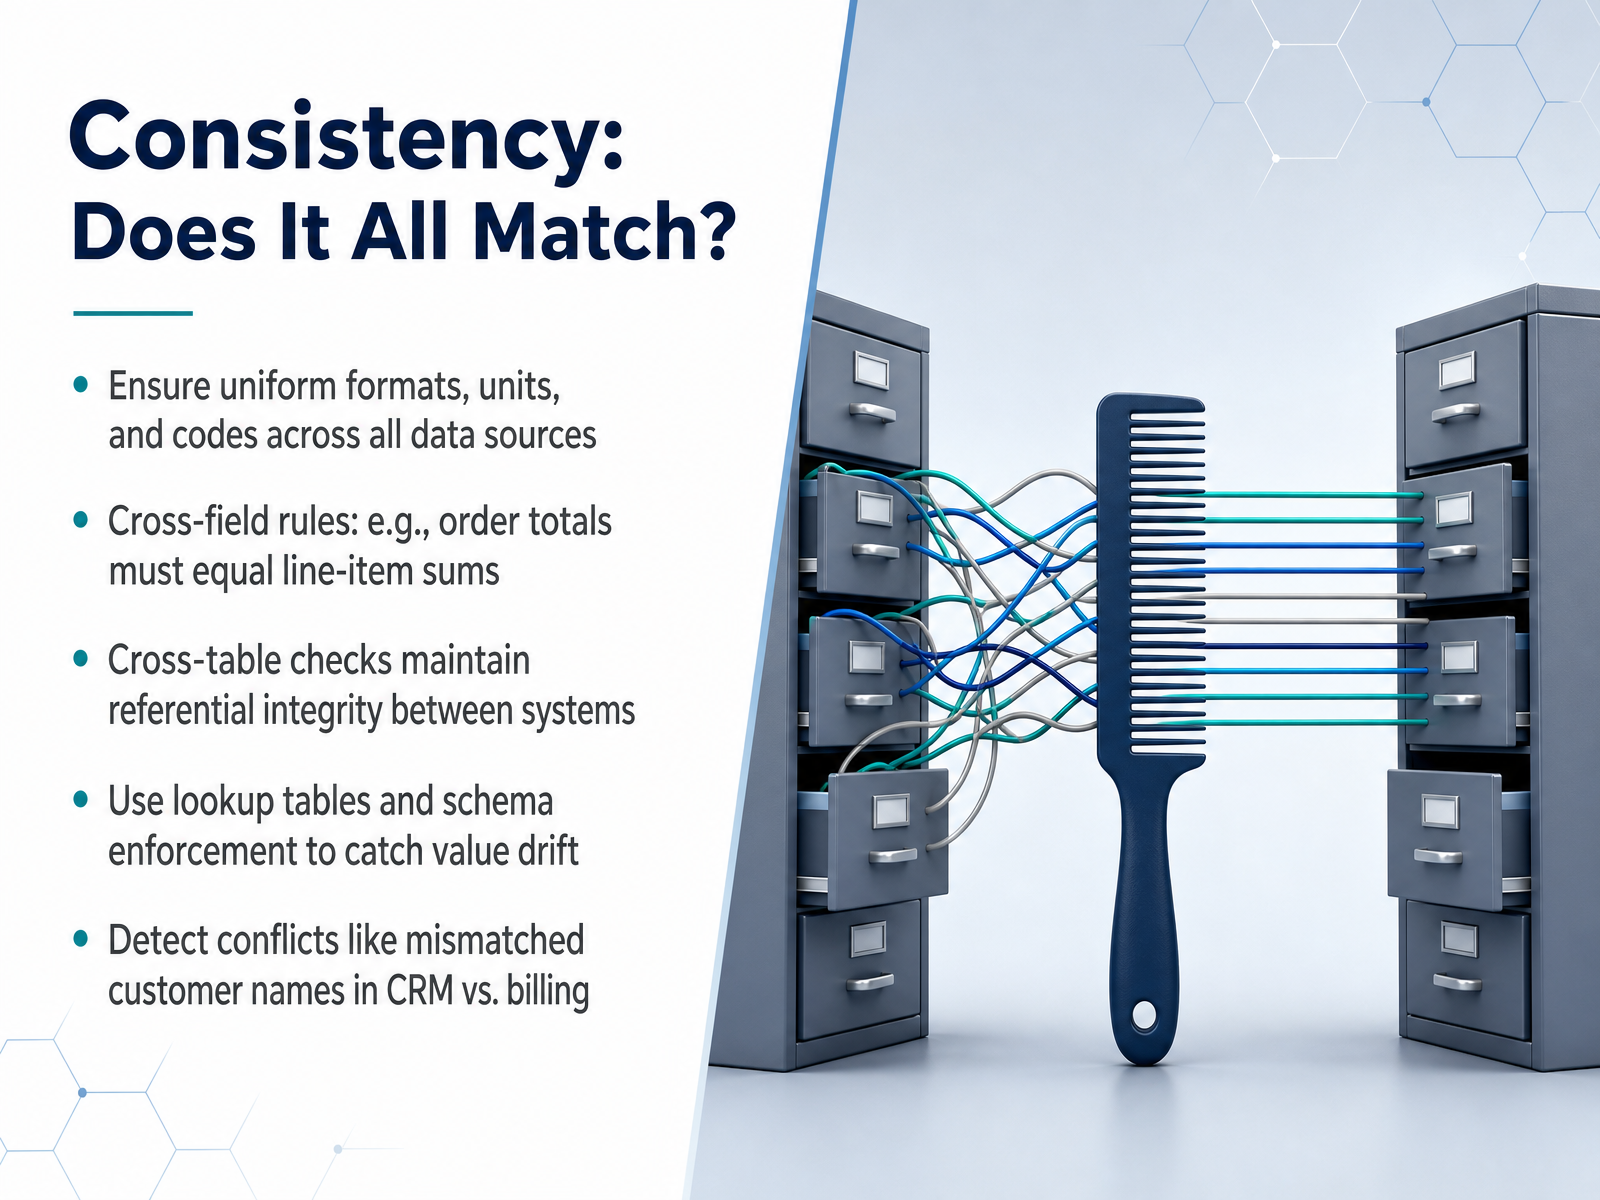
 - 05Consistency: Does It All Match?Next, let's look at consistency. The core question here is simple: does all your data match across different sources and systems? This is a key part of your role as a data quality gatekeeper. First, verify uniform formats, units, and codes. For example, ensure all dates use a standard YYYY-MM-DD structure and currency values use the same code, like U S D. Next, apply cross-field rules. A practical check is confirming that an order total in one column exactly equals the sum of its individual line items. Then, perform cross-table checks to maintain referential integrity. For instance, every customer I D in an orders table must have a matching record in the customers table. To prevent value drift, you should enforce standards using lookup tables and schema validation. Finally, actively detect conflicts, like a customer name appearing as 'Jon' in your C R M and 'Jonathan' in your billing system. Catching these mismatches early prevents downstream confusion. Let's move on to our next dimension, Timeliness, and ask: how fresh must the data be?
 ibm.comibm.comdqglobal.com+22 min
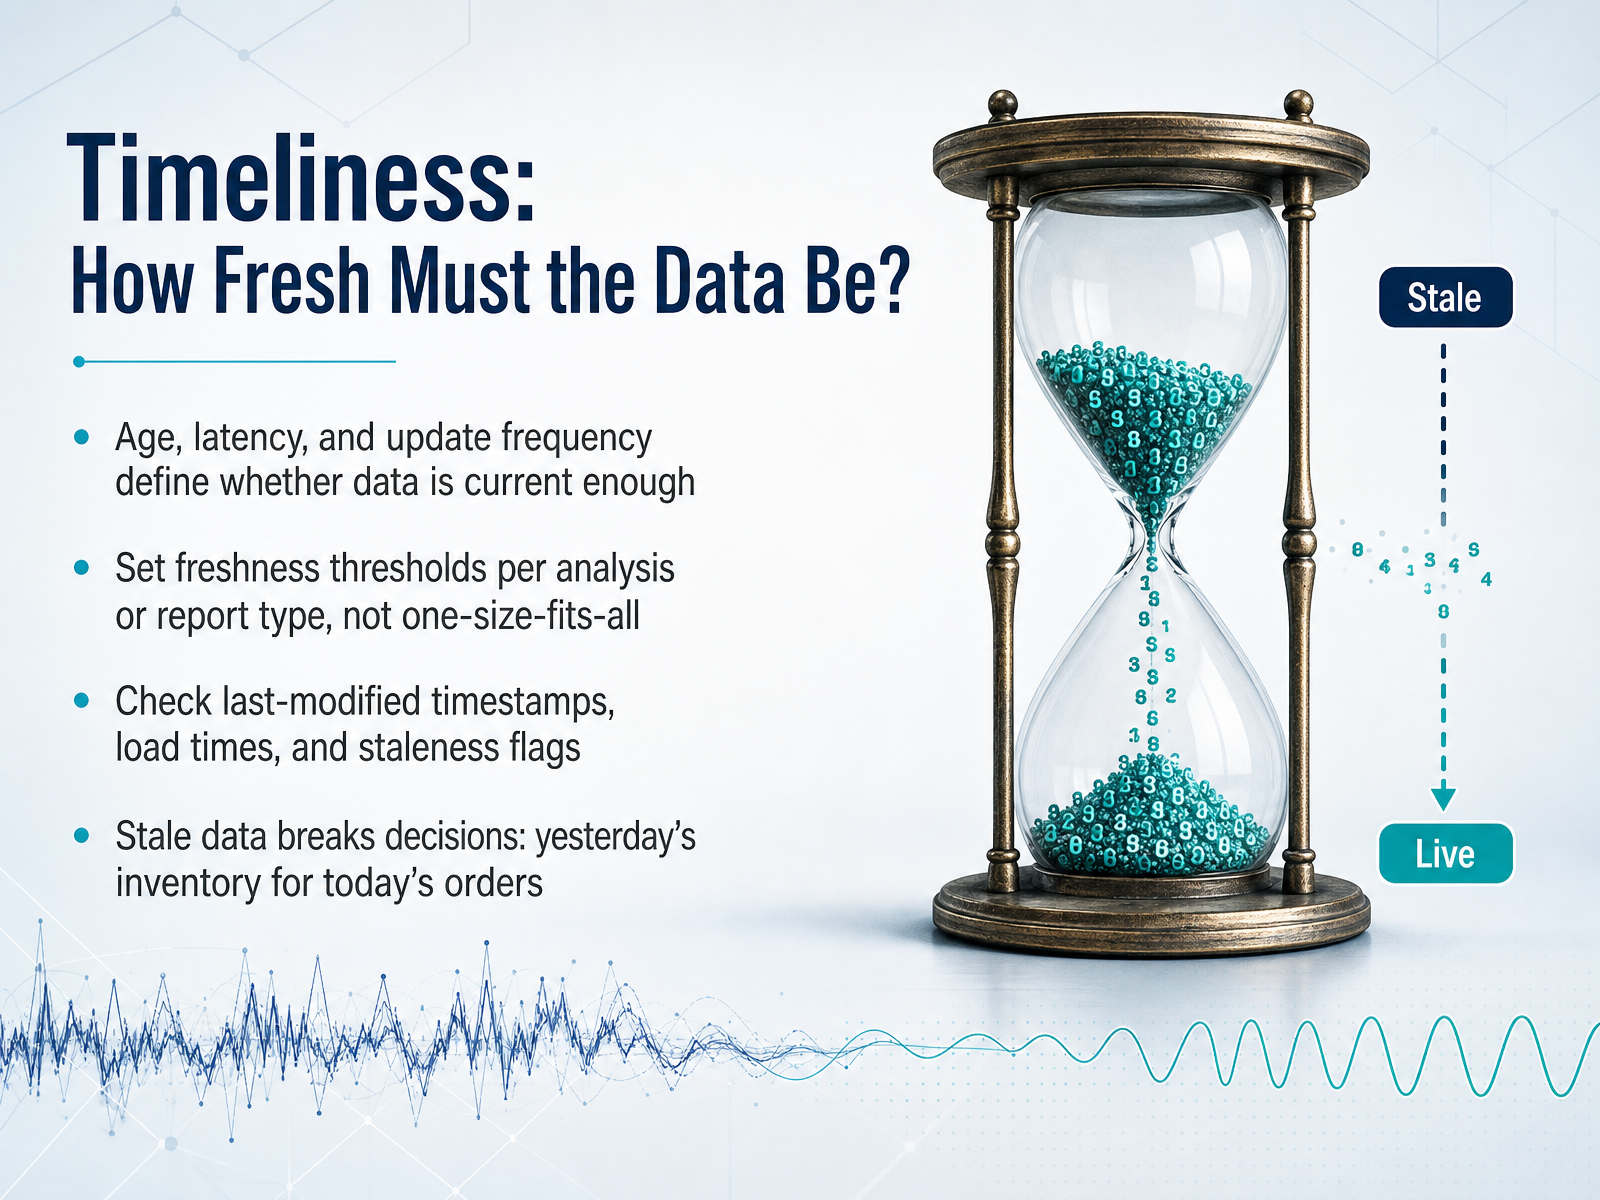
 - 06Timeliness: How Fresh Must the Data Be?Now let's talk about timeliness, because even correct data is useless if it arrives too late. Timeliness measures whether your data represents reality from the required point in time. The key concepts here are age, latency, and update frequency. Think of it as a freshness check: how long ago was this data captured, how quickly does it become available, and how often is it refreshed? The critical rule is that freshness thresholds are never one-size-fits-all. A real-time trading dashboard demands sub-second latency. A monthly financial summary can tolerate data that is hours or even a day old. You must set these thresholds per analysis or report type. To verify timeliness, check your last-modified timestamps, load times, and any staleness flags set by your pipeline. These are your direct, quantifiable measures. The impact of ignoring this is immediate. Using yesterday's inventory to fill today's orders leads directly to overselling or stockouts. Stale data breaks decisions. As a data quality gatekeeper, your job is to define how fresh is fresh enough for each use case and then enforce it. Next, we'll examine whether data follows the rules by looking at the dimension of validity: does it follow the rules?
 ibm.comibm.comdqglobal.com+22 min
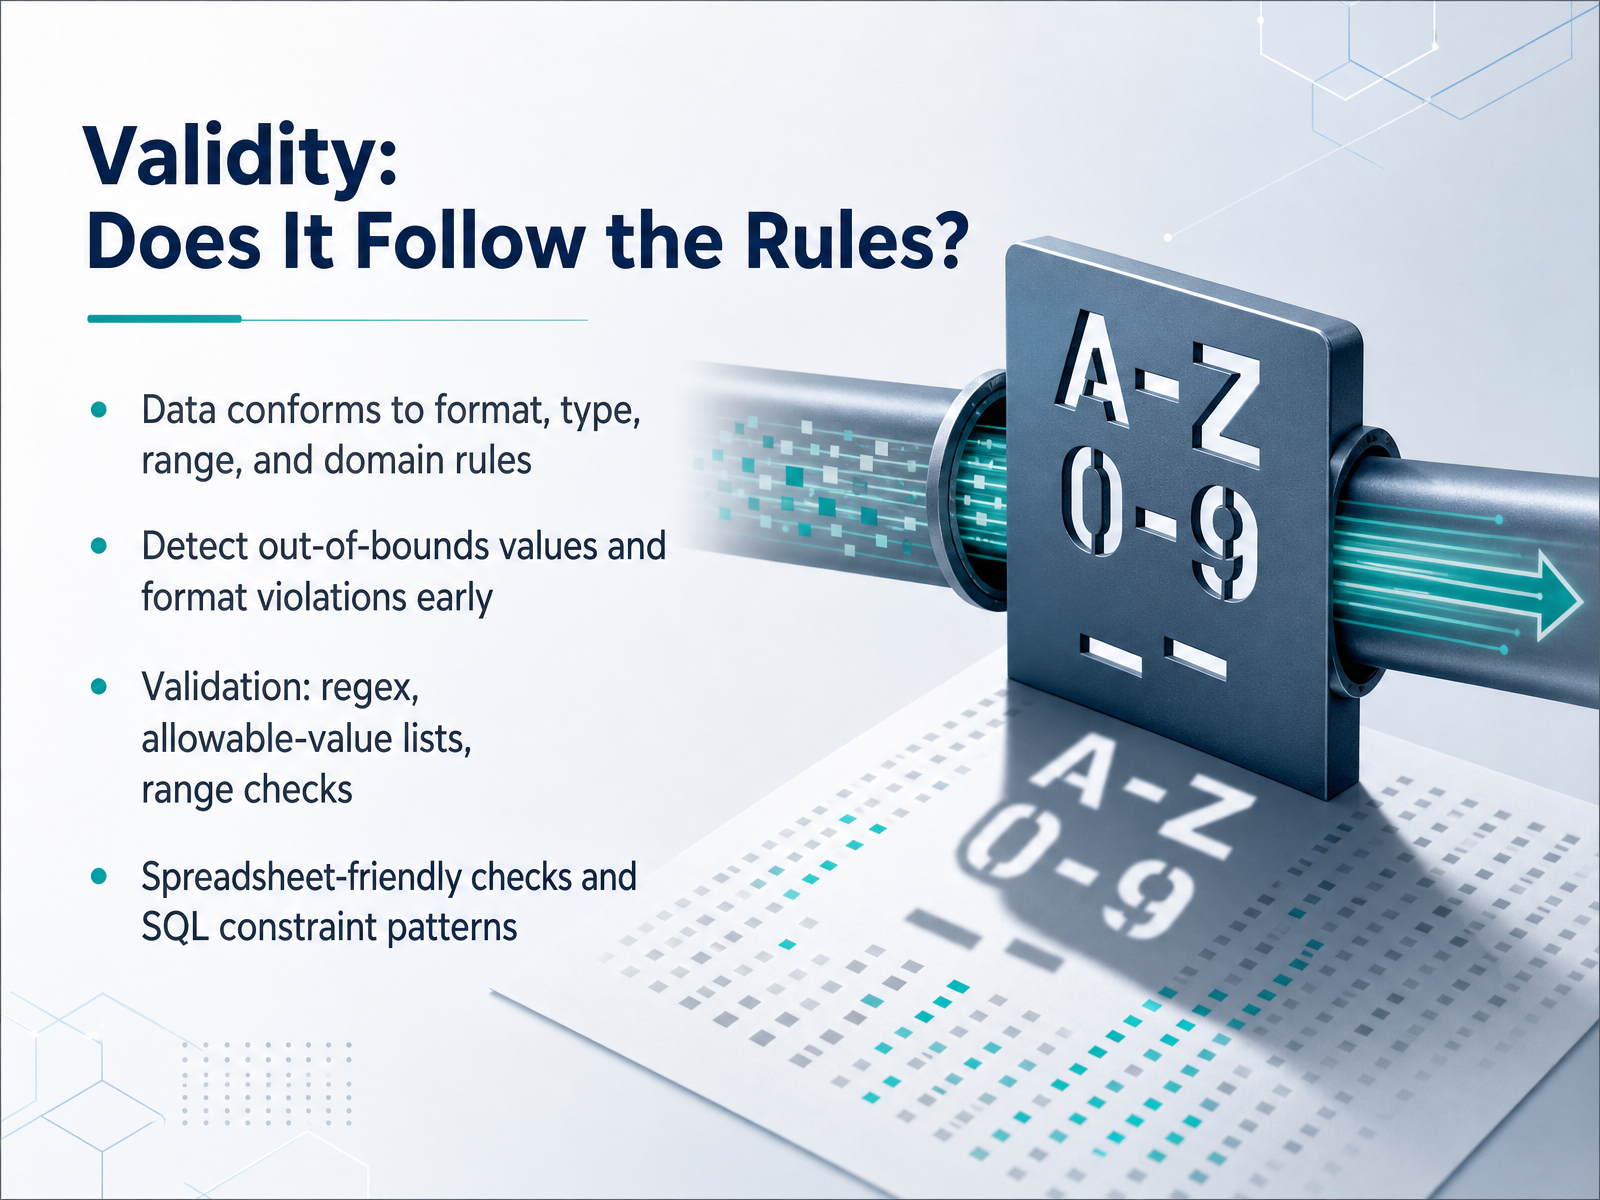
 - 07Validity: Does It Follow the Rules?Now, let's talk about validity. While completeness asks if something is there, validity asks if what's there follows the rules. Think of it as the gatekeeper that checks whether data conforms to its expected format, type, range, and domain. A valid value matches the structure you've defined. For example, a date field should contain a proper date, not a random string of letters. A percentage should fall between zero and one hundred, not three thousand. To catch these issues early, apply three practical validation techniques. First, use allowable-value lists to restrict entries to a specific set, such as country codes. Second, deploy range checks to flag out-of-bounds numbers immediately. Third, enforce format compliance using regex patterns to verify emails or phone numbers look correct before they enter your pipeline. In a spreadsheet, you can start with simple conditional formatting to highlight violations. In a database, you build these rules directly into your schema constraints or use check clauses in your SQL. Your job is to detect these violations at the entry point so they never corrupt a downstream report. Next, we will shift to another dimension: preventing unwanted copies.
 ibm.comibm.comdqglobal.com+22 min
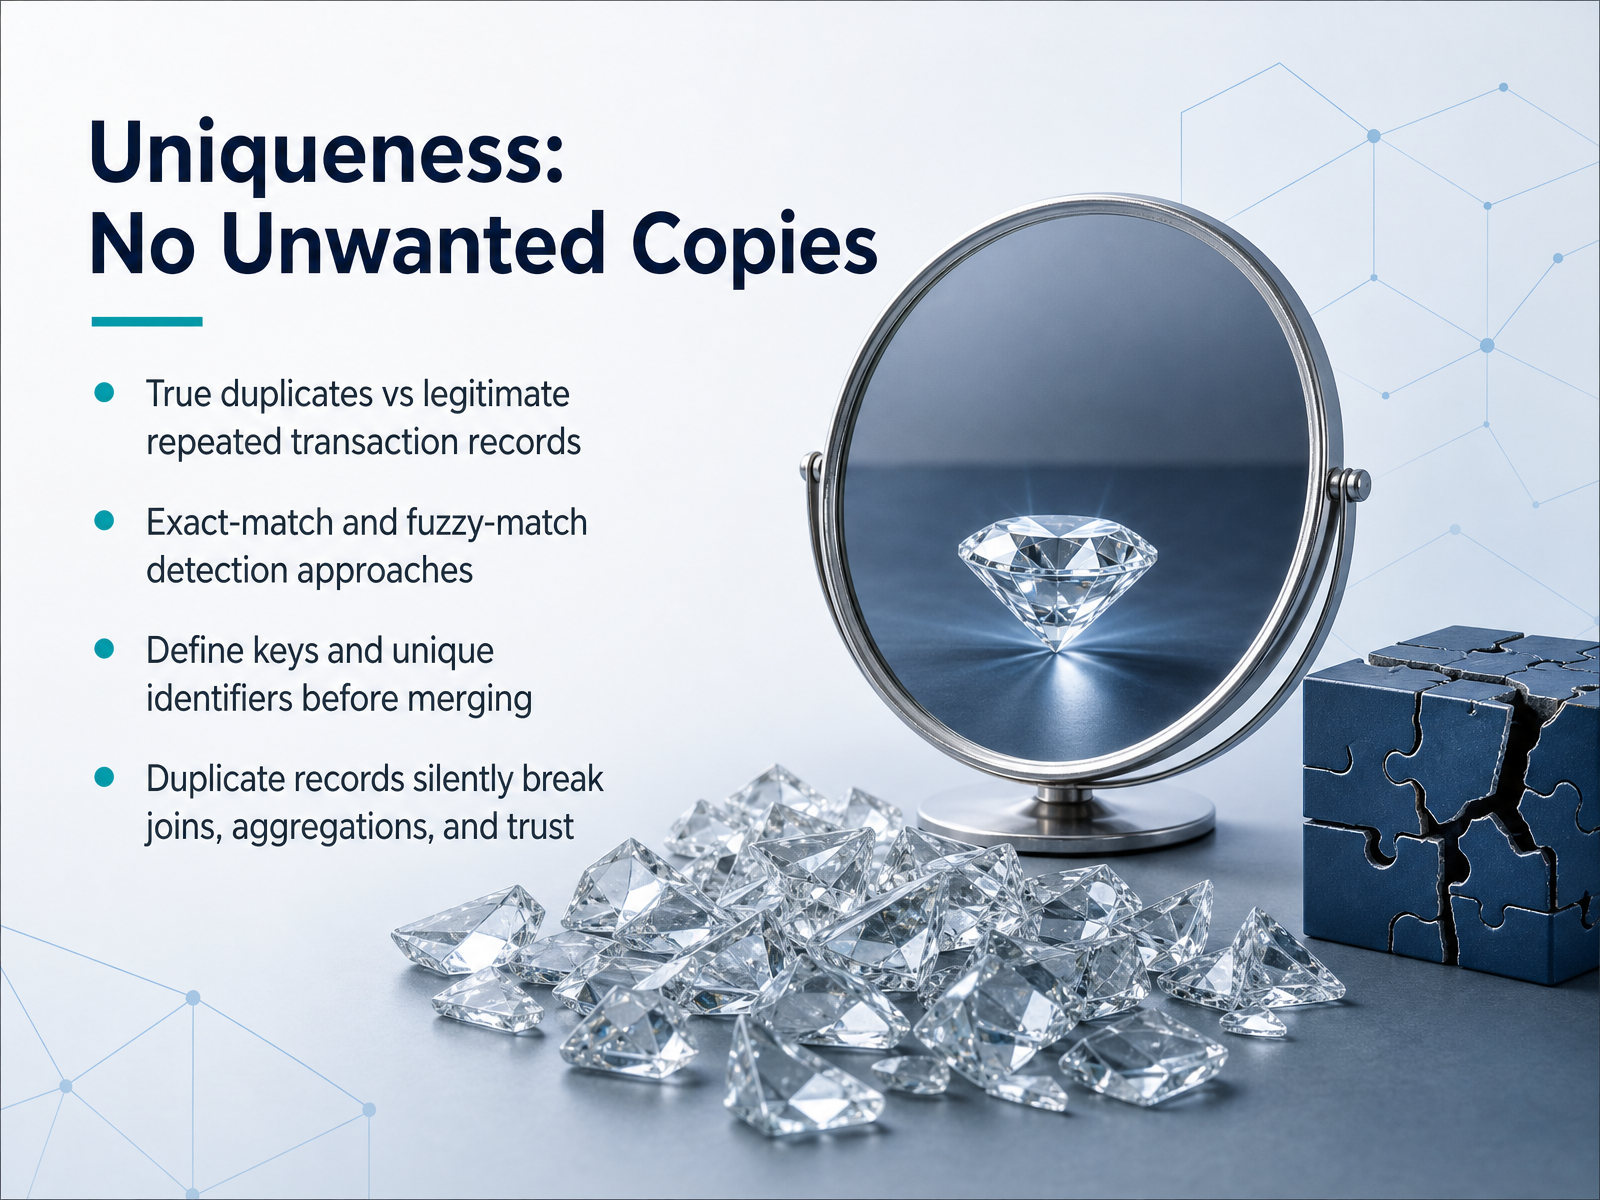
 - 08Uniqueness: No Unwanted CopiesNow let's talk about Uniqueness and why it's a silent killer of data trust. Uniqueness simply means no record is stored more than once, based on how it should be identified. But the real challenge is distinguishing a true duplicate from a legitimate repeat transaction. A customer placing the same order twice is valid business activity, while the exact same row appearing twice due to a pipeline error is a problem we must catch. To detect unwanted copies, you'll use exact-match detection for precise duplicates, and fuzzy-match techniques when you suspect near-identical records caused by typos or formatting differences. Before merging any datasets, always define your keys and unique identifiers first. If you skip this step, duplicate records will silently break your joins, inflate your aggregations, and ultimately destroy stakeholder trust in the numbers. Quantify uniqueness by measuring the percentage of distinct records against the total row count. Now let's apply a similarly methodical approach to our next dimension: Accuracy, arguably the hardest one to measure.
 ibm.comibm.comdqglobal.com+22 min
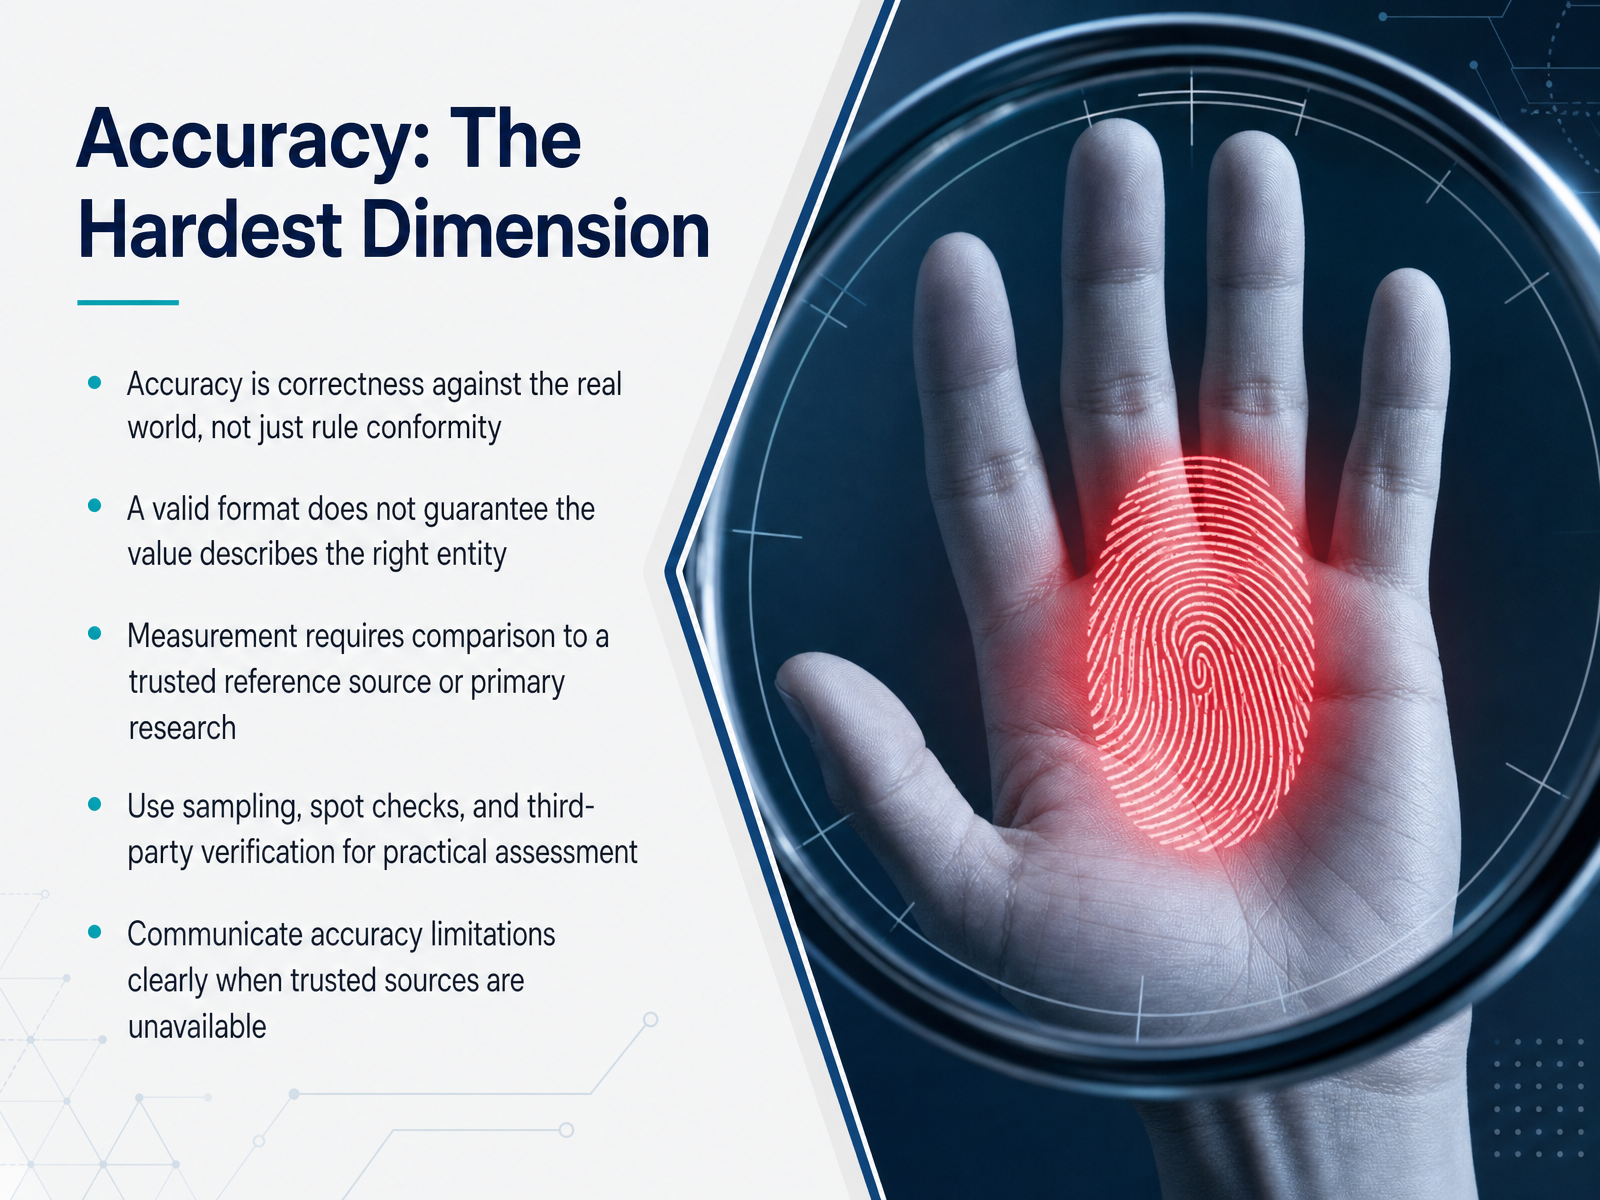
 - 09Accuracy: The Hardest DimensionNow, let's address the hardest dimension to measure: accuracy. Accuracy is not about whether a value fits a format. That is validity. Accuracy asks if the value correctly describes the real-world object or event. A phone number can have the right number of digits and still not belong to your customer. So, a valid format does not guarantee accuracy. To actually assess accuracy, you must compare your data against a trusted reference, like a primary source or a verified third-party system. Since checking every single record is rarely possible, use targeted spot checks and statistical sampling. And here is a key piece of professional advice: when a trusted source is unavailable, you need to communicate that limitation clearly. Your analysis can still be valuable, but the uncertainty must be transparent. Next, we will assemble a practical pre-analysis checklist to apply all these checks efficiently.
 ibm.comibm.comdqglobal.com+22 min
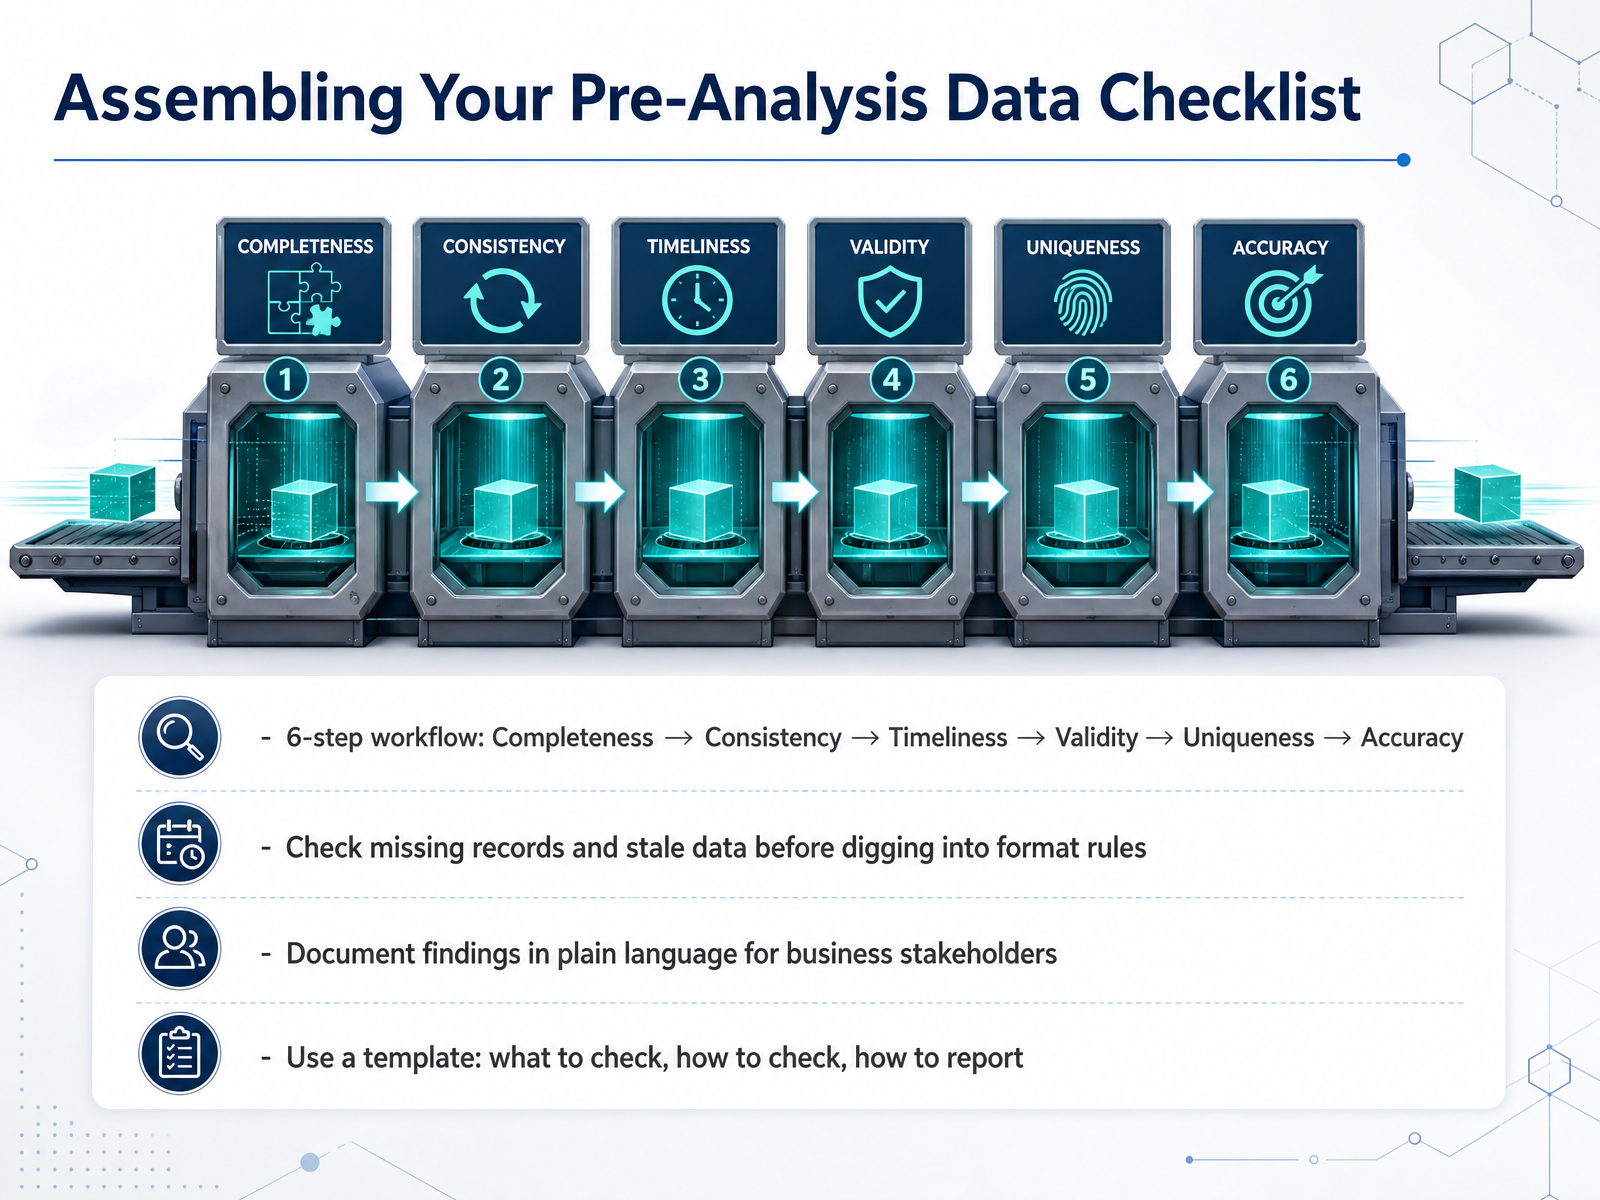
 - 10Assembling Your Pre-Analysis Data ChecklistNow you have your six-step workflow: completeness, consistency, timeliness, validity, uniqueness, and accuracy. This sequence is your pre-analysis checklist. Before you dig into format rules, verify completeness by counting missing records. Then confirm timeliness by identifying stale data. Those two checks alone catch many problems early. Document every finding in plain language that business stakeholders can understand. Use a standard template that spells out what to check, how to check, and how to report. When you follow a repeatable structure, you make your data fitness assessment transparent and defensible. Next, we’ll look at profiling and baselining before you build.
 training.dataversity.netudemy.comtraining.dataversity.net+21 min
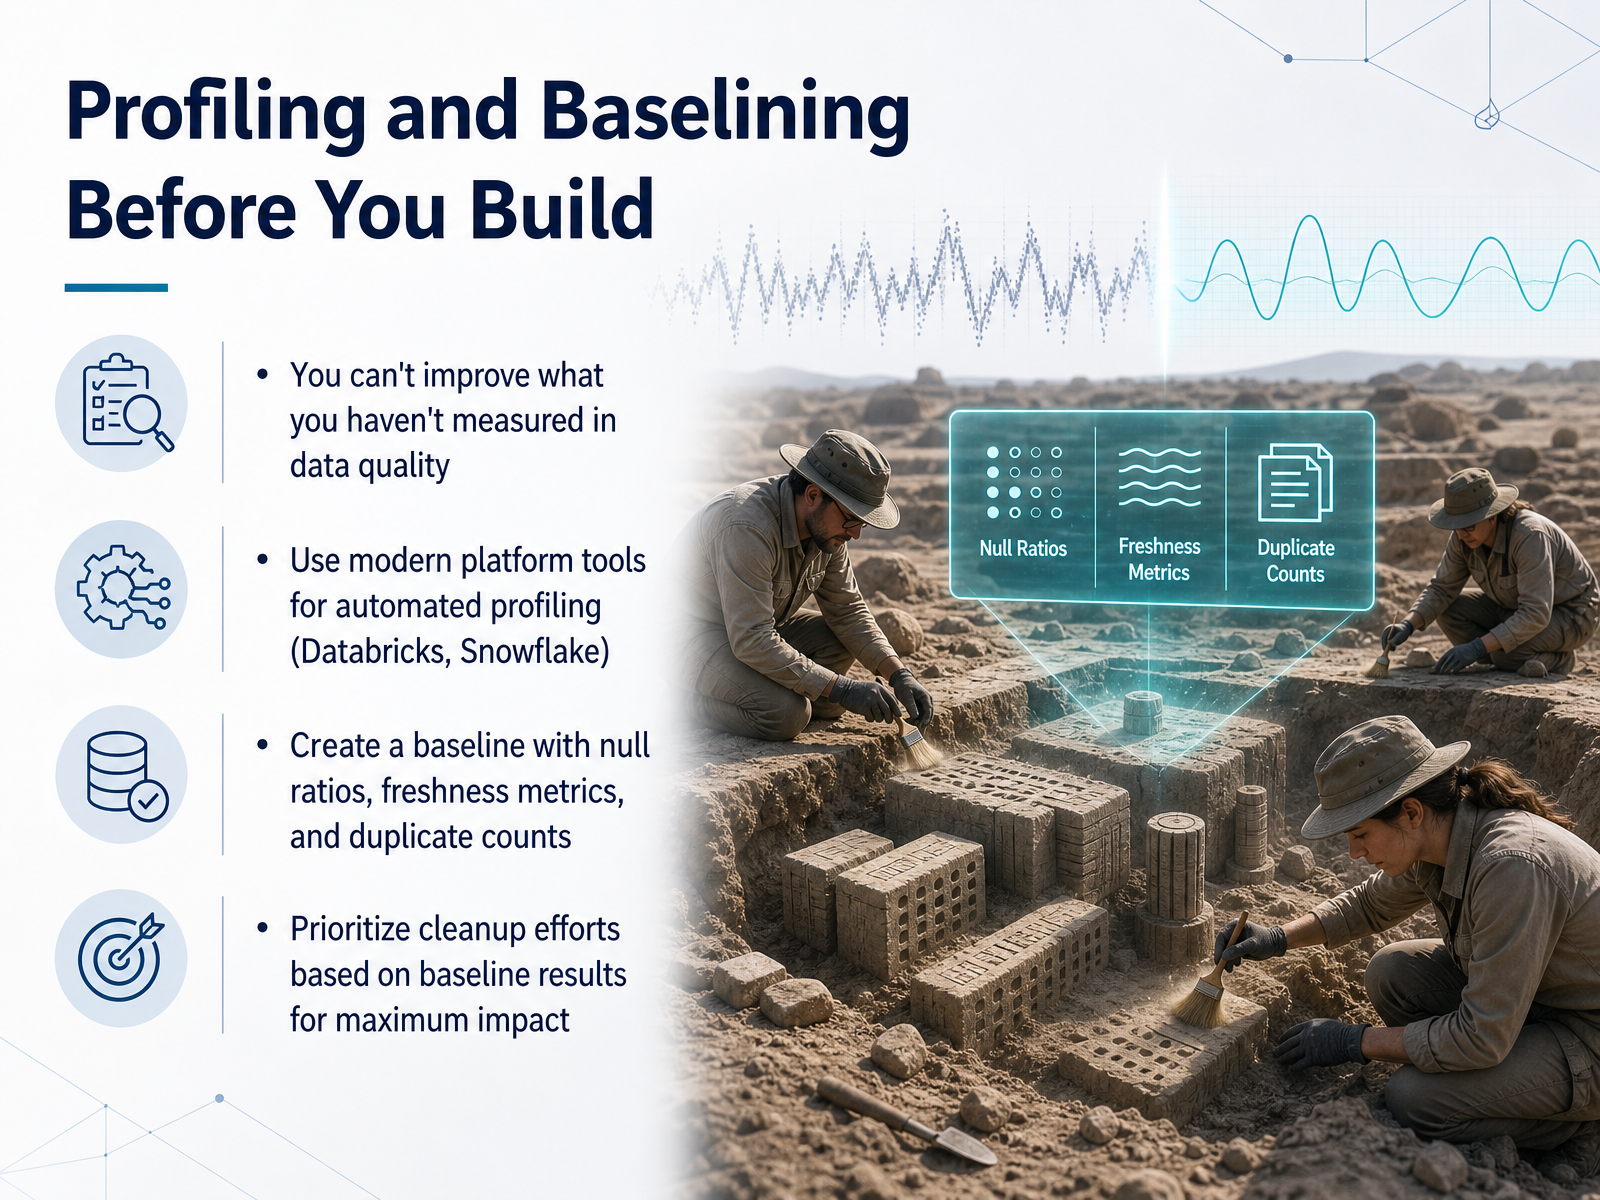
 - 11Profiling and Baselining Before You BuildNow, let’s get practical with profiling and baselining—because you can’t improve what you haven’t measured. Start by using your modern platform tools for automated profiling. In Databricks or Snowflake, you can generate column-level statistics with a single command. This immediately surfaces problems without manual inspection. Next, capture a clear baseline using three hard numbers: null ratios to measure completeness, freshness metrics to verify timeliness, and duplicate counts to assess uniqueness. Once you have that snapshot, prioritize your cleanup by the business impact the baseline reveals. Target the worst offenders first to deliver maximum value with minimum effort.
 training.dataversity.netudemy.comtraining.dataversity.net+21 min
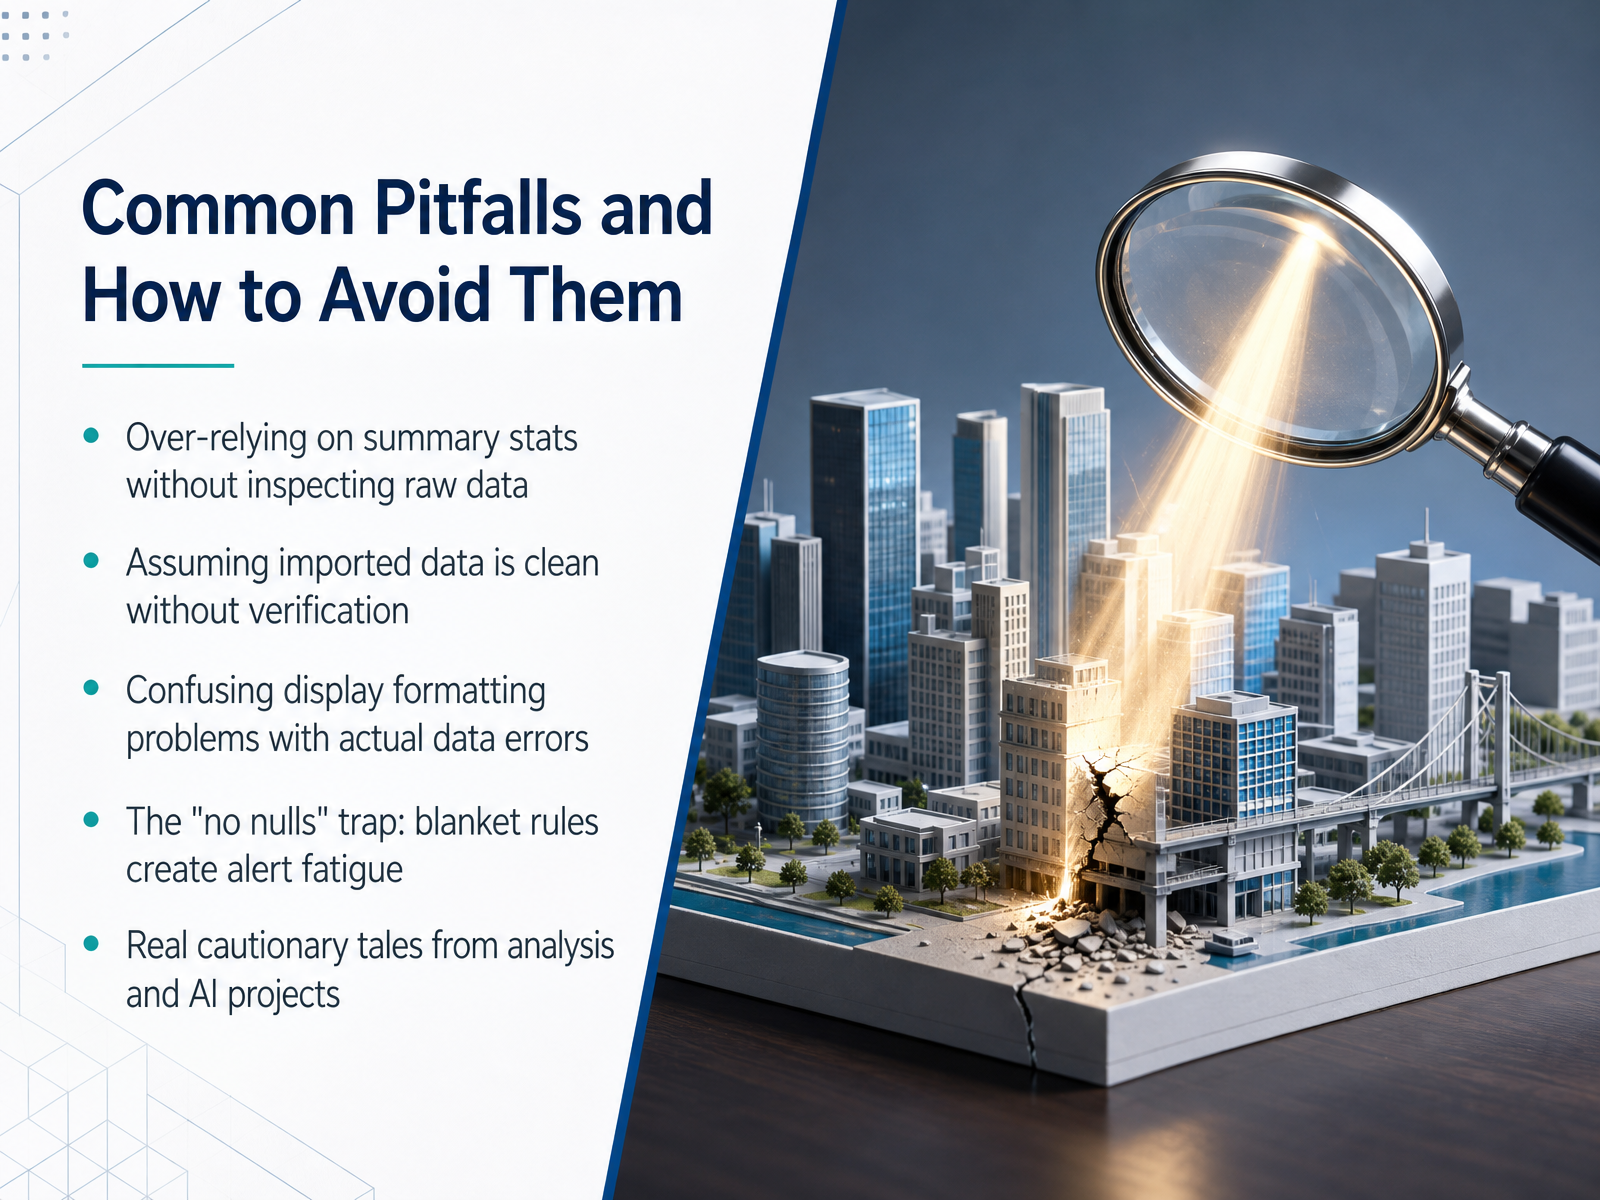
 - 12Common Pitfalls and How to Avoid ThemLet's move into the common traps that can erode trust in your data work. First, don't rely only on summary statistics. A mean or a median can hide outliers and missing segments that only reveal themselves when you inspect the raw records. Second, never assume imported data is clean. Always run a brief verification pass to check that field types, ranges, and patterns match your expectations. Third, watch for the difference between display formatting and actual data errors. A date that looks wrong because of a regional format setting is not the same as an invalid date value. One of the biggest pitfalls is the no nulls trap. Blanket rules that reject every null often create alert fatigue and force people to fill gaps with junk. This makes the data look complete but actually poisons downstream analysis. We have seen real projects fail because a model was trained on perfectly filled columns that were empty in production. AI initiatives are especially vulnerable when teams skip these sanity checks. Next, we will explore how automation and AI can take over these quality checks and make them scalable.
 2 min
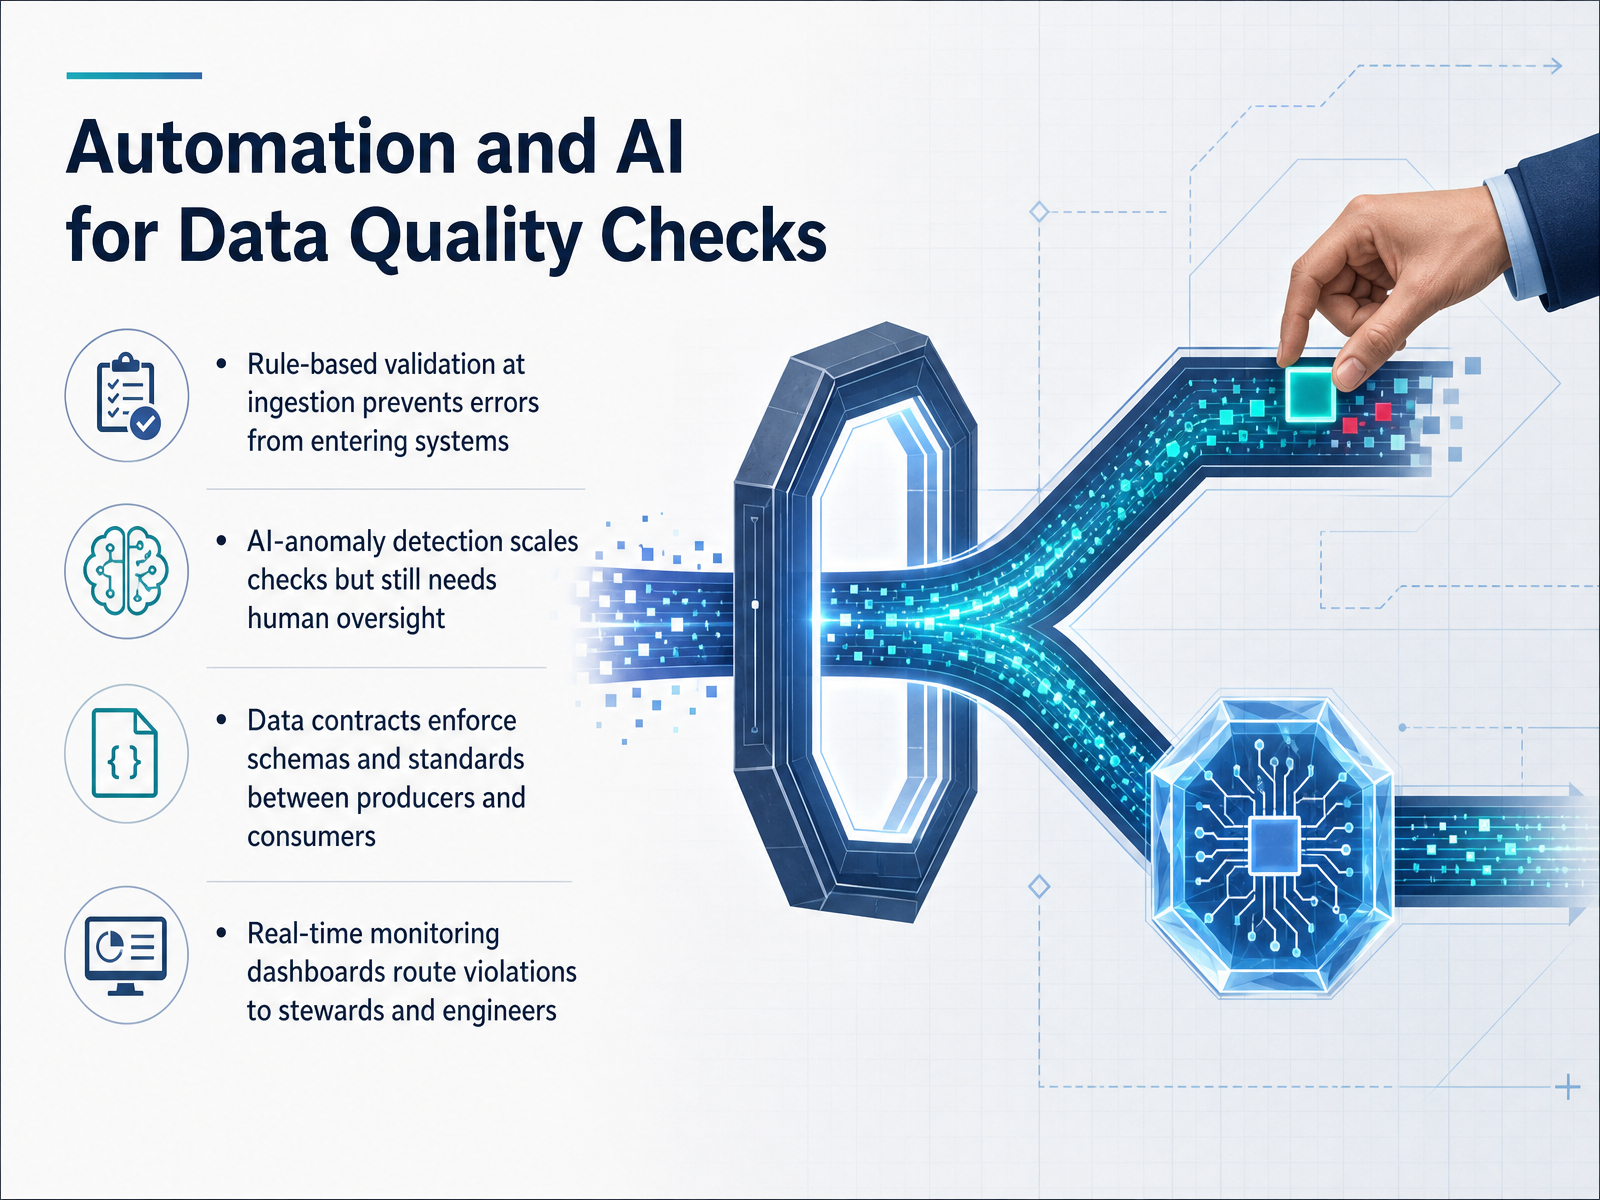
2 min - 13Automation and AI for Data Quality ChecksNow let's talk about how automation and AI are changing the data quality landscape. First, implement rule-based validation at ingestion. This means checking data formats, ranges, and required fields the moment data arrives, so errors get blocked before they ever enter your systems. Second, use AI for anomaly detection. Machine learning models can spot complex patterns that simple rules miss, but remember, these tools still need human oversight to verify flagged issues and avoid false positives. Third, establish data contracts between producers and consumers. A data contract enforces schemas and standards upfront, making sure everyone agrees on what valid data looks like. Finally, build real-time monitoring dashboards. When a violation occurs, the dashboard should automatically route it to the right person, policy violations to data stewards, and technical failures to engineers. Each of these approaches moves you from reactive cleanup to proactive prevention. Next, we'll examine the governance and culture that make these tools stick.
 training.dataversity.netudemy.comtraining.dataversity.net+22 min
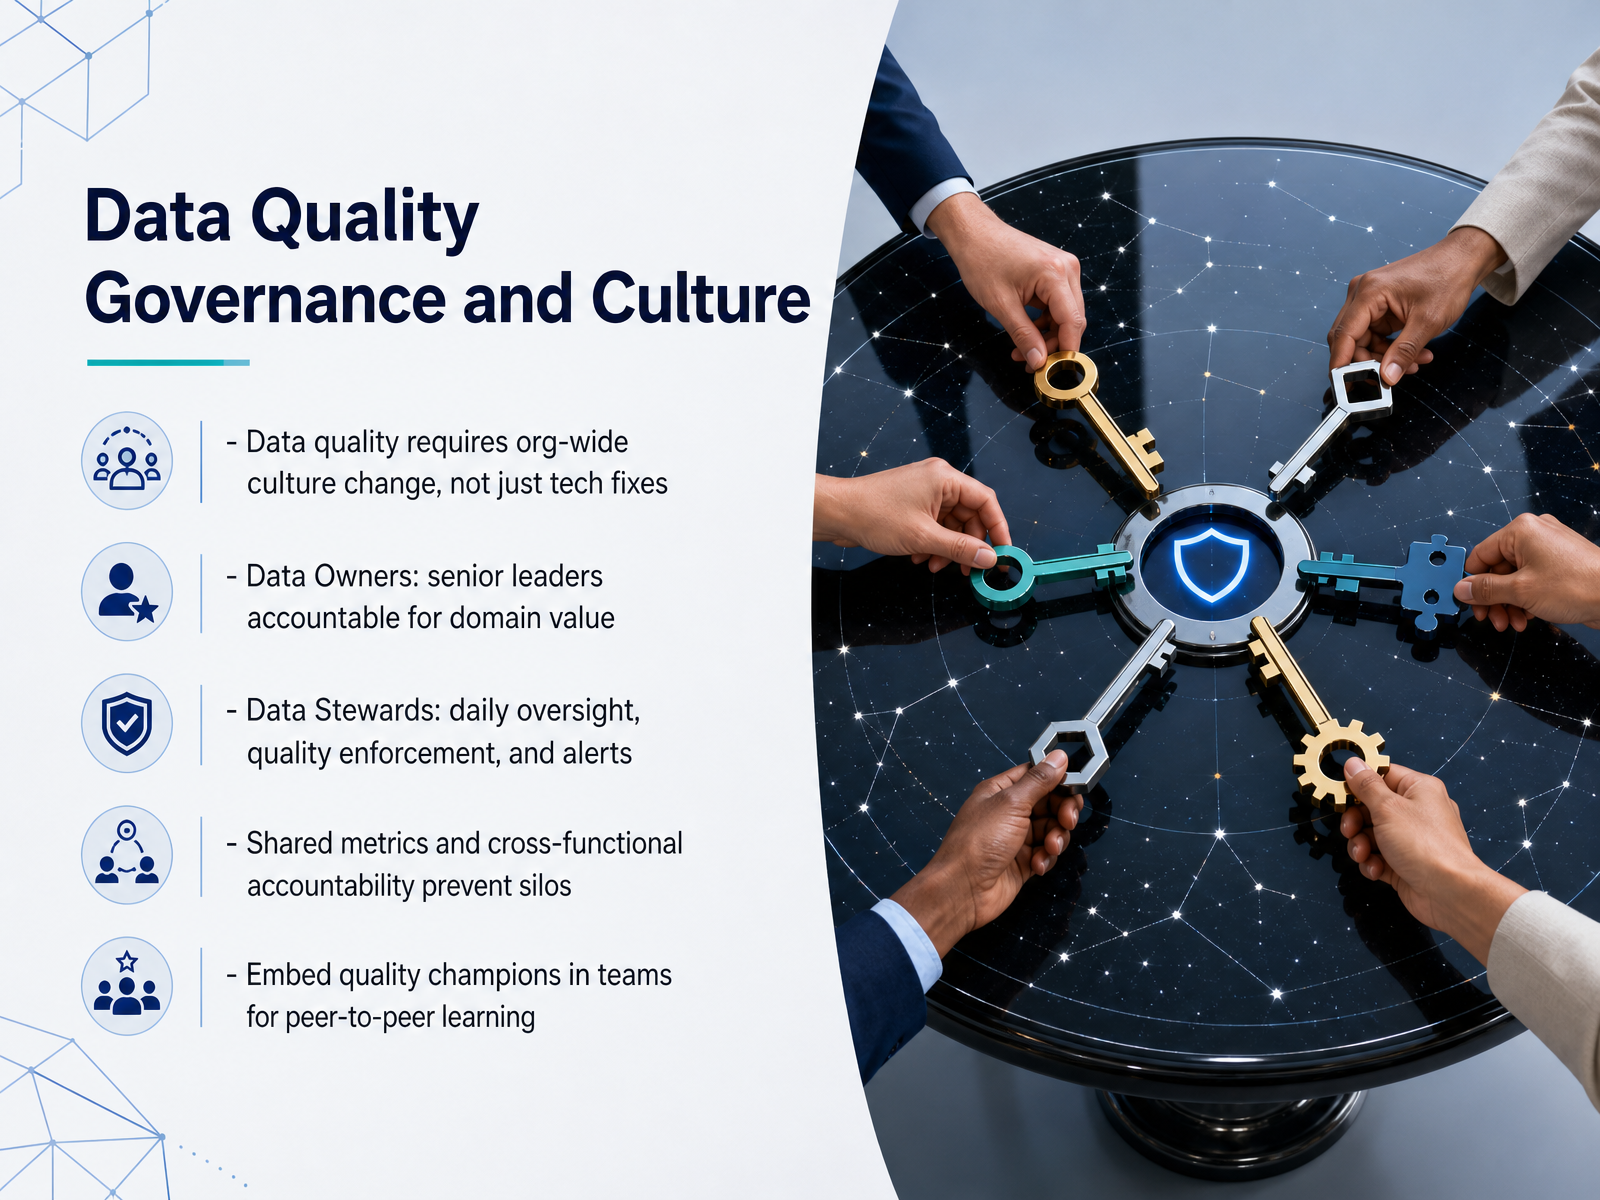
 - 14Data Quality Governance and CultureTechnology alone won't fix your data. Real data quality requires a shift in organizational culture, and that starts with clear ownership. Data Owners are senior leaders who are accountable for the value of their data domain. They champion quality at the executive level. Reporting to them, Data Stewards handle the daily oversight, enforce quality rules, and trigger alerts when things go wrong. To break down silos, you need shared metrics and cross-functional accountability. Sales, marketing, and operations must all be measured on the same data quality outcomes. A practical way to accelerate this culture change is to embed data quality champions directly within business teams. These champions drive peer-to-peer learning, answer questions on the spot, and reinforce standards in daily workflows. When quality becomes a shared professional practice instead of an IT mandate, it sticks. Up next, we'll move from governance structure to action and look at putting data quality into daily practice.
 training.dataversity.netudemy.comtraining.dataversity.net+22 min
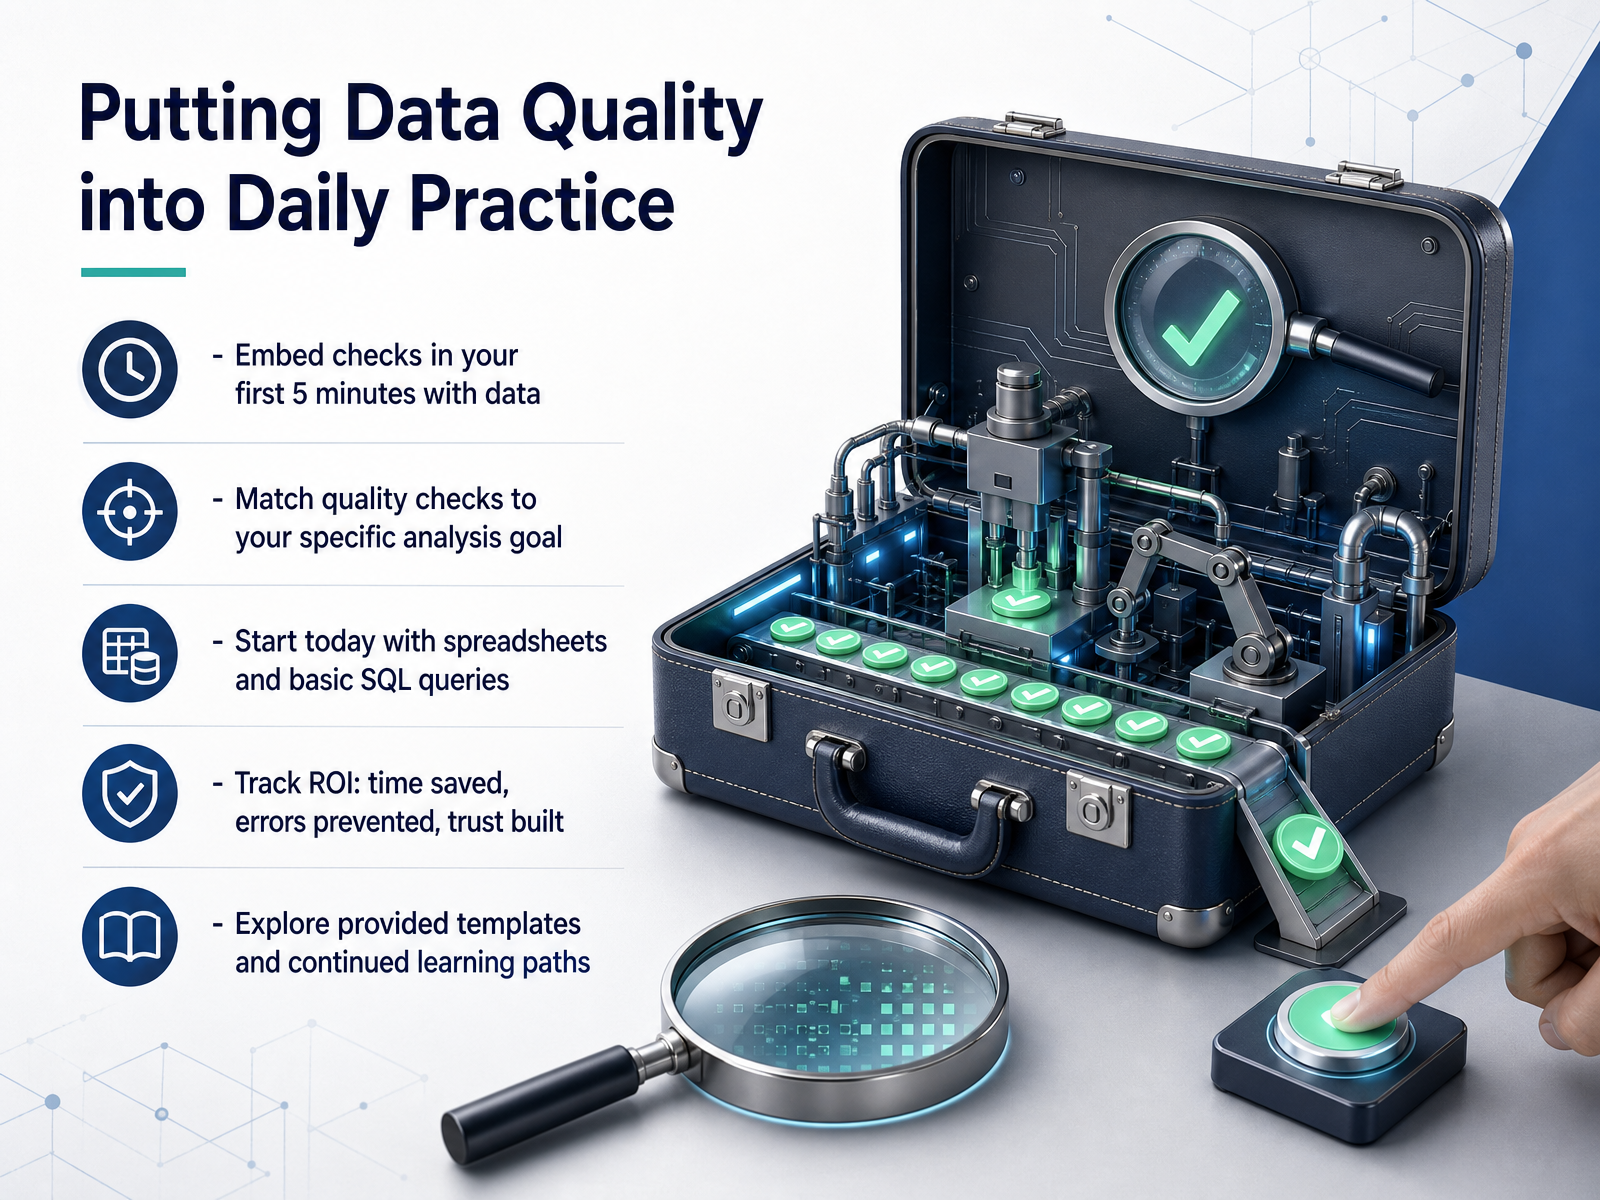
 - 15Putting Data Quality into Daily PracticeWe have covered a lot, so let us bring it all together into a daily routine you can start today. First, embed data quality checks within your first five minutes with any dataset. Verify completeness by counting missing values, and confirm column types match what you expect. Second, always match your quality checks to your specific analysis goal. If you are forecasting revenue, timeliness matters more than optional demographic fields. Third, begin with the tools you already use. A quick pivot table in a spreadsheet or a basic SQL count query is enough to catch many issues early. Fourth, track your return on investment. Note how much time you save by not reworking broken models, how many errors you prevent, and the trust you build with stakeholders who rely on accurate reporting. Finally, explore the templates and continued learning paths we have provided. These checklists and sample queries will help you build the habit until validation becomes second nature. Thank you for joining this course. You are now the person who ensures every analysis starts on a solid foundation. Trust the process, keep practicing, and your reputation for reliable insights will grow.
 2 min
2 min
Take the deck with you
Download this course as a file — free, no sign-up needed.
- PDF handoutEvery slide page, ready to print or share.16 pages · 4.2 MBDownload
- Narrated PowerPointThe deck that presents itself — every slide carries the digital human's narration video.16 pages · 15.7 MBDownload
- PowerPoint slidesThe full deck as a .pptx — open it in PowerPoint, Keynote, or Google Slides.16 pages · 4.1 MBDownload
Free to use in your own training — please keep the PersonWise credit page at the end.
Have your own deck? Turn it into a course
Sources consulted
Web sources consulted while building this course.
- Course — training.dataversity.net
- Data Quality Masterclass - The Complete Course — udemy.com
- Course — training.dataversity.net
- Course — training.dataversity.net
- How to improve data quality: 10 best practices for 2026 — rudderstack.com
- What Are Data Quality Dimensions? — ibm.com
- Data quality dimensions - IBM Documentation — ibm.com
- The six Primary dimensions for Data Quality asseSsment — dqglobal.com
- Unfolding Data Quality Dimensions in Practice: A Survey — doi.org
- Top 12 Data Quality Dimensions in 2026 — dagster.io