Business Analytics Tools: Selection & Workflow Design
Begin
14 pages · ~28 min
Business Analytics Tools: Selection & Workflow Design
Learn to select the right business analytics tools and design efficient workflows to drive data-informed decision-making in your organization.
What you’ll learn
- 01Business Analytics Tools: Selection and Workflow DesignWelcome. In this course, we are going to rethink how analytics tools get selected. The goal is not to add another vendor comparison to your inbox. It is to connect tool choice to the way your team actually works, from raw data to daily decisions. We will move away from feature-count procurement and toward a workflow-first approach. That means mapping how data flows and how people consume it before we evaluate a single product. We will also discuss how to pilot tools, how to apply governance, and how to iterate once something is live. This matters for analytics teams, business managers, and operations leads equally. By the end, you should be able to bridge the gap between a vendor checklist and your real analytics operations. Let us start with the core problem: why tool choice alone fails analytics teams.valiotti.commetrica.hashnode.devbasedash.com+21 min
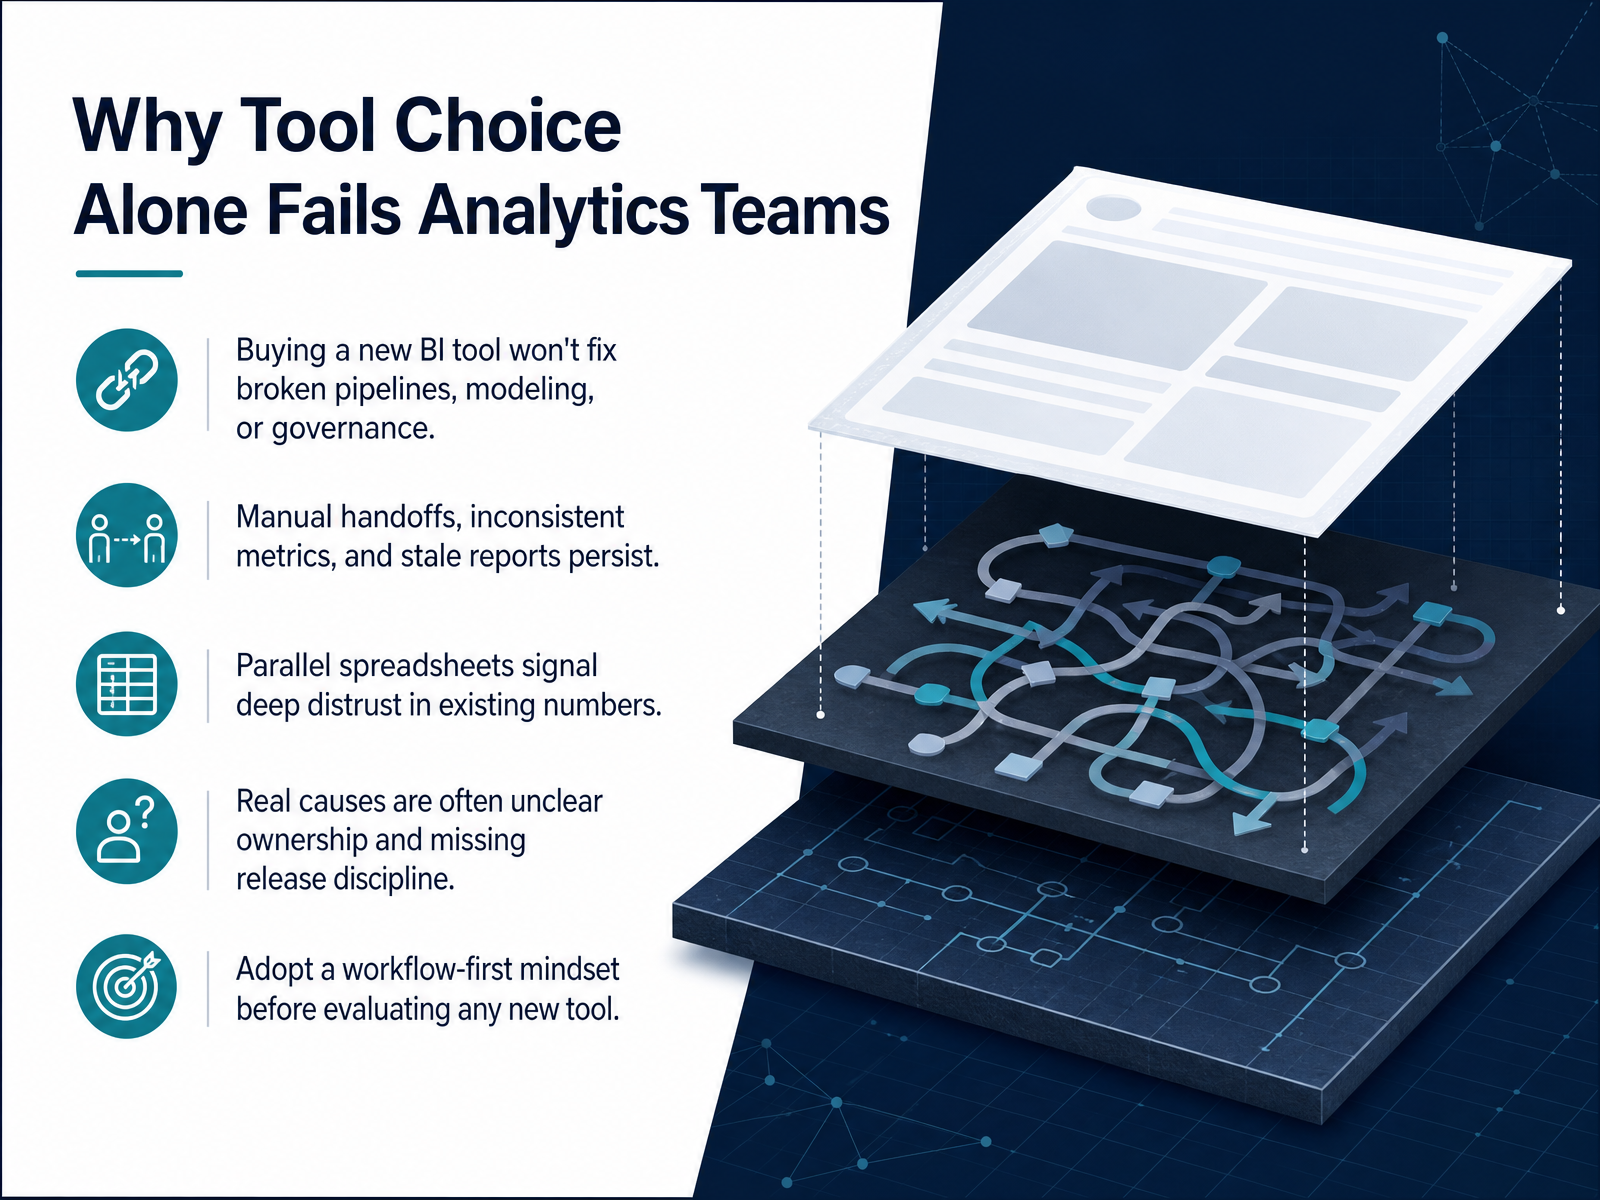
- 02Why Tool Choice Alone Fails Analytics TeamsLet's get specific about why tool choice alone rarely fixes an analytics team's problems. A new BI tool won't repair broken pipelines, flawed data models, or weak governance. Those are workflow issues, not software gaps. When manual handoffs linger between systems, metrics stay inconsistent, reports go stale, and the same reconciliation work repeats every cycle. One of the clearest warning signs is the parallel spreadsheet. When business users maintain their own numbers to double-check official dashboards, it tells you trust has already eroded. But the root causes are usually less visible: unclear ownership of data assets, missing release discipline, and changes that ship without anyone tracing downstream impact. So before comparing features or scheduling demos, we need to adopt a workflow-first mindset. Map how decisions actually get made and where the handoffs break. That diagnostic work is where the next slide begins: diagnosing where analytics workflows break down.
 rowerconsulting.comproductquant.devblog.anomalyarmor.ai+22 min
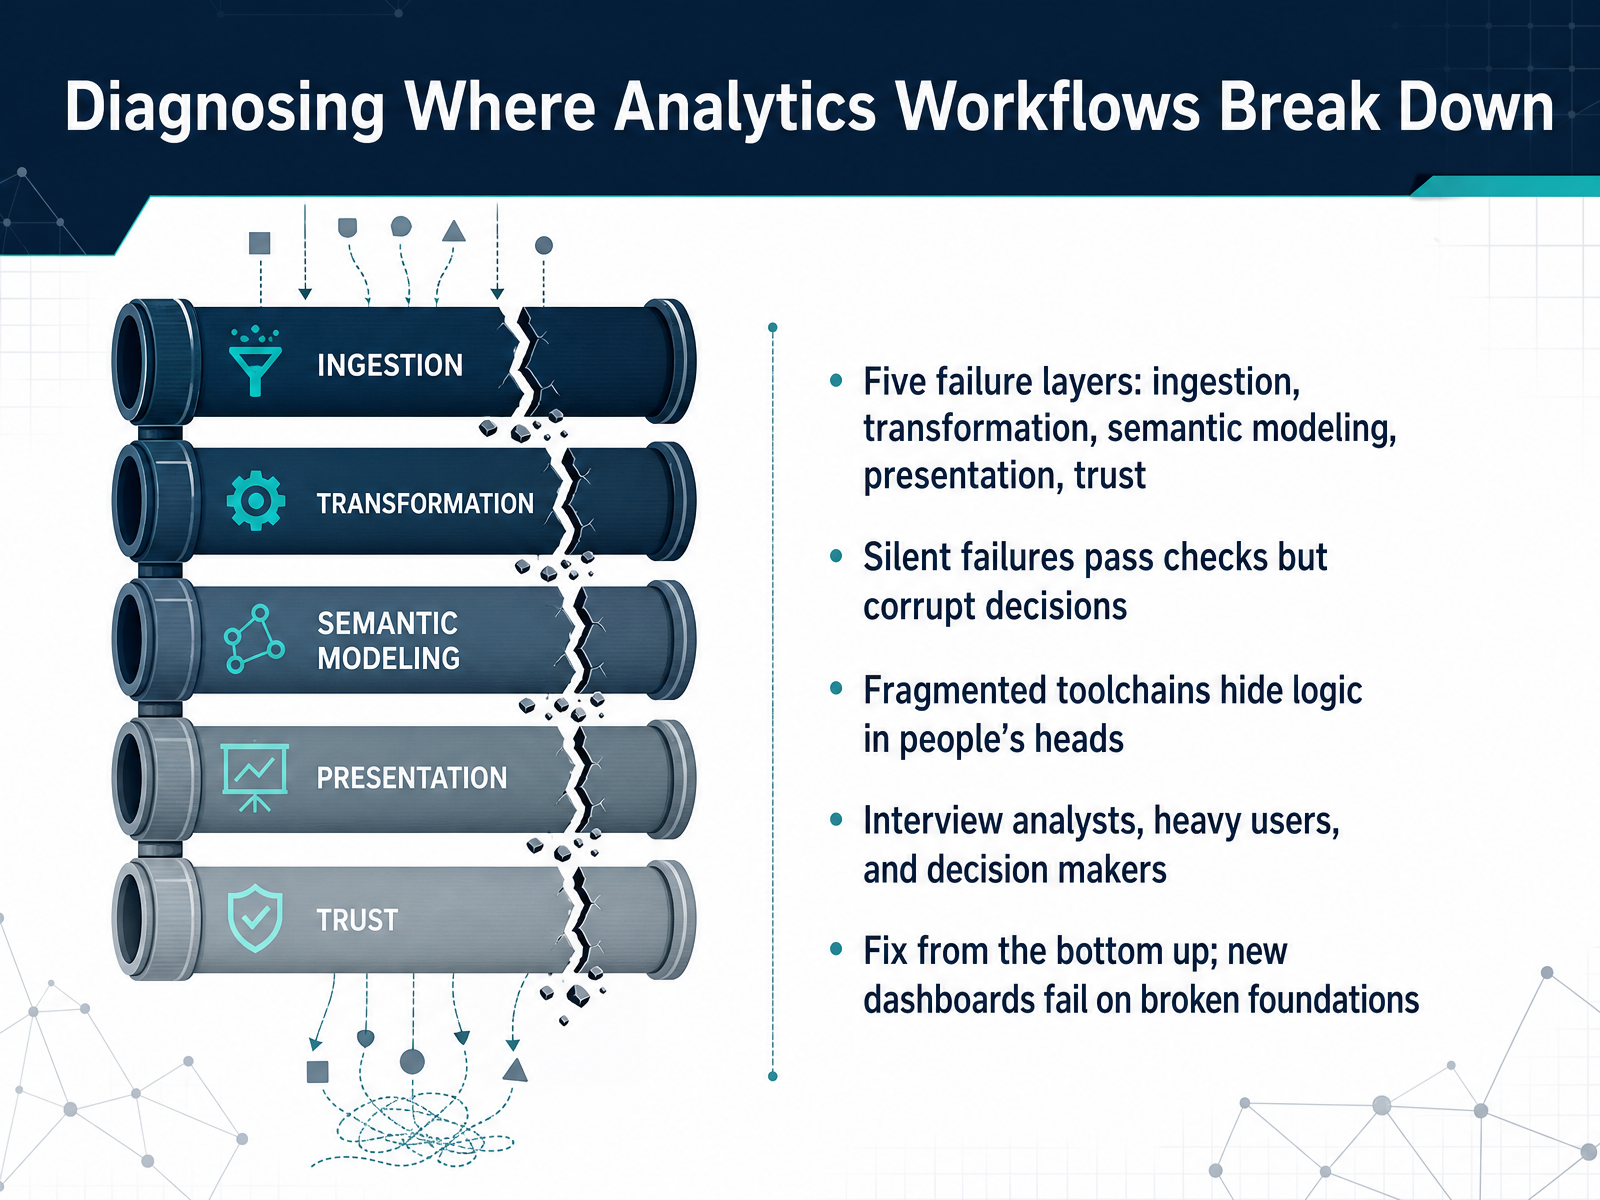
 - 03Diagnosing Where Analytics Workflows Break DownNow let's look at where analytics workflows actually break down. In my experience, failures tend to cluster in five layers: ingestion, transformation, semantic modeling, presentation, and trust. The first two are about data moving and being reshaped correctly. The third is whether the model matches how the business really works. The fourth is whether the output reaches people in a usable form. And trust is the layer where everything else succeeds or fails. What makes this hard is that many failures are silent. The pipeline runs, the dashboard loads, and the numbers look approximately right, but the underlying data is wrong. The dashboard has no way to flag that. Another common issue is fragmented toolchains. When logic lives in people's heads and manual handoffs, reporting slows down and numbers start to conflict. To diagnose this properly, talk to three groups: the analysts who build, the heavy users who rely on the outputs, and the decision makers who act on them. Ask each group the same questions about surprises, workarounds, and trust. The pattern in their answers will point you to the right layer. And here is the key: fix from the bottom up. A new dashboard on a broken foundation fails just as fast as the old one. Next, we will map the analytics workflow before choosing tools.
 rowerconsulting.comproductquant.devblog.anomalyarmor.ai+21 min
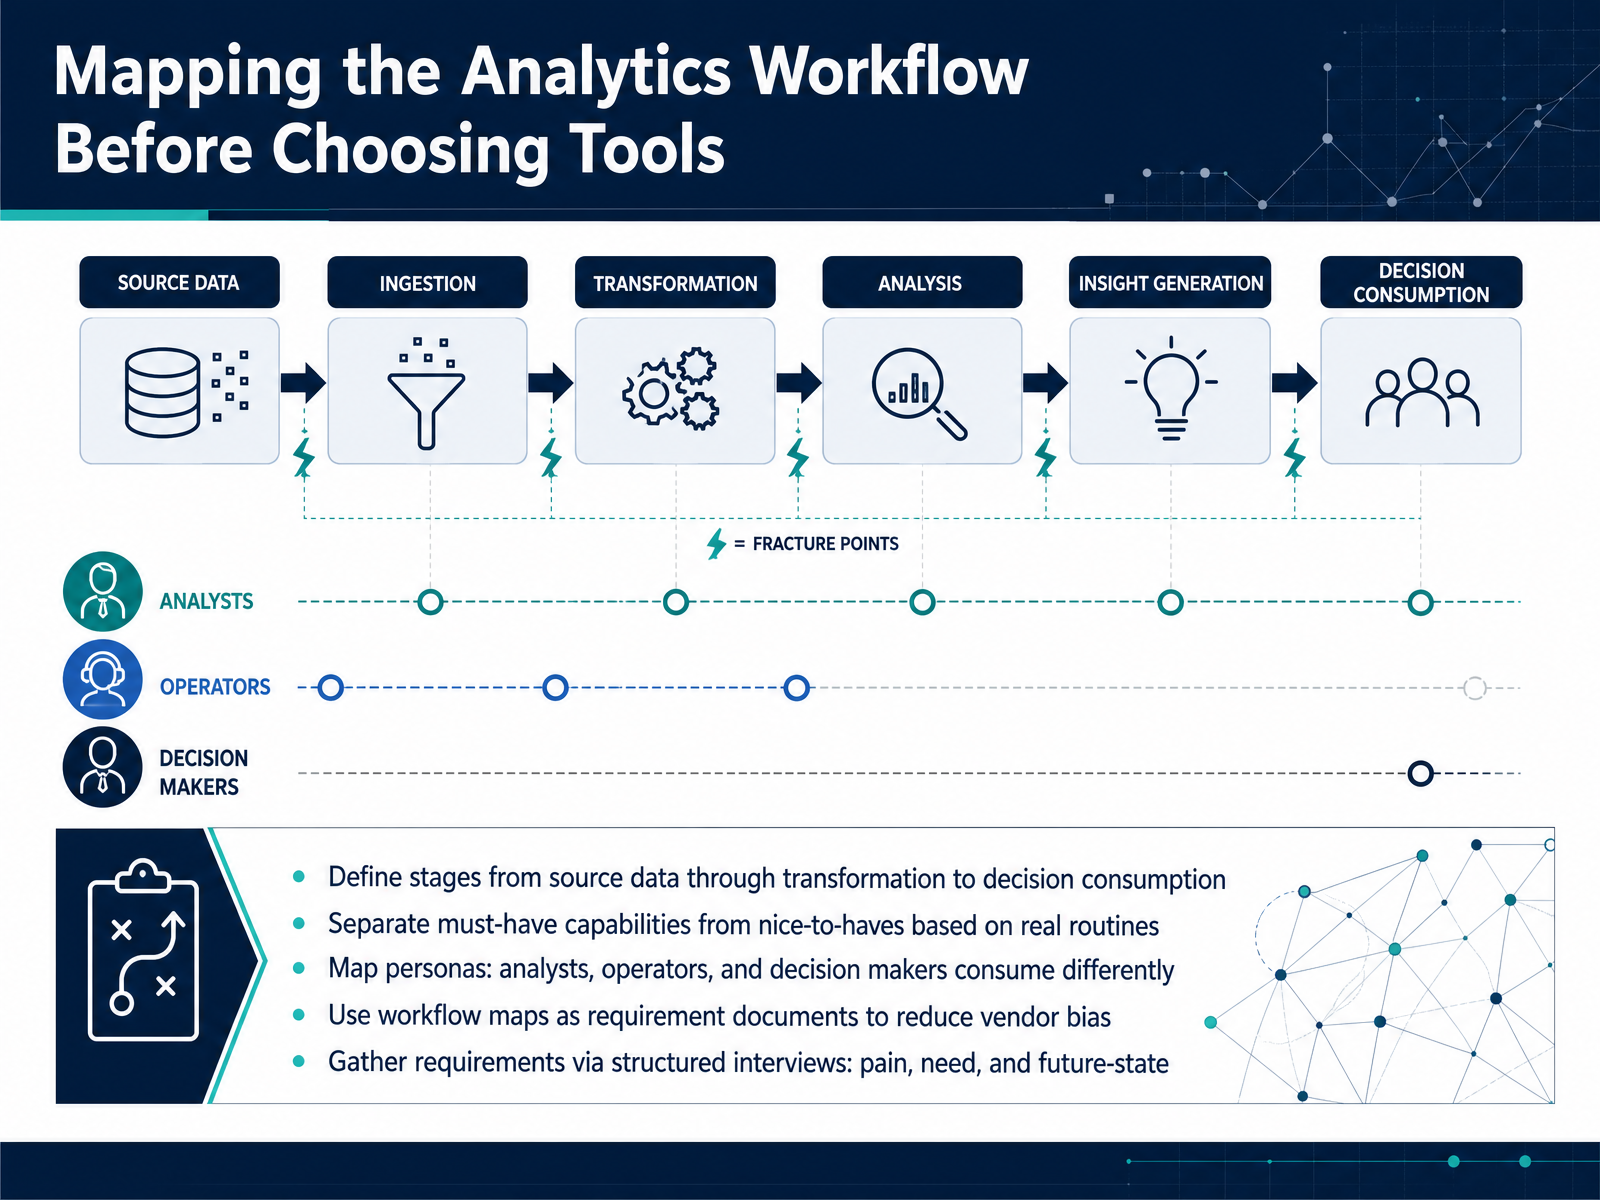
 - 04Mapping the Analytics Workflow Before Choosing ToolsOne of the most common mistakes in tool selection is starting with vendor demos before understanding your own workflow. On this slide, we flip that sequence. Mapping the analytics workflow before choosing tools means defining your stages clearly, from source data, through transformation, to the point where someone makes a decision. Once you have that map, separate must-have capabilities from nice-to-haves based on the routines people actually follow every day. Next, map the personas. Analysts, operators, and decision makers consume information differently, so their requirements will not be identical. Treat the workflow map as a living requirement document. This reduces vendor bias because you are evaluating tools against how your organization works, not against a sales pitch. To build that map, use structured interviews that focus on three areas: current pain points, immediate needs, and the desired future state. In our next slide, we will use those workflow requirements to evaluate tool capabilities against weighted needs.
 infotech.comanalytics8.comcalligo.io+22 min
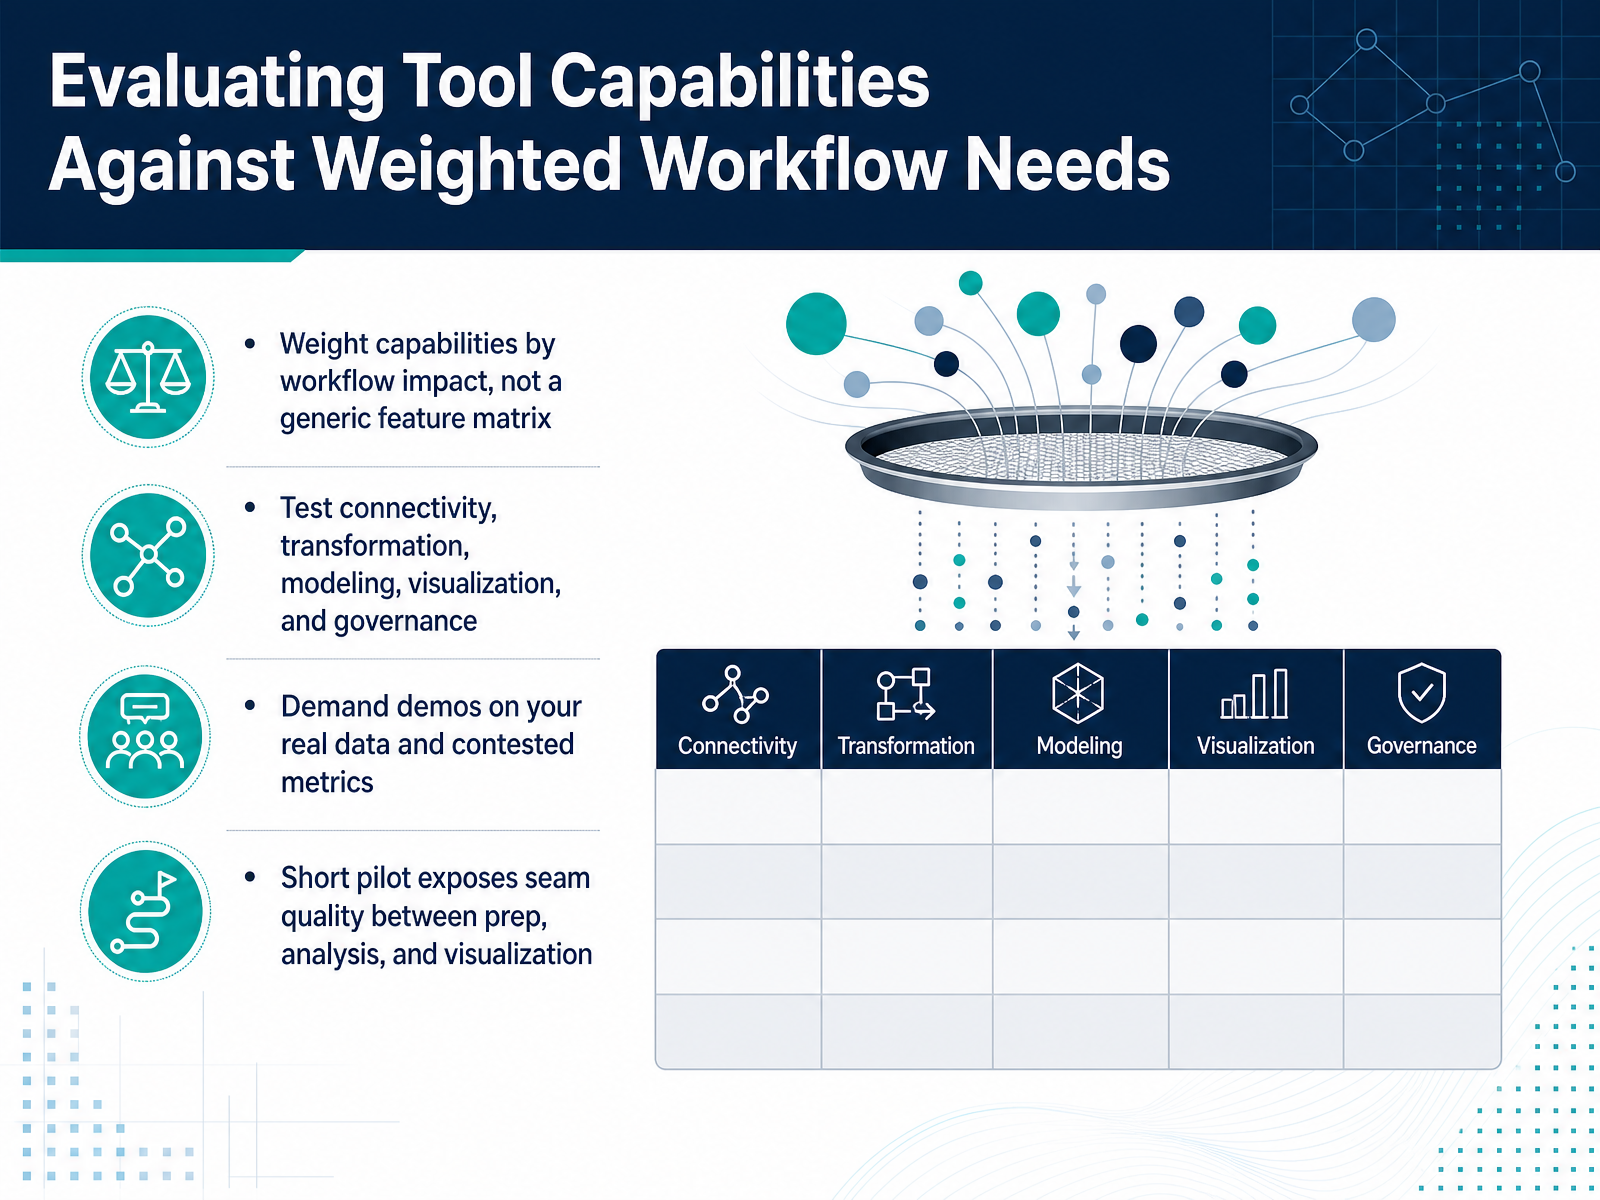
 - 05Evaluating Tool Capabilities Against Weighted Workflow NeedsNow let's talk about how to evaluate what a tool actually does, against what your workflow actually needs. The first rule is to weight capabilities by workflow impact, not by the size of a generic feature matrix. A long list of connectors doesn't matter if the one source you rely on breaks every refresh. Start with the five areas that carry real weight: connectivity, transformation, modeling, visualization, and governance. Governance is how you keep metric definitions consistent and access controlled, and it often decides whether a tool scales beyond a pilot. Next, demand demos on your real data. Ask vendors to load a contested metric, like net revenue or active customers, and show you the same number across a dashboard, an ad hoc query, and an AI assistant. Finally, run a short pilot that exposes the seams between preparation, analysis, and visualization. Hand-offs are where tools disappoint, not in the polished demo path. Up next, we'll look at total cost of ownership and the hidden operating costs that live outside the license fee.
 gooddata.aitellius.comgooddata.ai+21 min
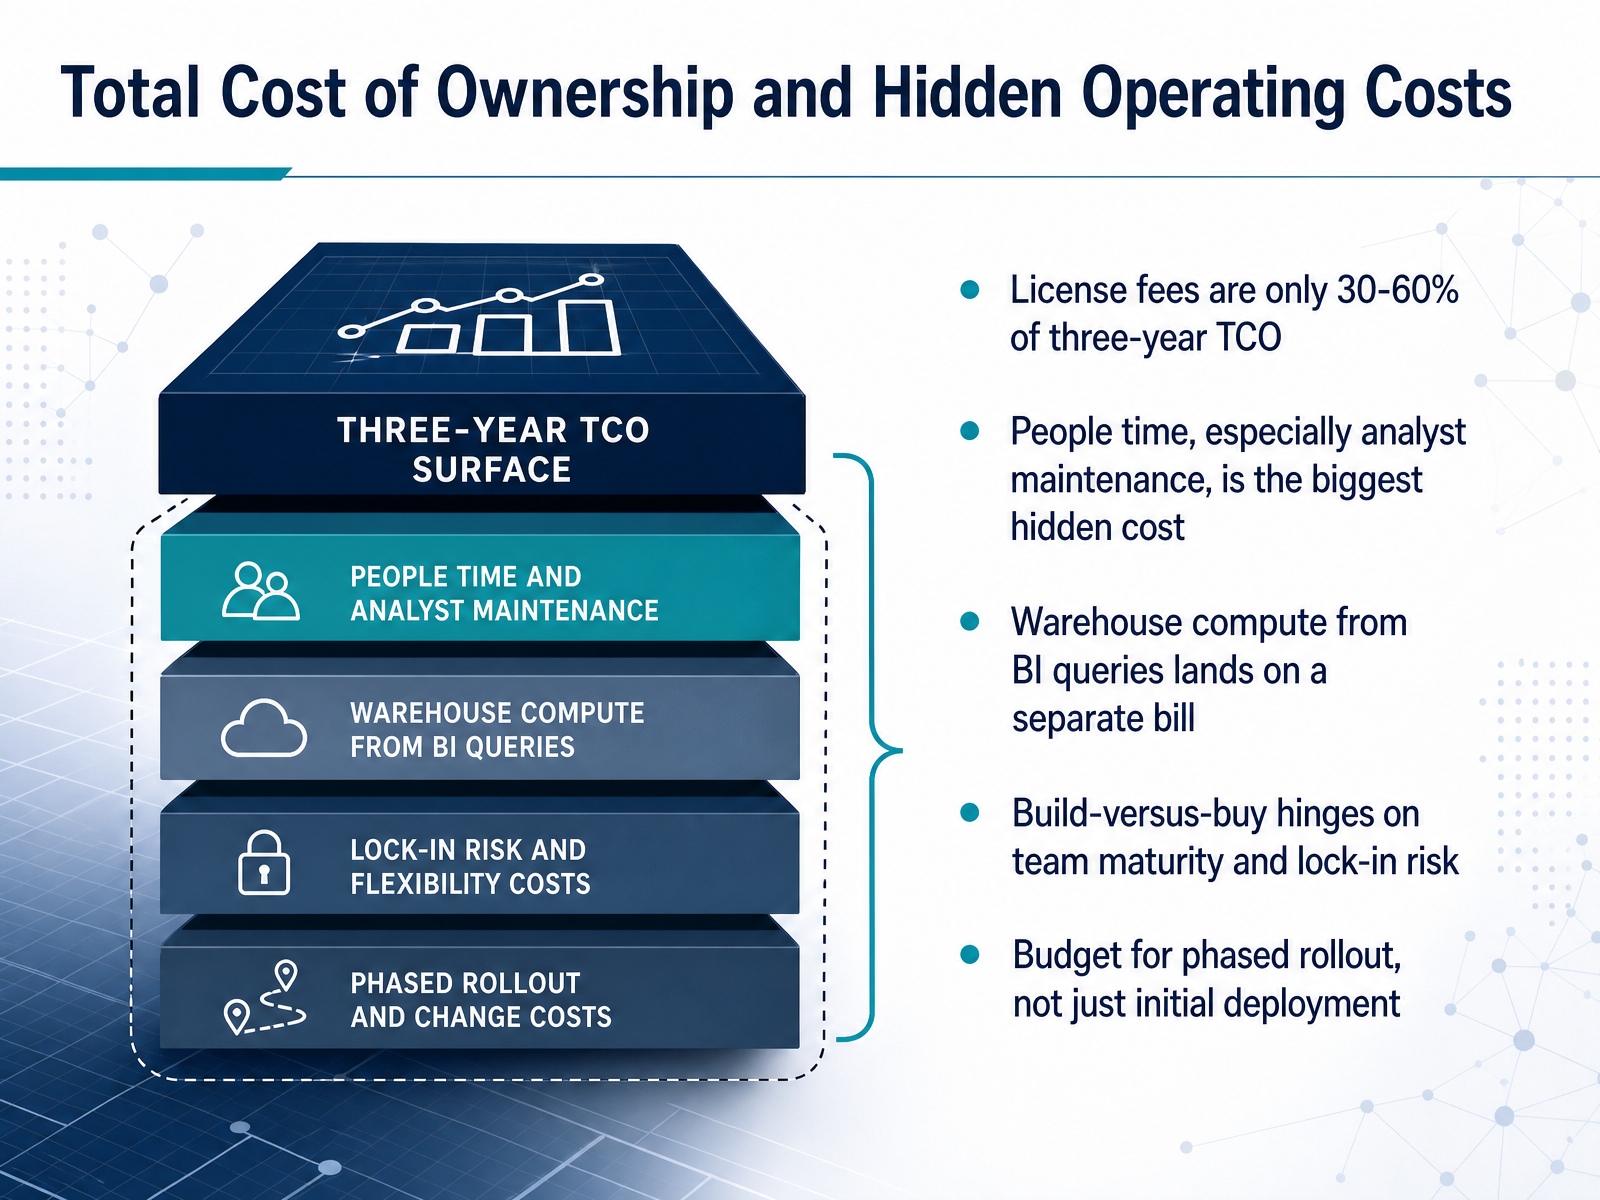
 - 06Total Cost of Ownership and Hidden Operating CostsThis is where the sticker price stops being the story. When we look at a three year horizon, license fees usually only make up thirty to sixty percent of the true total cost of ownership. The biggest line item hiding in the budget is people time, specifically the analyst hours spent maintaining dashboards and handling ad hoc requests. On top of that, the compute your BI tool triggers in Snowflake or BigQuery lands on a completely separate cloud bill, so it never shows up on the vendor quote. That is why the build versus buy decision can't hinge on features alone. It really comes down to your team's maturity and how much exit friction you can tolerate. My advice is to stop thinking about the initial deployment price tag. Instead, budget for a phased rollout that accounts for these operating costs over time. Up next, we will dig into the mechanics of avoiding vendor lock in and those exit surprises that catch teams off guard.
 basedash.comgooddata.aitellius.com+21 min
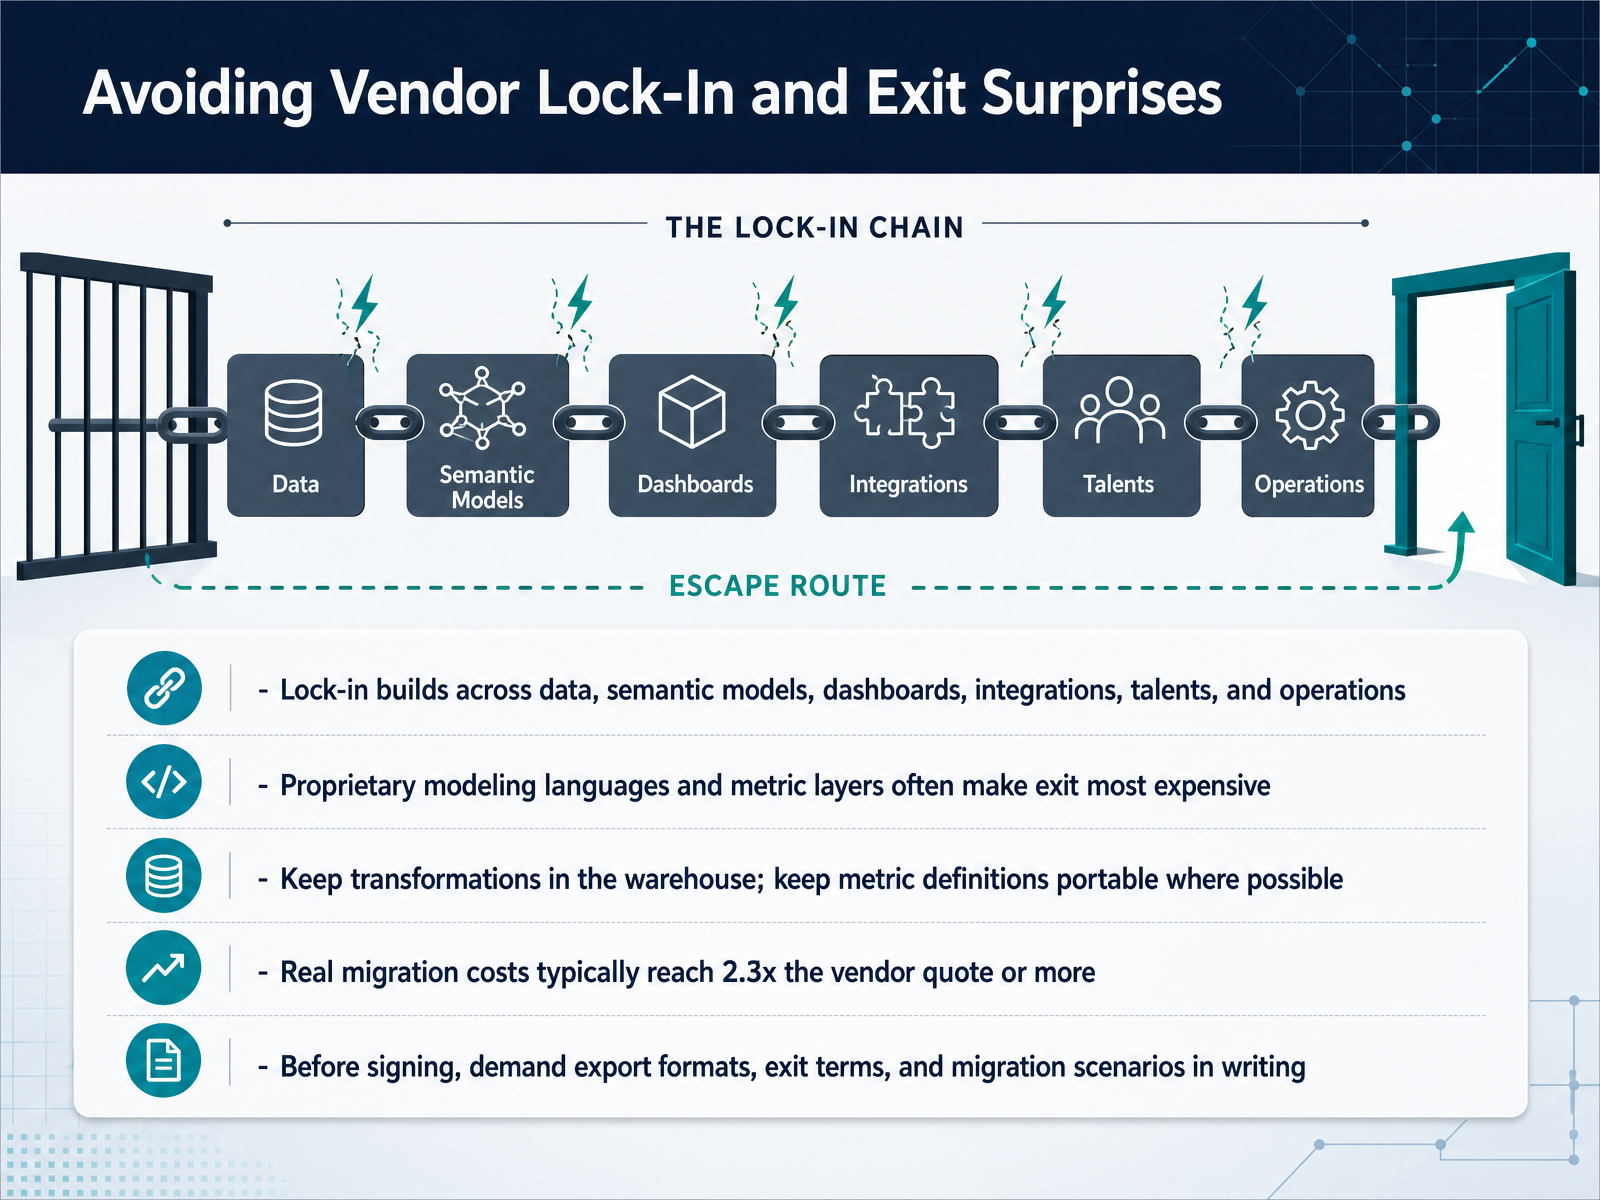
 - 07Avoiding Vendor Lock-In and Exit SurprisesNow, let's talk about a cost that rarely shows up on any invoice: vendor lock-in. It doesn't happen all at once. It builds quietly across your data, your semantic models, your dashboards, integrations, and even the skills of your team. The most expensive part of an exit is usually the proprietary modeling language or metric layer, because every definition has to be rebuilt from scratch. Real migration costs typically reach two point three times the vendor quote, or more, because that quote rarely covers parallel run costs, retraining, and the hidden work of unpicking old logic. To protect yourself, keep transformations in the warehouse where they are portable, and keep metric definitions portable wherever possible. And before you sign, demand export formats, exit terms, and a migration scenario in writing. If a vendor hesitates on that, treat it as a serious signal. With that warning in mind, let's shift to the practical next step: designing the target workflow around the selected tool.
 basedash.comvaliotti.commetrica.hashnode.dev+22 min
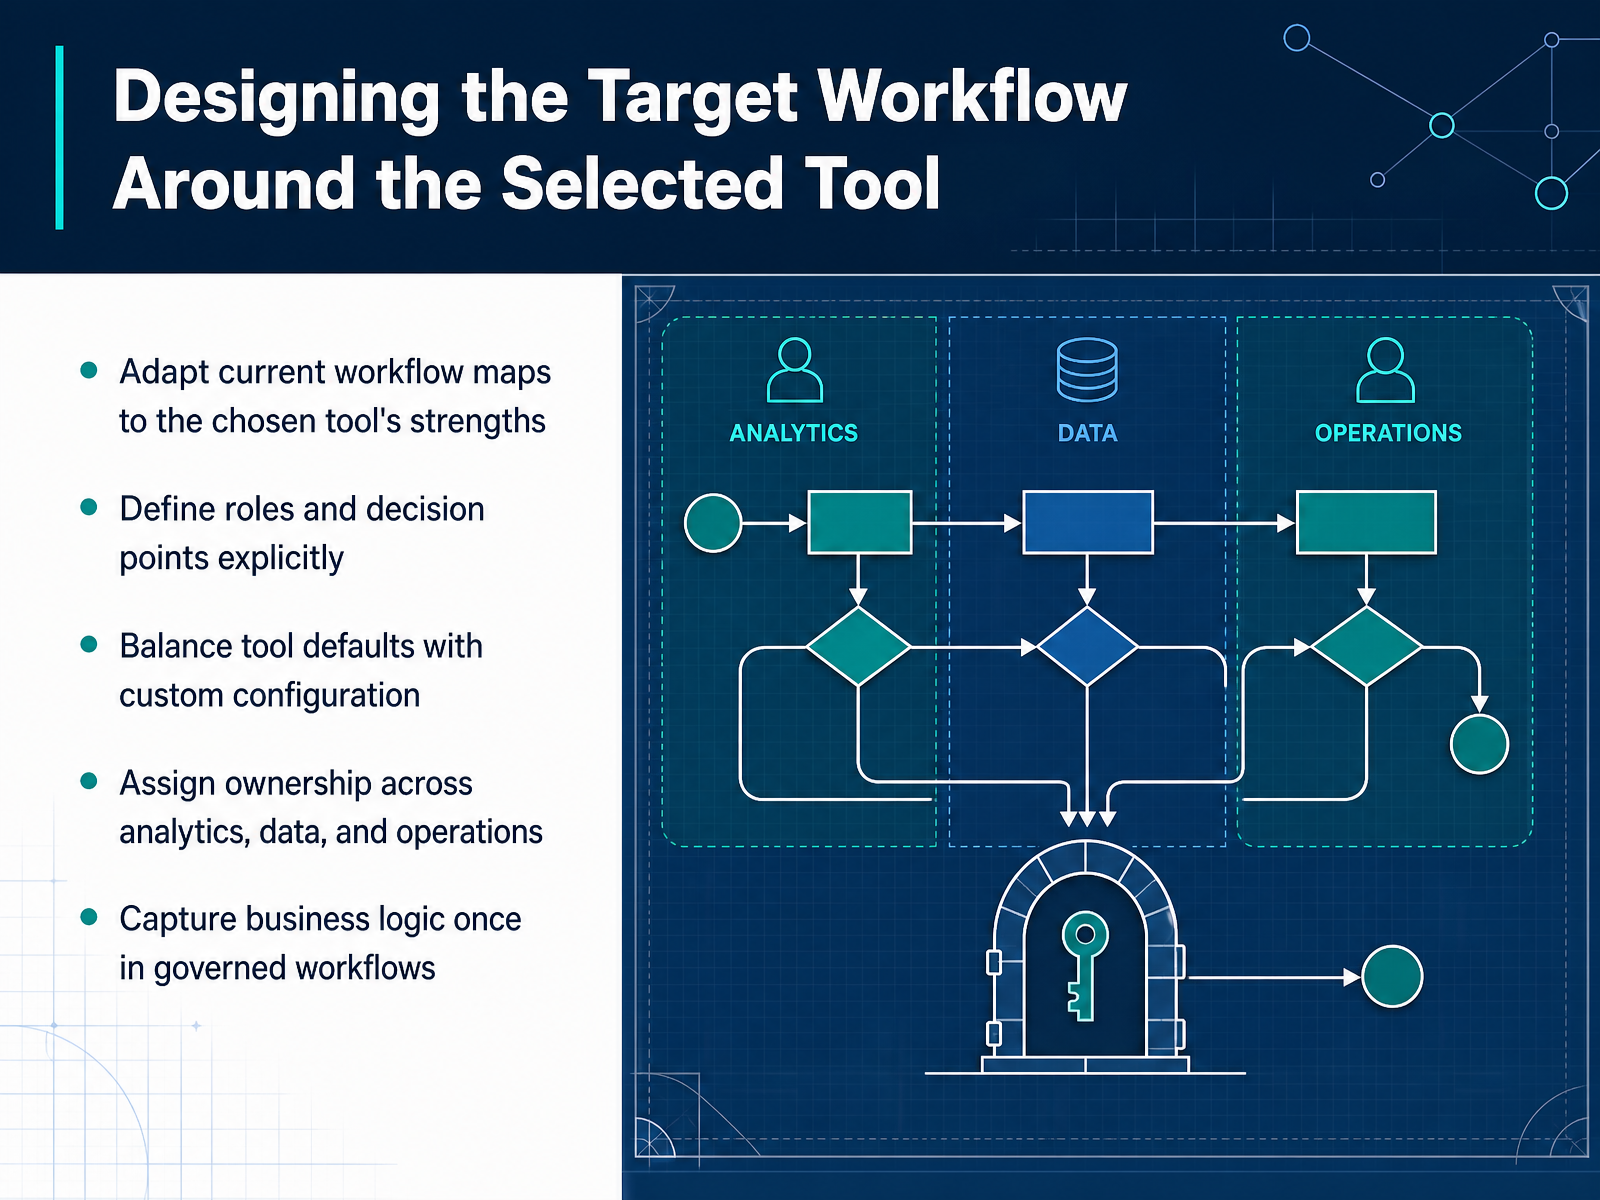
 - 08Designing the Target Workflow Around the Selected ToolNow that you have a tool in mind, the real work is designing the workflow around it. Do not force your current process to fit the new platform unchanged. Look at your existing workflow maps and adapt them to what the tool actually does well. If a step existed because the old system could not automate it, this is the moment to remove it. Next, define roles and decision points explicitly. Who approves a metric change? Who gets notified when a source schema shifts? These may sound administrative, but when ownership is unclear, that is exactly where trust breaks down. Then balance the tool defaults with custom configuration. Start with the platform's native behaviors. Configure only where your business logic genuinely differs. Too much customization creates maintenance debt. Finally, capture business logic once in governed workflows. The calculation for net revenue, the cost center mapping, the filters that protect sensitive rows. These should live in the governed layer, not in a spreadsheet one person maintains. When they repeat, they stay consistent. Once these pieces are in place, you are ready to test the new tool under real conditions.
 rowerconsulting.comproductquant.devblog.anomalyarmor.ai+21 min
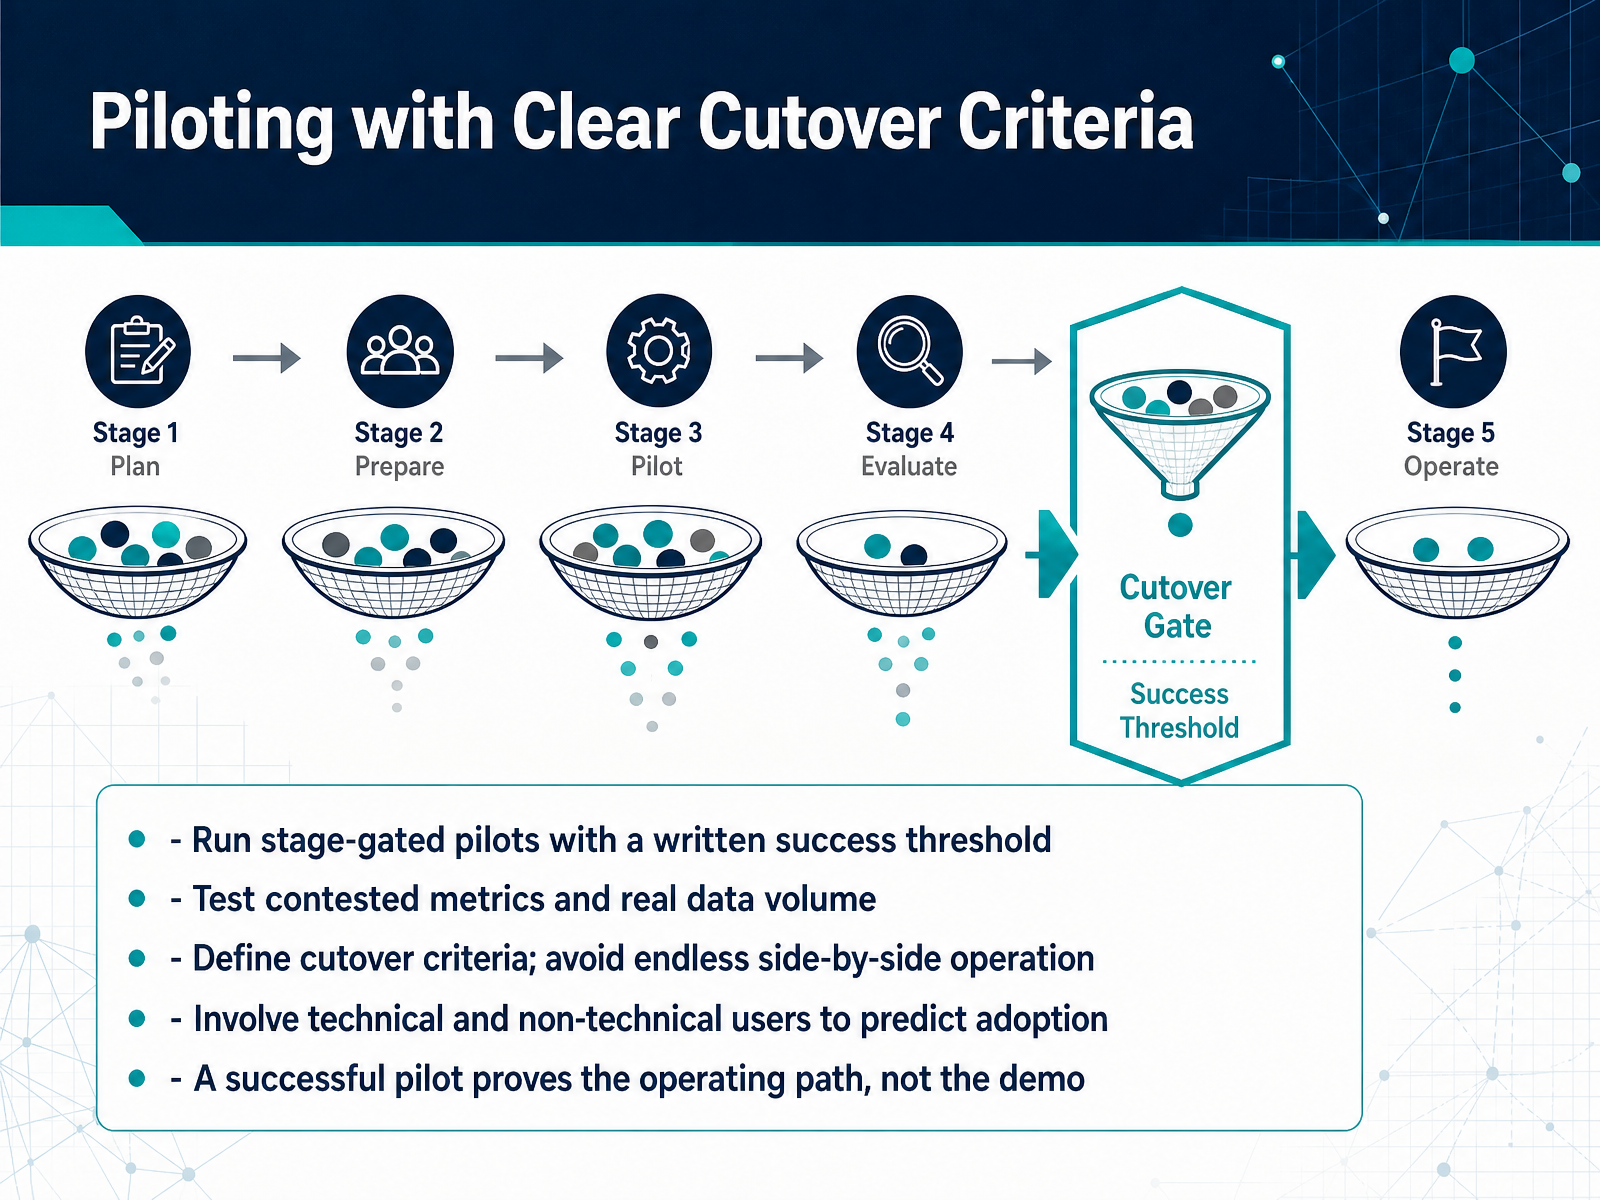
 - 09Piloting with Clear Cutover CriteriaSo, we have a shortlist, and now we need to pilot with clear cutover criteria. This is where good intentions often break down, so let's be deliberate. Run stage gated pilots with a written success threshold. Decide before day one what good looks like, not after you see the results. A threshold chosen after the fact is just a summary. Test contested metrics and real data volume. Do not let a vendor demo stand in for your actual Monday morning workload. Push enough data through to see how it behaves under pressure. Define cutover criteria early and avoid endless side by side operation. Running two tools in parallel for months is not a pilot; it is a tax. Set a date when the old path turns off, assuming the gates are met. Involve both technical and non technical users from the start. Analysts will make almost any tool work, but they are not the ones who need to adopt it. Watch whether an operator can answer a real question without help. That is your adoption signal. Finally, remember what a successful pilot proves. It proves the operating path works with real people and real exceptions. It does not prove the demo was impressive. Keep that distinction central as we move next into adoption, skeptics, and change management.
 valiotti.commetrica.hashnode.devbasedash.com+22 min
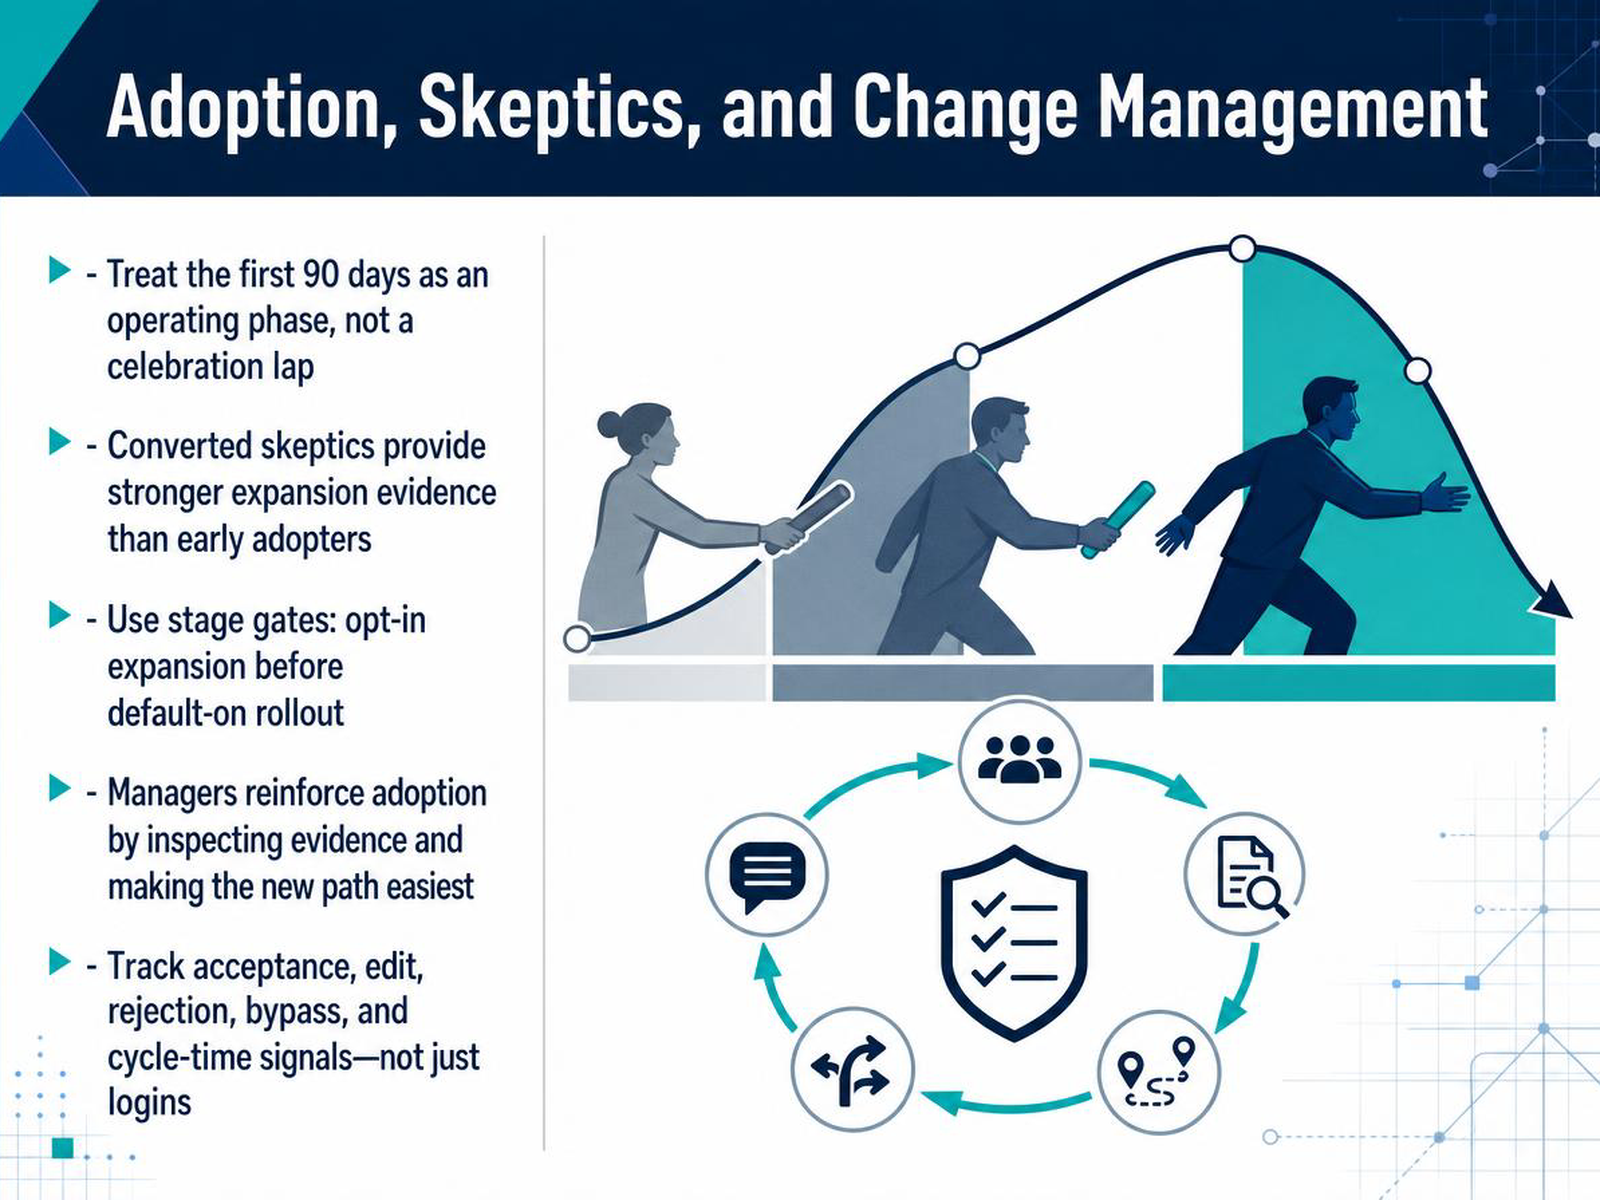
 - 10Adoption, Skeptics, and Change ManagementWith the tool selected, the hardest part is often just beginning. Launch day is not adoption day. Treat the first ninety days as an operating phase, not a celebration lap. This is when the workflow has to earn trust through real cases and visible corrections. Pay close attention to your skeptics. A converted skeptic provides far stronger evidence for expansion than an early adopter, because the resistant majority trusts their judgment more. Use stage gates to manage that expansion. Start with opt-in availability before flipping the tool to default-on for everyone. Managers reinforce adoption by inspecting the actual evidence and by making the new path the easiest one, while no longer accepting work that bypasses it without explanation. Finally, do not just track logins. Monitor acceptance, edits, rejections, bypass, and cycle-time signals. These tell you if the tool is trusted for the right reasons, not just because it is required. With that operating rhythm in place, the next step is ensuring that rhythm can scale through embedded governance without slowing your analysts down.
 2 min
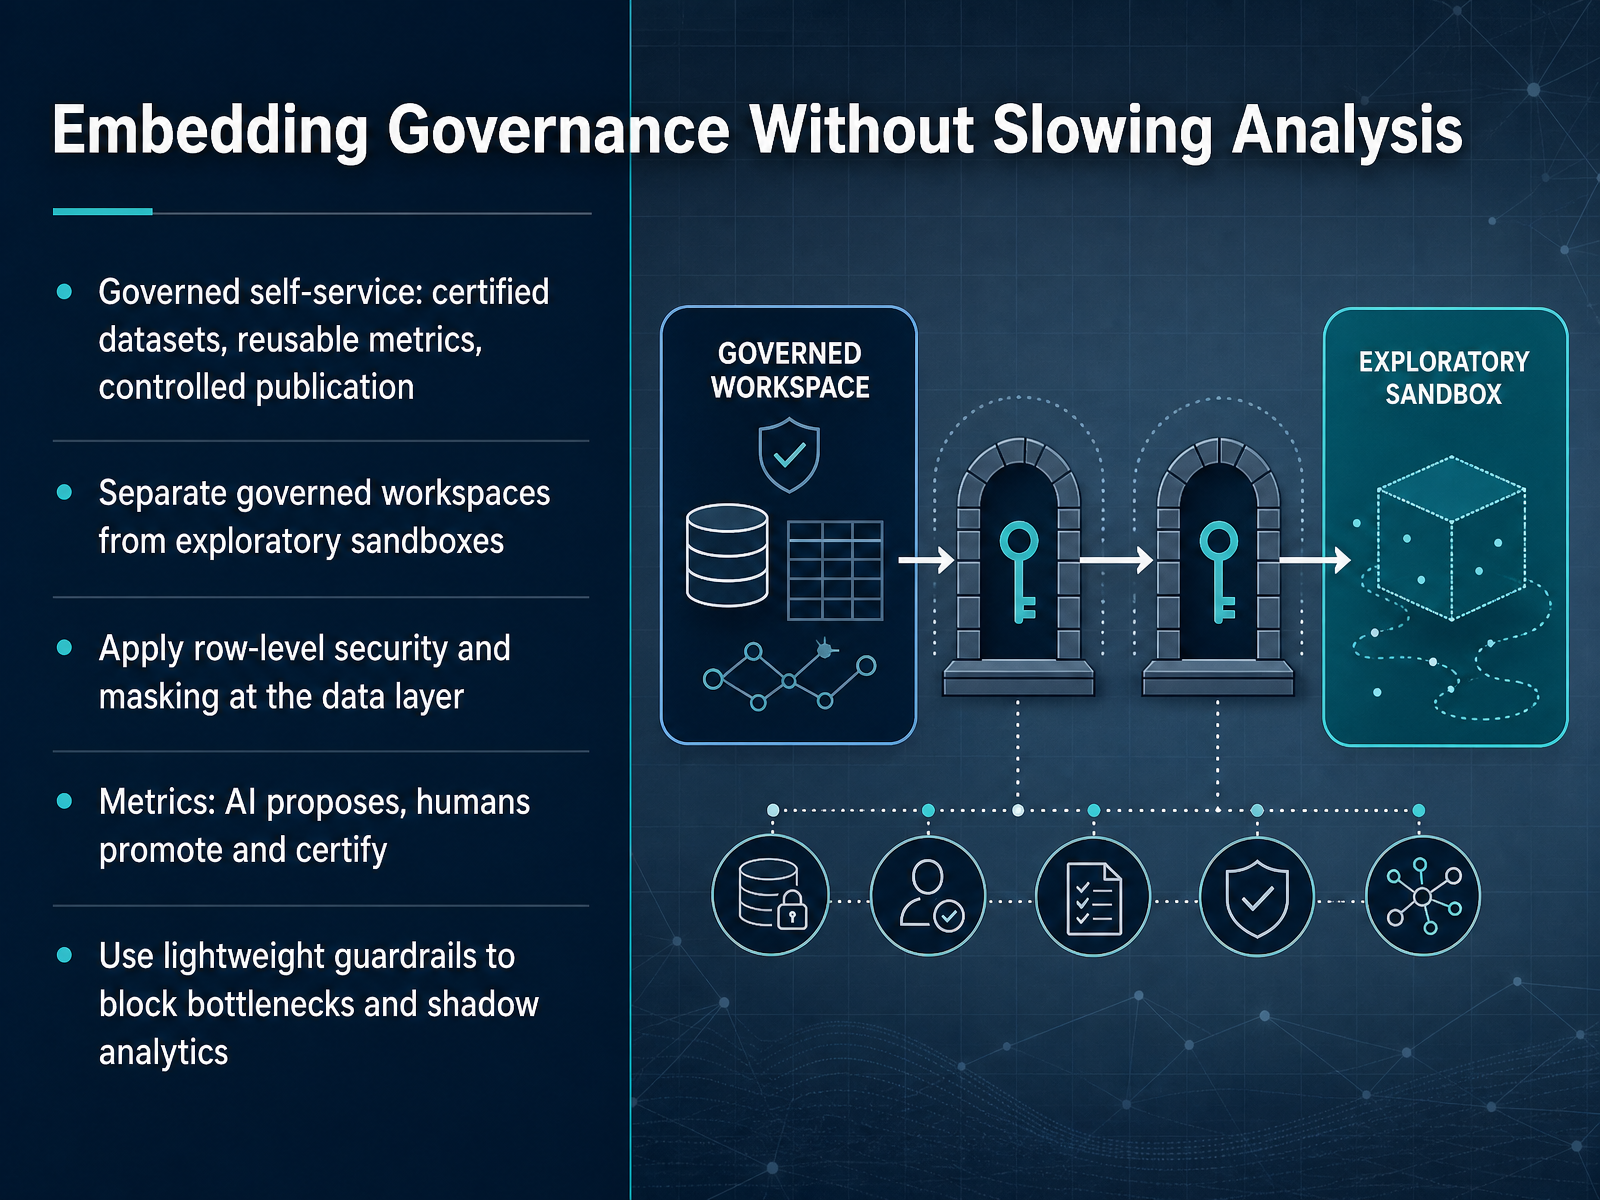
2 min - 11Embedding Governance Without Slowing AnalysisLet's shift from evaluating tools to designing the rules that make them safe and usable. Governance should not become a checkpoint that slows analysis to a crawl. One model that works well is governed self-service. The idea starts with certified datasets and reusable metrics. Analysts can move quickly because they are building on trusted foundations, not raw tables or personal exports. It also helps to separate work environments. Exploratory sandboxes give people room to experiment freely, while separate certified workspaces protect the official dashboards used for decisions. Security should live at the data layer, not inside every report. Applying row-level security and masking there means permissions travel with the data, no matter which tool queries it. For metrics, a practical pattern is to let AI propose, but require humans to promote and certify. AI drafts the calculation. A defined owner confirms the result and controls publication. Finally, keep guardrails lightweight. You want to block bottlenecks, but you also want to prevent shadow analytics where uncertified reports quietly drive decisions. A clean path to certification is often the fastest way to keep that trust. Next, let's look at measuring workflow impact beyond just counting dashboards.
 valiotti.commetrica.hashnode.devbasedash.com+22 min
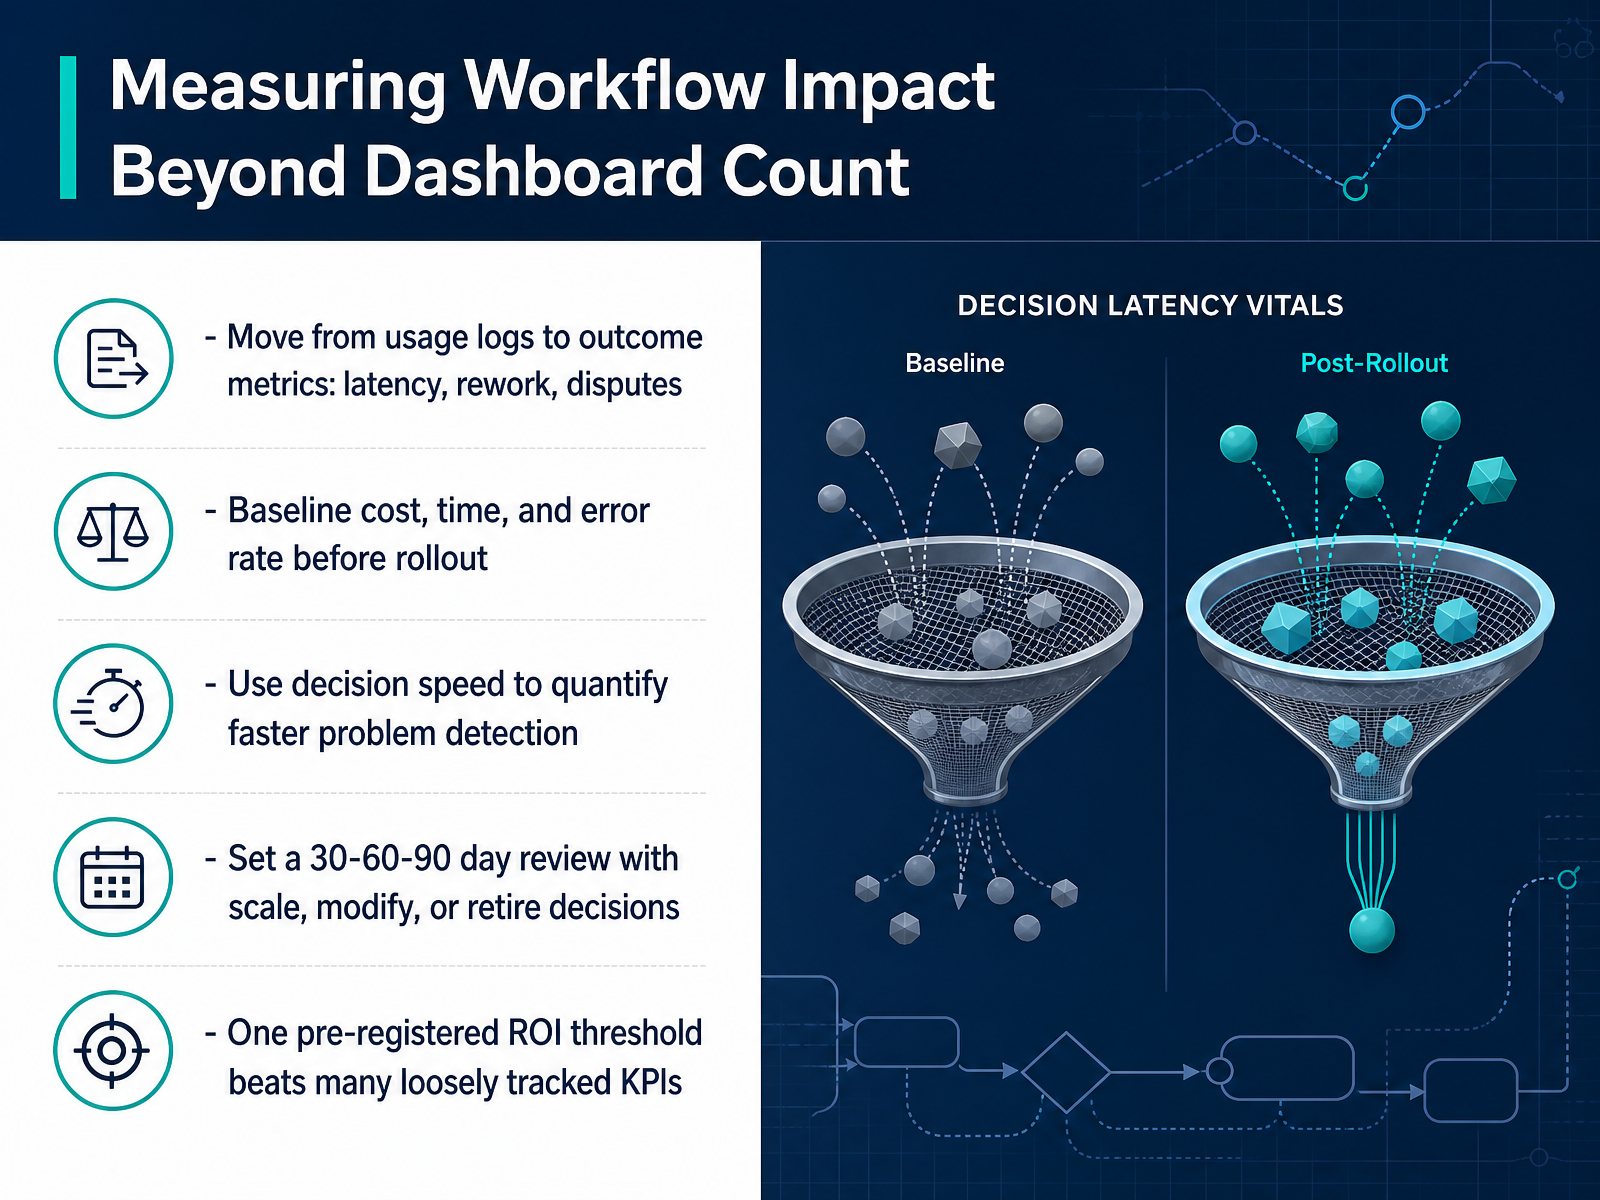
 - 12Measuring Workflow Impact Beyond Dashboard CountSo let's talk about how we prove a workflow actually works. The first shift is moving away from dashboard counts and usage logs. Logins are not value. Instead, look at outcome metrics. What changed in latency? Did rework drop? Are there fewer disputes or escalations? Those are the signals that matter. Second, and I cannot stress this enough, baseline before rollout. Capture cost, time, and error rate before anyone touches the new tool. If you skip the before, you cannot prove the after. Third, use decision speed as a hard metric. If a problem that took five days to detect now takes five hours, that is quantifiable value, even if it feels intangible at first. Fourth, set a formal review cadence. At thirty days check adoption. At sixty days check quality. At ninety days make a deliberate scale, modify, or retire decision. Do not let weak tools linger just because nobody wants to admit failure. Finally, resist the urge to track ten loosely defined K P I's. Pick one pre-registered R O I threshold before the pilot starts. That one clear number will survive a finance review far better than a busy dashboard. Next, we will look at how to iterate the stack without causing disruptive churn.
 2 min
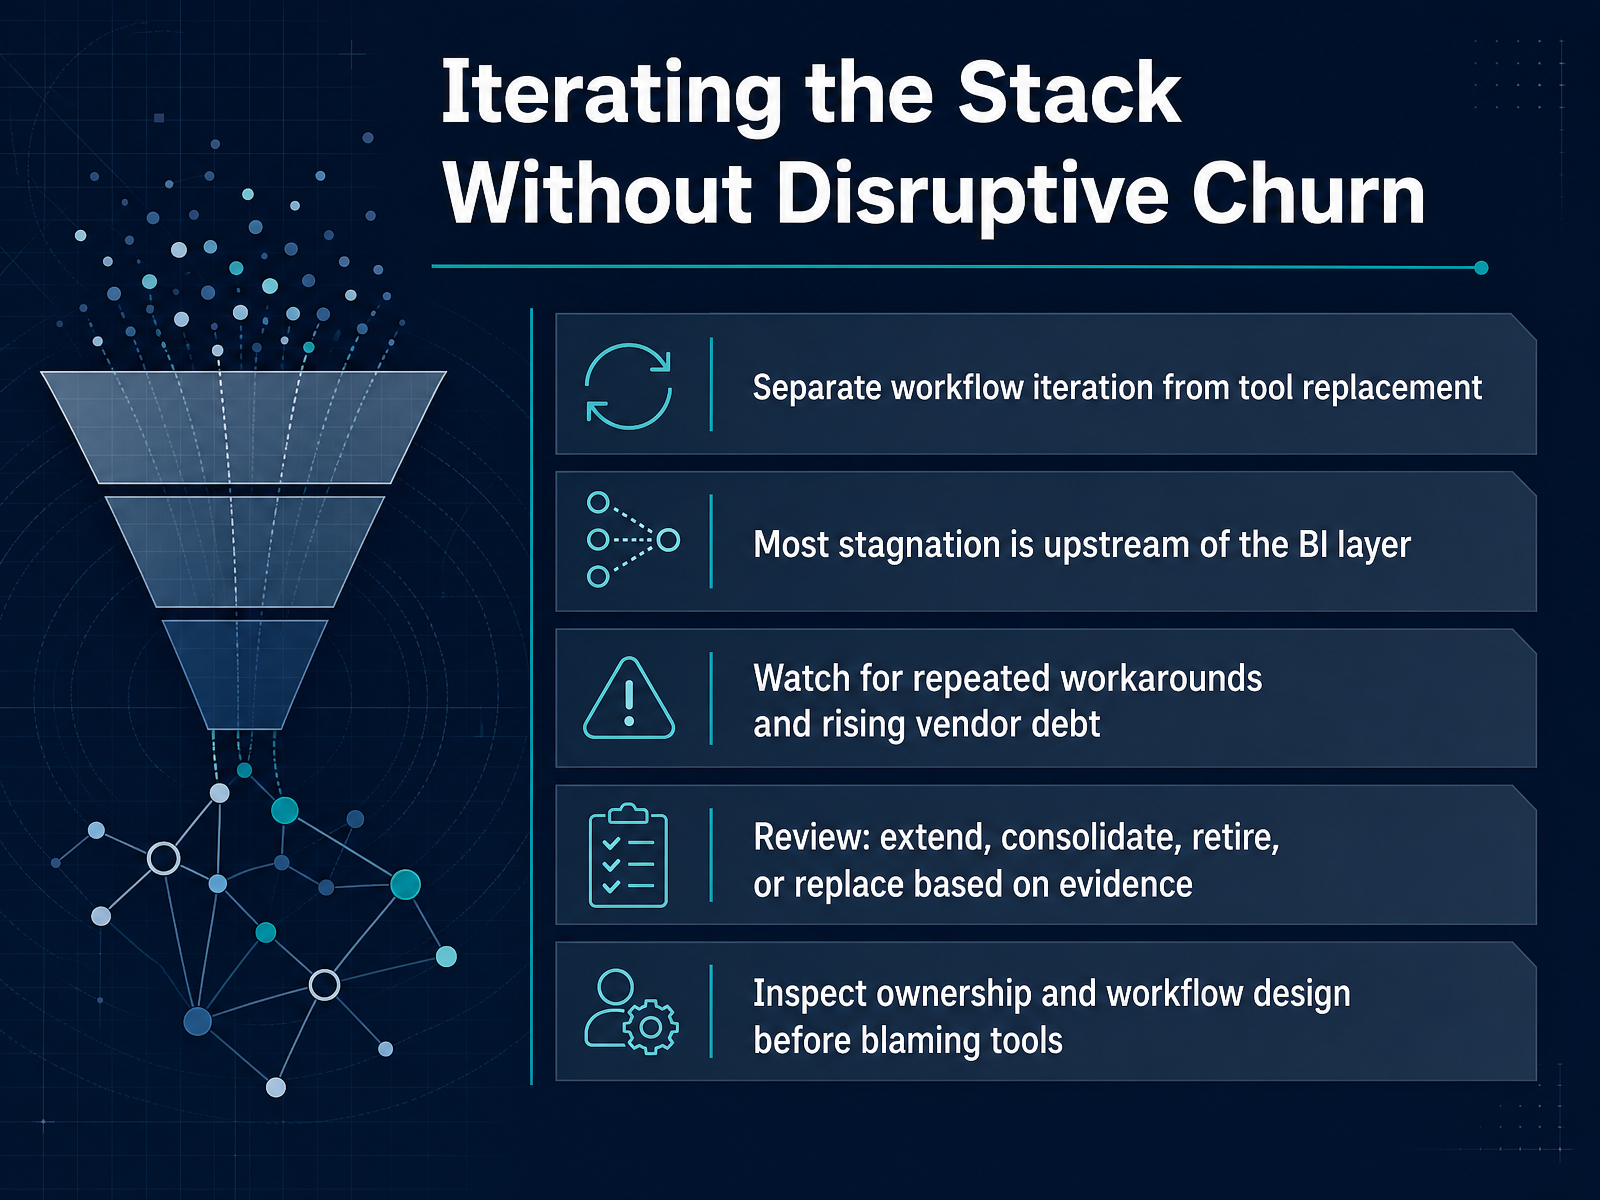
2 min - 13Iterating the Stack Without Disruptive ChurnLet's talk about keeping the stack healthy over time without ripping everything out every nine months. The key is to separate workflow iteration from tool replacement. Most of what feels like a tool problem is actually upstream, in the data pipeline, the model, or the governance around it. A shiny new dashboard on top of broken plumbing will fail in exactly the same way, just with cleaner colors. So watch for the real signals. Are teams building repeated workarounds, like exporting to spreadsheets just to reformat? Is vendor debt rising because you're paying for three overlapping capabilities? Those are clues that something needs review. When the evidence points to change, the options are fourfold. You can extend what you have, consolidate overlapping tools, retire dead licenses, or replace a component. But before blaming the tool, inspect the ownership and workflow design. Ask who owns the decision path end to end. Ask where a breaking change can enter. Often, the answer is a missing contract between teams, not a missing feature. That leads us straight into the final slide on action planning and common traps.
 rowerconsulting.comproductquant.devblog.anomalyarmor.ai+21 min
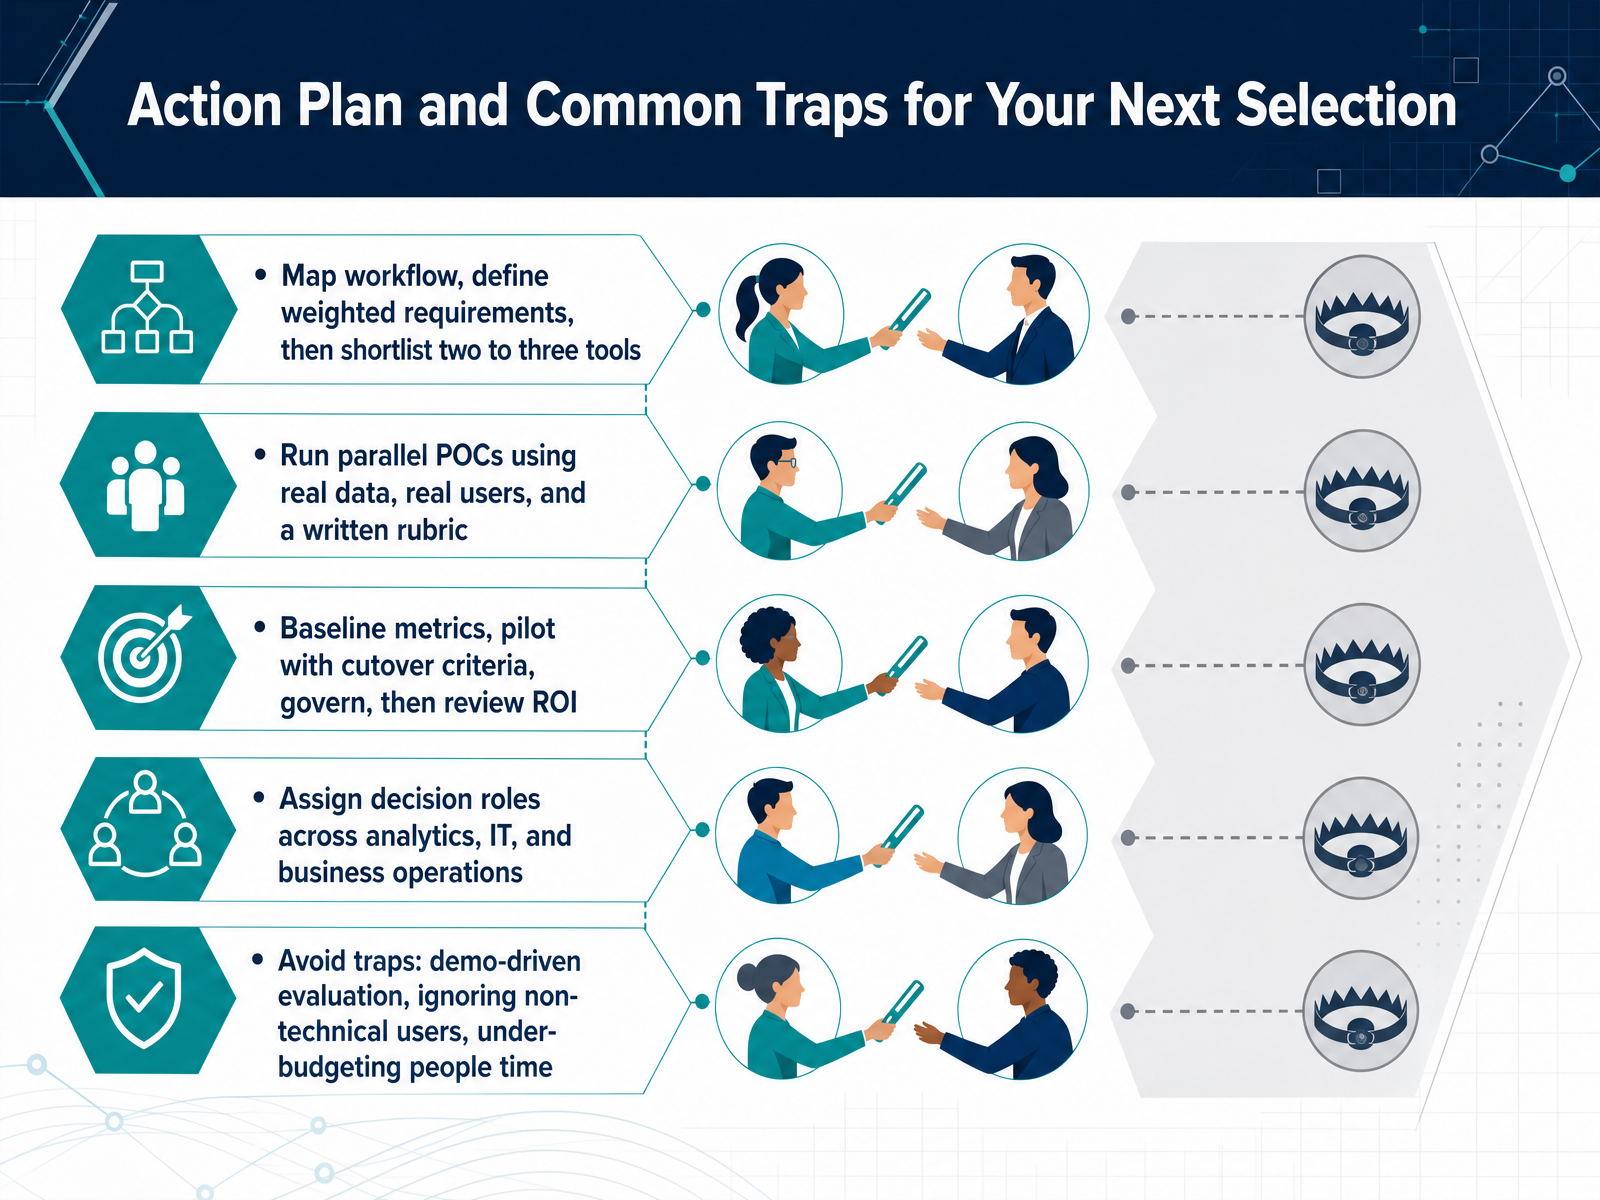
 - 14Action Plan and Common Traps for Your Next SelectionLet's close with an action plan and a few traps worth avoiding. Start by mapping your actual workflow and writing weighted requirements. Then shortlist only two or three tools. Run those candidates through parallel proof of concepts using your real data, real users, and a written rubric. That step exposes the messy path, not just the demo path. Before signing, baseline your current metrics and define pilot cutover criteria. Once live, govern the environment and review ROI on a set cadence. Assign decision roles across analytics, IT, and business operations early, because shared ownership prevents a tool that only one team can use. And watch out for common traps. Demo-driven evaluation hides production friction. Ignoring non-technical users overestimates adoption. Under-budgeting people time turns a license purchase into a stalled rollout. The right selection is not about the longest feature list. It is about proving that a small set of employees will trust and use the tool in their weekly work. Thank you for joining this session. Good luck with your next selection, and remember to test for fit rather than familiarity.
 valiotti.commetrica.hashnode.devbasedash.com+22 min
Take the deck with you
Download this course as a file — free, no sign-up needed.
- PDF handoutEvery slide page, ready to print or share.15 pages · 3.7 MBDownload
- Narrated PowerPointThe deck that presents itself — every slide carries the digital human's narration video.15 pages · 14.2 MBDownload
- PowerPoint slidesThe full deck as a .pptx — open it in PowerPoint, Keynote, or Google Slides.15 pages · 3.6 MBDownload
Free to use in your own training — please keep the PersonWise credit page at the end.
Have your own deck? Turn it into a course
Sources consulted
Web sources consulted while building this course.
- How to Choose a BI Tool in 2026: The Decision Framework for Growing Companies | Valiotti Data — valiotti.com
- How to Evaluate Enterprise BI Tools: A Practical Selection Framework — metrica.hashnode.dev
- BI tool buying questions: a 2026 checklist | Basedash — basedash.com
- How to choose a BI tool that will actually be used? | Business Reporting Solutions — brsolutions.pl
- How to Choose the Right BI Tool: What Actually Determines Success | Versich — versich.com
- Analytics Workflow Broken? Here's How to Diagnose and Fix It — rowerconsulting.com
- Your Analytics Dashboard Looks Fine. Your Data Is Broken. | ProductQuant — productquant.dev
- Data Pipeline Monitoring: How to Stop Silent Failures Before They Hit Production — blog.anomalyarmor.ai
- Errors and troubleshooting — experienceleague.adobe.com
- How Fragmented Analytics Tools Slow Reporting - Alteryx — smartling.alteryx.com
- Business Intelligence and Analytics Platform Selection Guide | Info-Tech Research Group — infotech.com
- Optimizing BI & Analytics Tool Selection with Expert Framework - Analytics8 — analytics8.com
- Requirements Gathering for Data Analytics Projects | Blog — calligo.io
- Planning a Business Intelligence System - InterWorks — interworks.com
- How to Gather Your Business Intelligence Requirements — proserveit.com
- Comparing the Top Business Analytics Tools | GoodData — gooddata.ai
- Best Business Intelligence Platforms in 2026 | 13 Compared — tellius.com
- Comparing the Best Enterprise Data Analytics Platforms | GoodData — gooddata.ai
- Buyer's Guide: Business Intelligence & Analytics | CIOPages Buyer Guide — ciopages.com
- BI tool total cost of ownership | Basedash — basedash.com