Begin
14 pages · ~28 min
Technical Writing Metrics That Matter
This training helps technical writers identify and apply meaningful metrics to measure documentation quality, user success, and business impact.
A digital instructor presents all 14 pages. Hold “Ask” at any point and ask out loud — the answer comes from this course. No sign-up needed.
What you’ll learn
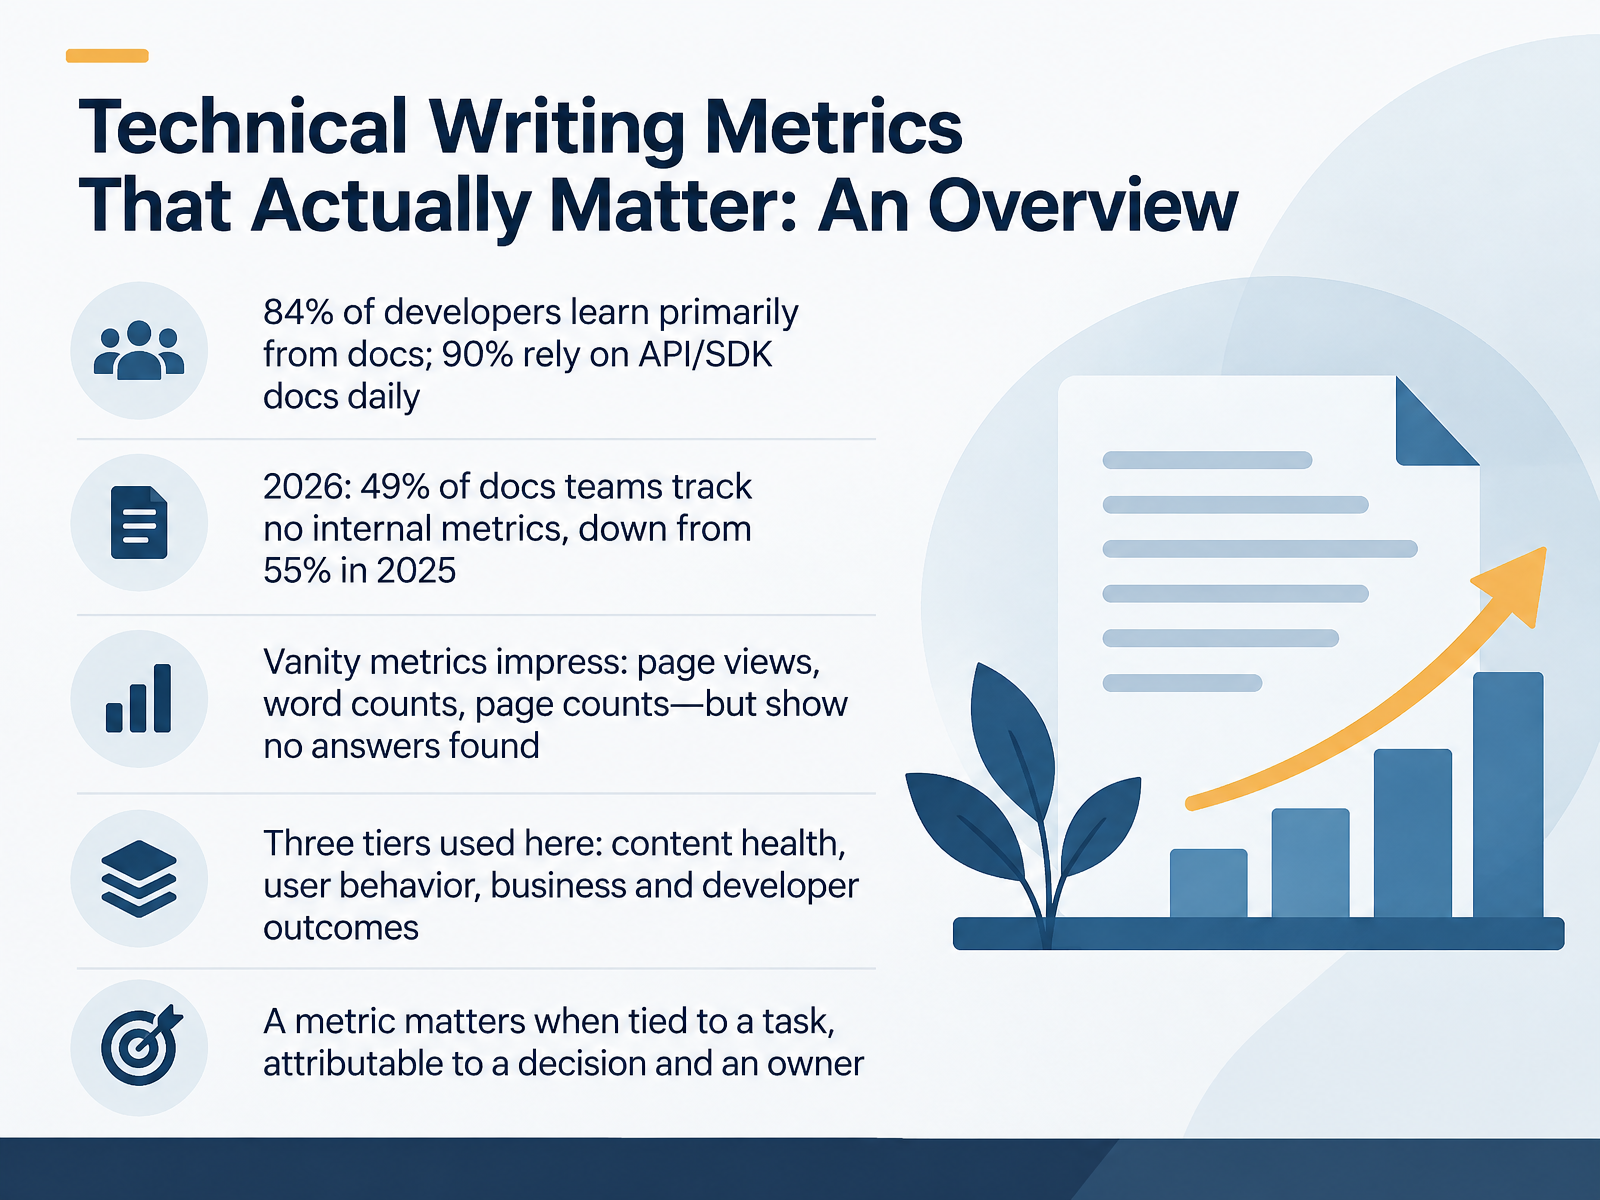
- 01Technical Writing Metrics That Actually Matter: An OverviewWelcome. If you lead docs or write API references, this course is for you. We will look at technical writing metrics that actually matter, and skip the ones that only look good in a report. Start with the stakes. Eighty four percent of developers say they learn primarily from documentation, and ninety percent rely on API or S D K docs daily. So docs carry real weight. Yet in twenty twenty six, forty nine percent of docs teams tracked no internal metrics, down from fifty five percent the year before. You measure output, maybe page views, word counts, page counts. Those impress, but they never tell you whether a reader found an answer. Here is the structure I will use. Three tiers. Content health, user behavior, and business and developer outcomes. Content health covers accuracy and freshness. User behavior covers search success and time to first useful answer. Business outcomes cover support deflection and developer activation. Your rule of thumb: a metric matters when you tie it to a task, attribute it to a decision and an owner. Next, we will examine why most documentation metrics fail.1 min
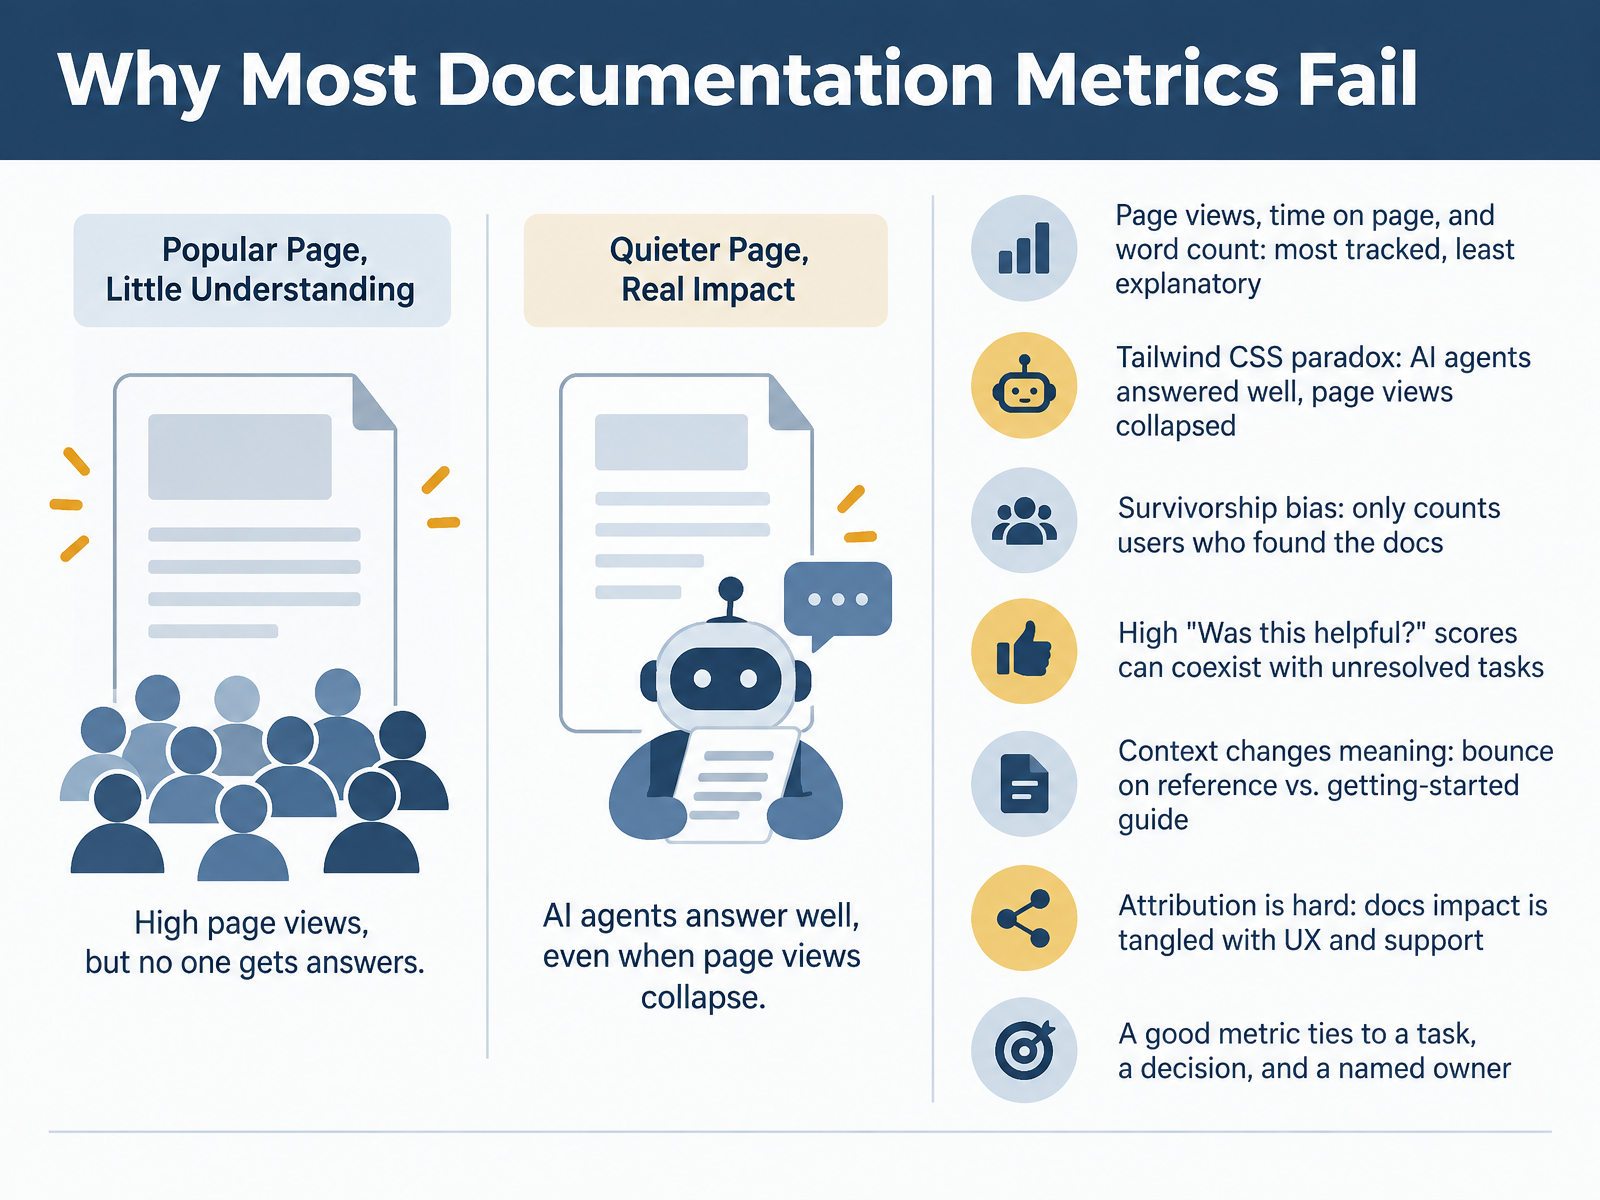
- 02Why Most Documentation Metrics FailLet's talk about why most documentation metrics fail. You already know the usual suspects: page views, time on page, and word count. They're the most tracked and the least explanatory. Take Tailwind CSS. AI agents started answering their questions correctly, so users stopped visiting the docs. Page views collapsed. The docs were still working. Now think about survivorship bias. Your analytics only count people who found the docs. Everyone who gave up and filed a support ticket is invisible. You can also see high helpfulness scores sitting next to unresolved tasks. A reader clicks yes because the page was clear, then still can't finish the job. And context changes meaning. A bounce on a reference page is often a fast, successful lookup. A bounce on a getting-started guide is a failure. Attribution is just as hard. Docs impact is tangled with UX and support. So what makes a good metric? It ties to a task, a decision, and a named owner. Next, let's look at a tiered measurement framework: content health, behavior, and outcomes.
 2 min
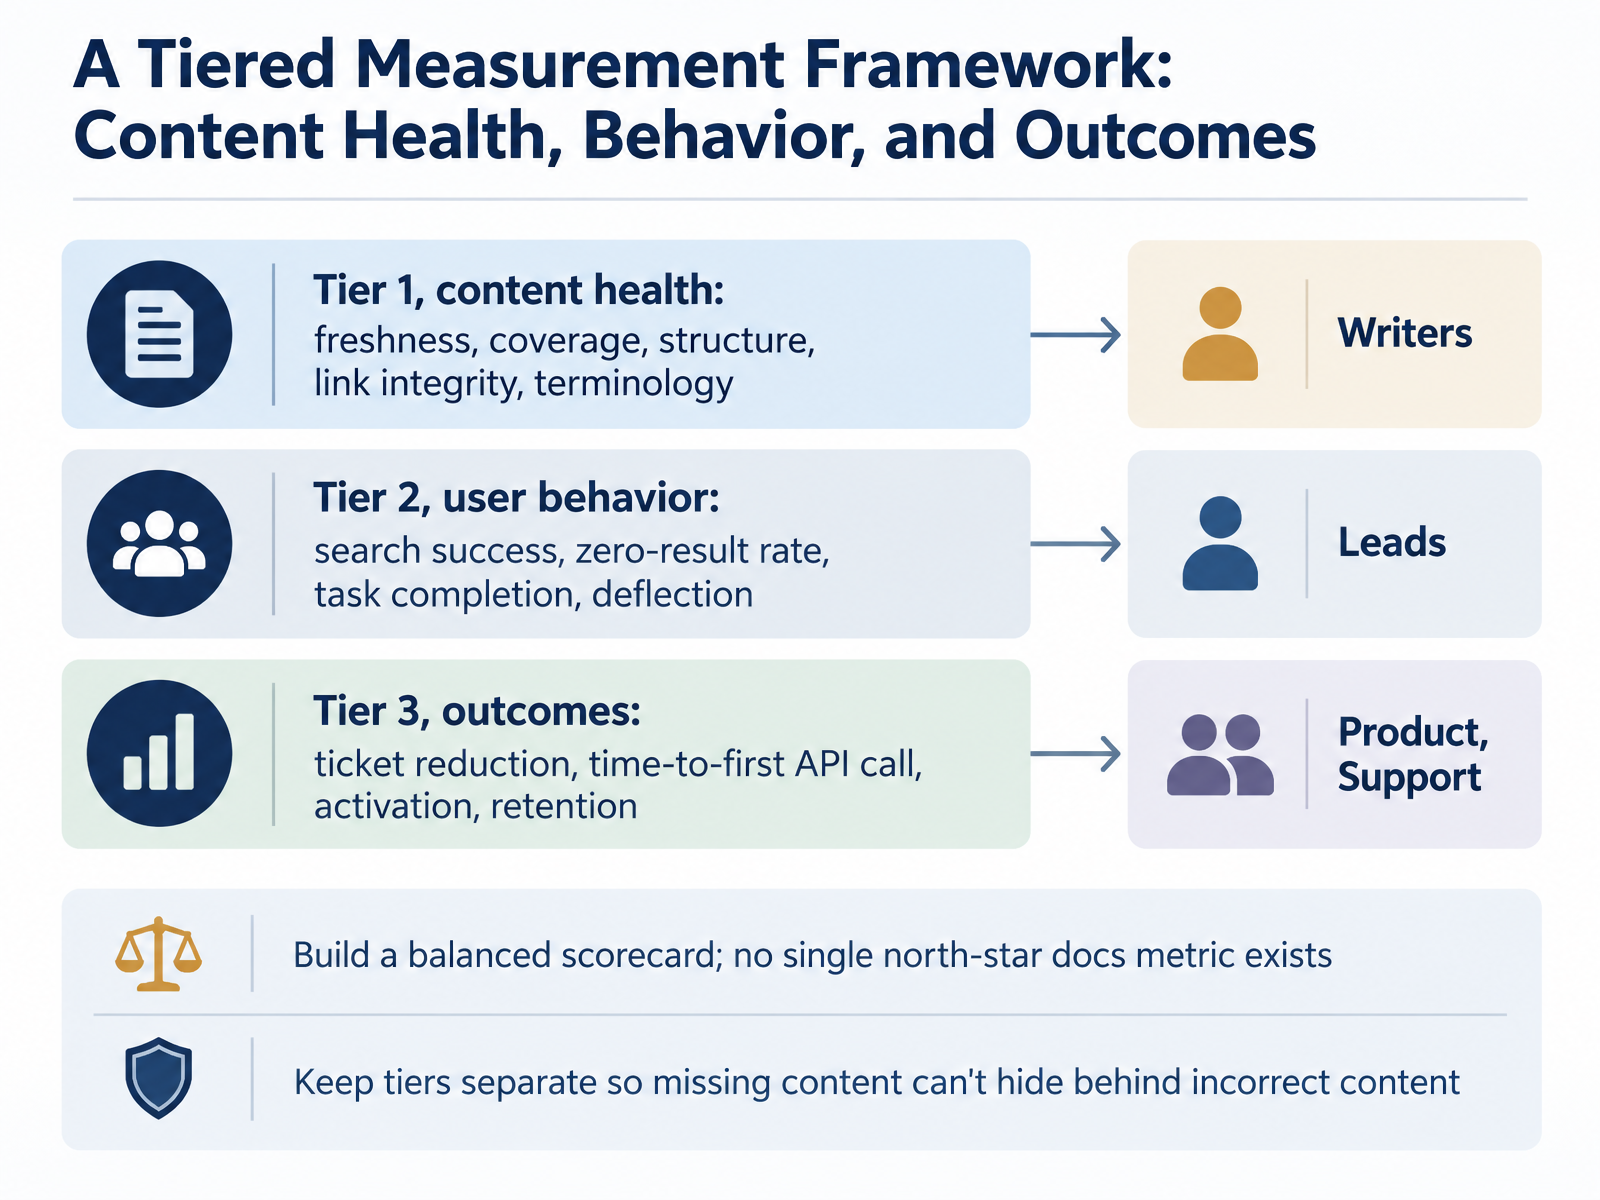
2 min - 03A Tiered Measurement Framework: Content Health, Behavior, and OutcomesLet's set up a framework you can actually use. It has three tiers, and each one answers a different question. Tier one is content health. You measure freshness, coverage, structure, link integrity, and terminology consistency. Think of a support article that is accurate but two years old. Health metrics catch that. Tier two is user behavior. You measure search success, zero-result rate, task completion, and deflection. If readers search and find nothing, that tells you content is missing, not that your writing is wrong. Tier three is outcomes. You measure ticket reduction, time to first API call, activation, and retention. These tie docs to business results, and they take longer to move. Now map each tier to a stakeholder question. Writers ask, is our content healthy? Leads ask, are users succeeding? Product asks, did docs drive adoption? Support asks, did tickets drop? Build a balanced scorecard, because no single north-star metric for docs exists. And keep the tiers separate, so missing content cannot hide behind incorrect content. Next, we look at Content Health Metrics You Can Trust.
 2 min
2 min - 04Content Health Metrics You Can TrustNext, let's look at content health metrics you can actually trust.
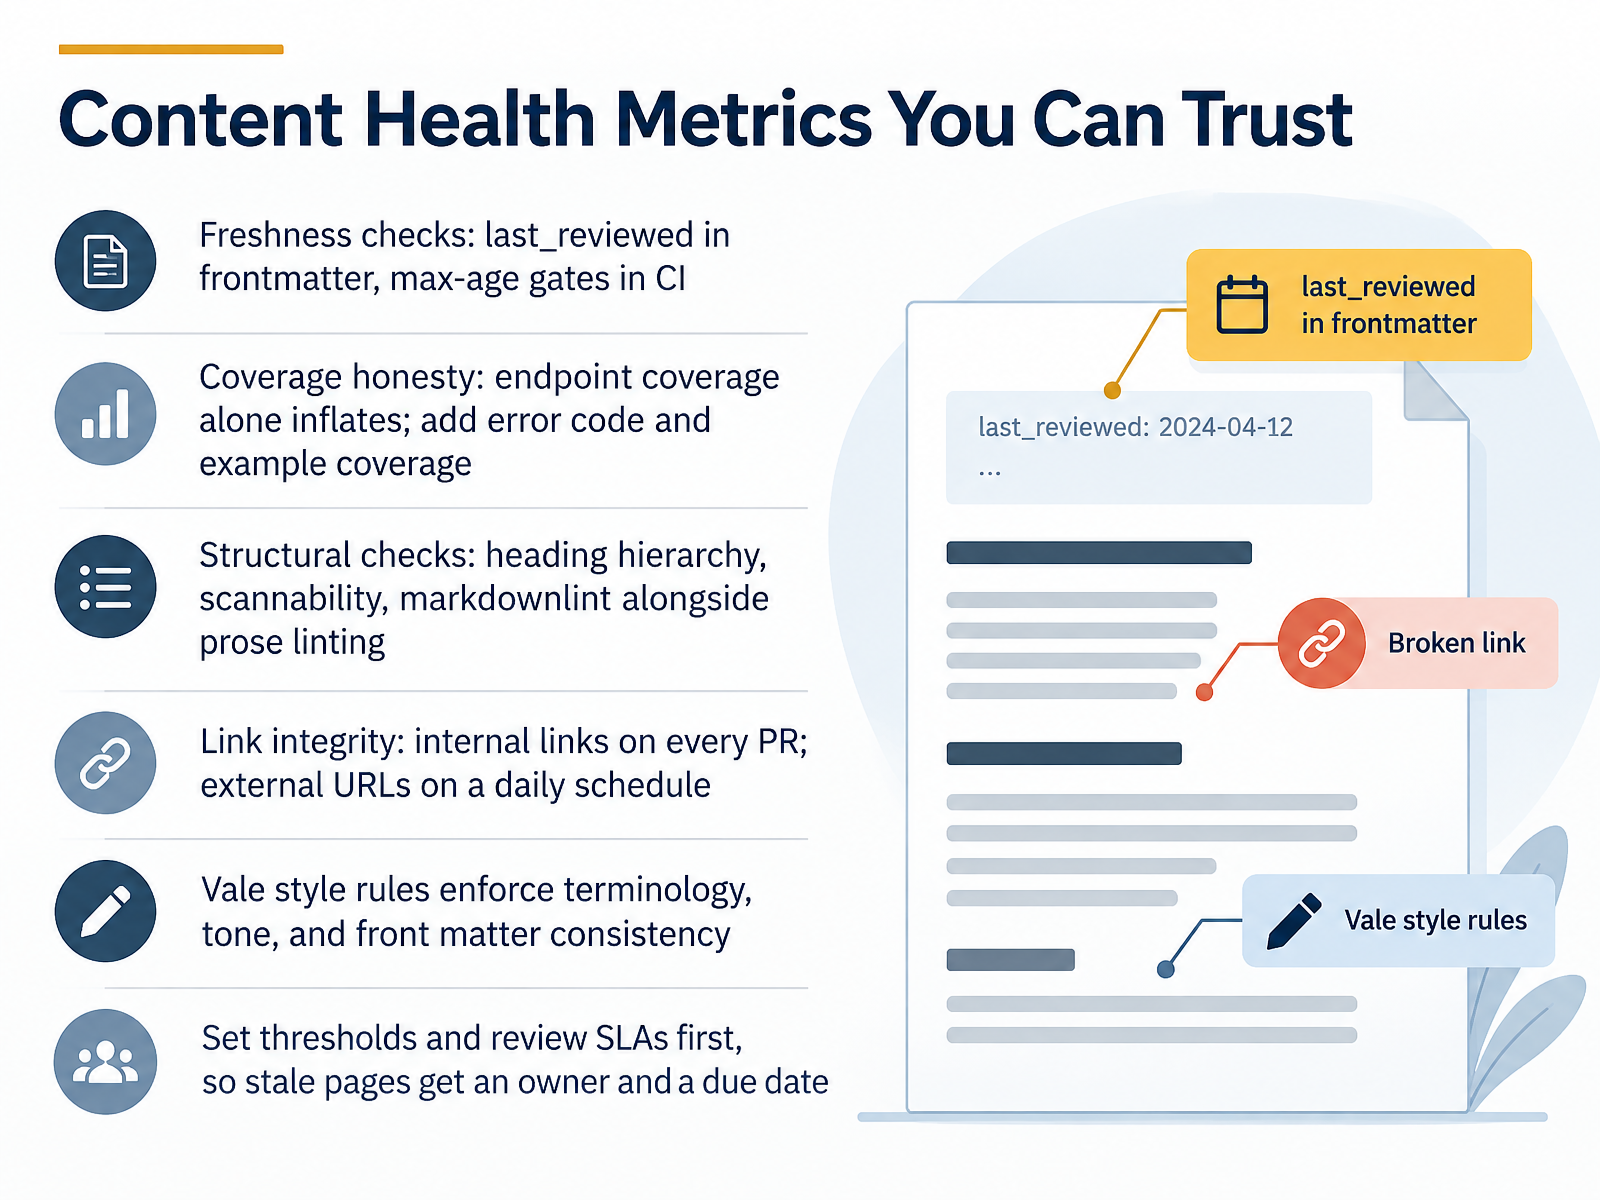
Start with freshness checks. Store last_reviewed in the frontmatter, then enforce a maximum age gate in your continuous integration pipeline. That way, a page doesn't quietly drift stale for two years.
Be honest about coverage. Endpoint coverage alone inflates quickly. If you document only the happy path, add error code coverage and example coverage so you measure what readers truly need.
Run structural checks too. Heading hierarchy, scannability, and markdown linting belong next to prose linting. For links, check internal links on every pull request, and external URLs on a daily schedule.
Then use Vale style rules to enforce terminology, tone, and front matter consistency. One caveat: set thresholds and review service level agreements before you turn on the linters. Otherwise, stale pages get flagged without an owner or a due date.
Freshness, honest coverage, structure, links, and style rules. Measure them together, and you get signals your team can act on.
That naturally leads to how readers behave. Coming up next: Behavioral Metrics: Search, Navigation, and Task Success.
 2 min
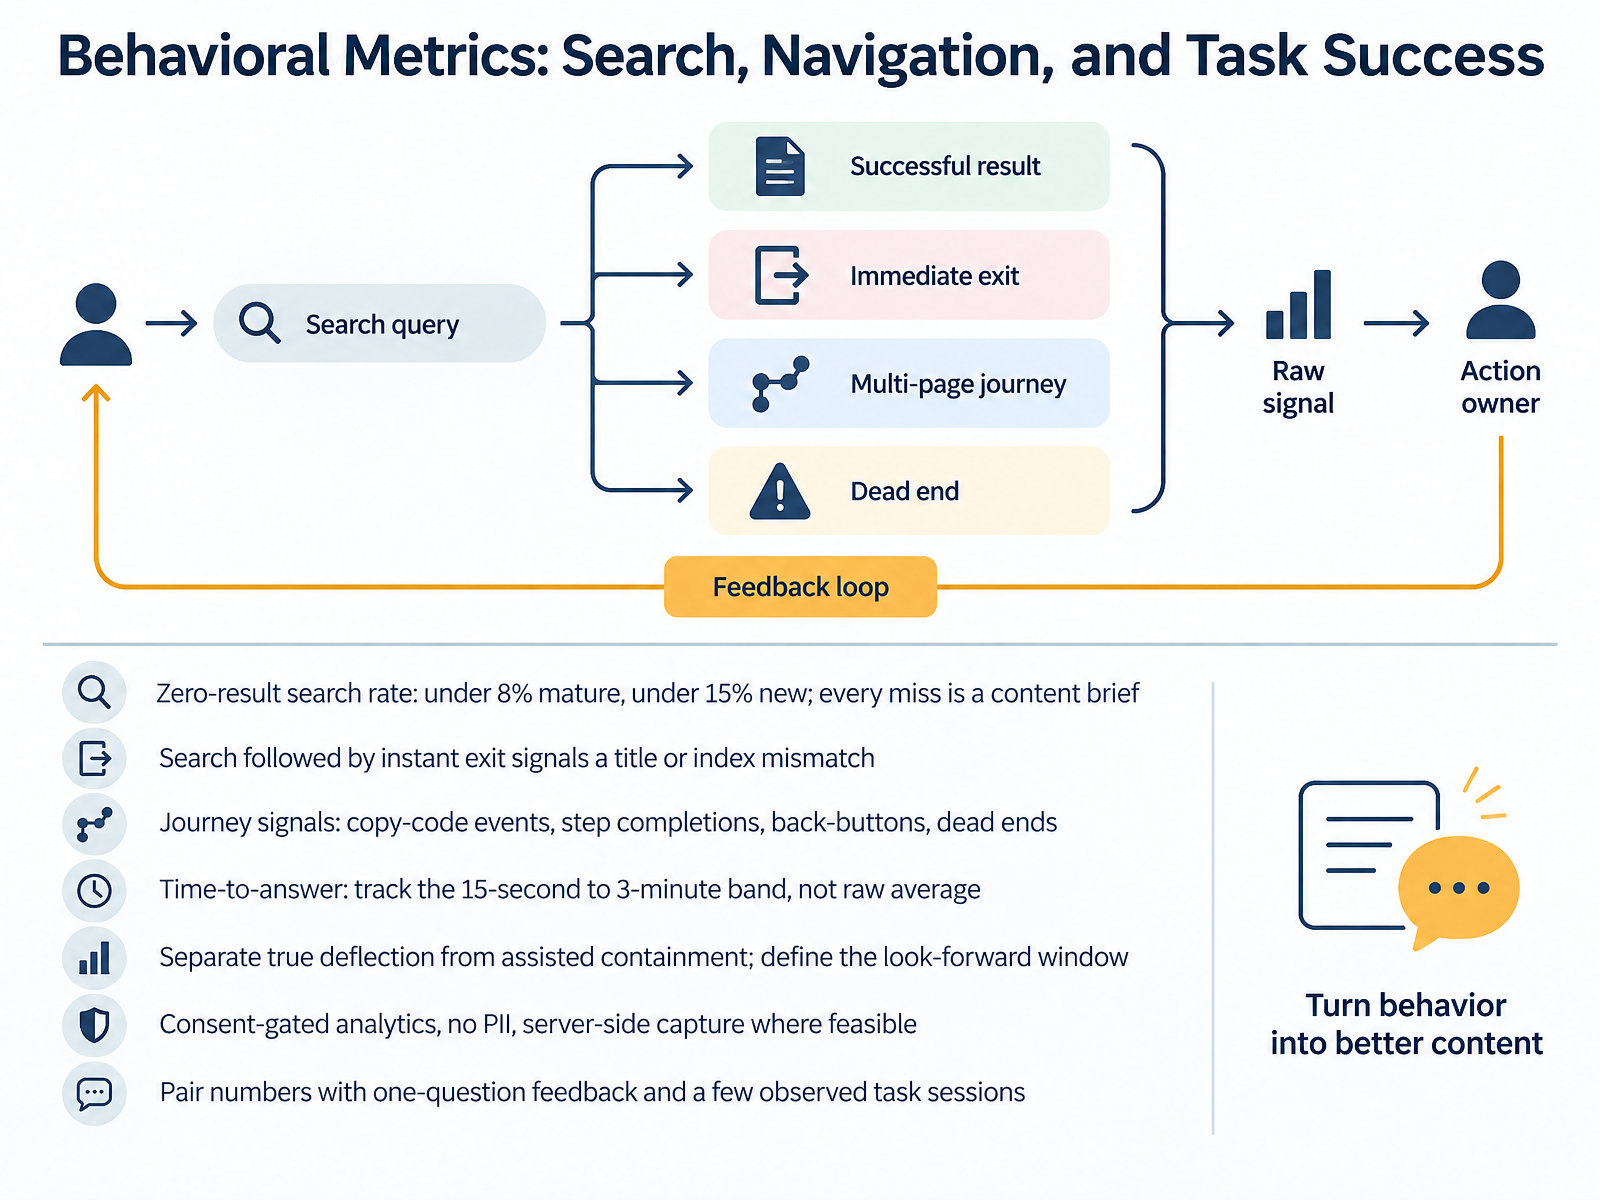
2 min - 05Behavioral Metrics: Search, Navigation, and Task SuccessLet's move from structural quality to behavioral metrics. Start with zero result search rate. In a mature docs set, you want that under eight percent. For a new product, under fifteen percent is reasonable. Treat every miss as a content brief, not a failure. Next, watch search followed by an instant exit. That usually means your title or index does not match the words users actually type. For journey signals, measure copy code events, step completions, back button presses, and dead ends. These show whether readers finish a task. For time to answer, track the fifteen second to three minute band instead of a raw average. That band tells you if people find an answer quickly or give up slowly. Also separate true deflection from assisted containment. Define your look forward window, say twenty four hours, so a support ticket after reading does not count as success. Keep analytics consent gated, with no personal data, and capture server side where you can. Finally, pair numbers with one question feedback and a few observed task sessions. That combination tells you what happened and why. Coming up next, outcome metrics, connecting docs to business and developer success.
 2 min
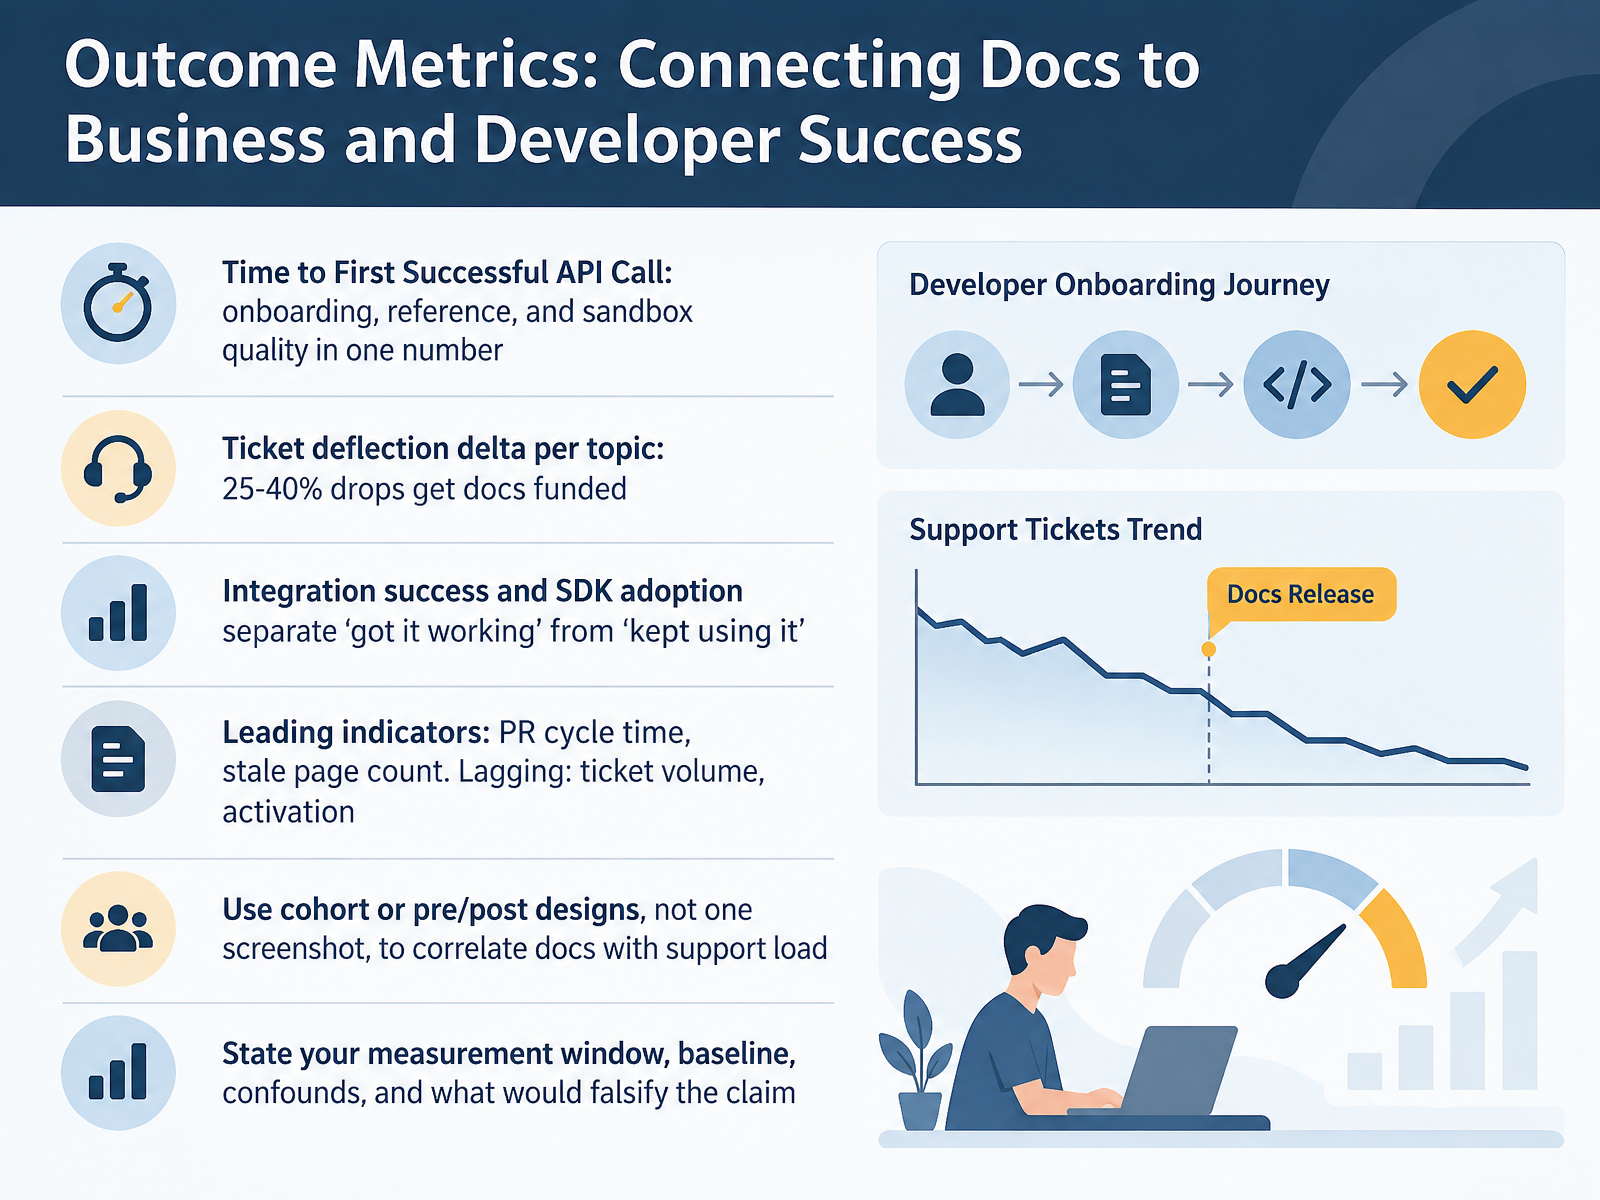
2 min - 06Outcome Metrics: Connecting Docs to Business and Developer SuccessLet's move from production metrics to outcome metrics, where documentation connects to business and developer success. Start with time to first successful API call. That single number reflects your onboarding, reference, and sandbox quality all at once. If a developer cannot make a first call quickly, the docs are part of the problem. Next, measure ticket deflection delta per topic. A drop of twenty five to forty percent on a specific topic is compelling evidence, and that is often what gets docs funded. Then look at integration success and SDK adoption. Those separate "got it working" from "kept using it," and they tell different stories. Track leading indicators like pull request cycle time and stale page count. Track lagging indicators like ticket volume and activation. Use cohort or pre and post designs, not a single screenshot, to correlate docs with support load. And always state your measurement window, baseline, confounds, and what would falsify your claim. Now let's look at instrumentation, tooling, and data hygiene.
 2 min
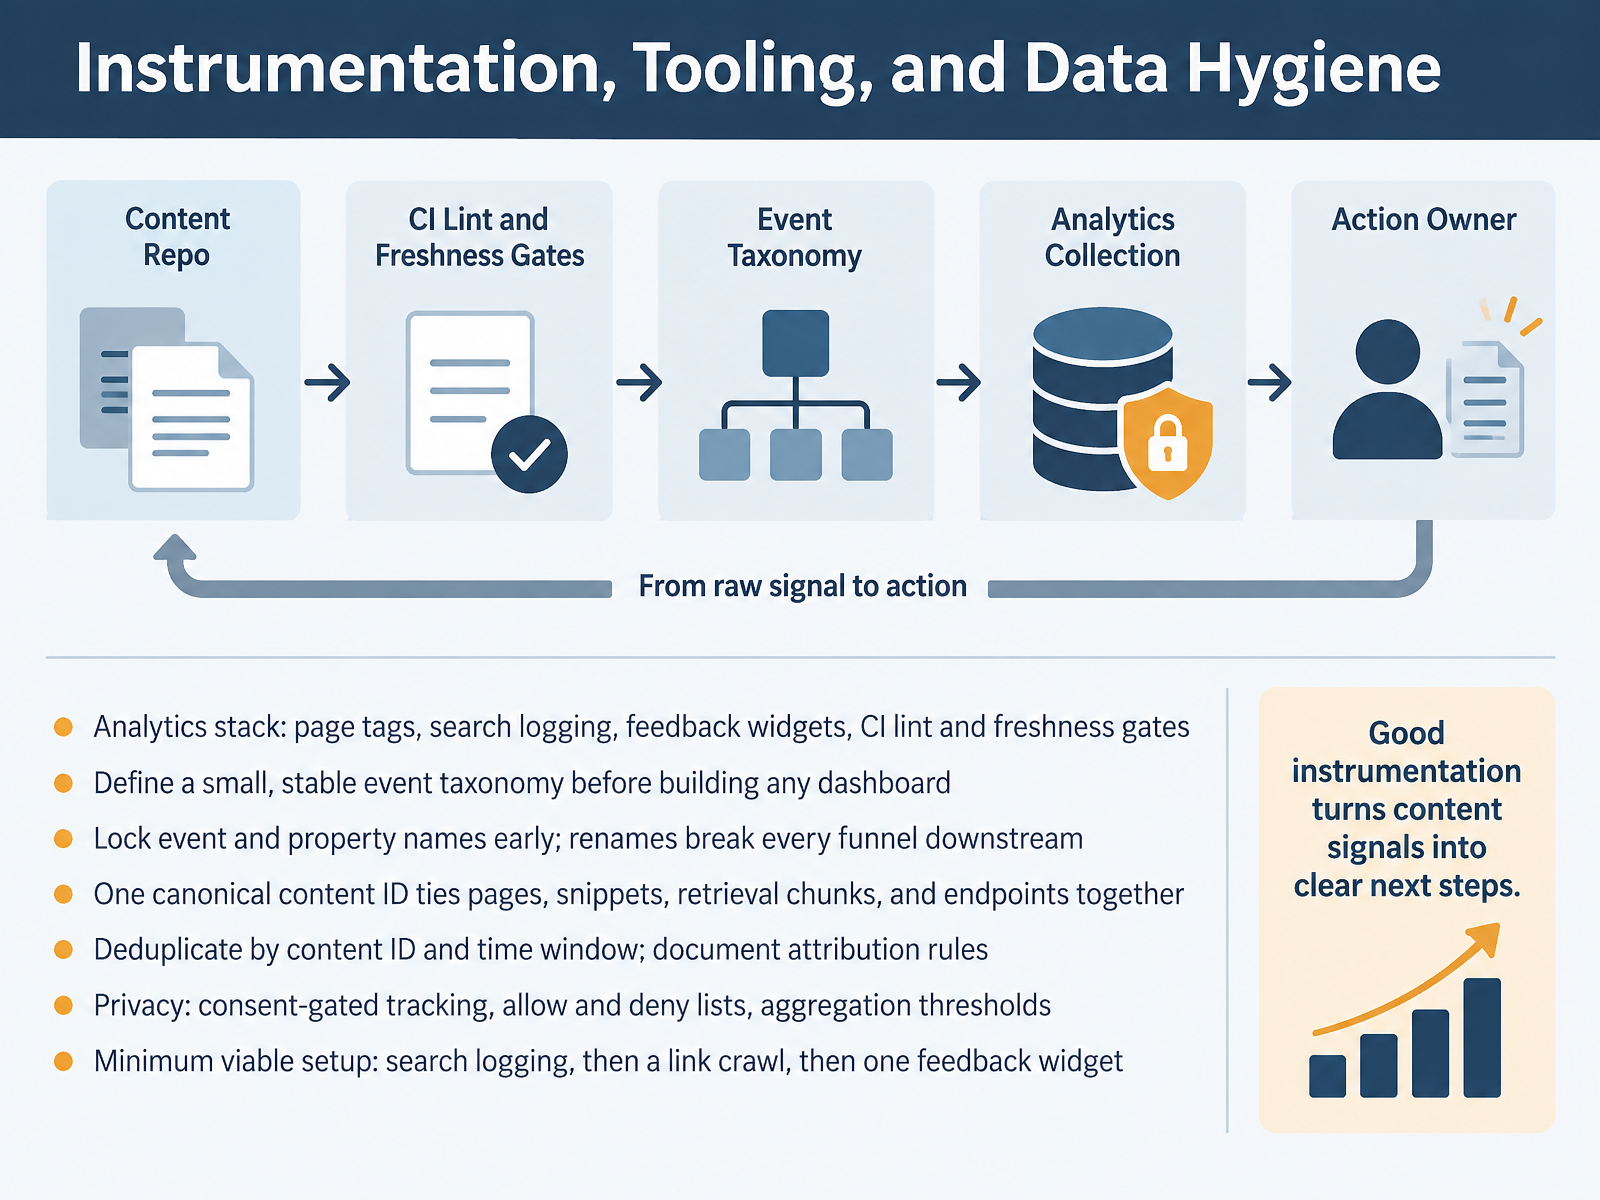
2 min - 07Instrumentation, Tooling, and Data HygieneLet's talk about the plumbing behind your metrics: instrumentation, tooling, and data hygiene. Your analytics stack usually means page tags, search logging, feedback widgets, and continuous integration gates for linting and content freshness. Before you build any dashboard, define a small, stable event taxonomy. Lock event and property names early, because one rename breaks every funnel downstream. Give every asset one canonical content ID that ties pages, code snippets, retrieval chunks, and endpoints together. Then deduplicate by content ID and time window, and write down your attribution rules. On privacy, gate tracking behind consent, keep allow and deny lists, and apply aggregation thresholds. If you are starting out, use this minimum viable setup: search logging first, then a link crawl, then one feedback widget. That sequence gives you real signal without heavy engineering. Next, we will look at choosing and prioritizing your metrics.
 1 min
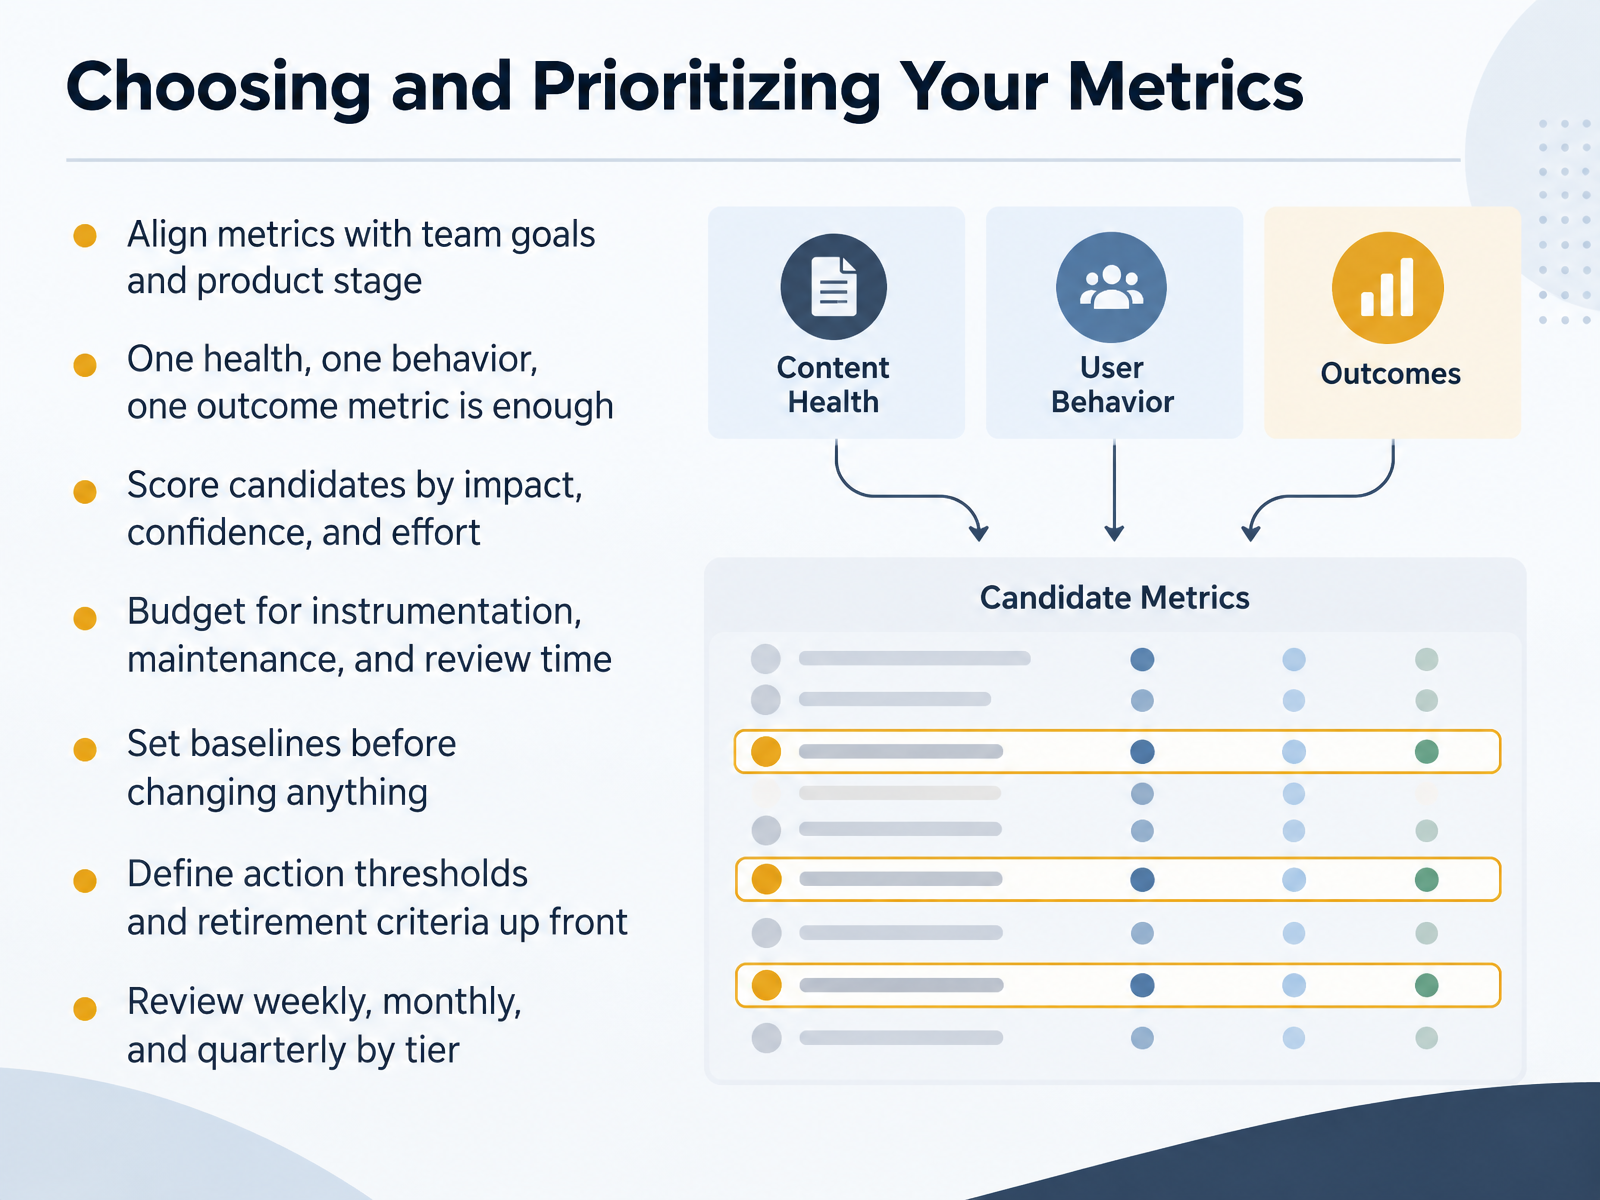
1 min - 08Choosing and Prioritizing Your MetricsNow let's talk about choosing and prioritizing your metrics, because a long list helps no one. Start by aligning metrics with your team goals and product stage. A pre-launch API cares about time to first successful call. A mature product cares about support ticket reduction. Keep the set small. One health metric, one behavior metric, and one outcome metric is enough. Then score candidates by impact, confidence, and effort. If a metric is high impact but low confidence, maybe you defer it. Next, budget for instrumentation, maintenance, and review time. Every metric you add costs engineering and writer hours. Before you change anything, set baselines. For example, measure current task completion before you rewrite a quickstart. Then define action thresholds and retirement criteria up front. If support tickets drop below ten per month, retire the metric. Finally, review weekly for health, monthly for behavior, and quarterly for outcomes. That tiering keeps your metric set honest and manageable. Next, let's look at common pitfalls and ethical considerations.
 2 min
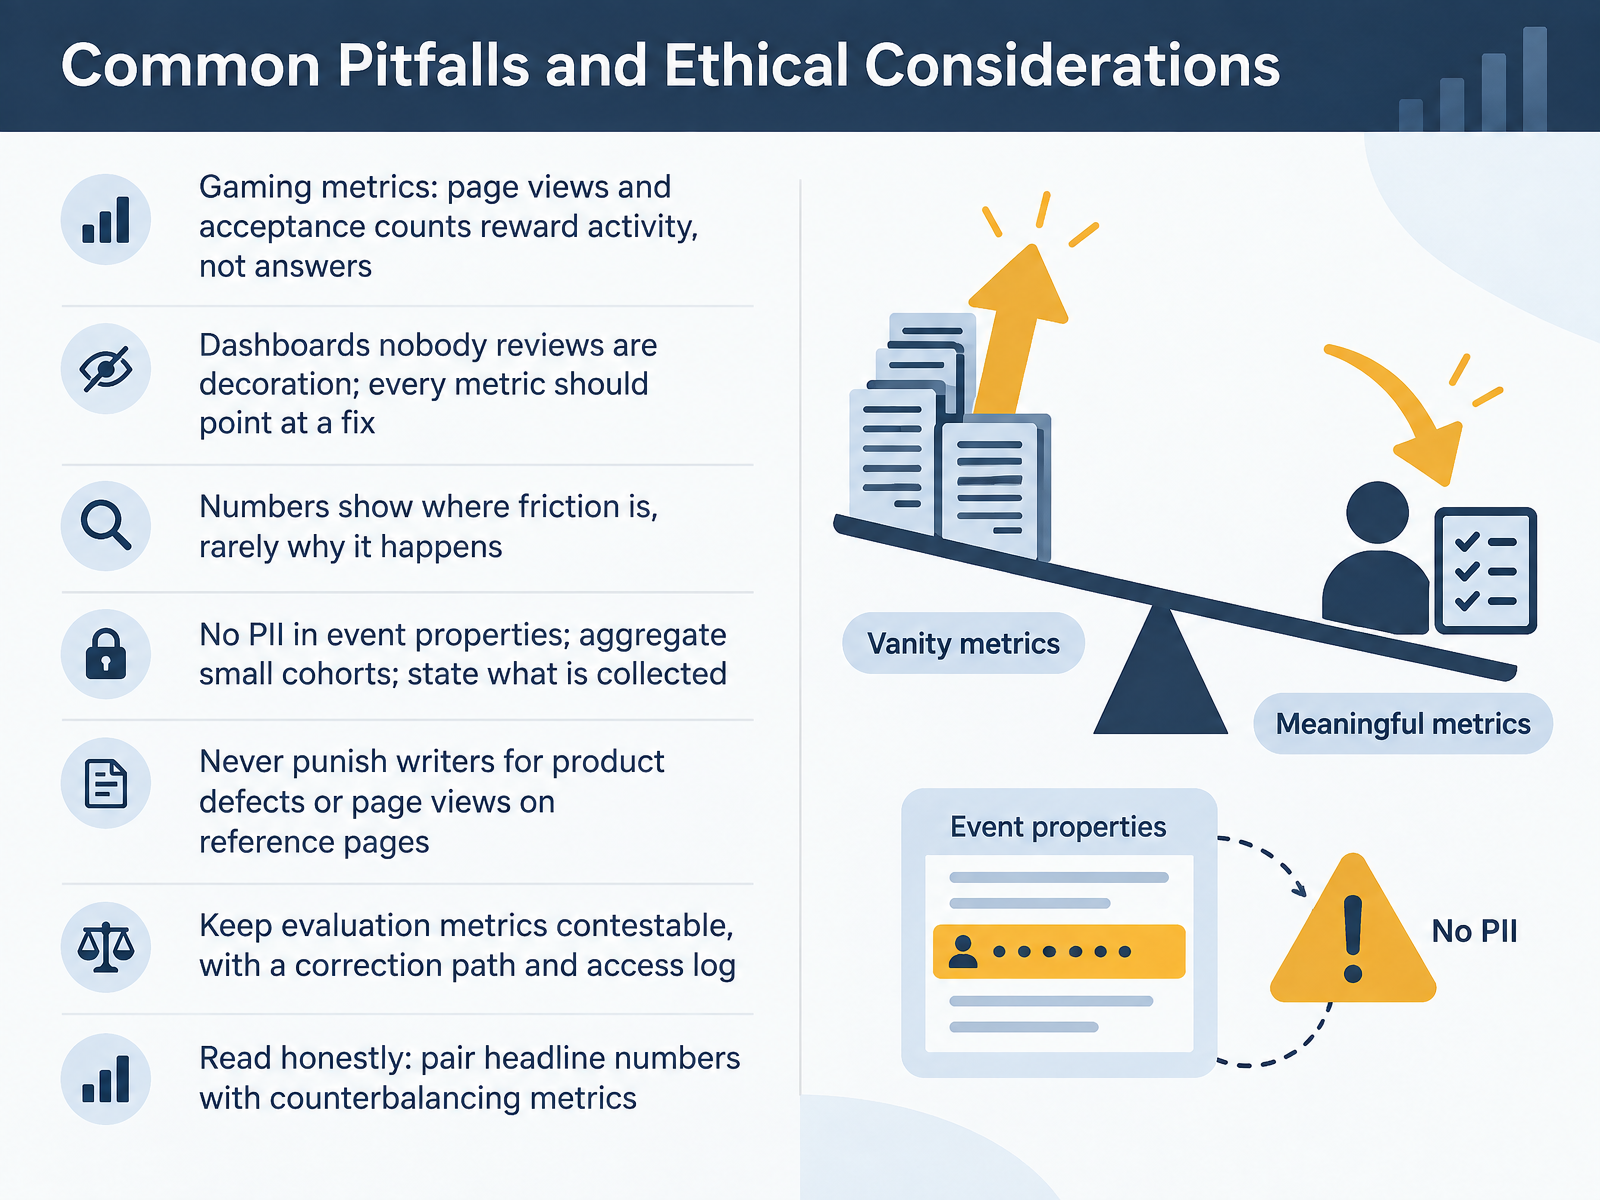
2 min - 09Common Pitfalls and Ethical ConsiderationsLet's talk about common pitfalls and ethical considerations. You can measure carefully and still mislead yourself. The first trap is gaming metrics. Page views and acceptance counts reward activity, not answers. A writer can hit every target while readers still fail to solve the problem. Second, a dashboard nobody reviews is decoration. Every metric you keep should point at a fix, whether that is a rewrite, a template change, or a conversation with engineering. Third, numbers show where friction is, rarely why it happens. Pair the drop in task success with a short reader interview to find the cause. On ethics, keep personally identifiable information out of event properties, aggregate small cohorts, and state plainly what you collect. Never punish writers for product defects, or for page views on reference pages. And keep evaluation metrics contestable, with a documented correction path and an access log. Read honestly: place headline numbers beside counterbalancing metrics, so speed never hides confusion. Next, we move to putting it into practice with a ninety day measurement plan, weeks one through four.
 2 min
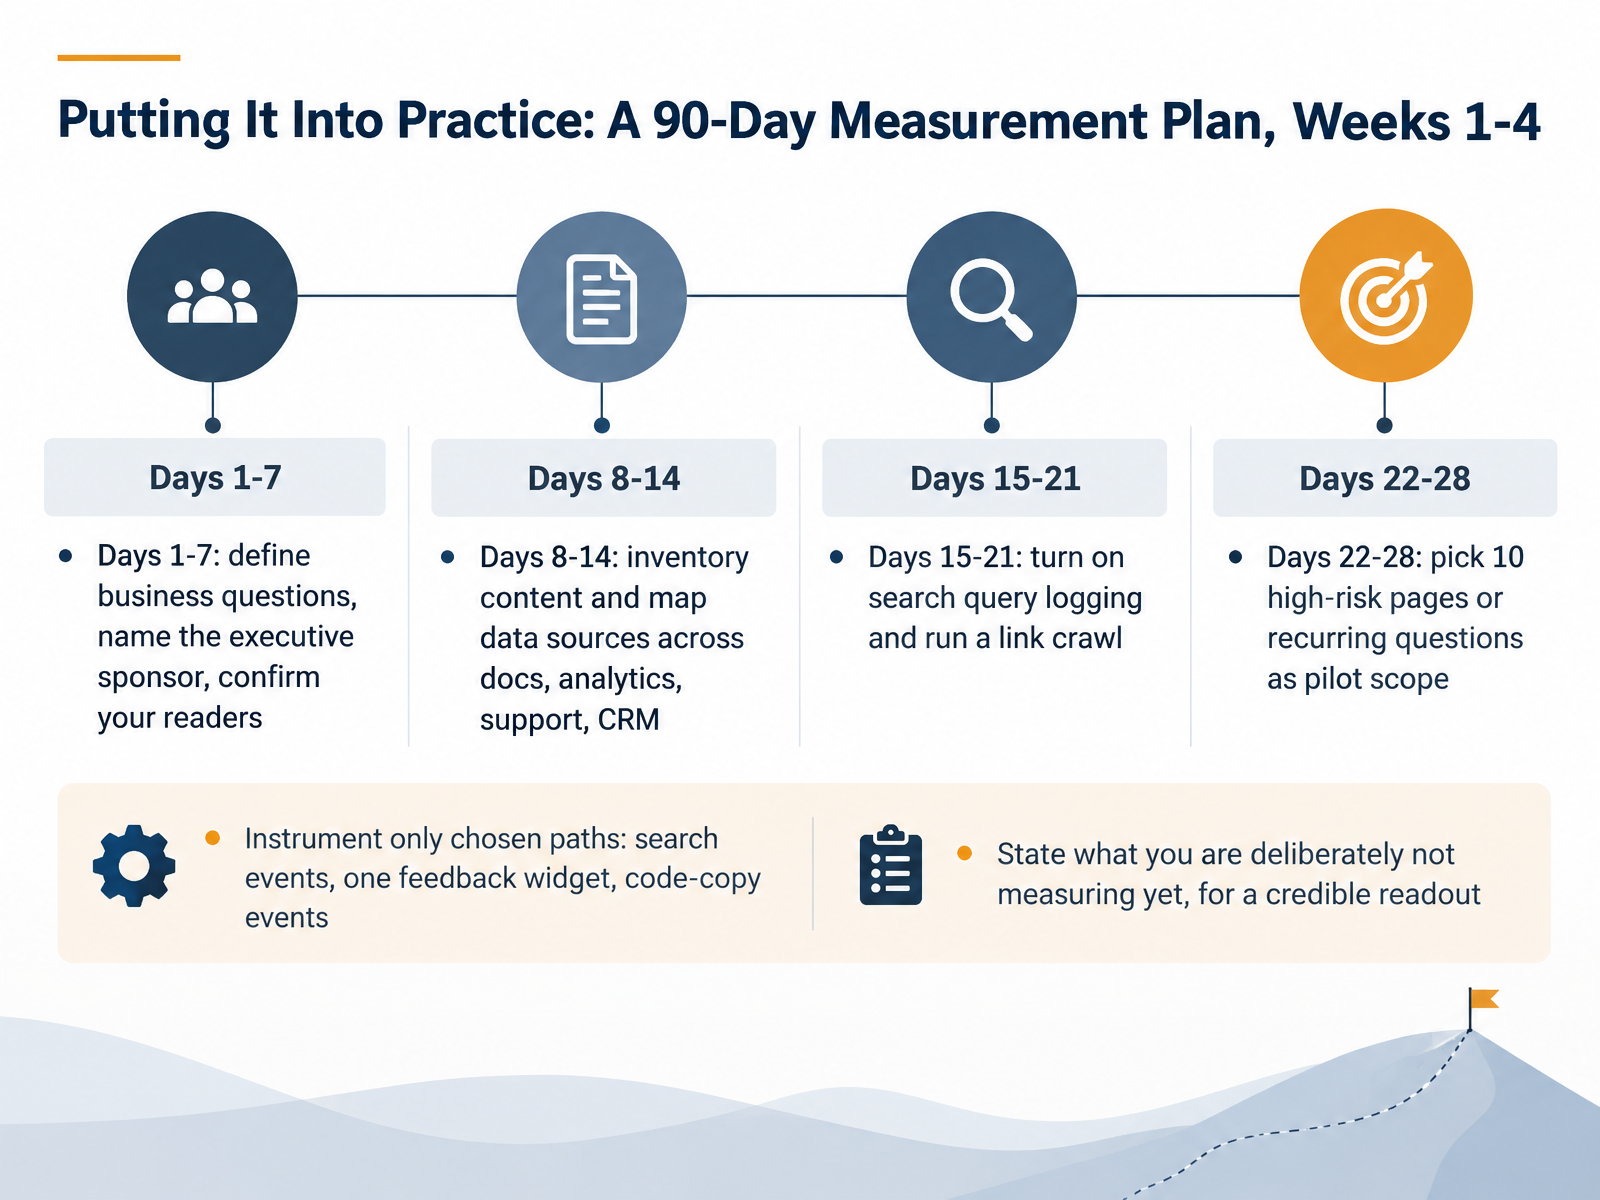
2 min - 10Putting It Into Practice: A 90-Day Measurement Plan, Weeks 1-4Let's make this concrete with a ninety-day measurement plan. Weeks one through four build the foundation, so treat this month as setup, not scoring.
In days one through seven, define the business questions you need to answer, name your executive sponsor, and confirm who your readers actually are. If you skip this, you will collect data nobody uses.
Days eight through fourteen are for inventory. Map your data sources across documentation, analytics, support tickets, and the C R M. Know what each system already tells you.
Days fifteen through twenty-one, turn on search query logging and run a link crawl. This shows you what people search for and where your links break.
Days twenty-two through twenty-eight, choose your pilot scope: ten high-risk pages or recurring questions. Then instrument only those chosen paths. That means search events, one feedback widget, and code-copy events.
One more thing. State clearly what you are deliberately not measuring yet. That keeps your first readout credible.
Next, we will cover weeks five through twelve, where this setup turns into a repeating cycle.
 2 min
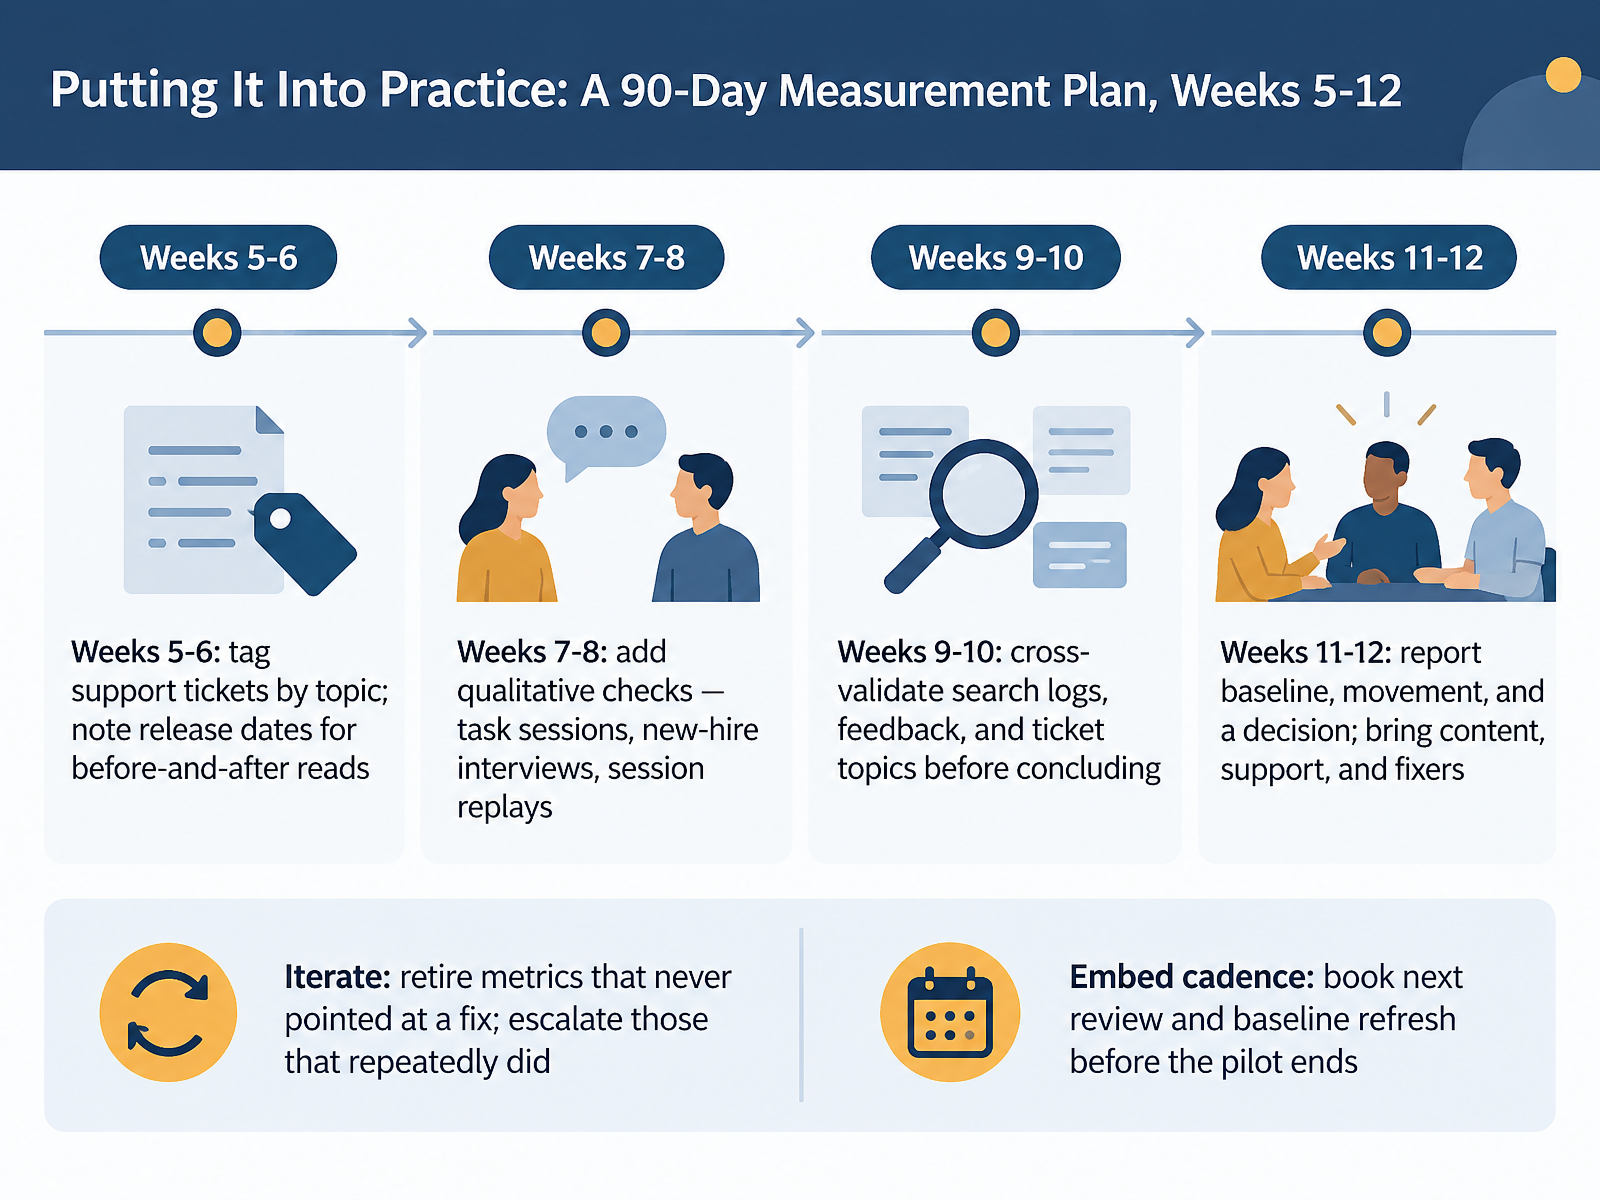
2 min - 11Putting It Into Practice: A 90-Day Measurement Plan, Weeks 5-12Now let's make measurement operational, weeks five through twelve. Start with weeks five and six. Tag support tickets by topic. Then note release dates, so you can compare reads before and after each change. In weeks seven and eight, add qualitative checks. Run task sessions. Interview new hires. Watch a few session replays. These tell you why the numbers moved. Weeks nine and ten are for cross-validation. Before you conclude anything, line up search logs, feedback, and ticket topics. If three sources agree, you have a real signal. If only one moves, investigate before acting. In weeks eleven and twelve, report three things. The baseline, the movement, and a decision. Bring content, support, and the people who fix the docs. Then iterate. Retire metrics that never pointed at a fix. Escalate the ones that repeatedly did. Finally, embed the cadence. Book the next review and baseline refresh before the pilot ends. Next, we will look at templates: the metric definition sheet, dashboard outline, and stakeholder update.
 2 min
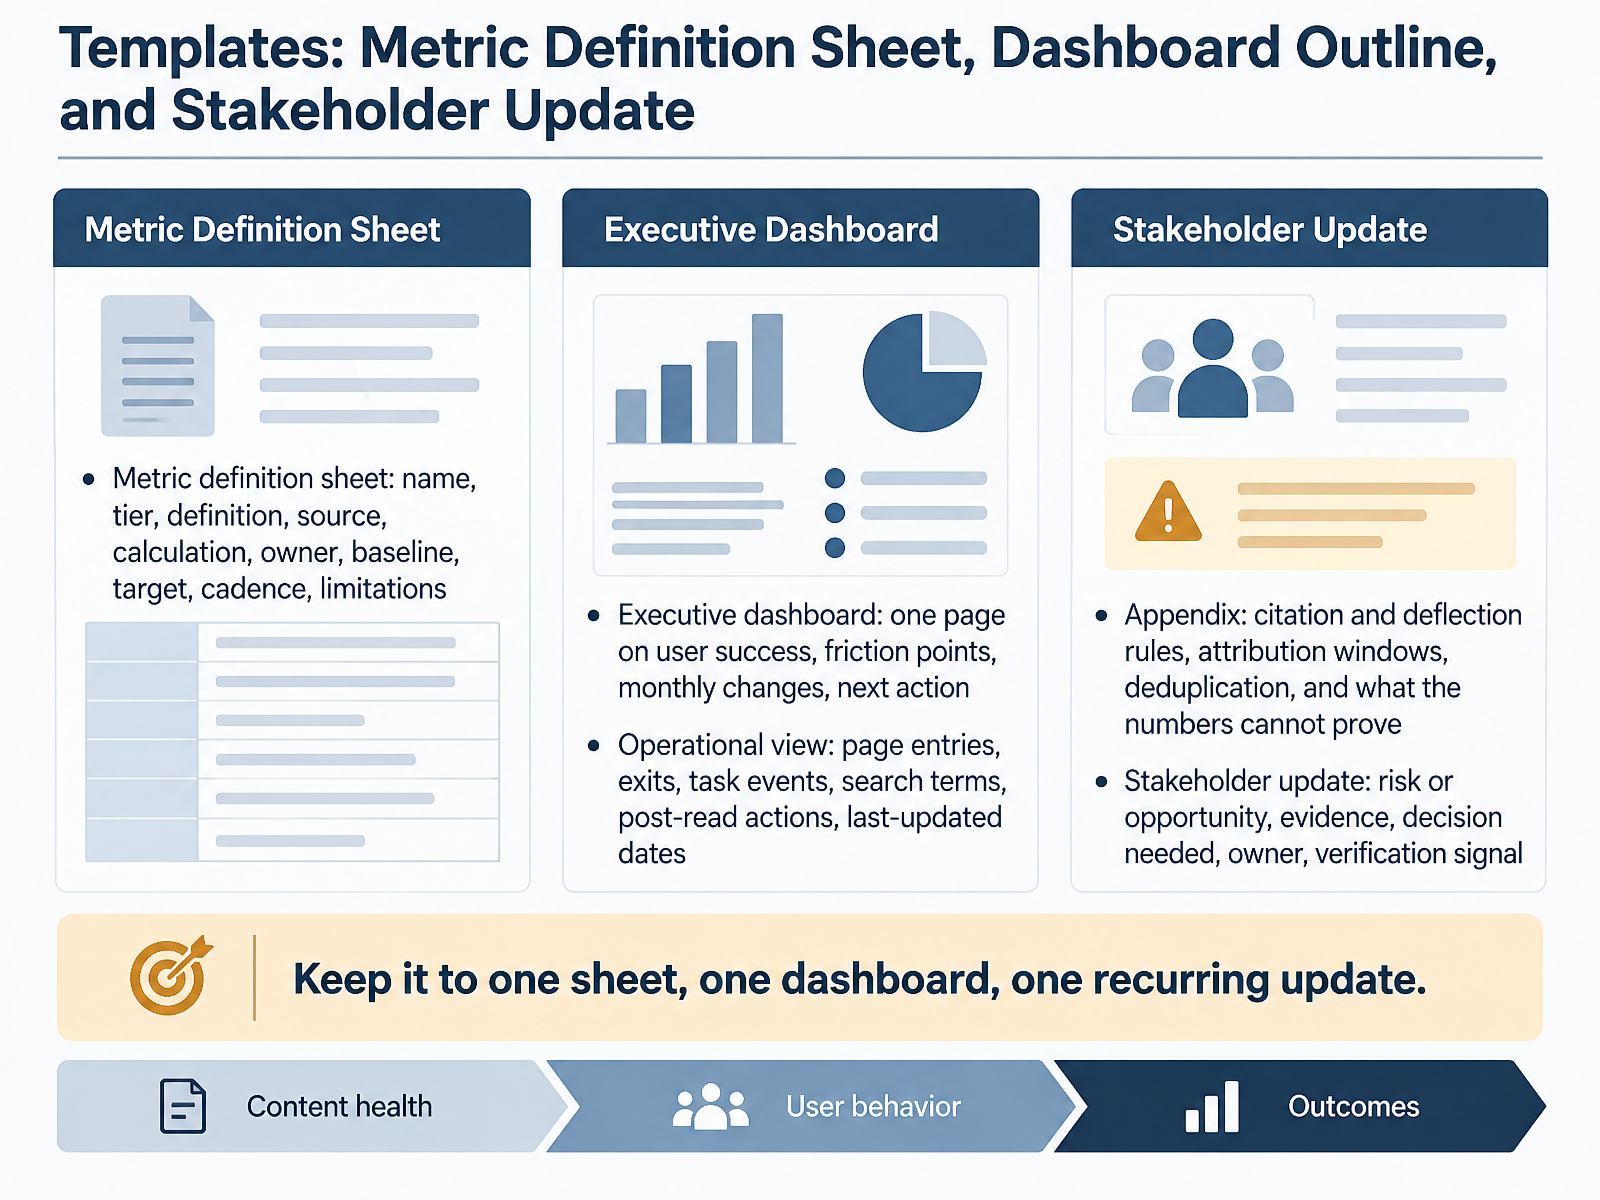
2 min - 12Templates: Metric Definition Sheet, Dashboard Outline, and Stakeholder UpdateLet's talk templates, because metrics fail when everyone defines them differently. You keep three artifacts, no more. First, a metric definition sheet. For each metric, you record its name, its tier, a plain-language definition, the data source, the calculation, the owner, the baseline, the target, the review cadence, and its limitations. If you measure task success, for example, you define it as a user completing a goal without returning to search, and you name the owner who signs off on it. Second, an executive dashboard, one page showing user success, friction points, monthly changes, and the next action. Third, an operational view with page entries, exits, task events, search terms, post-read actions, and last-updated dates. In the appendix, you spell out citation and deflection rules, attribution windows, deduplication, and what the numbers cannot prove. Then your stakeholder update follows a simple shape: risk or opportunity, evidence, decision needed, owner, and the verification signal. One sheet, one dashboard, one recurring update. That is next, adapting to AI-mediated documentation use.
 2 min
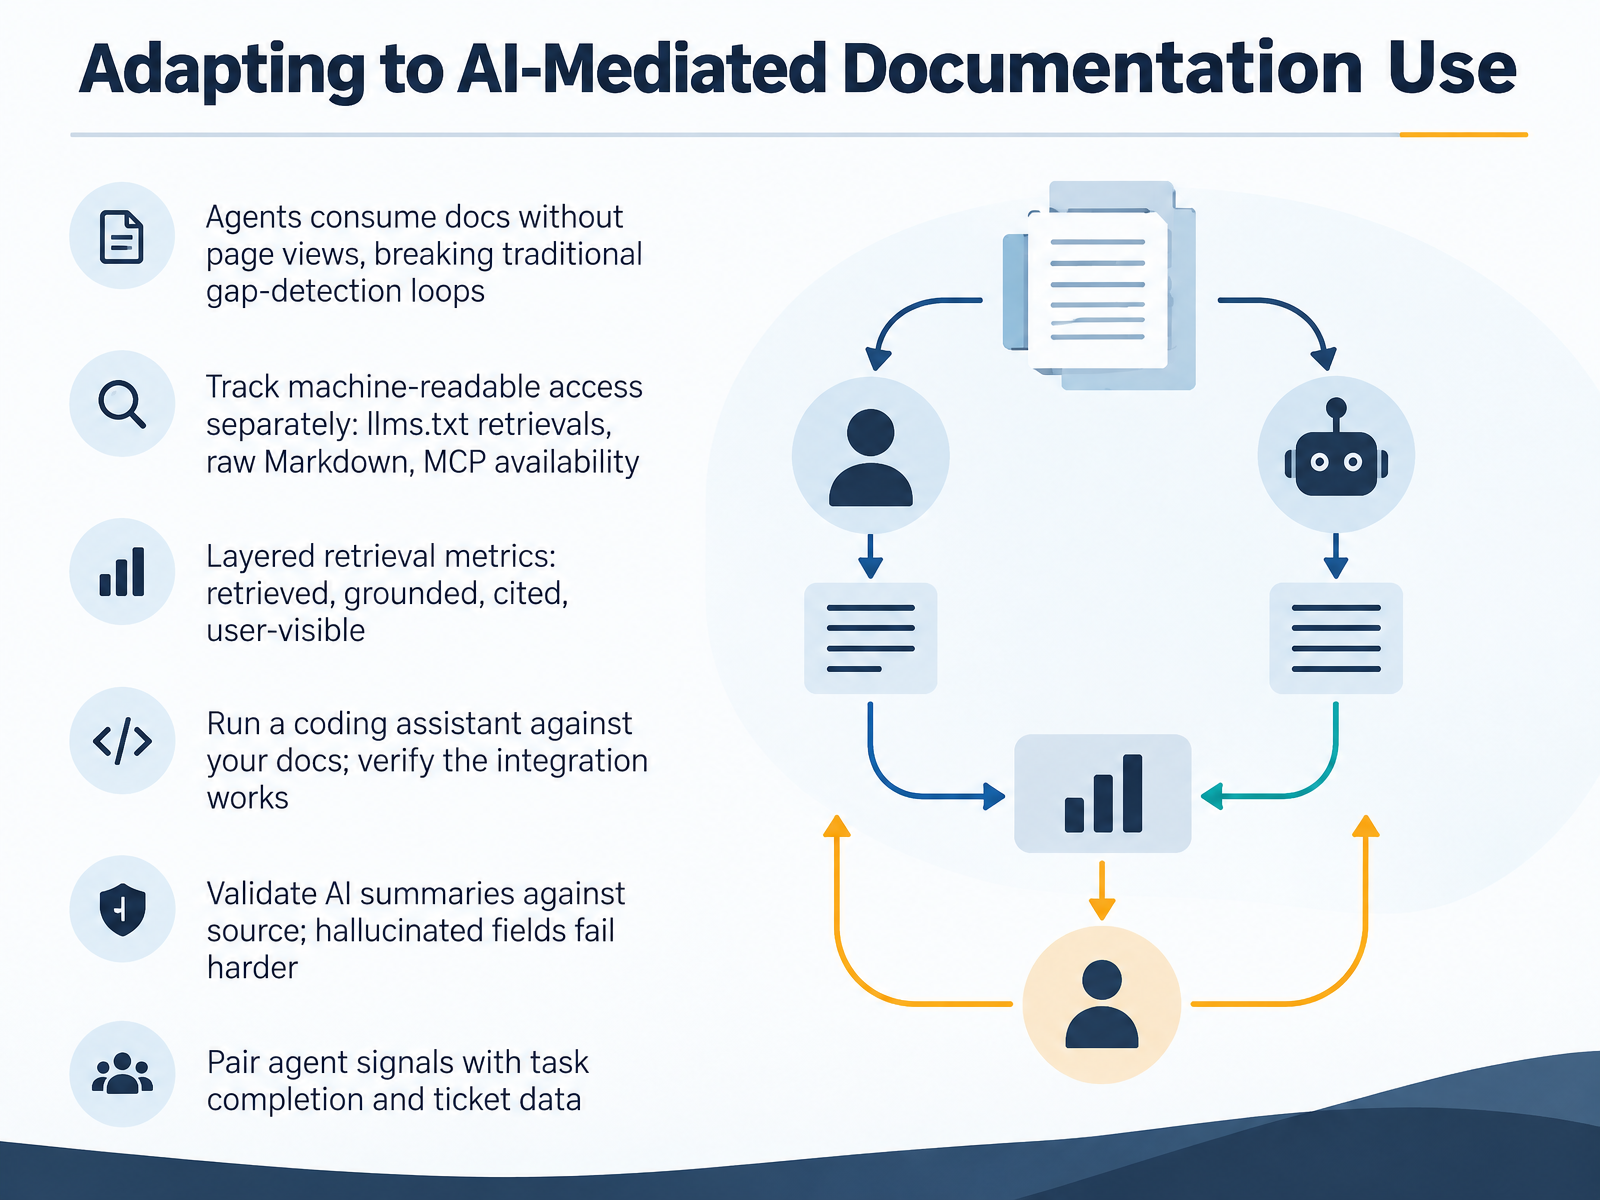
2 min - 13Adapting to AI-Mediated Documentation UseLet's look at how AI changes who actually reads your docs. Agents consume documentation without generating page views. That breaks your usual gap-detection loop, because you can no longer spot missing answers by watching traffic drop or search terms rise. So measure machine-readable access separately. Track things like llms dot t x t retrievals, raw Markdown requests, and whether your content is available through MCP. Then layer your retrieval metrics. Did the agent retrieve the page? Was the answer grounded in your source? Was it cited? And did it reach a user-visible response? Here is a practical test. Run a coding assistant against your docs and verify the integration actually works end to end. Then validate AI summaries against the source. A hallucinated field fails harder than a vague paragraph, because users trust it as fact. Finally, pair those agent signals with task completion and ticket data. If retrieval is high but tickets keep coming, your docs are reachable but not resolving. Next, let's pull this together into key takeaways and your next three actions.
 2 min
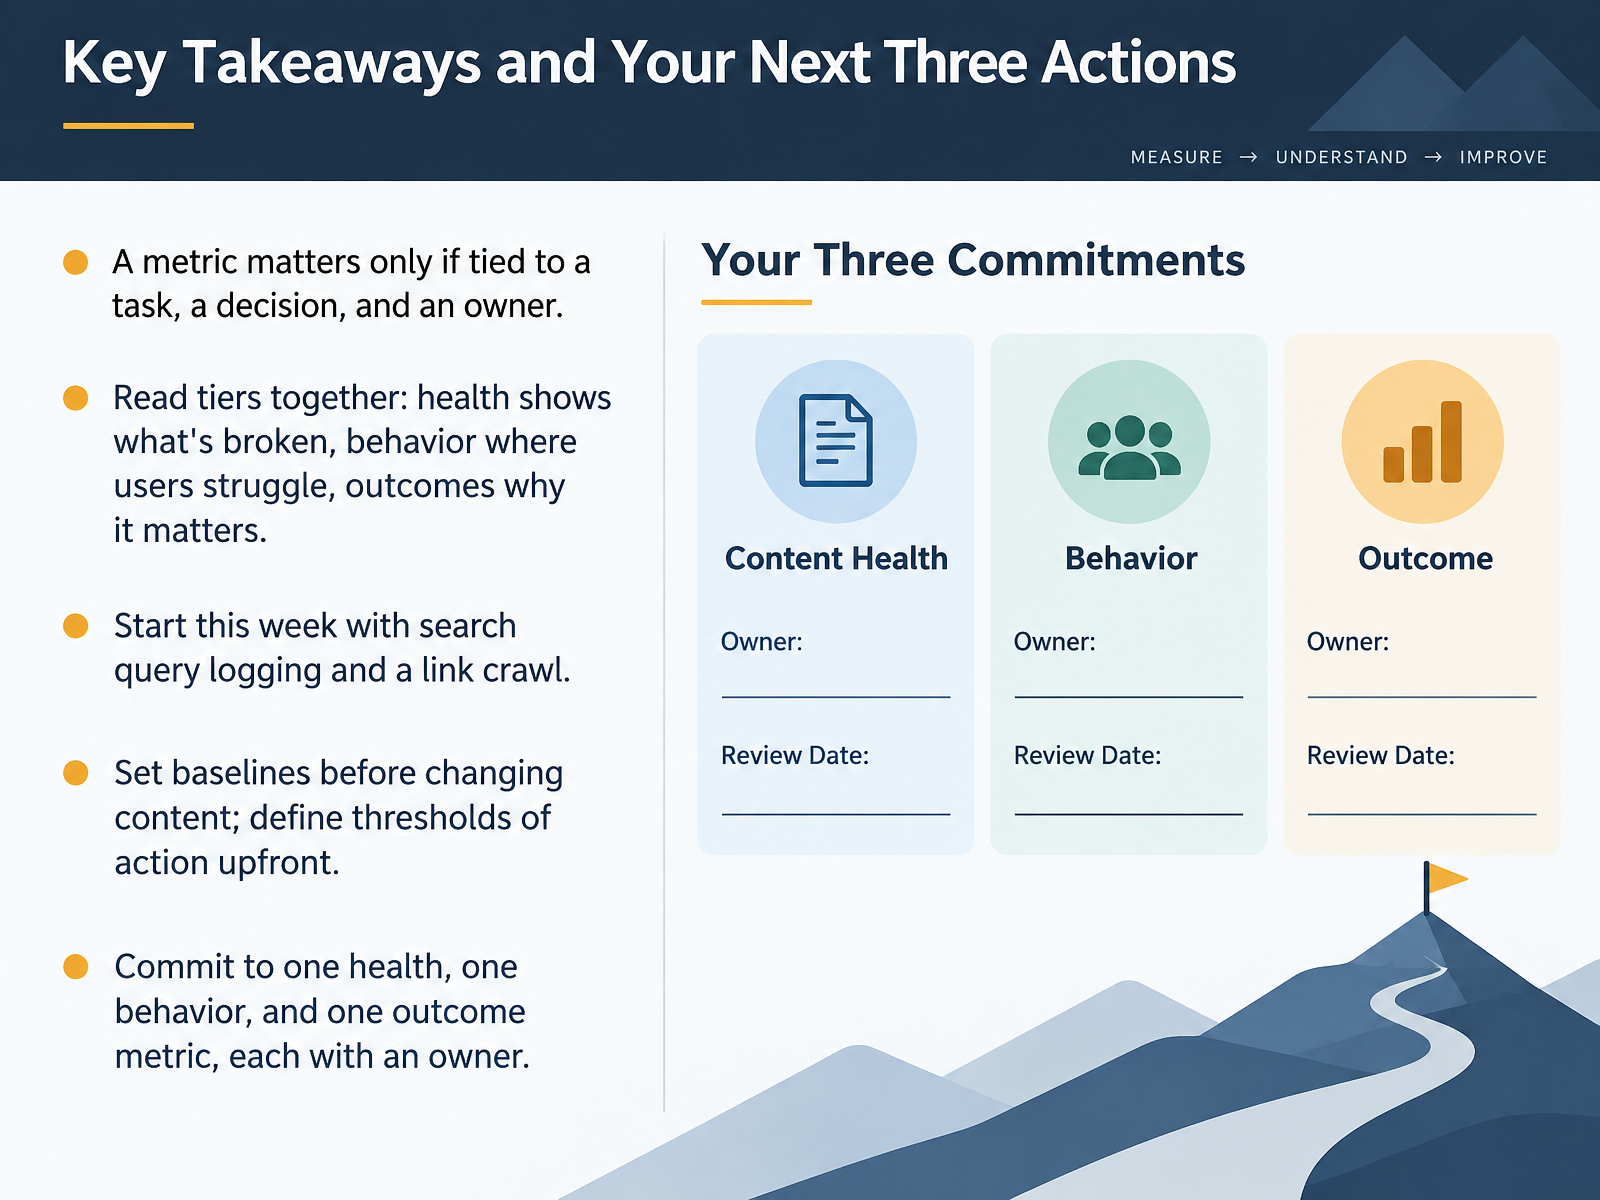
2 min - 14Key Takeaways and Your Next Three ActionsLet's pull this together. A metric matters only when it's tied to a task, a decision, and an owner. Ask yourself: what task will you do differently, what decision will this inform, and who acts on it?
Read your tiers together. Health shows what's broken, like broken links or failed builds. Behavior shows where users struggle, like repeated search queries. Outcomes show why any of it matters, like fewer support tickets.
Start this week with two cheap moves: turn on search query logging, and run a link crawl.
Set baselines before you change content. Define your thresholds of action upfront, so no one debates the number later.
Then commit to one health, one behavior, and one outcome metric. Give each one an owner.
That's your next three actions. Thank you for working through this course. Start small, measure honestly, and let the evidence guide you. You've got this.
 2 min
2 min
Take the deck with you
Download this course as a file — free, no sign-up needed.
- PDF handoutEvery slide page, ready to print or share.15 pages · 3.3 MBDownload
- Narrated PowerPointThe deck that presents itself — every slide carries the digital human's narration video.15 pages · 26.7 MBDownload
- PowerPoint slidesThe full deck as a .pptx — open it in PowerPoint, Keynote, or Google Slides.15 pages · 3.2 MBDownload
Free to use in your own training — please keep the PersonWise credit page at the end.
Have your own deck? Turn it into a course