Begin
14 pages · ~28 min
Customer Service Communication for Stakeholders
This course helps customer service professionals communicate service performance and insights clearly to stakeholders, building support and alignment.
A digital instructor presents all 14 pages. Hold “Ask” at any point and ask out loud — the answer comes from this course. No sign-up needed.
What you’ll learn
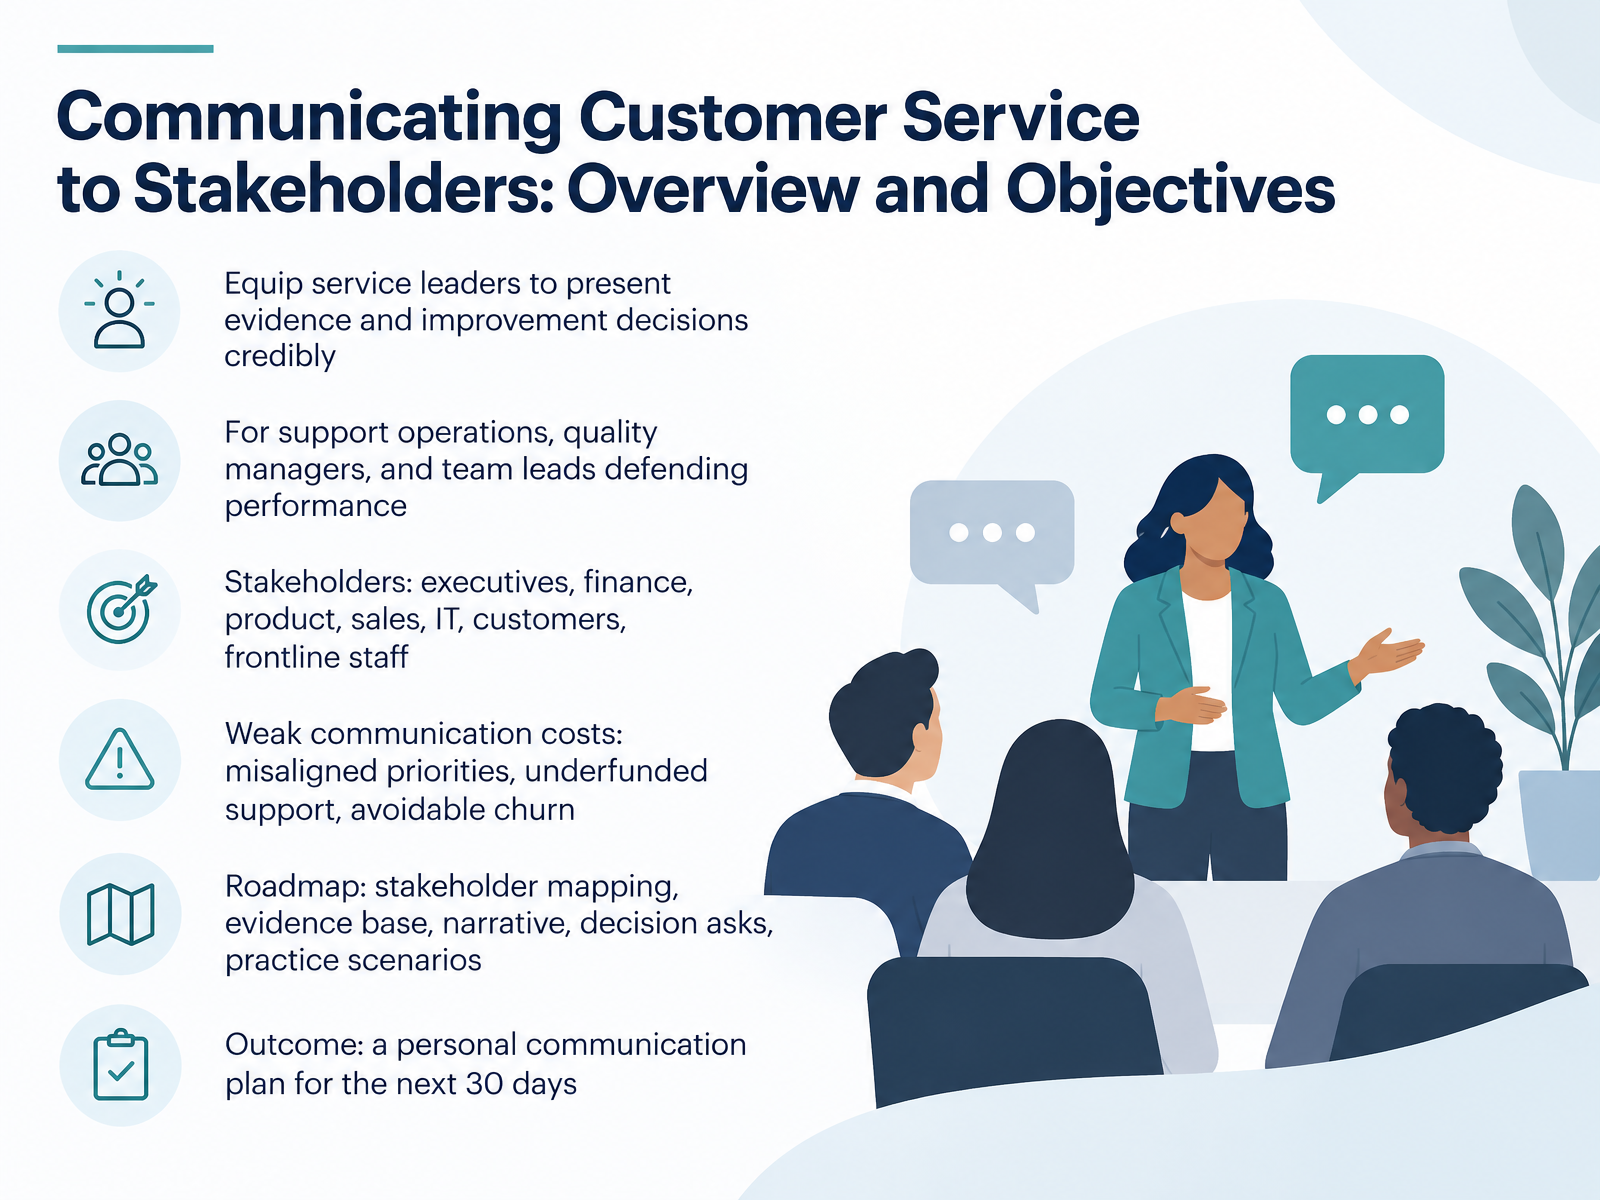
- 01Communicating Customer Service to Stakeholders: Overview and ObjectivesWelcome. Over the next few slides, we are going to work on one of the most underrated skills in service leadership: communicating what your team does to the people who fund it, prioritize it, and depend on it. You already understand service metrics and frontline reality. So we will skip the basics and focus on evidence, trade-offs, and decisions.
Here is the goal. By the end, you will be able to present service performance and improvement decisions credibly, whether you are defending results in an executive review, a staffing conversation, or a budget discussion.
Your stakeholders are a mixed room. Executives, finance, product, sales, IT, customers, and your own frontline staff. Each one hears a different version of the same story. Weak communication has a real cost. Misaligned priorities, underfunded support, and avoidable churn.
So we will follow a practical roadmap. Stakeholder mapping. Building your evidence base. Shaping the narrative. Making clear decision asks. Then practicing real scenarios.
Your outcome is a personal communication plan you can put to work in the next thirty days.
Let's begin with why service communication fails, and what good looks like.pubsonline.informs.orglink.springer.comtei.forrester.com+22 min
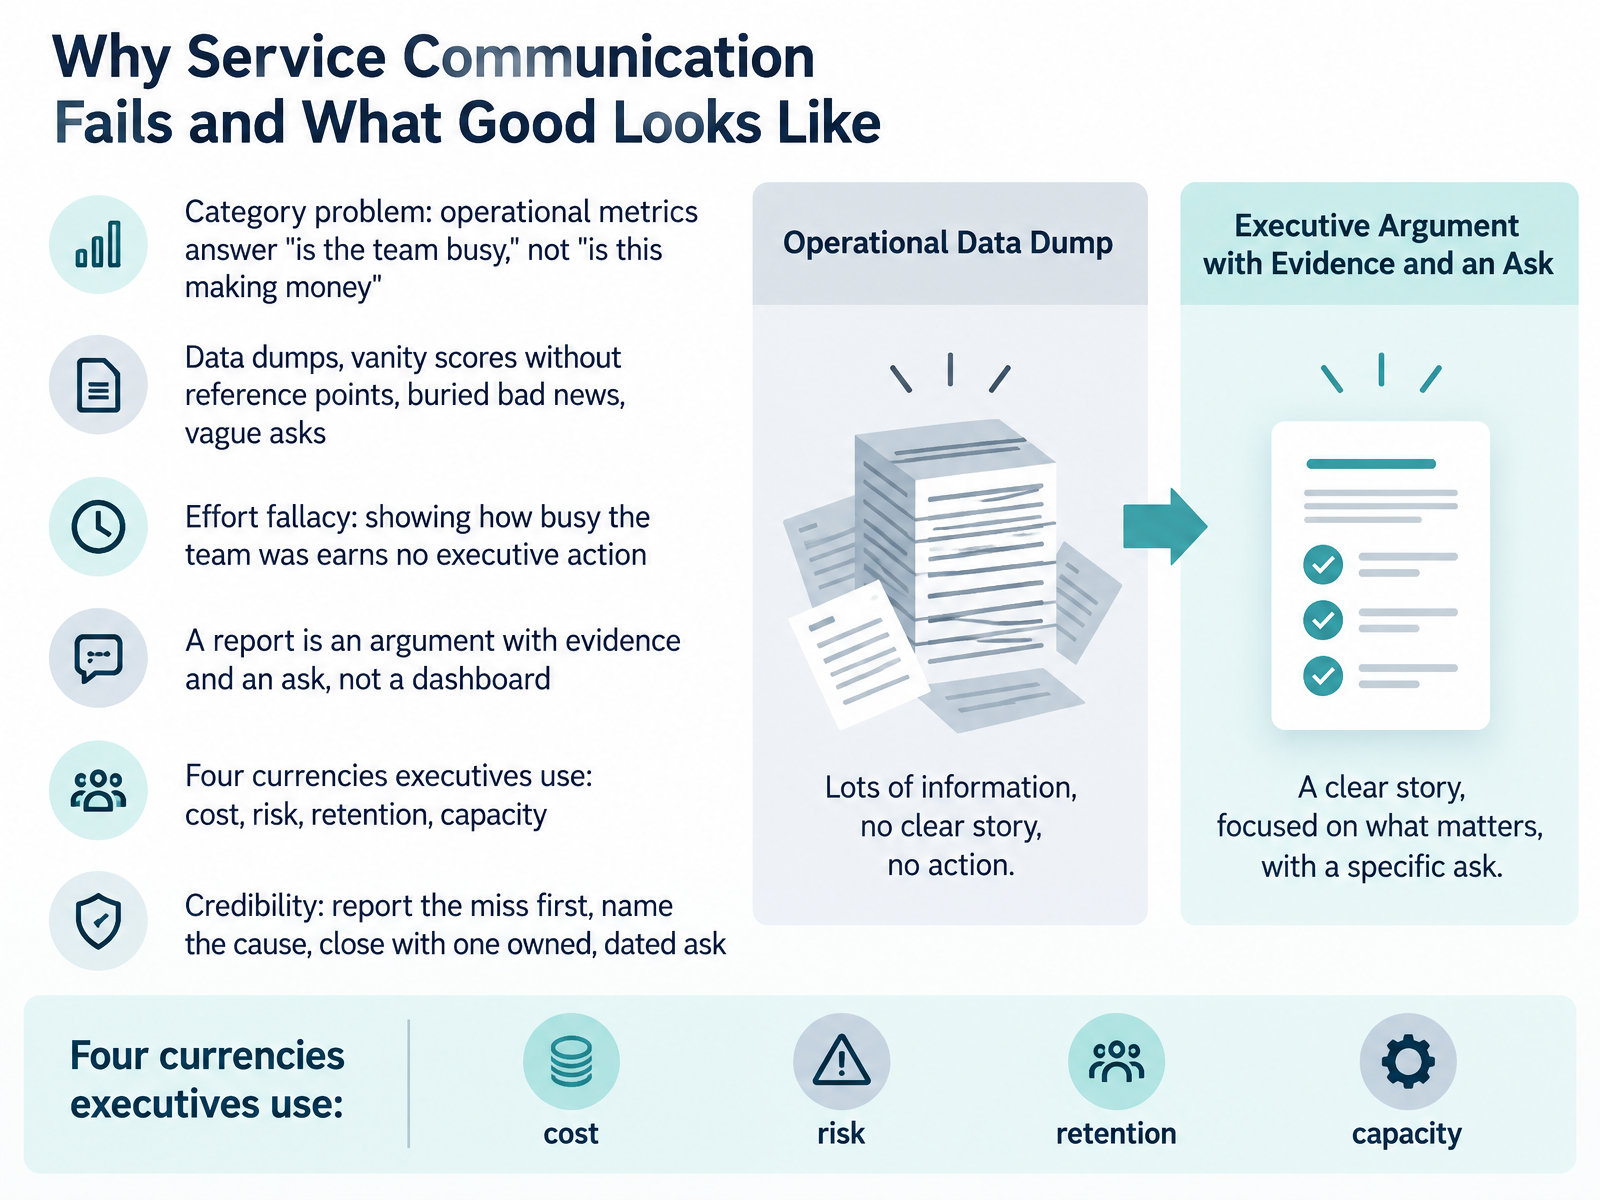
- 02Why Service Communication Fails and What Good Looks LikeLet's talk about why service communication so often fails, and what good looks like instead. Start with the core problem. Operational metrics answer, is the team busy. They don't answer, is this making money. And that mismatch is a category problem, not a slide problem. So the reports that land are not data dumps. A score with no reference point is not information. Never bury bad news. And skip the effort fallacy. Showing how busy the team was earns no executive action. A report is an argument with evidence and an ask, not a dashboard. So translate into the four currencies executives already use. Cost. Risk. Retention. Capacity. Follow the failing criterion to its operational consequence, then attach the number finance already has. And protect your credibility. Report the miss first. Name the cause, not a restatement. Then close with one ask that has an owner and a date. One. Next, let's look at mapping your stakeholders and their decision needs.
 kaizo.comoversai.comclickpost.ai+22 min
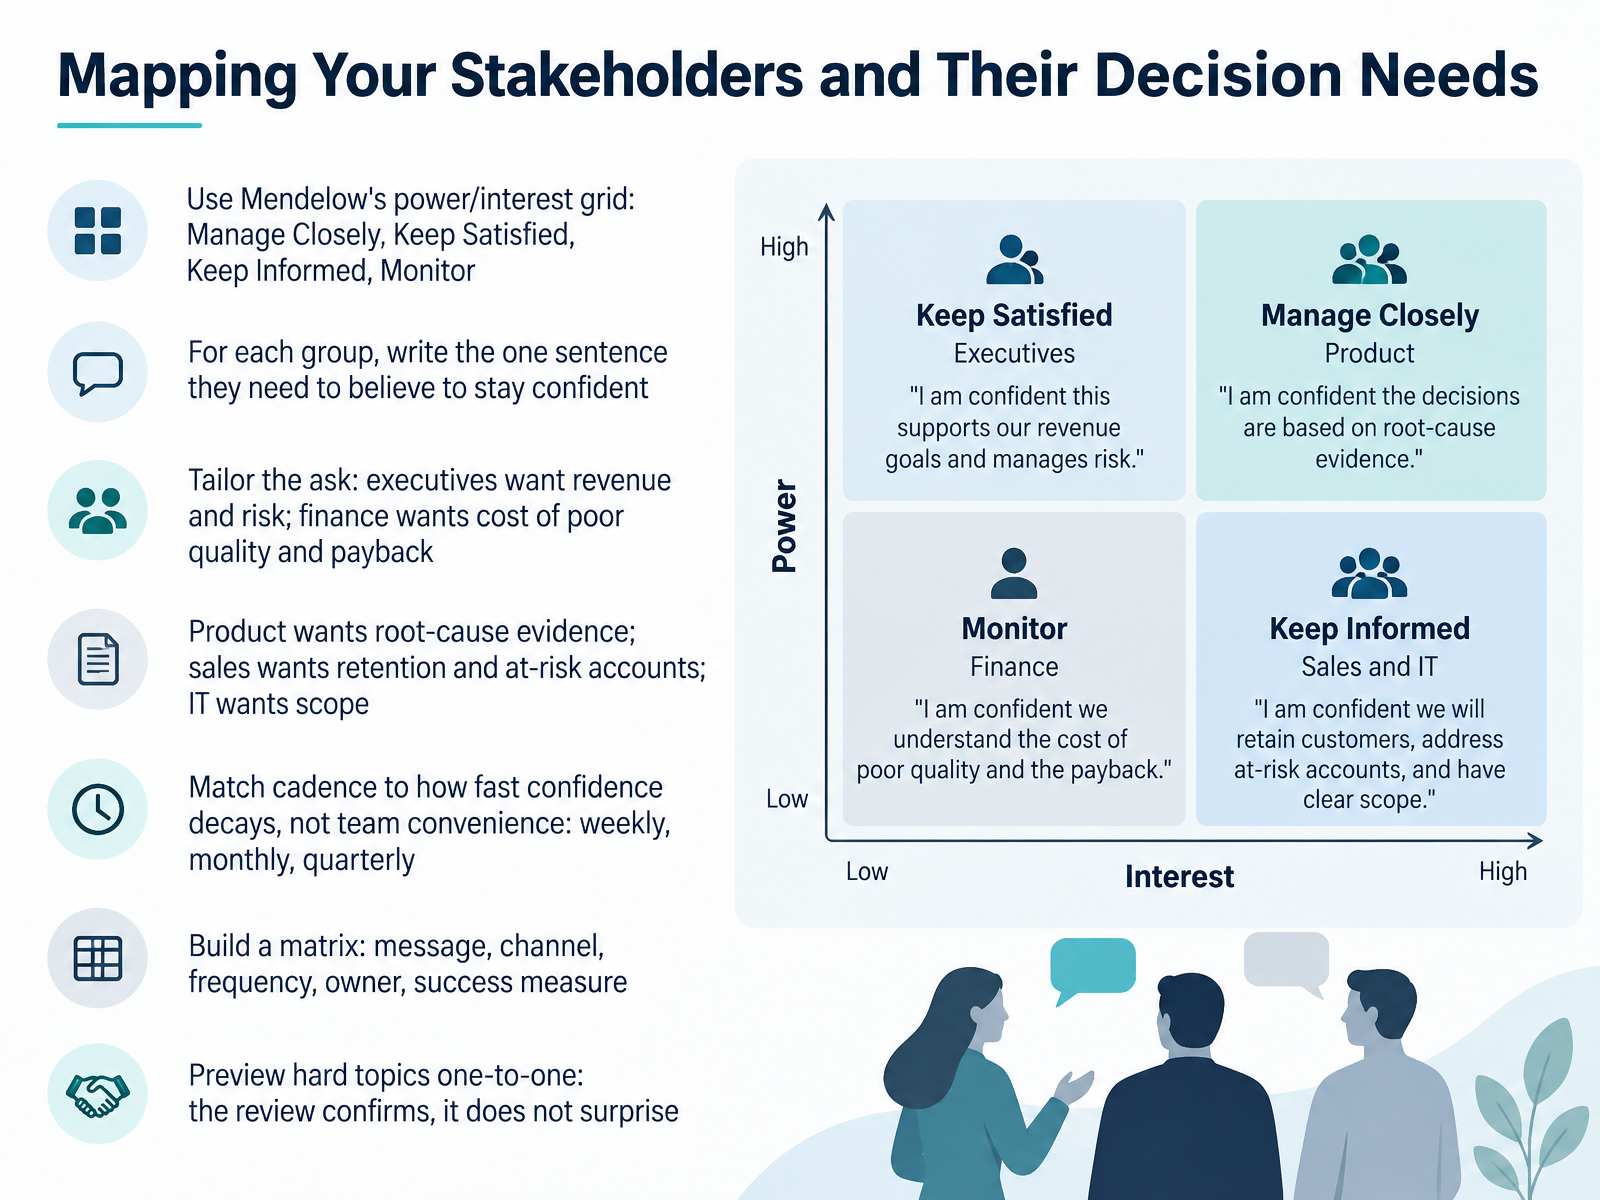
- 03Mapping Your Stakeholders and Their Decision NeedsNow let's map your stakeholders and their decision needs. Start with Mendelow's grid, four buckets: Manage Closely, Keep Satisfied, Keep Informed, Monitor. Then go one step further. For each group, write the single sentence they need to believe to stay confident. Executives want revenue and risk. Finance wants cost of poor quality and payback. Product wants root-cause evidence, sales wants retention and at-risk accounts, and IT wants scope. Match cadence to how fast confidence decays, not to team convenience. That means weekly for some, monthly, quarterly. Build one matrix: message, channel, frequency, owner, success measure. And preview hard topics one-to-one, so the review confirms instead of surprises. Here's the payoff. A customer service leader walked into a quarterly review with a refund-policy failure she had already discussed privately with finance. No ambush, no defense. The decision passed in ten minutes. Next, we build the evidence base: service metrics and data sources.
 en.ppt-online.orgpptdepot.commegantaylorwilliams.com+22 min
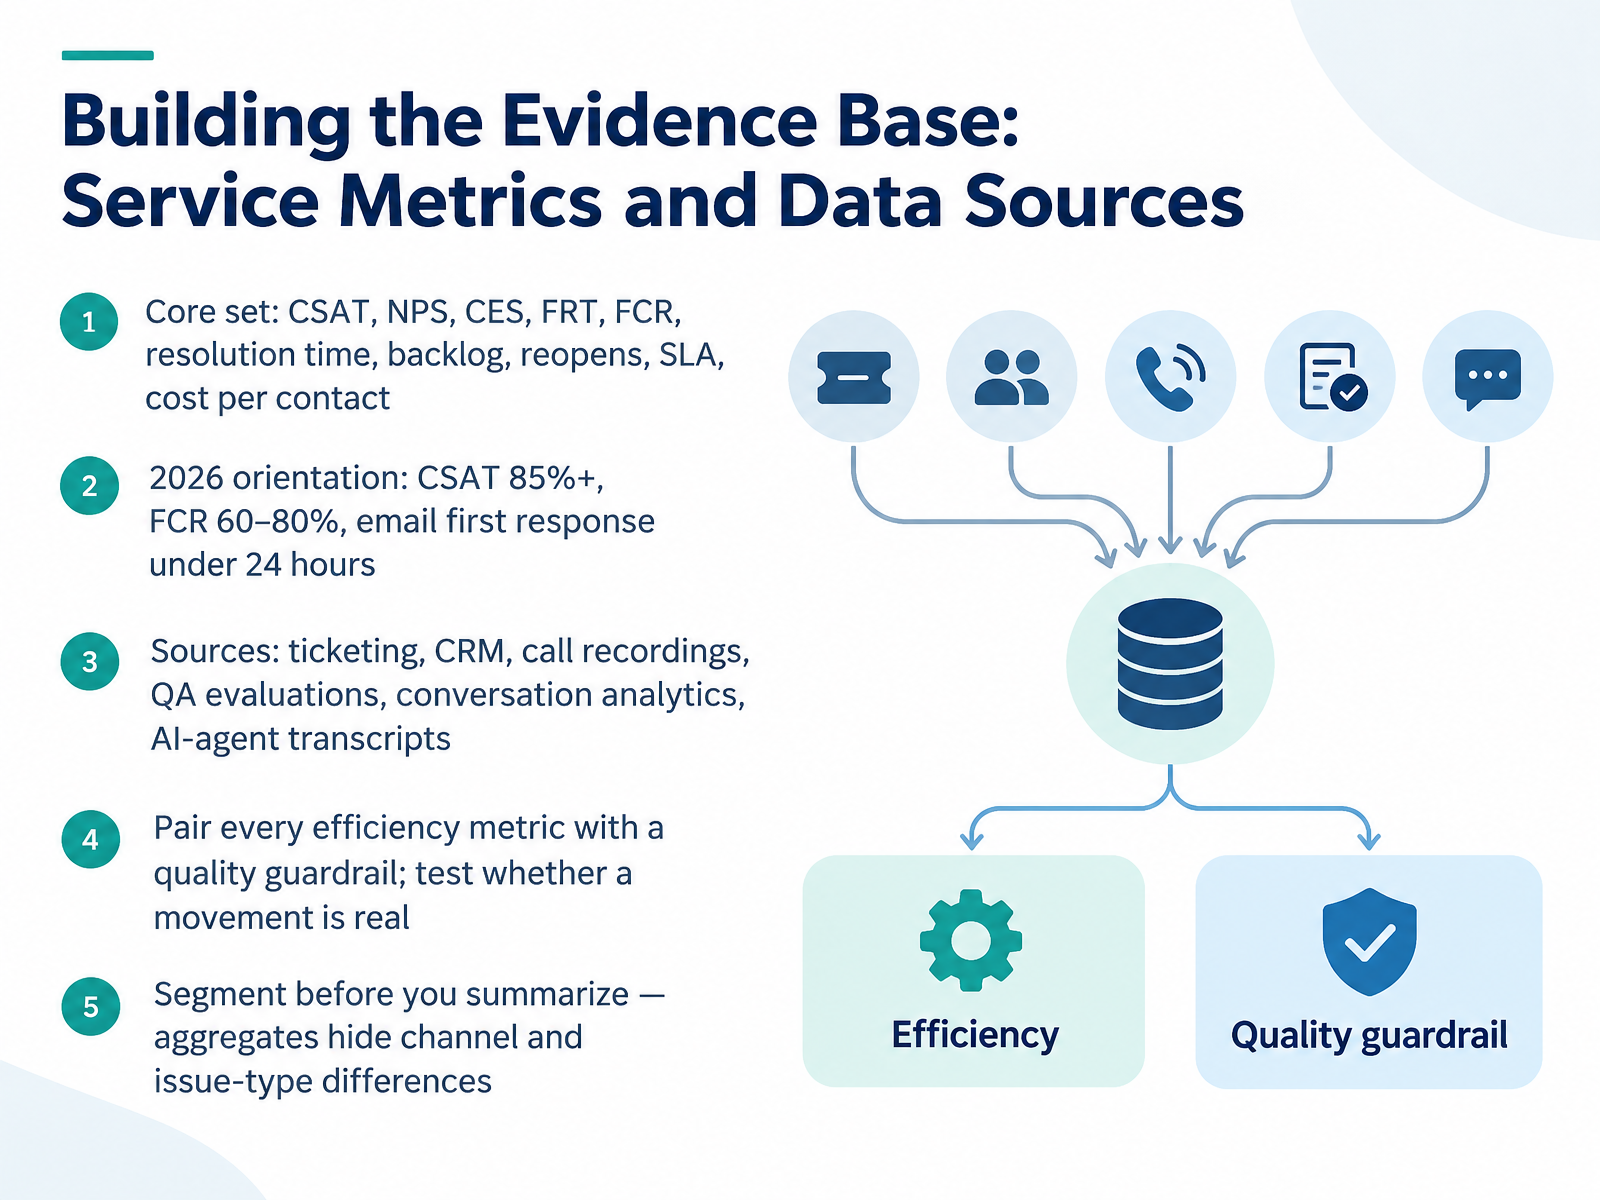
- 04Building the Evidence Base: Service Metrics and Data SourcesLet's build the evidence base. Start with a core set you can defend: customer satisfaction, Net Promoter, customer effort, first response time, first contact resolution, resolution time, backlog, reopens, service level compliance, and cost per contact. For 2026, use these as orientation: customer satisfaction at eighty-five percent or higher, first contact resolution between sixty and eighty percent, and email first response under twenty-four hours. Pull your sources together, from ticketing and CRM to call recordings, QA evaluations, conversation analytics, and AI-agent transcripts. Now here is the discipline that keeps you credible. Pair every efficiency metric with a quality guardrail, and test whether the movement is real before you explain it. A speed gain that drags quality down is a warning, not a win. And segment before you summarize, because aggregates hide channel and issue-type differences. For example, a flat overall satisfaction score can conceal a struggling chat channel and a strong phone queue. Report the shape, not just the average. Connecting service metrics to business outcomes is where this evidence starts to earn its place.
 kaizo.comoversai.comclickpost.ai+22 min
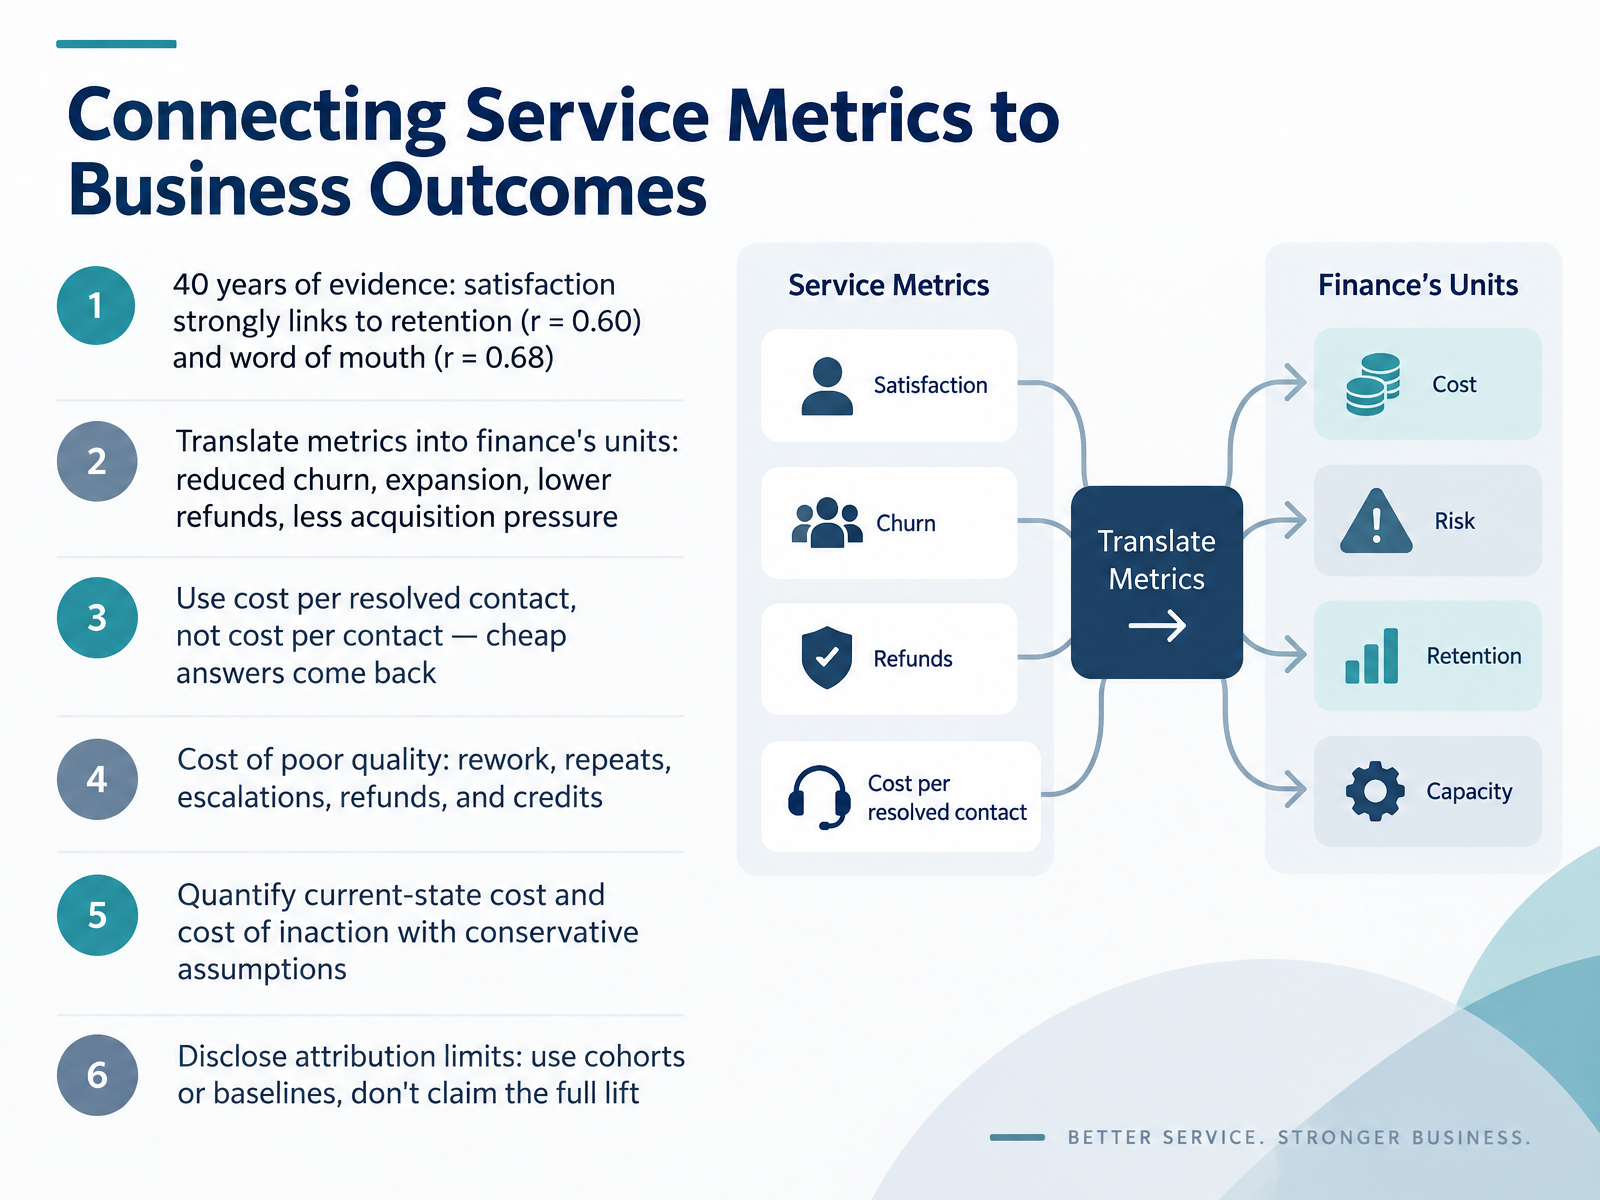
- 05Connecting Service Metrics to Business OutcomesLet's talk about connecting service metrics to business outcomes. Forty years of evidence shows satisfaction links strongly to retention and word of mouth. In one meta-analysis, satisfaction correlated with retention at point six zero, and word of mouth at point six eight. That's a real, durable signal, not a soft score. So translate your metrics into finance's units. Reduced churn. Expansion. Lower refunds. Less acquisition pressure. And here's a critical distinction. Track cost per resolved contact, not cost per contact. Cheap answers come back as repeats, and you pay twice. Account for the cost of poor quality too. Rework, repeated contacts, escalations, refunds, and credits. Quantify your current-state cost, and the cost of inaction, using conservative assumptions. Then disclose attribution limits. Use cohorts or baselines. Don't claim the full lift. If retention improves two points, say how much of that you can reasonably defend. Turning Service Data into a Compelling Narrative.
 pubsonline.informs.orglink.springer.comtei.forrester.com+22 min
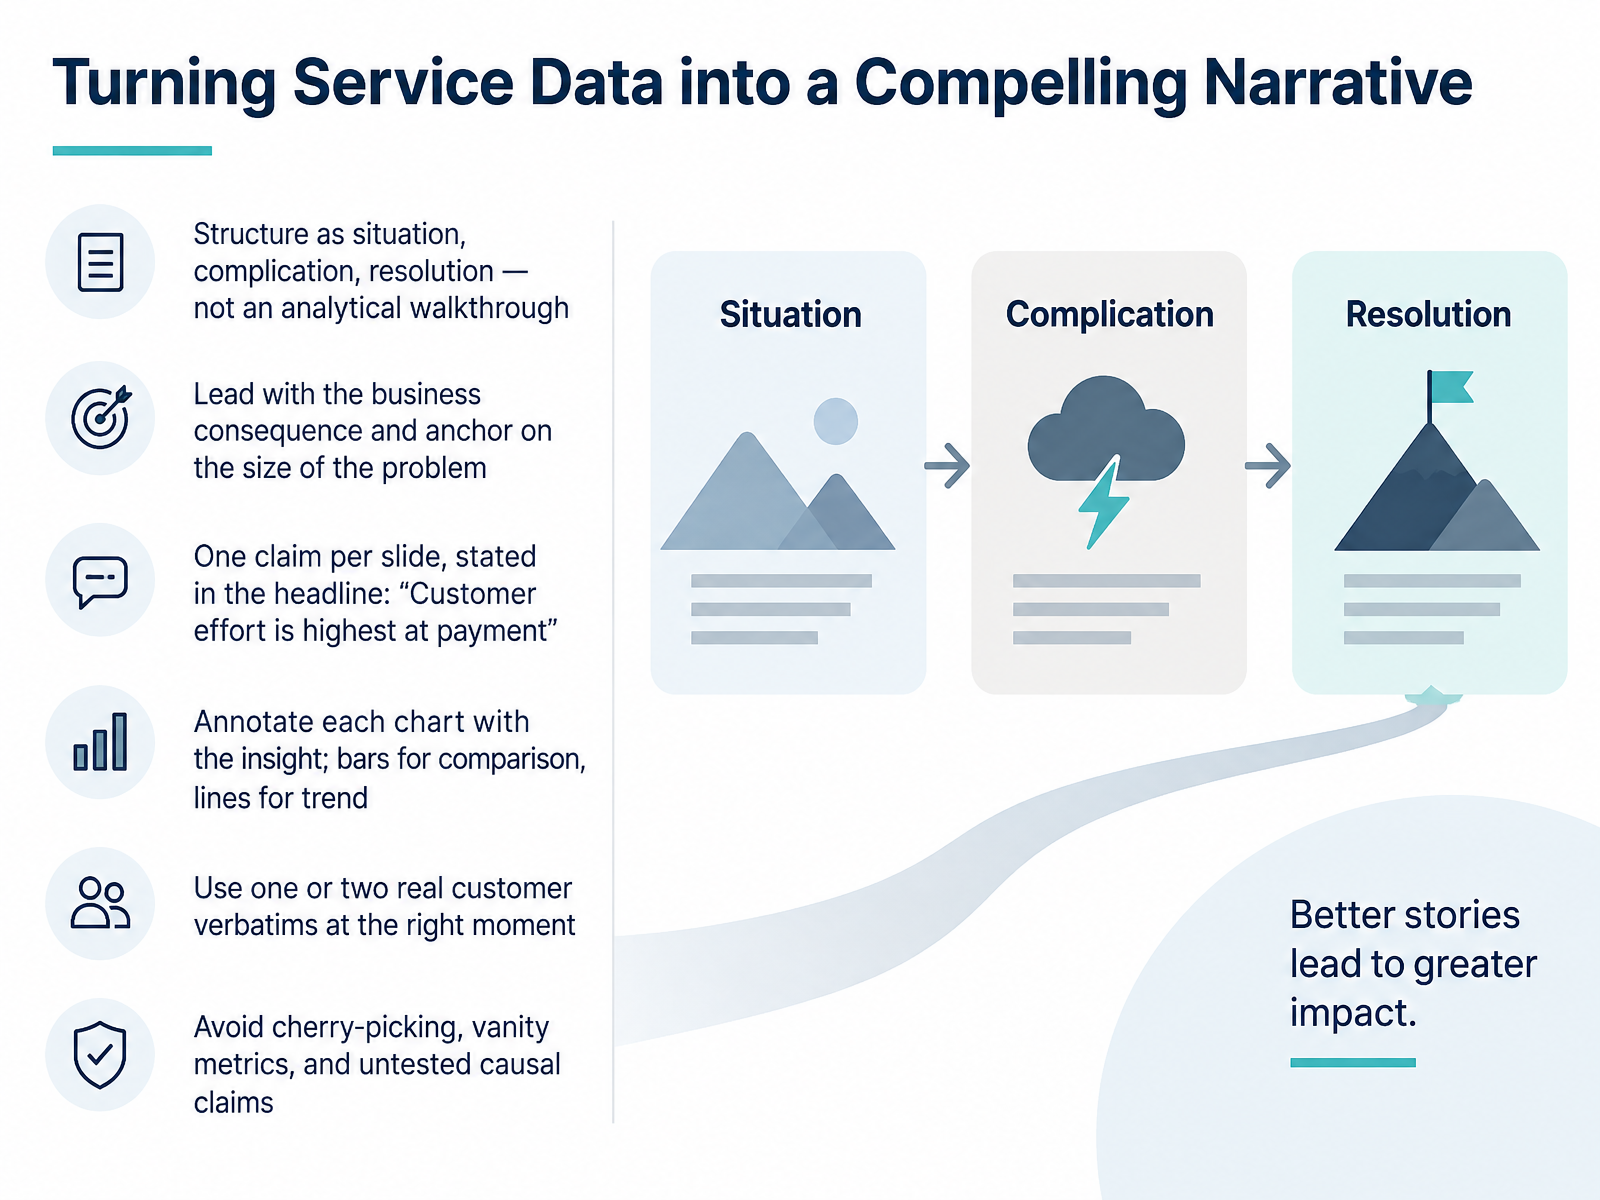
- 06Turning Service Data into a Compelling NarrativeLet's talk about turning service data into a compelling narrative. The biggest mistake is walking executives through your analysis step by step. Instead, structure it as situation, complication, resolution. Lead with the business consequence and anchor on the size of the problem. And keep one claim per slide, stated right in the headline. For example, customer effort is highest at payment is a claim. Payment experience is just a label. Annotate every chart with the insight, not the metric name. Use bars for comparison, lines for trend. One or two real customer verbatims at the right moment will do more emotional work than three slides of aggregated scores. Finally, avoid cherry-picking, vanity metrics, and untested causal claims. Your credibility depends on it. Next, let's look at framing improvement proposals and trade-offs.
 blog.contactcenterpipeline.comrenascence.iocustomercontactmindxchange.com+21 min
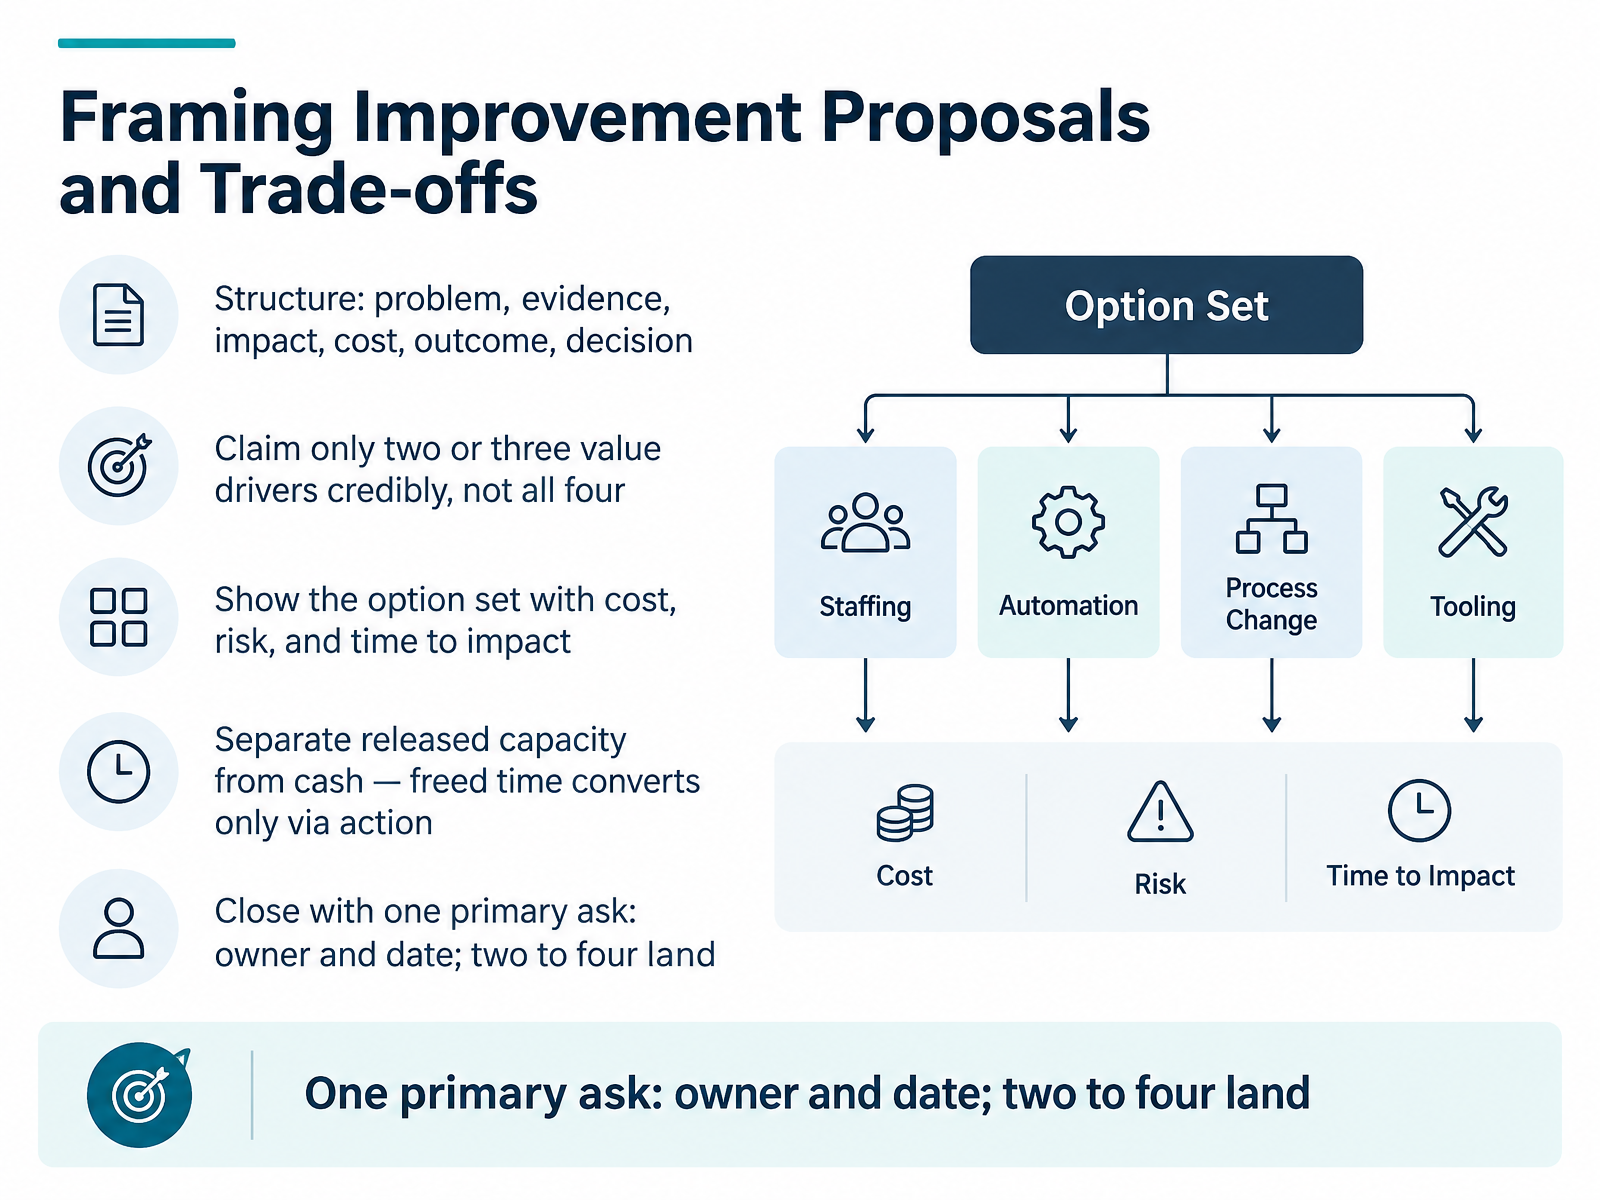
- 07Framing Improvement Proposals and Trade-offsLet's talk about framing improvement proposals and trade-offs. Executives don't reject good ideas. They reject ideas they can't price. So structure the case in one order: problem, evidence, impact, cost, outcome, and the decision you need. Evidence means your own numbers, not benchmark slides. Now, a discipline that separates credible leaders from enthusiastic ones. Claim two or three value drivers well. Reduced churn, avoided repeat contacts, or retired spend are defensible. Claim all four and the room stops believing the first one. Next, show the option set with cost, risk, and time to impact side by side. And keep one distinction clean: released capacity is not cash. Freed agent time converts only through a capacity action you commit to. Until someone acts on it, it's worth nothing in the case. Then close with one primary ask, with an owner and a date. Two to four asks land. Fifteen signal you haven't prioritized. Next, we'll look at running the Quarterly Business Review with executives.
 kaizo.comoversai.comclickpost.ai+22 min
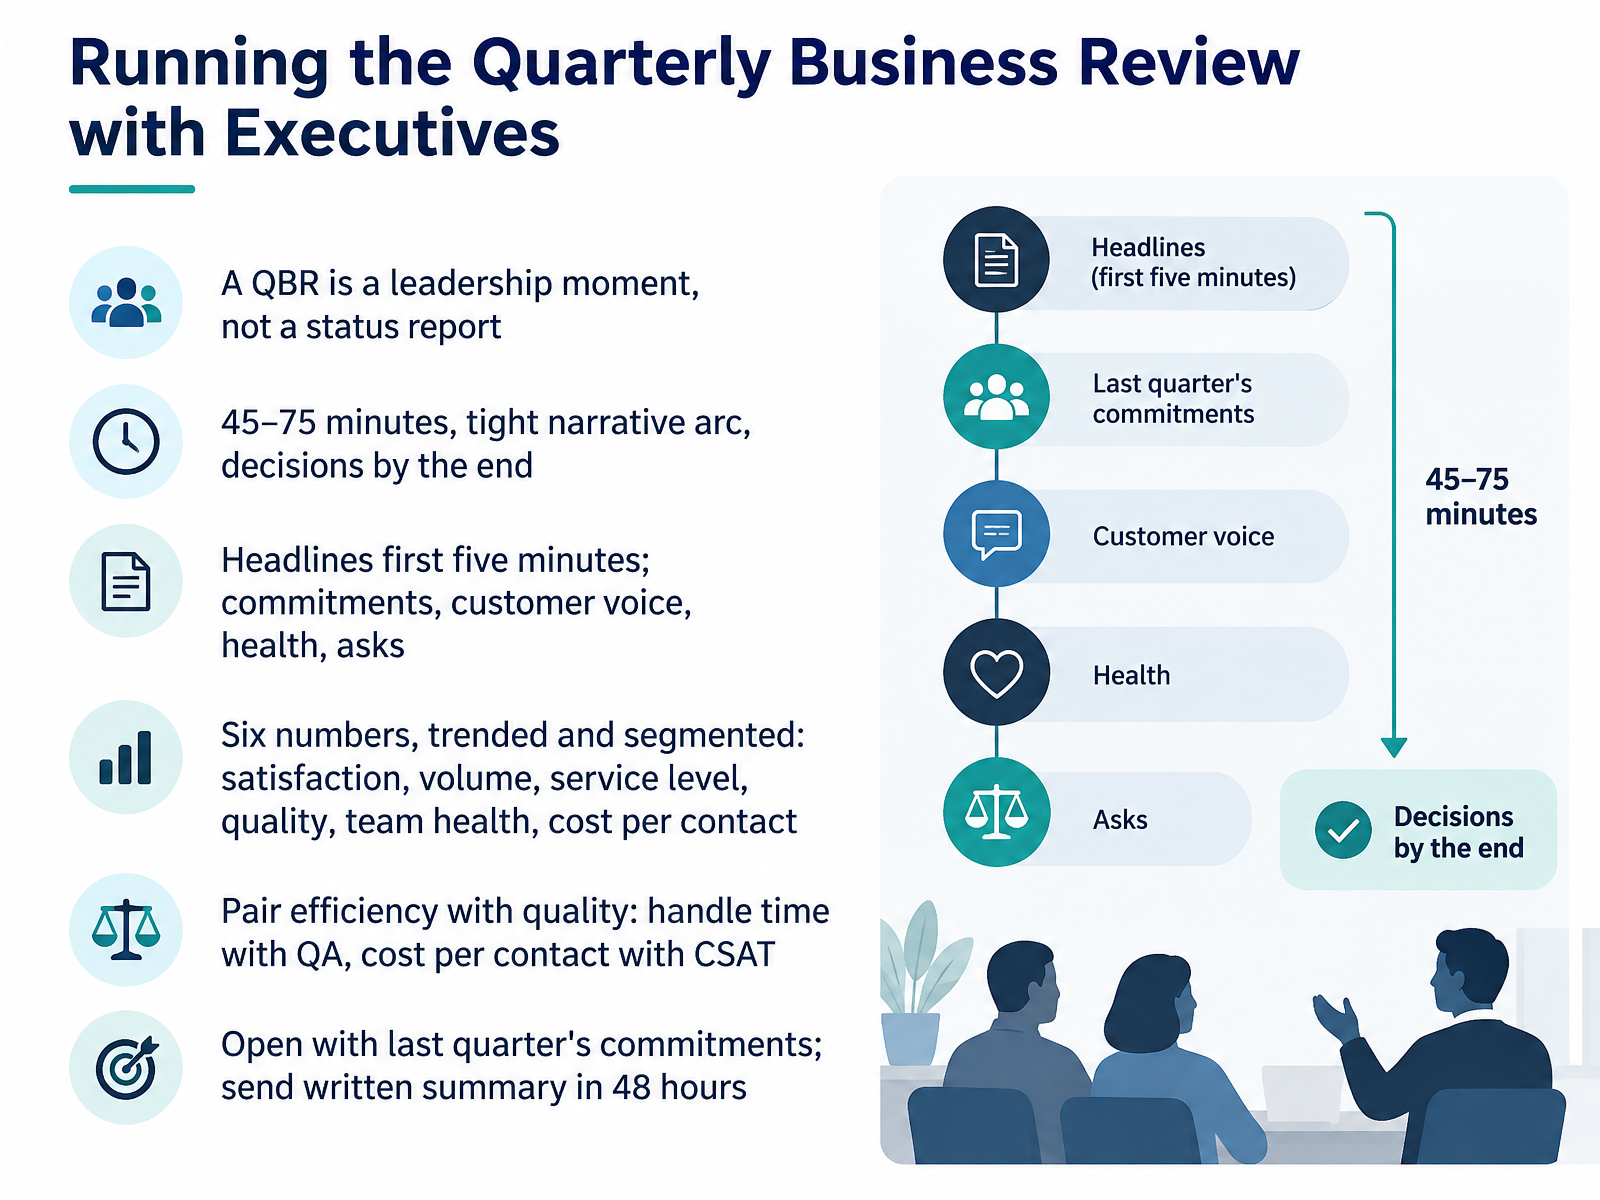
- 08Running the Quarterly Business Review with ExecutivesNow let's talk about the Quarterly Business Review with executives. A QBR is a leadership moment, not a status report. You have forty-five to seventy-five minutes. Use a tight narrative arc, and make sure you leave the room with decisions, not just discussion. Spend the first five minutes on headlines: what went well, what broke, and what customers are telling you. Executives get pulled away, so front-load the important content. Then bring six numbers, trended and segmented: customer satisfaction, contact volume, service level, quality scores, team health, and cost per contact. Six numbers tell a story. Forty numbers become noise. Here's the discipline that matters most: pair every efficiency metric with its quality guardrail on the same slide. Handle time next to QA score. Cost per contact next to customer satisfaction. Faster and cheaper only counts as a win if the work still held. Open by reporting on last quarter's commitments, and send a written summary within forty-eight hours, with decisions, owners, and dates. That follow-through is what builds credibility quarter over quarter. Next, let's look at adapting messages across formats and channels.
 kaizo.comoversai.comclickpost.ai+22 min
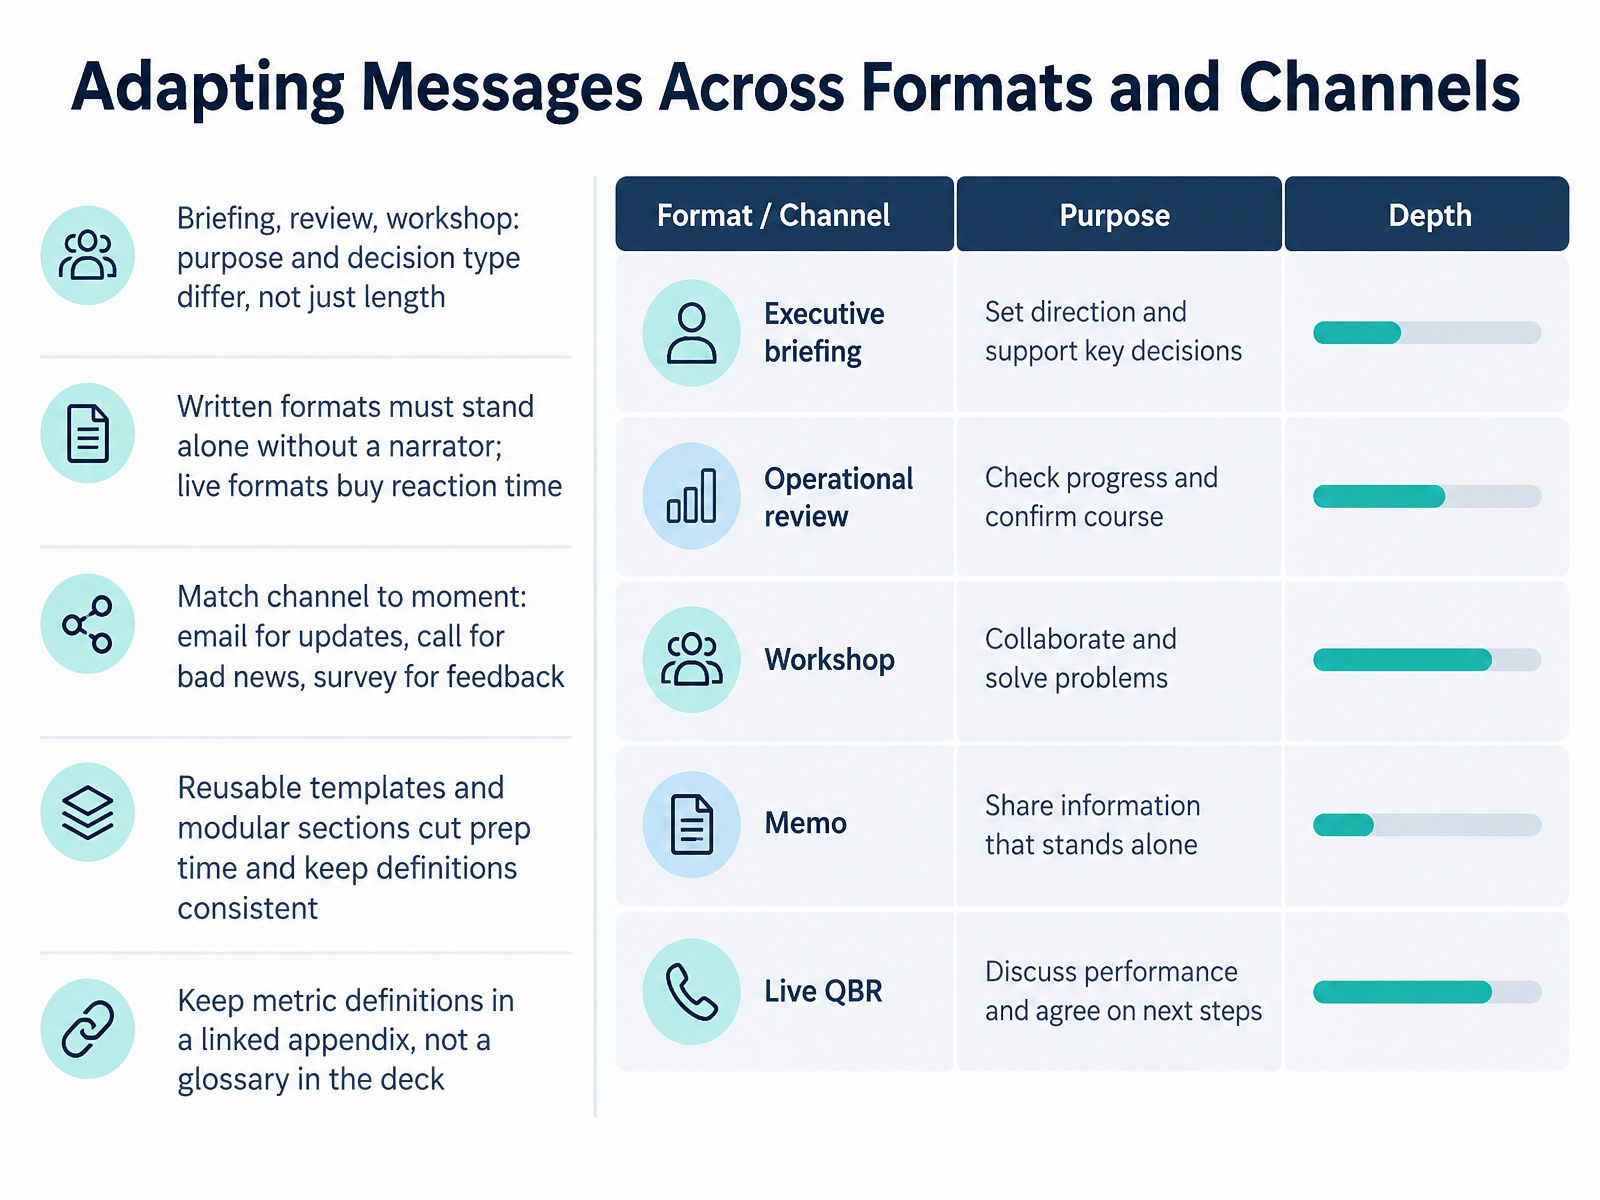
- 09Adapting Messages Across Formats and ChannelsNow let's talk about adapting the same message across formats and channels. A briefing, a review, and a workshop are not the same meeting with different lengths. The purpose differs, and so does the decision type. Ask yourself what decision this room needs to make, then build the format around that. Written formats have to stand alone. There is no narrator to fill the gaps, so the reasoning must be on the page. Live formats buy you reaction time. You can read the room, pause, and adjust. Match the channel to the moment. Email works for routine updates. A phone call is right for bad news, because it needs a reaction in the room. A survey gathers structured feedback, it does not deliver it. Here is the practical payoff. Reusable templates and modular sections cut your prep time and keep definitions consistent across every audience. And keep metric definitions in a linked appendix, not a glossary buried in the deck. Your executives should never be decoding internal scoring while you are talking. Match the message, match the channel, and the decision gets easier to make. Next, we move into handling difficult conversations and sensitive service issues.
 kaizo.comoversai.comclickpost.ai+22 min
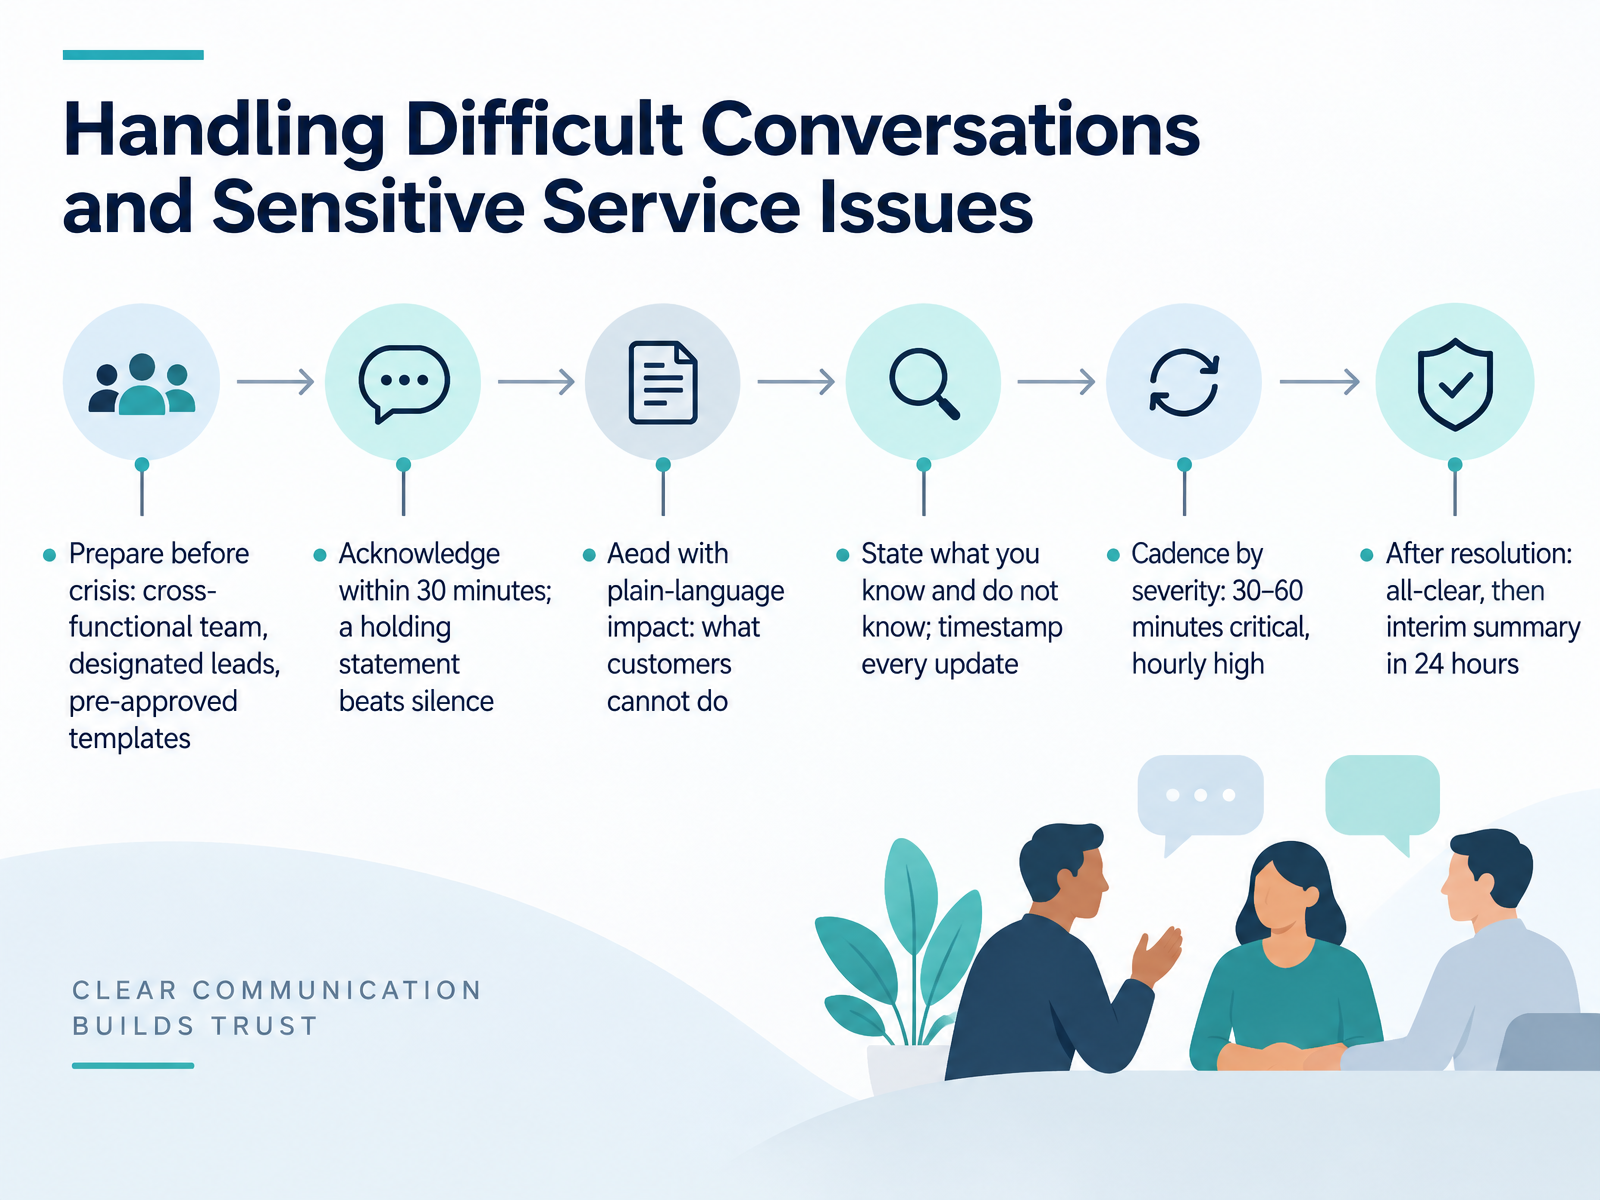
- 10Handling Difficult Conversations and Sensitive Service IssuesLet's talk about handling difficult conversations and sensitive service issues. When something breaks, your communication matters as much as your technical fix. So prepare before a crisis hits. Build a cross-functional team, name your leads, and pre-approve your templates. Then, acknowledge within thirty minutes. A short holding statement beats silence every time. Lead with plain-language impact. Tell customers what they cannot do right now, not which service is degraded. State what you know and what you do not know, and timestamp every update so people can trust the timeline. On cadence, match the drumbeat to severity. For critical issues, update every thirty to sixty minutes. For high-priority issues, hourly. After resolution, send an all-clear, then an interim summary within twenty-four hours. That close-out is where trust gets rebuilt. Next, we will look at influencing without authority and building communication habits.
 2 min
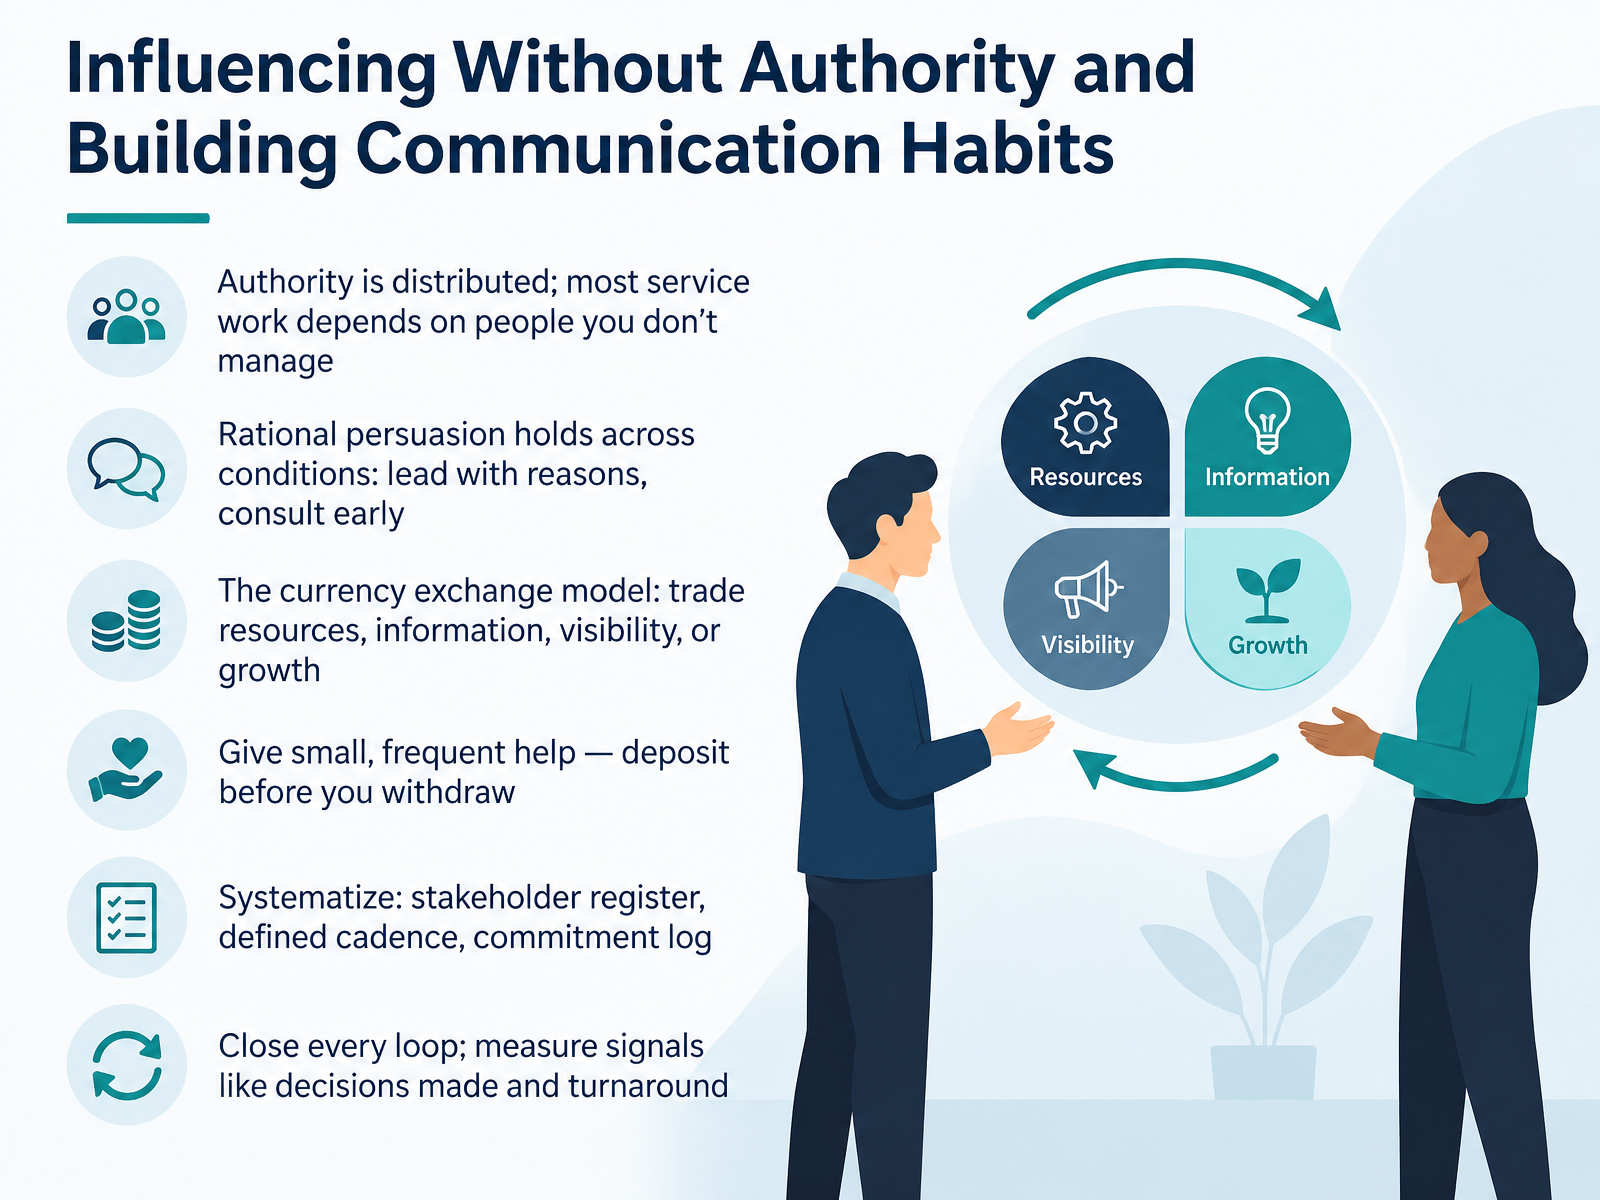
- 11Influencing Without Authority and Building Communication HabitsLet's talk about getting things done when you don't control the people you depend on. In service operations, most of your critical work runs across teams you don't manage. So influence has to come from credibility, not position. Rational persuasion holds up best: lead with reasons, and consult people early, while the plan can still change. Then there's the currency exchange model. Trade what others actually value, whether that's resources, information, visibility, or growth. And deposit before you withdraw. Give small, frequent help long before you need a favor. Systematize it, too. Keep a stakeholder register, a defined communication cadence, and a commitment log. Then close every loop. Measure the signals that matter: decisions made, turnaround time, and whether commitments actually land. Make influence a habit, not a rescue mission. Next, we'll put this into practice with a real scenario: presenting a satisfaction decline to the executive team.
 1 min
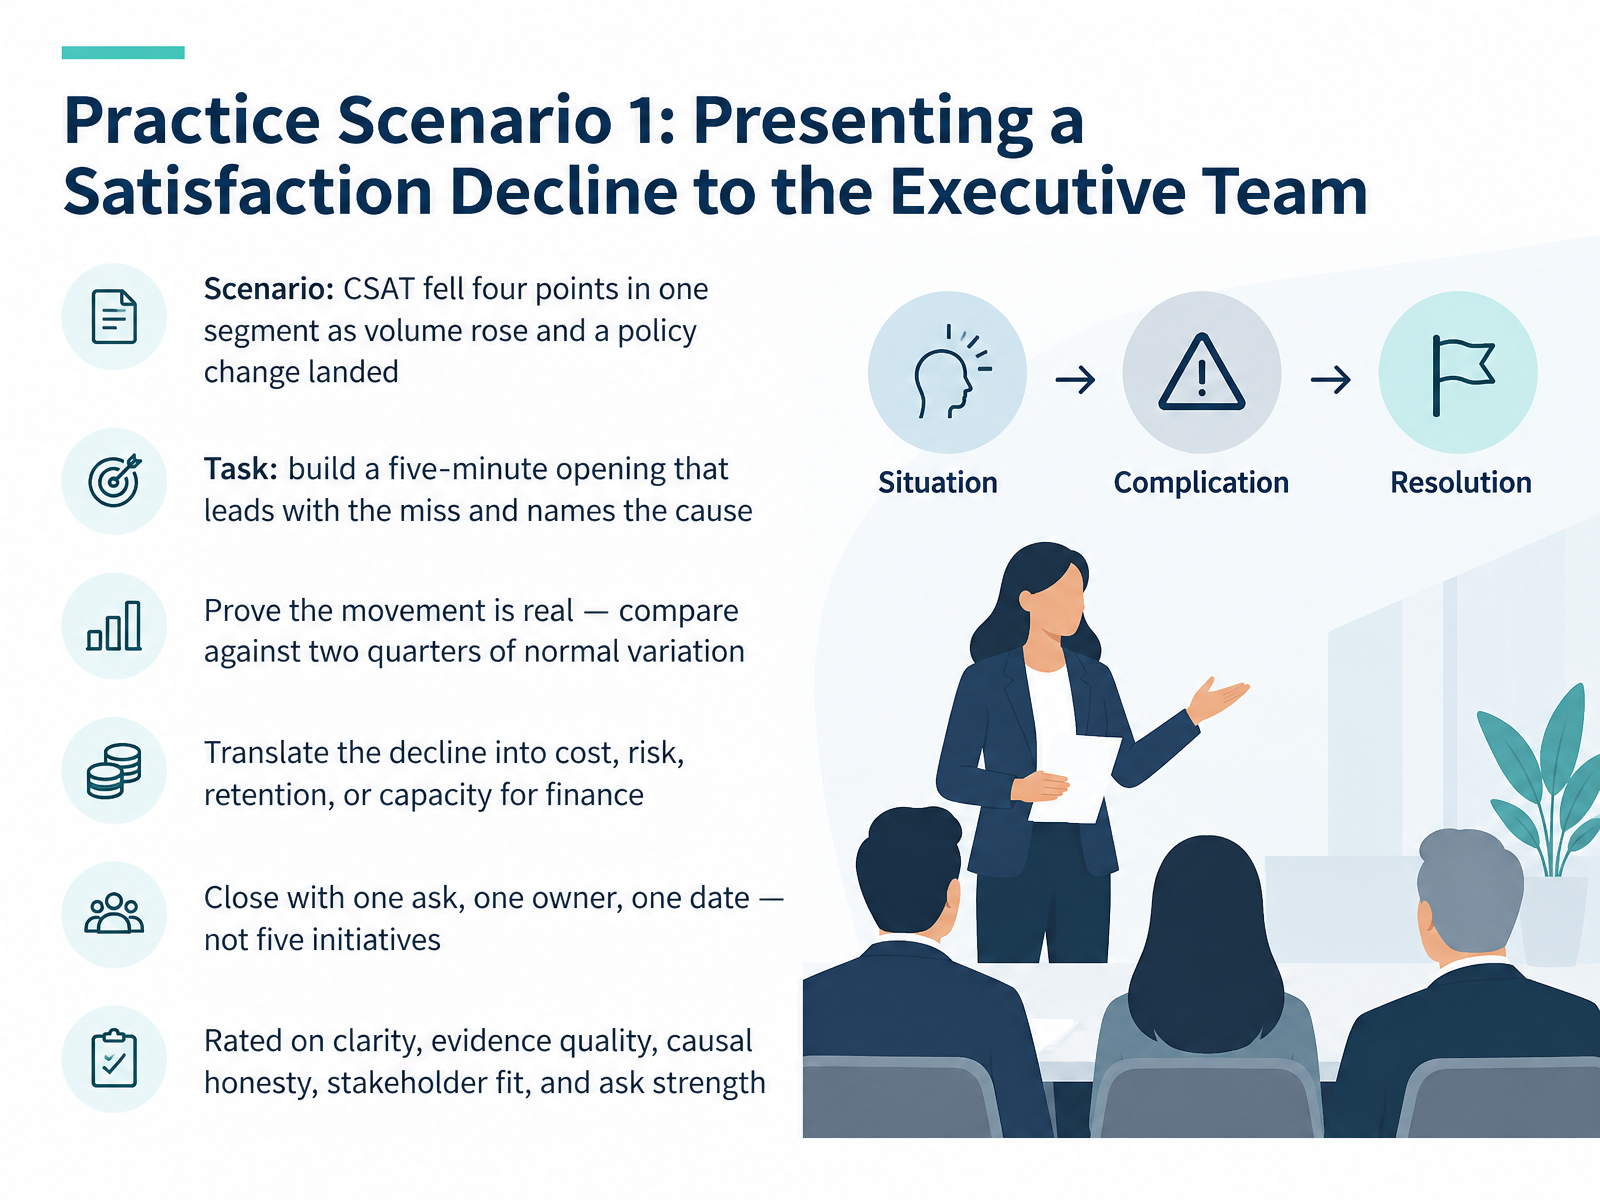
- 12Practice Scenario 1: Presenting a Satisfaction Decline to the Executive TeamLet's put that into practice with a scenario you will recognize. Satisfaction fell four points in one segment. Volume rose, and a policy change landed mid-quarter. Your task is a five-minute opening for the executive team, and the rule is simple. Lead with the miss, then name the cause. Do not restate the drop. Say what produced it, like a refund policy change on the ninth that agents applied the old way for three weeks. Next, prove the movement is real. Compare it against two quarters of normal variation. If it sits inside that band, call it stable and say why. Then translate. Four points means nothing to finance until you attach cost, risk, retention, or capacity, such as repeat contacts at your known cost per contact. Close with one ask, one owner, one date. A list of five initiatives reads as no decision made. You will be rated on clarity, evidence quality, causal honesty, stakeholder fit, and ask strength.
 kaizo.comoversai.comclickpost.ai+22 min
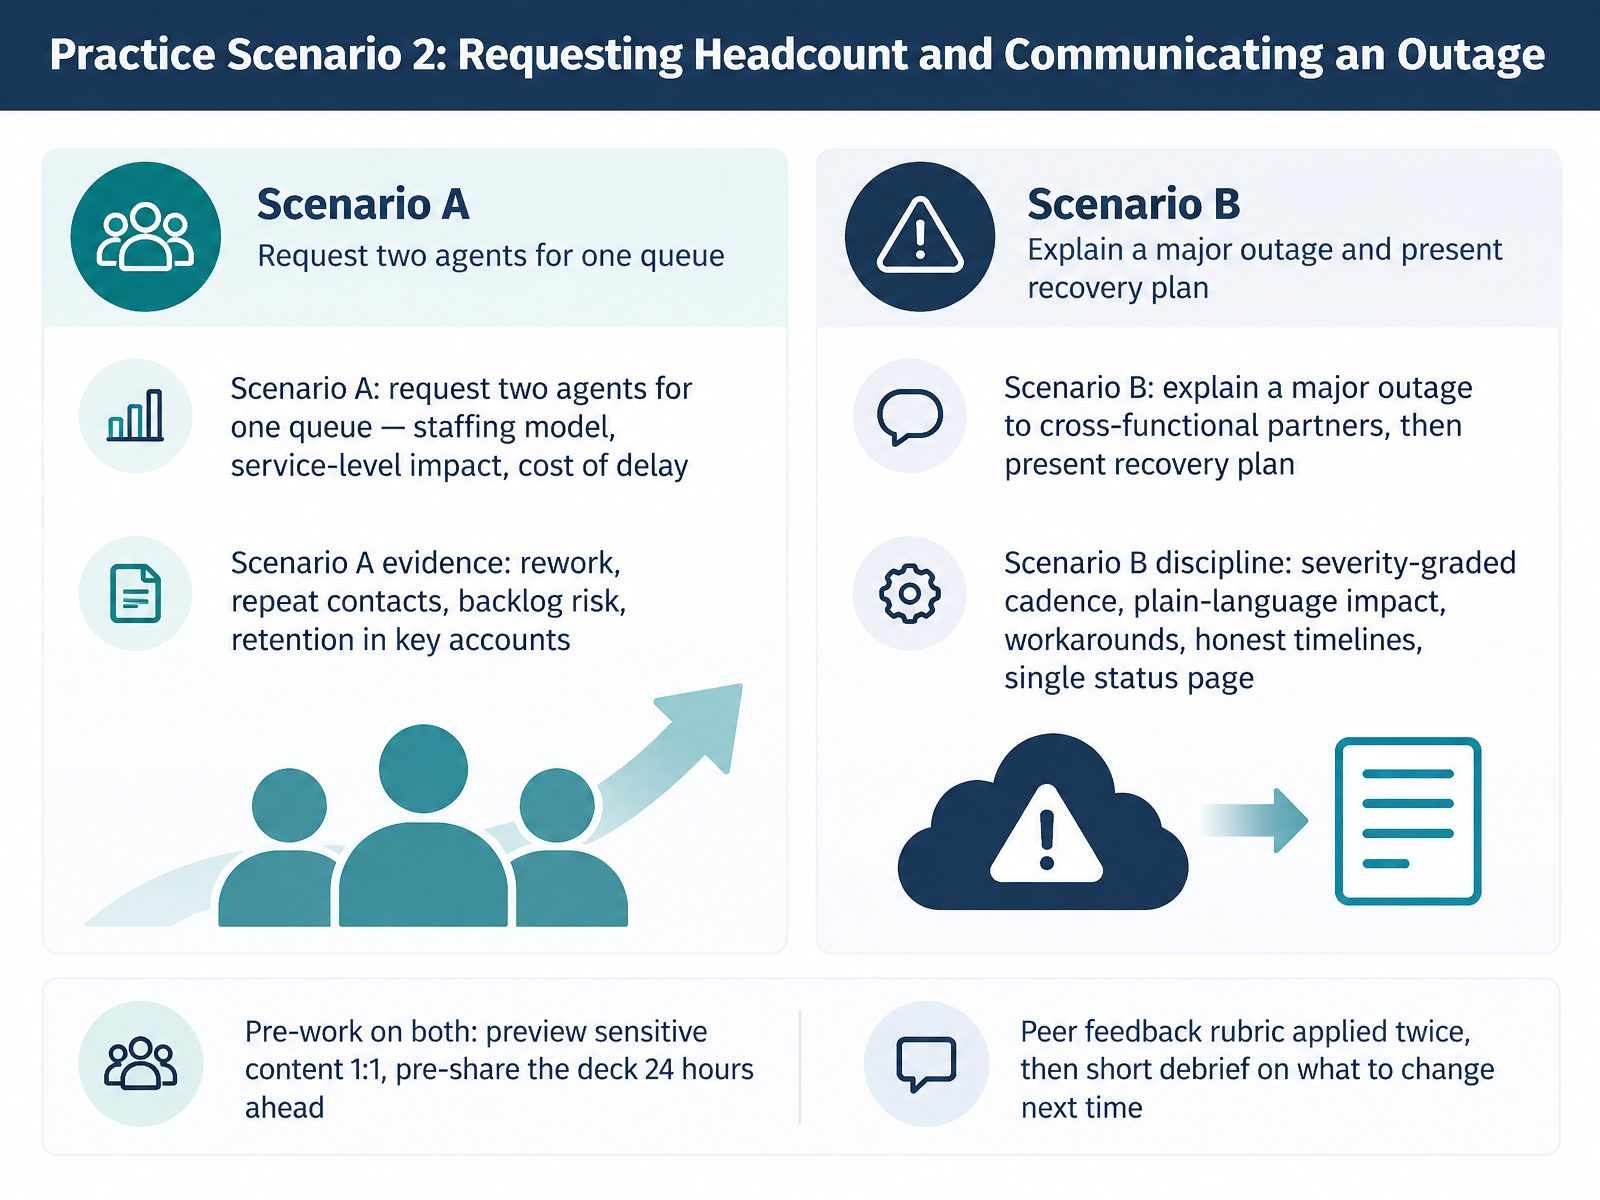
- 13Practice Scenario 2: Requesting Headcount and Communicating an OutageLet's put this into practice with two scenarios that come up constantly in service leadership. Scenario A: you're requesting two agents for one queue. Bring the staffing model, the service-level impact, and the cost of delay. Support it with evidence: rework, repeat contacts, backlog risk, and retention in key accounts. Scenario B: you're explaining a major outage to cross-functional partners, then presenting the recovery plan. The discipline here is a severity-graded update cadence, plain-language impact, clear workarounds, honest timelines, and one single status page. Every partner pulls from the same facts. For both scenarios, do the pre-work. Preview sensitive content one-on-one before the room, and pre-share the deck twenty-four hours ahead so the meeting is a discussion, not a read-along. Then apply the peer feedback rubric twice, and finish with a short debrief on what you'll change next time. Preparation is what makes the ask land. Next, we'll build your personal communication plan and wrap up the course.
 1 min
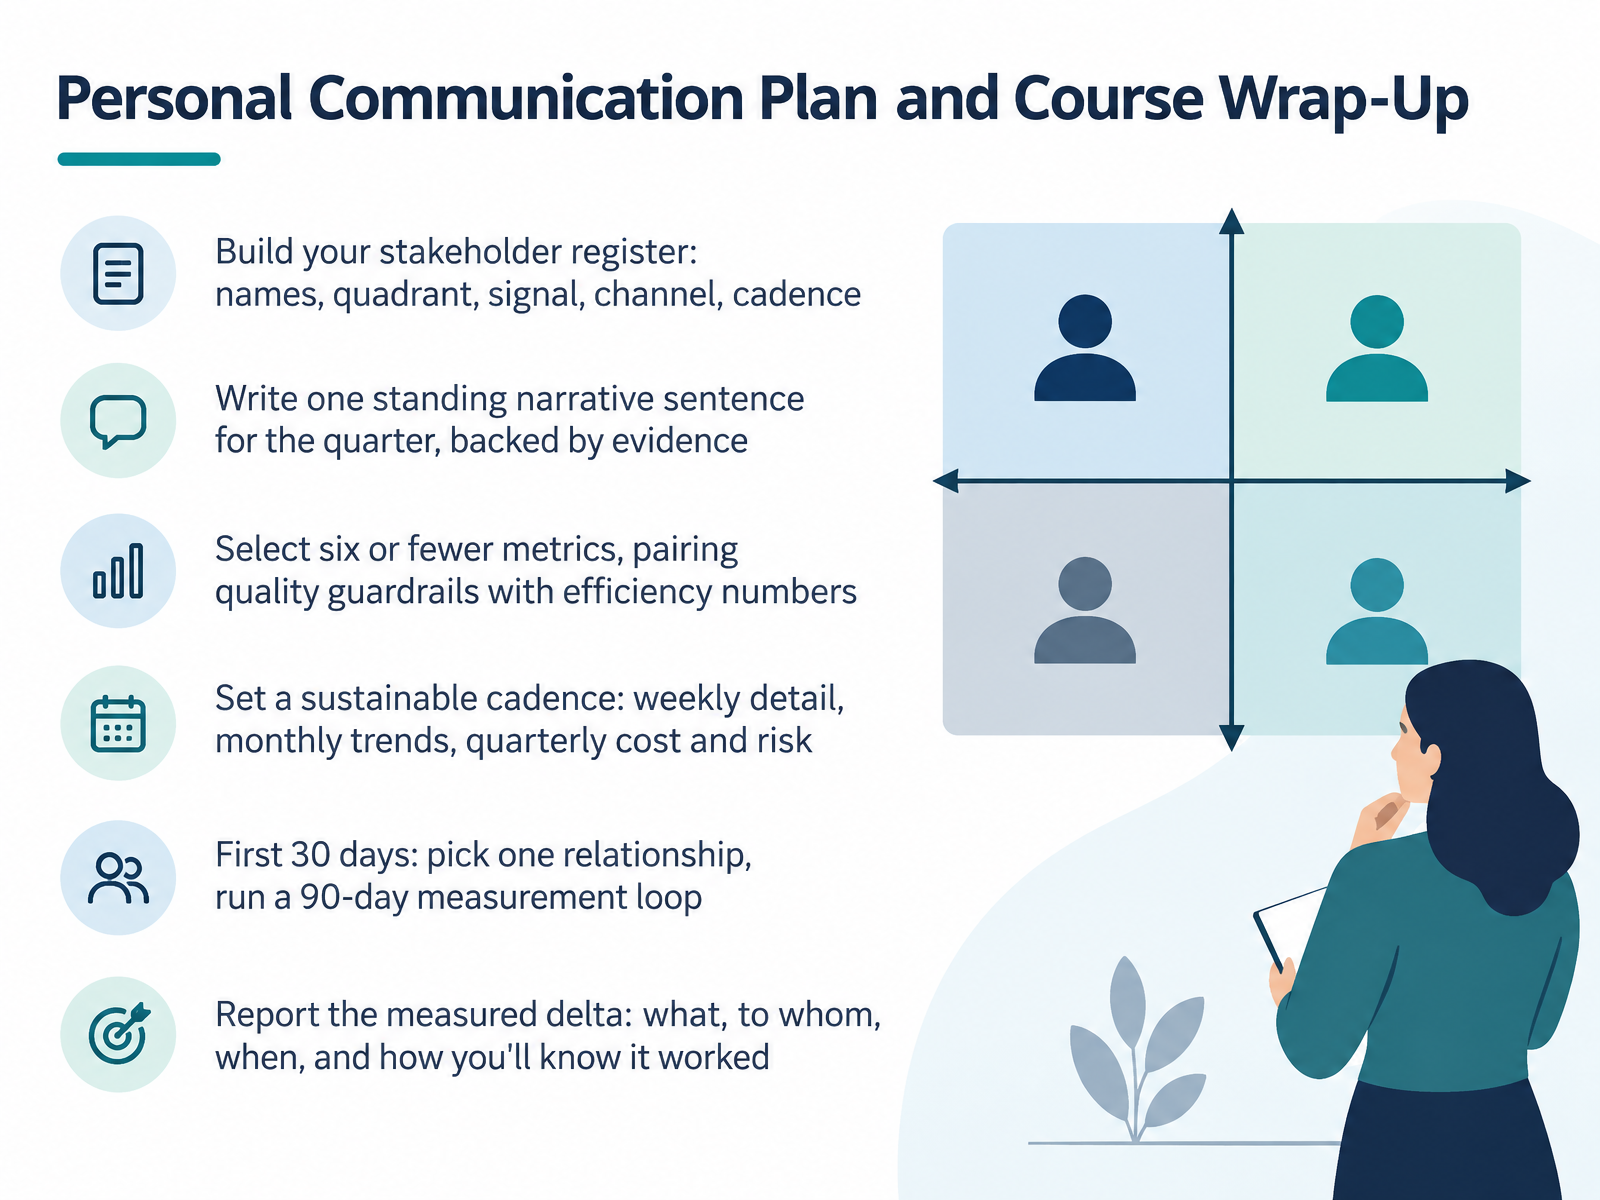
- 14Personal Communication Plan and Course Wrap-UpLet's close by turning everything we've covered into a plan you can actually run. Start with your stakeholder register. For each name, capture the quadrant, the signal they're listening for, the channel, and the cadence. Then write one standing narrative sentence for the quarter, backed by evidence. For example, faster first contact resolution reduced repeat contacts, which lowered cost to serve. Keep it to six metrics or fewer, and always pair a quality guardrail with an efficiency number, so speed never quietly costs you resolution. Set a sustainable cadence. Weekly detail for team leads, monthly trends for your VP, quarterly cost and risk for the executive team. In your first thirty days, pick one relationship and run a ninety-day measurement loop. Then report the measured delta. What changed, to whom, when, and how you'll know it worked. Before you go, pick your first relationship and your first metric today. Thank you for your time and attention. You have the evidence and the framework. Now go communicate it with confidence.
 en.ppt-online.orgpptdepot.commegantaylorwilliams.com+21 min
Take the deck with you
Download this course as a file — free, no sign-up needed.
- PDF handoutEvery slide page, ready to print or share.15 pages · 3.3 MBDownload
- Narrated PowerPointThe deck that presents itself — every slide carries the digital human's narration video.15 pages · 15.6 MBDownload
- PowerPoint slidesThe full deck as a .pptx — open it in PowerPoint, Keynote, or Google Slides.15 pages · 3.2 MBDownload
Free to use in your own training — please keep the PersonWise credit page at the end.
Have your own deck? Turn it into a course
Sources consulted
Web sources consulted while building this course.
- Customer Metrics and Their Impact on Financial Performance — pubsonline.informs.org
- Customer satisfaction, loyalty behaviors, and firm financial performance: what 40 years of research tells us — link.springer.com
- The Total Economic Impact™ Of Zendesk — tei.forrester.com
- The Total Economic Impact™ Of ServiceNow Customer Service Management — federalnewsnetwork.com
- Linking Customer Management Effort to Customer Profitability in Business Markets — journals.sagepub.com
- Customer Service Reporting for Executives: What to Show | Kaizo — kaizo.com
- VoC Executive Reporting Template for CX Leaders in 2026 | Oversai News — oversai.com
- 15 Customer Experience KPIs Every Ecommerce Brand Should Track — clickpost.ai
- CXO guide to measuring customer experience ROI in 2026 - chiefviews.com — chiefviews.com
- 12 Customer Service KPIs Every Service Team Should Measure | Salesforce — salesforce.com
- Quick Guide to Stakeholder Mapping - online presentation — en.ppt-online.org
- Stakeholder Mapping Framework PPT Slide Template | PPT Depot — pptdepot.com
- Stakeholder Mapping Presentation — megantaylorwilliams.com
- Stakeholder Mapping Roadmap Template for PowerPoint — ideaplan.io
- Solving User Problems Outside the Product Box - Agile 2023 — assets.swoogo.com
- Leading Customer-Centric Change: Use Storytelling Techniques to Gain Top-Level Support | Contact Center Pipeline Blog — blog.contactcenterpipeline.com
- CX Management Presentation That Lands | Renascence — Renascence — renascence.io
- Master the Art of Executive Storytelling: From Analytics to Influence — customercontactmindxchange.com
- Elevate Your Insights Org with C-Suite Level Reporting and Storytelling — quirks.com
- Data Storytelling for Execs: How to Communicate Analytics Clearly — valanor.co