Begin
14 pages · ~28 min
Reverse Engineering Software Workflow
This training guides engineers in selecting reverse engineering software, defining requirements, and applying an effective workflow.
A digital instructor presents all 14 pages. Hold “Ask” at any point and ask out loud — the answer comes from this course. No sign-up needed.
What you’ll learn
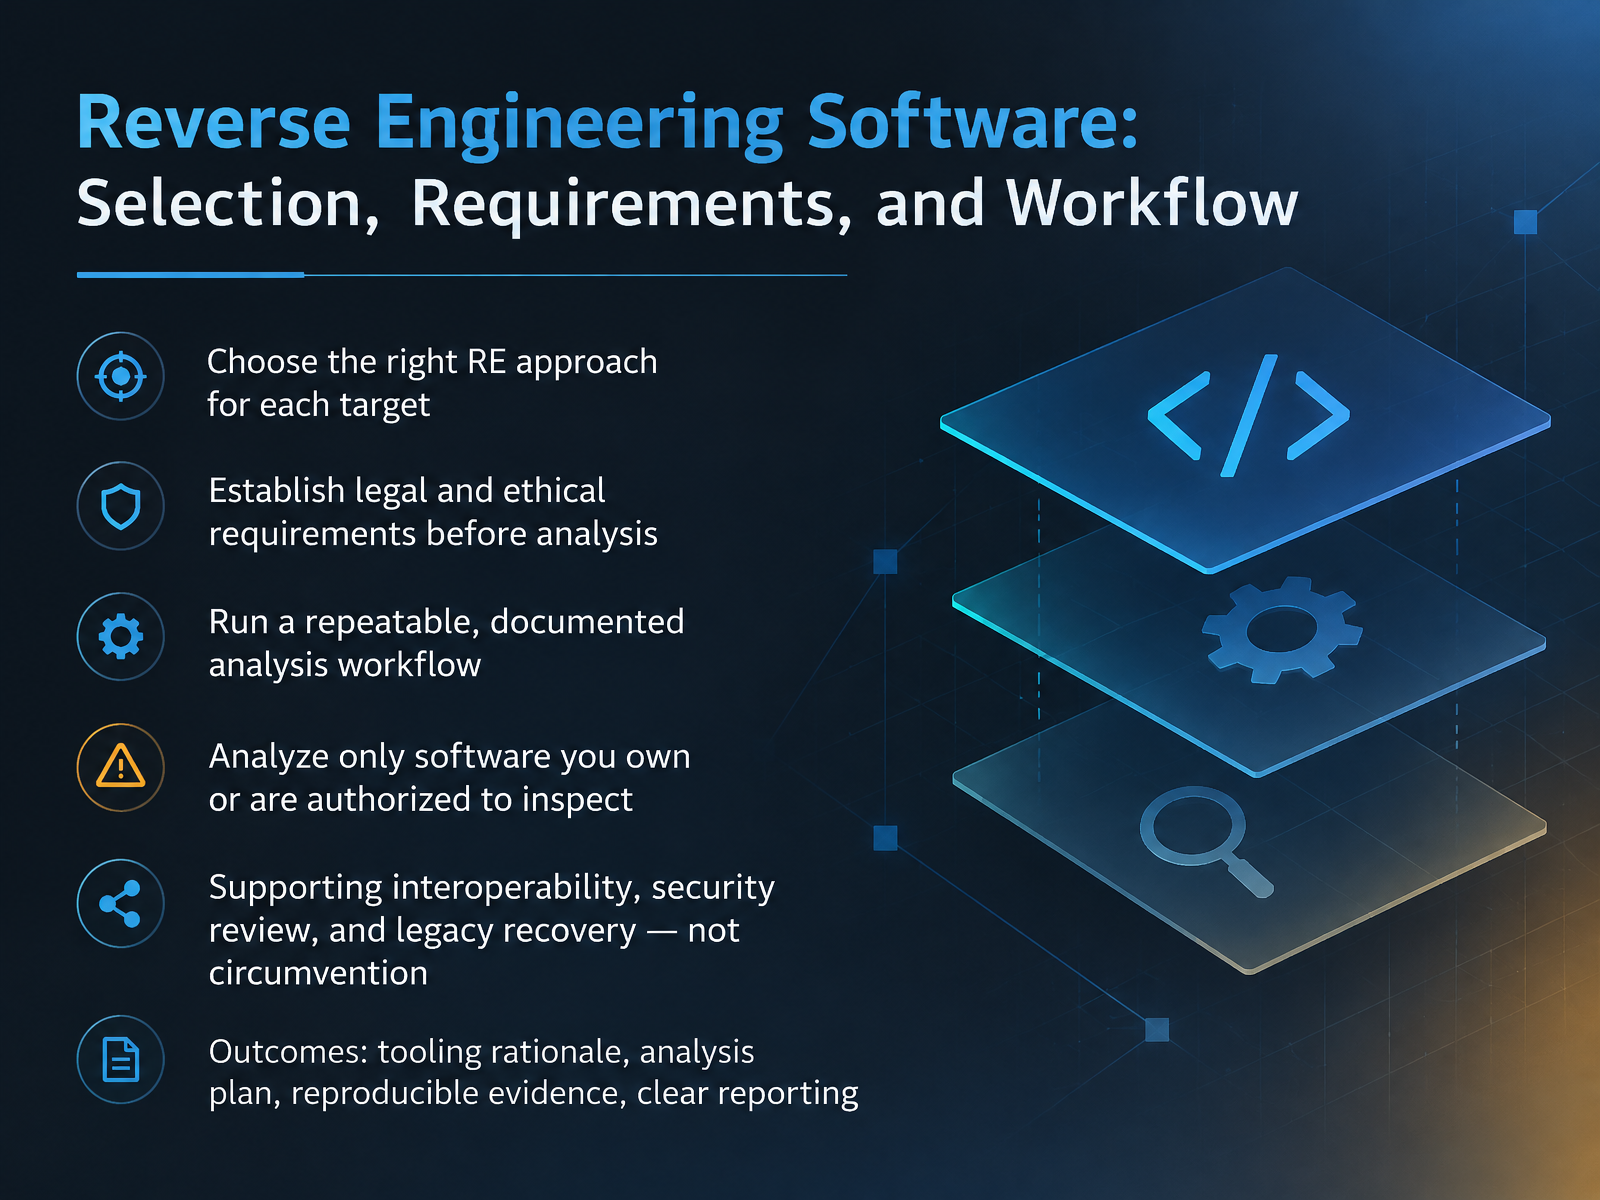
- 01Reverse Engineering Software: Selection, Requirements, and WorkflowWelcome. This course covers reverse engineering software, from tool selection through to a repeatable workflow. We will focus on analyzing programs you own or are authorized to inspect.
A few terms before we start. A disassembler turns a binary, the compiled executable, back into assembly instructions. A decompiler goes further and produces readable pseudo-code. A symbol is a named label left in the binary, like a function name, and a control-flow graph maps the possible paths execution can take through a function.
Across these slides, we build four things. First, choosing the right approach for each target. Second, settling legal and ethical requirements before any analysis begins. Authorized analysis means you have permission, or the law grants an exception, to study that specific program. Confirm that first. Third, running a documented, repeatable workflow. Fourth, producing clear evidence and reporting.
The goal is supporting interoperability, security review, and legacy recovery. Not circumvention.
Let's start with what reverse engineering is, and when it is legitimate.doi.orglaw.cornell.edutradecommissioner.gc.ca+22 min
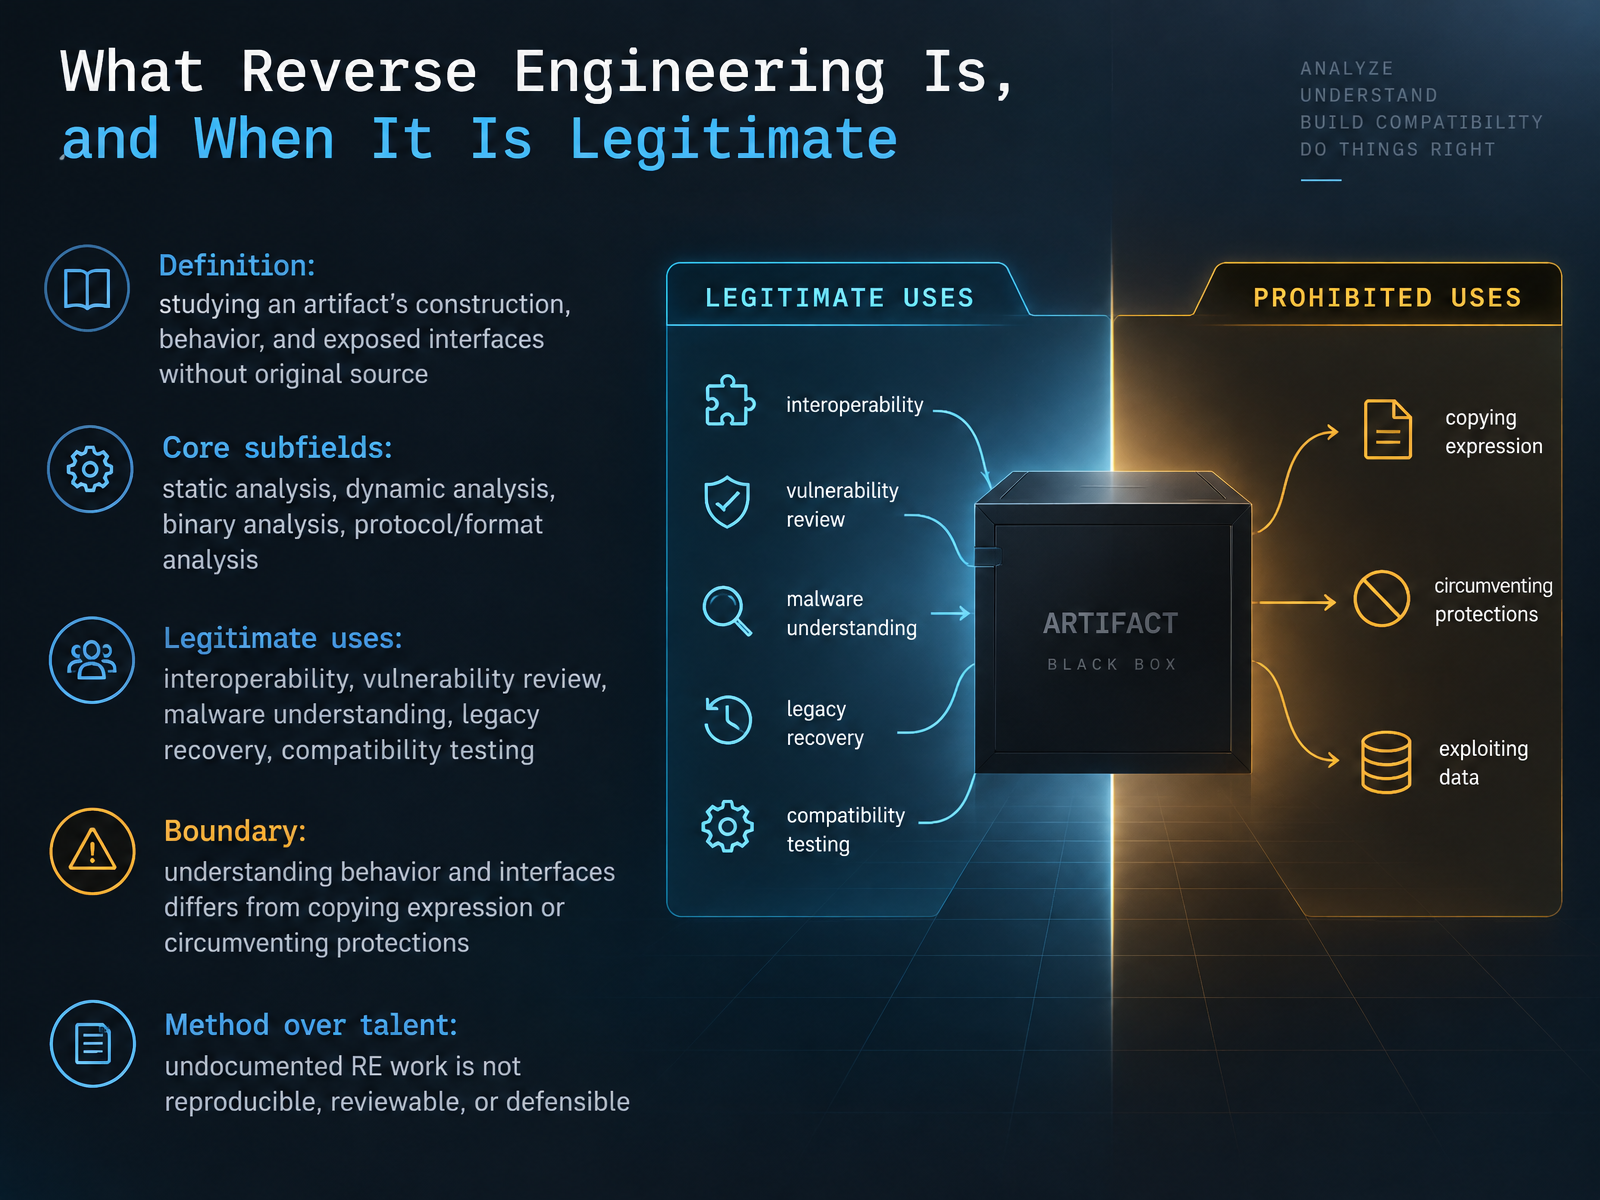
- 02What Reverse Engineering Is, and When It Is LegitimateSo, what does reverse engineering actually mean? It is studying an artifact's construction, behavior, and exposed interfaces without the original source. That breaks into subfields. Static analysis examines a binary, the compiled program, without running it. Dynamic analysis observes it while it executes. Binary analysis focuses on the compiled artifact itself, often using a disassembler to turn machine code back into assembly, or a decompiler to approximate source. Protocol and format analysis covers how data moves and is structured. Legitimate uses include interoperability, vulnerability review, malware understanding, legacy recovery, and compatibility testing. One boundary matters here. You are authorized to understand behavior and interfaces, not to copy protected expression or circumvent protections. Finally, treat method as more important than talent. Undocumented work is not reproducible, not reviewable, and not defensible. Next, we go to the background: from source code to machine code.
 doi.orglaw.cornell.edutradecommissioner.gc.ca+22 min
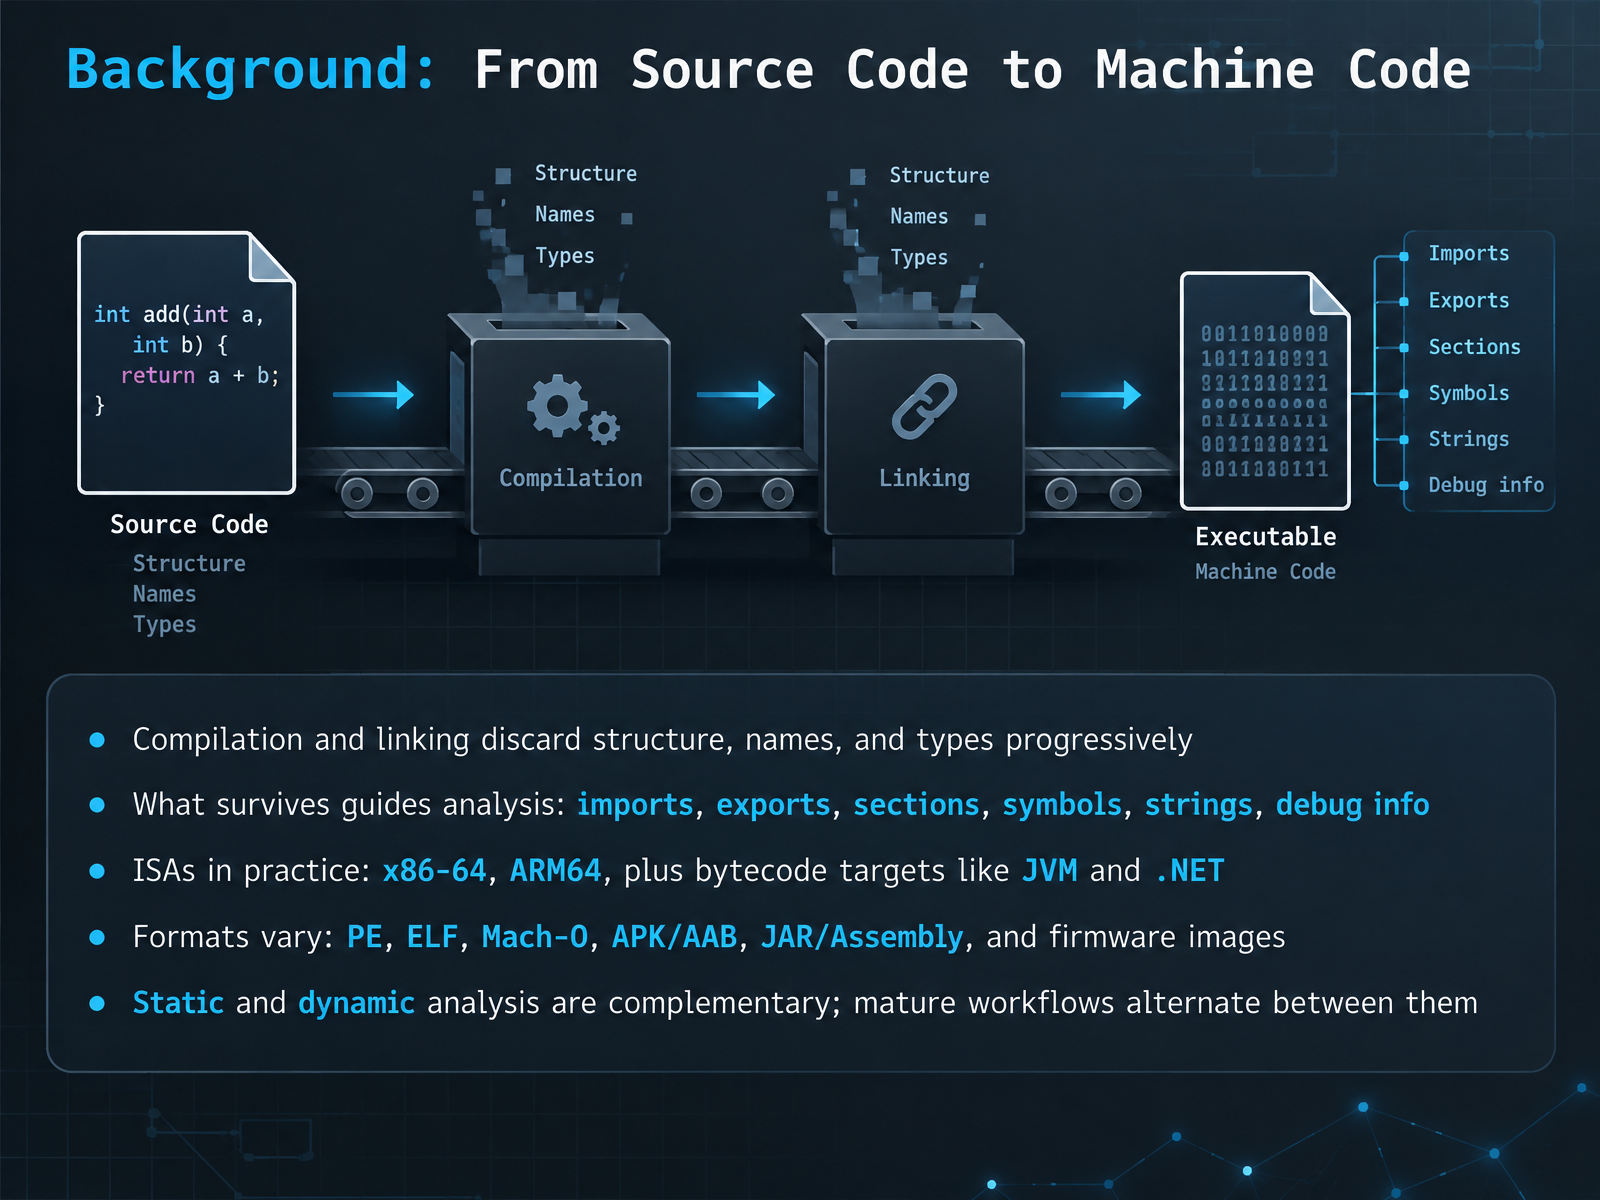
- 03Background: From Source Code to Machine CodeLet us look at what actually happens to your program before you ever see a binary. When you compile source, you get machine code for a specific instruction set architecture, or ISA. Think x86-64, ARM64, or bytecode targets like the JVM and .NET. Linking pulls in libraries and flattens everything into one artifact. Along the way, structure, names, and types are progressively discarded. What survives is your guide: imports, exports, sections, symbols, strings, and debug info. Symbols are names left in the binary that map addresses to functions or data. Debug info is optional metadata that preserves source-level details. File formats differ too. You will meet PE on Windows, ELF on Linux, Mach-O on Apple platforms, APK and AAB for Android, JAR files for Java, and raw firmware images. One important note: when analyzing, static and dynamic analysis are complementary. Static analysis reads the binary without running it. Dynamic analysis observes it while executing. Mature workflows alternate between the two. Next, we will cover levels of abstraction and core vocabulary.
 pypi.orgbinwalk.appbinwalk.sh+22 min
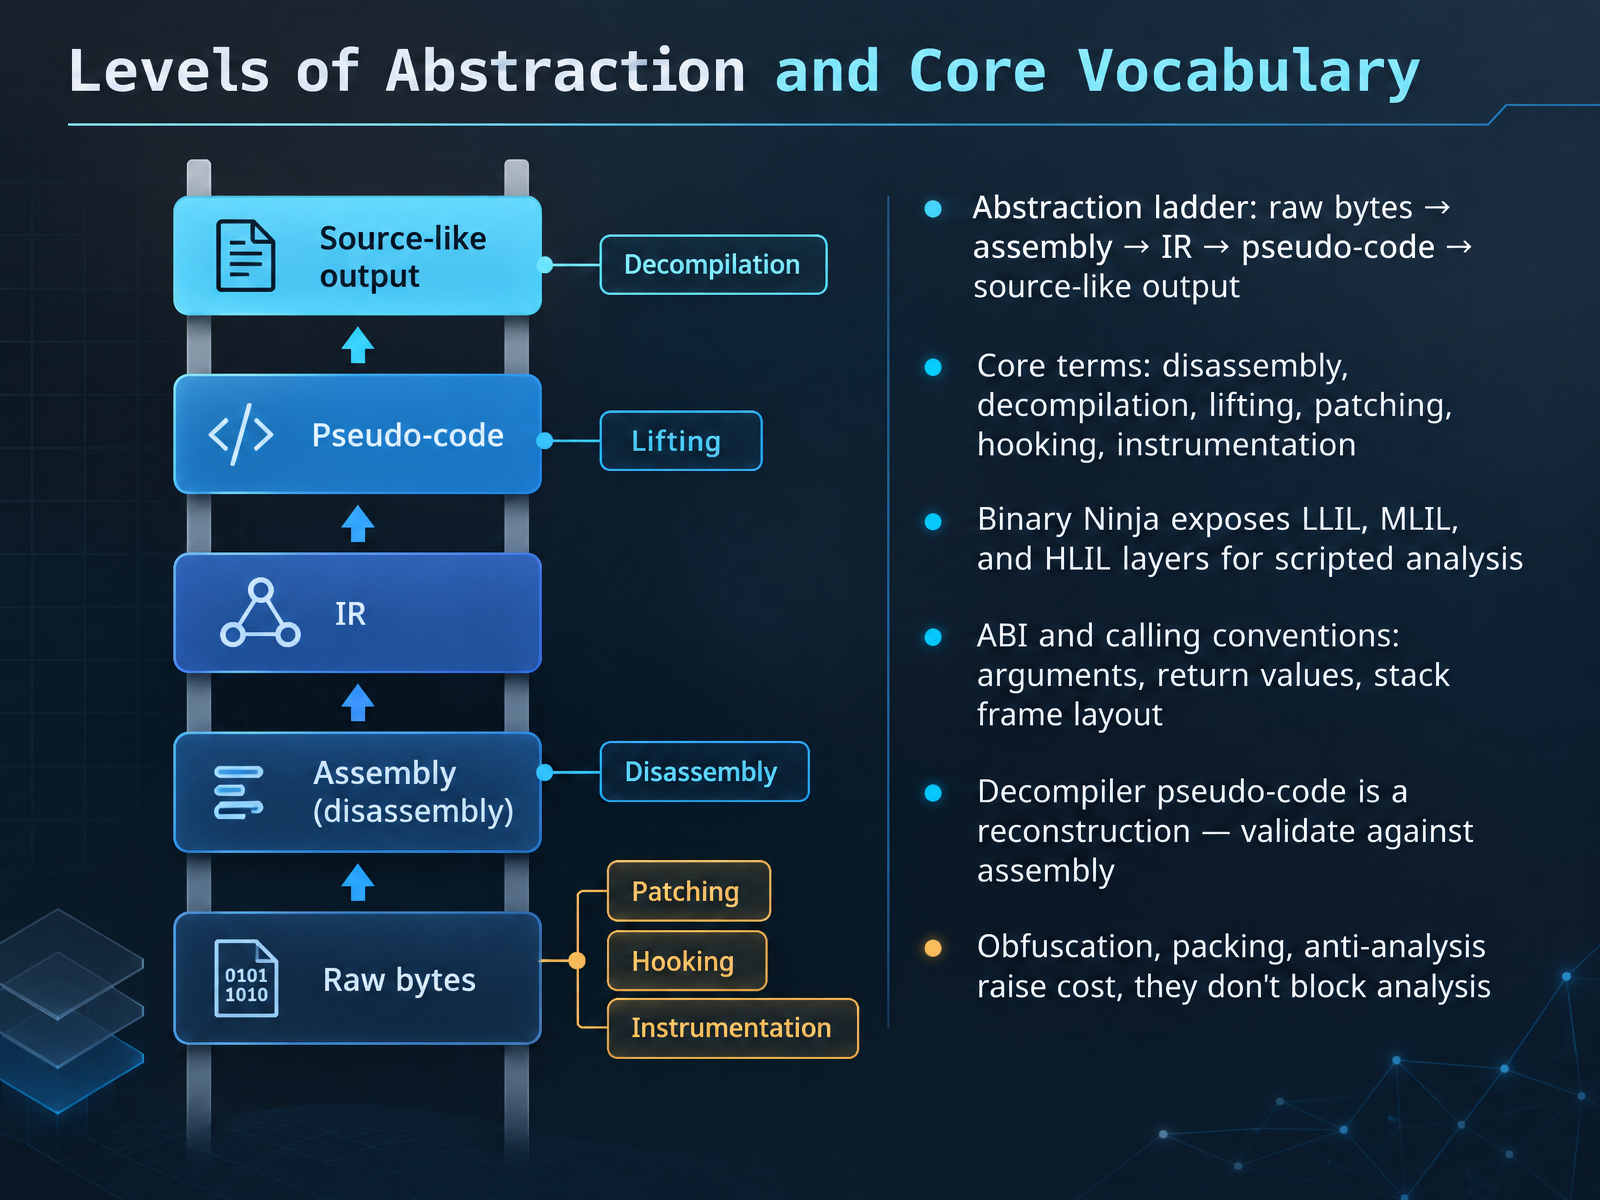
- 04Levels of Abstraction and Core VocabularyLet's talk about levels of abstraction and the core vocabulary you'll use. Think of an abstraction ladder: raw bytes at the bottom, then assembly, then an intermediate representation, then pseudo-code, then source-like output. A disassembler turns bytes into assembly. A decompiler goes further, producing pseudo-code that resembles C. Lifting raises machine instructions into an intermediate representation, or IR, which is a simplified model you can analyze. Because the decompiler reconstructs rather than recovers original code, validate its output against the assembly. Binary Ninja exposes three such layers: LLIL, MLIL, and HLIL, all scriptable through its API. You'll also meet ABI and calling conventions, which define how arguments and return values move and how the stack frame is laid out. Patching means editing a binary in place; hooking intercepts a call at runtime; instrumentation adds observation. And note: obfuscation, packing, and anti-analysis raise the cost of your work. They don't make analysis impossible. Define the Analysis Goal Before Choosing Tools.
 aidev.fittechyorker.comdeepresearch.ninja+21 min
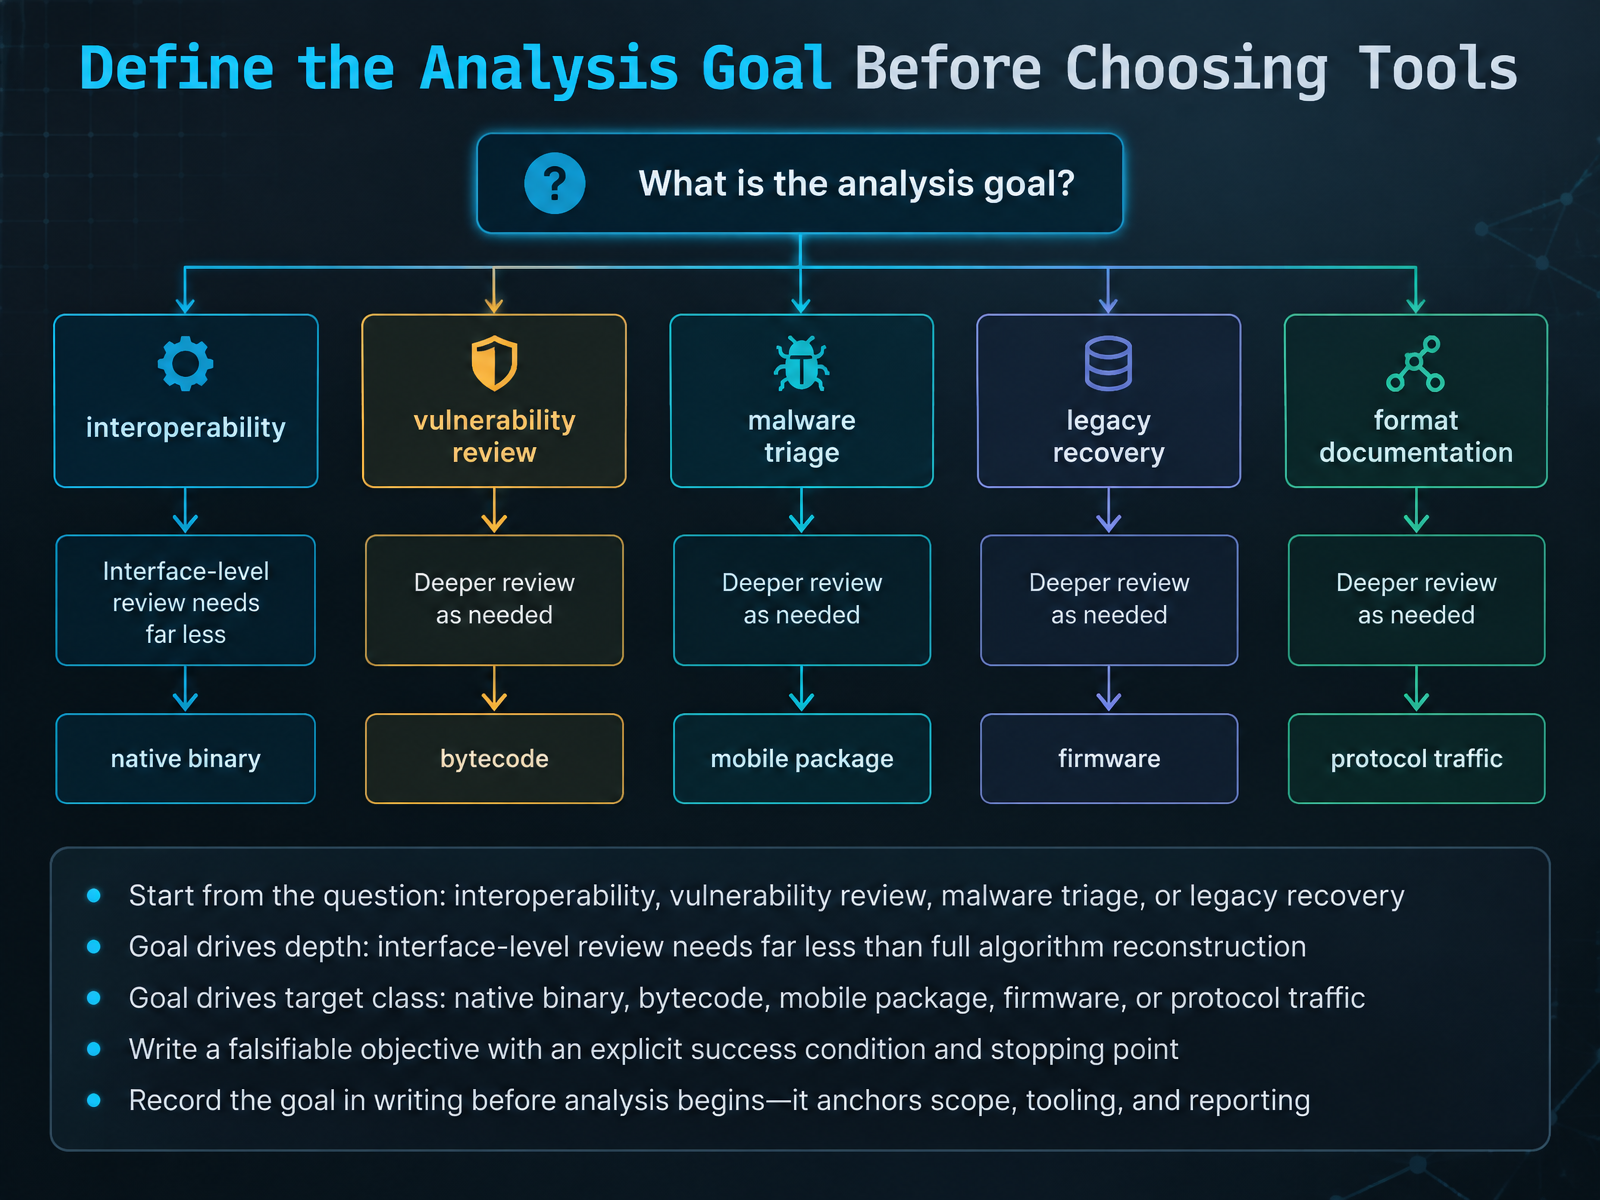
- 05Define the Analysis Goal Before Choosing ToolsBefore you open a disassembler or a decompiler, decide what question you are actually answering. A disassembler turns machine code back into assembly, and a decompiler lifts that assembly into C-like pseudocode. Powerful tools, but they do not choose your goal for you. Start with the question. Are you checking interoperability, reviewing a vulnerability, triaging suspected malware, or recovering a legacy system? The goal sets the depth. An interface-level review needs far less than full algorithm reconstruction. The goal also sets the target class. That could be a native binary, bytecode, a mobile package, firmware, or protocol traffic. Each one points toward a different toolchain. Next, write a falsifiable objective. State an explicit success condition and a stopping point, so you know when to stop digging. Then record the goal in writing before analysis begins. That anchors scope, tooling, and reporting. It also keeps you honest when curiosity pulls you down a rabbit hole. Next, we look at tool selection and matching platforms to the target.
 aidev.fittechyorker.comdeepresearch.ninja+22 min
- 06Tool Selection: Matching Platforms to the TargetLet's talk about tool selection, because matching tools to the target is where most wasted effort starts.
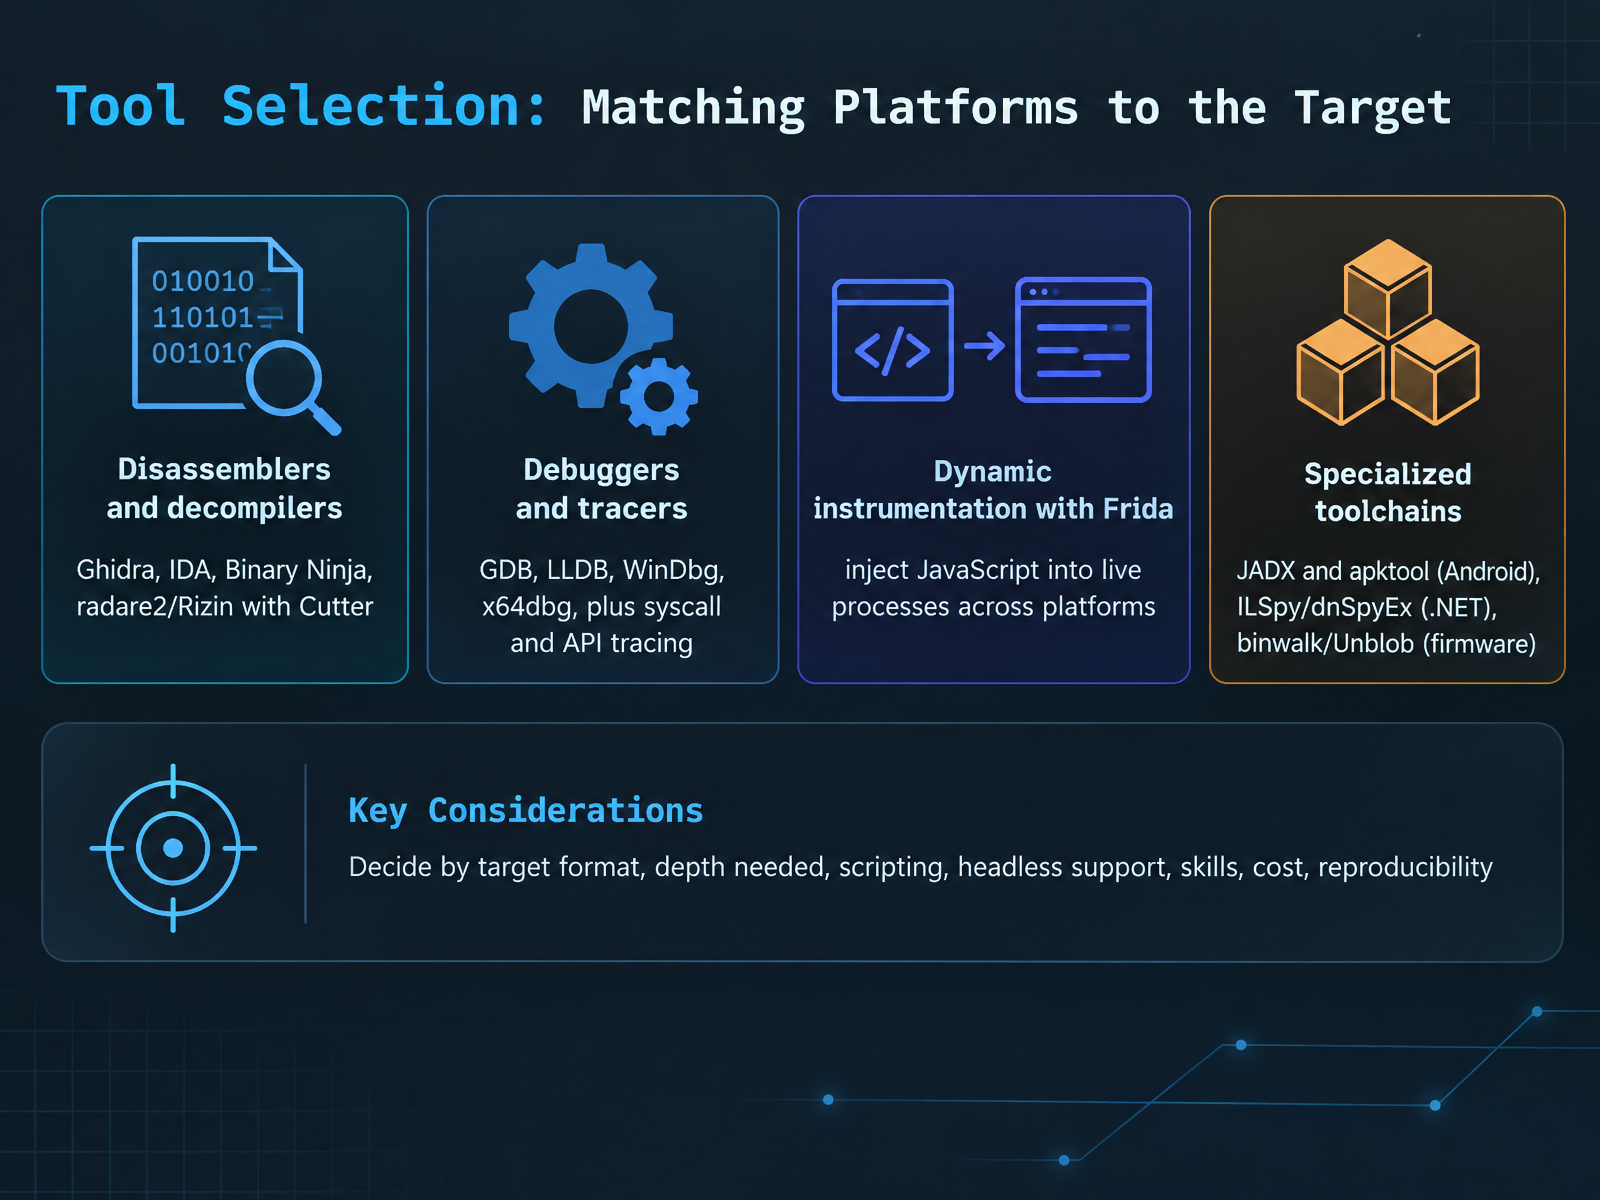
For static work, you have four main options. Ghidra, IDA, Binary Ninja, and radare2 or Rizin with Cutter. Ghidra is free and has a strong decompiler, a tool that turns assembly back into C-like pseudocode, with support for over fifty architectures. IDA's Hex-Rays decompiler still produces the best pseudocode quality, but it is expensive. Binary Ninja sits in the middle, with a clean interface and a strong scripting API.
For dynamic work, debuggers and tracers come next. GDB, LLDB, WinDbg, and x64dbg let you step through execution. Frida goes further. It injects JavaScript into a live process and lets you hook functions across Windows, Linux, macOS, and Android.
Some targets need specialized chains. JADX and apktool for Android, ILSpy or dnSpyEx for dot NET, and binwalk or Unblob for firmware.
Decide by target format, depth needed, scripting and headless support, your skills, cost, and reproducibility.
Building a Selection Matrix and a Student-Friendly Stack.
 aidev.fittechyorker.comdeepresearch.ninja+22 min
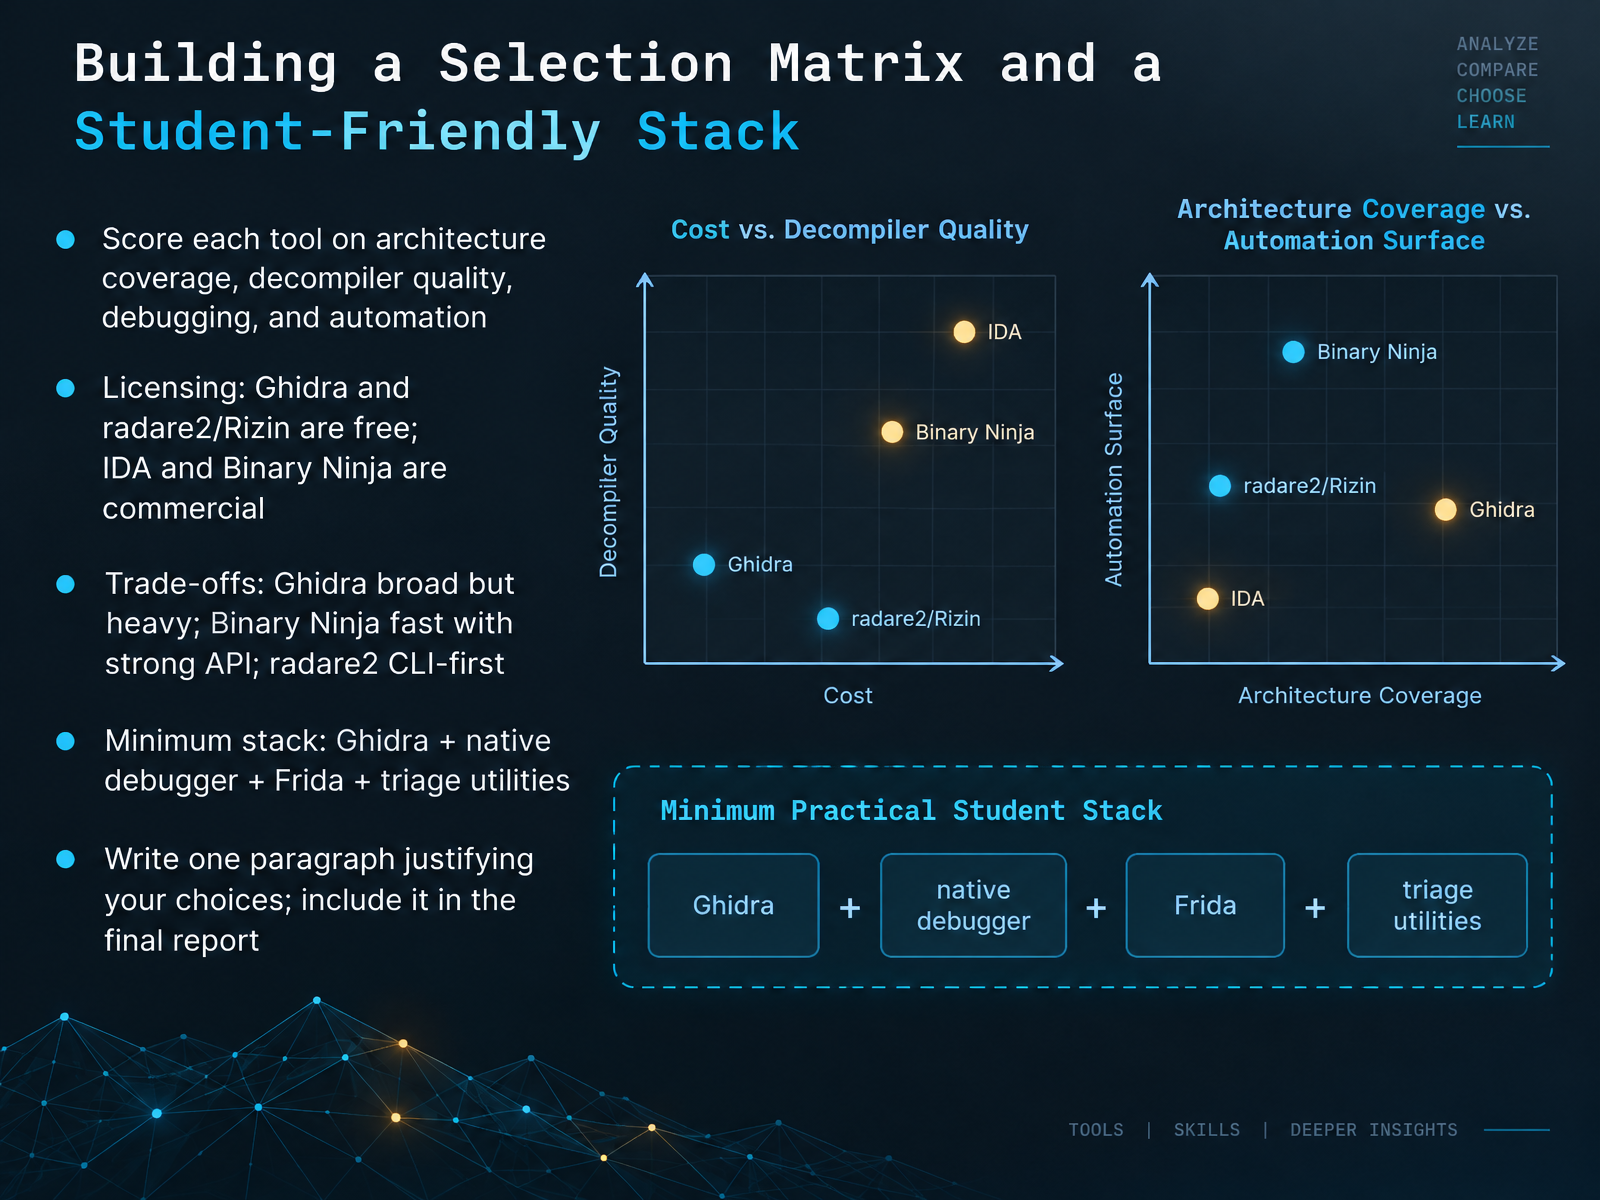
- 07Building a Selection Matrix and a Student-Friendly StackNow let's turn tool choice into a repeatable method. Build a small selection matrix and score each candidate on four criteria: architecture coverage, decompiler quality, debugging support, and automation. Architecture coverage means which instruction sets the disassembler can read. Decompiler quality is how readable the C-like pseudocode is. Debugging is the ability to step through a live process. Automation means scripting through an API.
Next, check licensing. Ghidra and radare2 or Rizin are free. IDA and Binary Ninja are commercial. Each option has trade-offs. Ghidra is broad but heavy. Binary Ninja is fast with a strong API. radare2 is command-line first, so it suits scripts and batch work.
For a student-friendly minimum stack, start with Ghidra, add a native debugger such as GDB or x64dbg, add Frida for dynamic instrumentation, and keep a few triage utilities like file and strings. Finally, write one paragraph justifying your choices, and include it in your final report. That paragraph is where you show your reasoning, not just your preference.
Requirements: Authorization, Law, and Ethics.
 aidev.fittechyorker.comdeepresearch.ninja+22 min
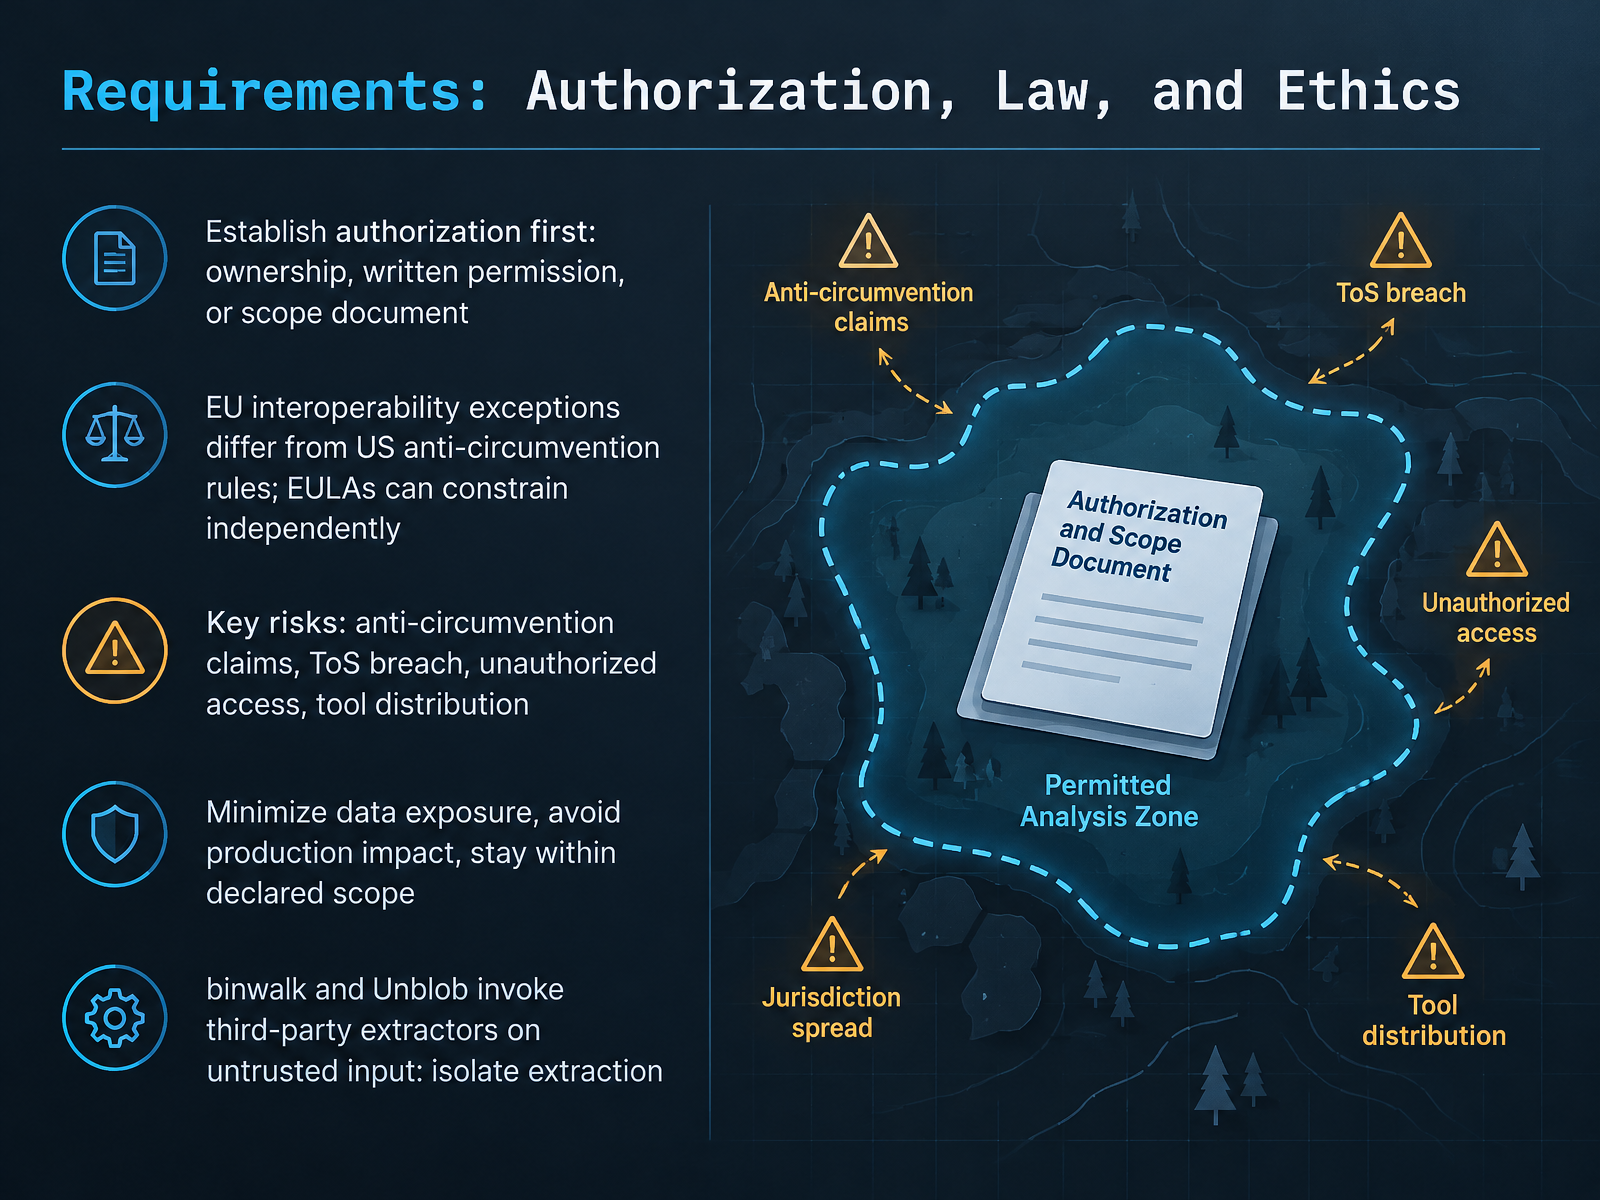
- 08Requirements: Authorization, Law, and EthicsNow let's look at requirements. Before any technical step, establish authorization. That means ownership, written permission, or a scope document. Be clear about what it covers.
Jurisdictions differ. EU interoperability exceptions are broader than United States anti-circumvention rules. And an end user license agreement, or EULA, is a contract. It can restrict you independently of copyright law.
Track the key risks: anti-circumvention claims, terms of service breach, unauthorized access, and liability for distributing analysis tools. Also minimize data exposure, avoid impact on production systems, and stay inside your declared scope.
One concrete tooling point. binwalk and Unblob both invoke third-party extractors on untrusted input. Those extractors have a history of parsing bugs. So isolate extraction in a virtual machine or container, and keep the toolchain updated.
Next, we'll cover the paperwork that should exist before analysis begins: Required Documentation Before Analysis Begins.
 doi.orglaw.cornell.edutradecommissioner.gc.ca+21 min
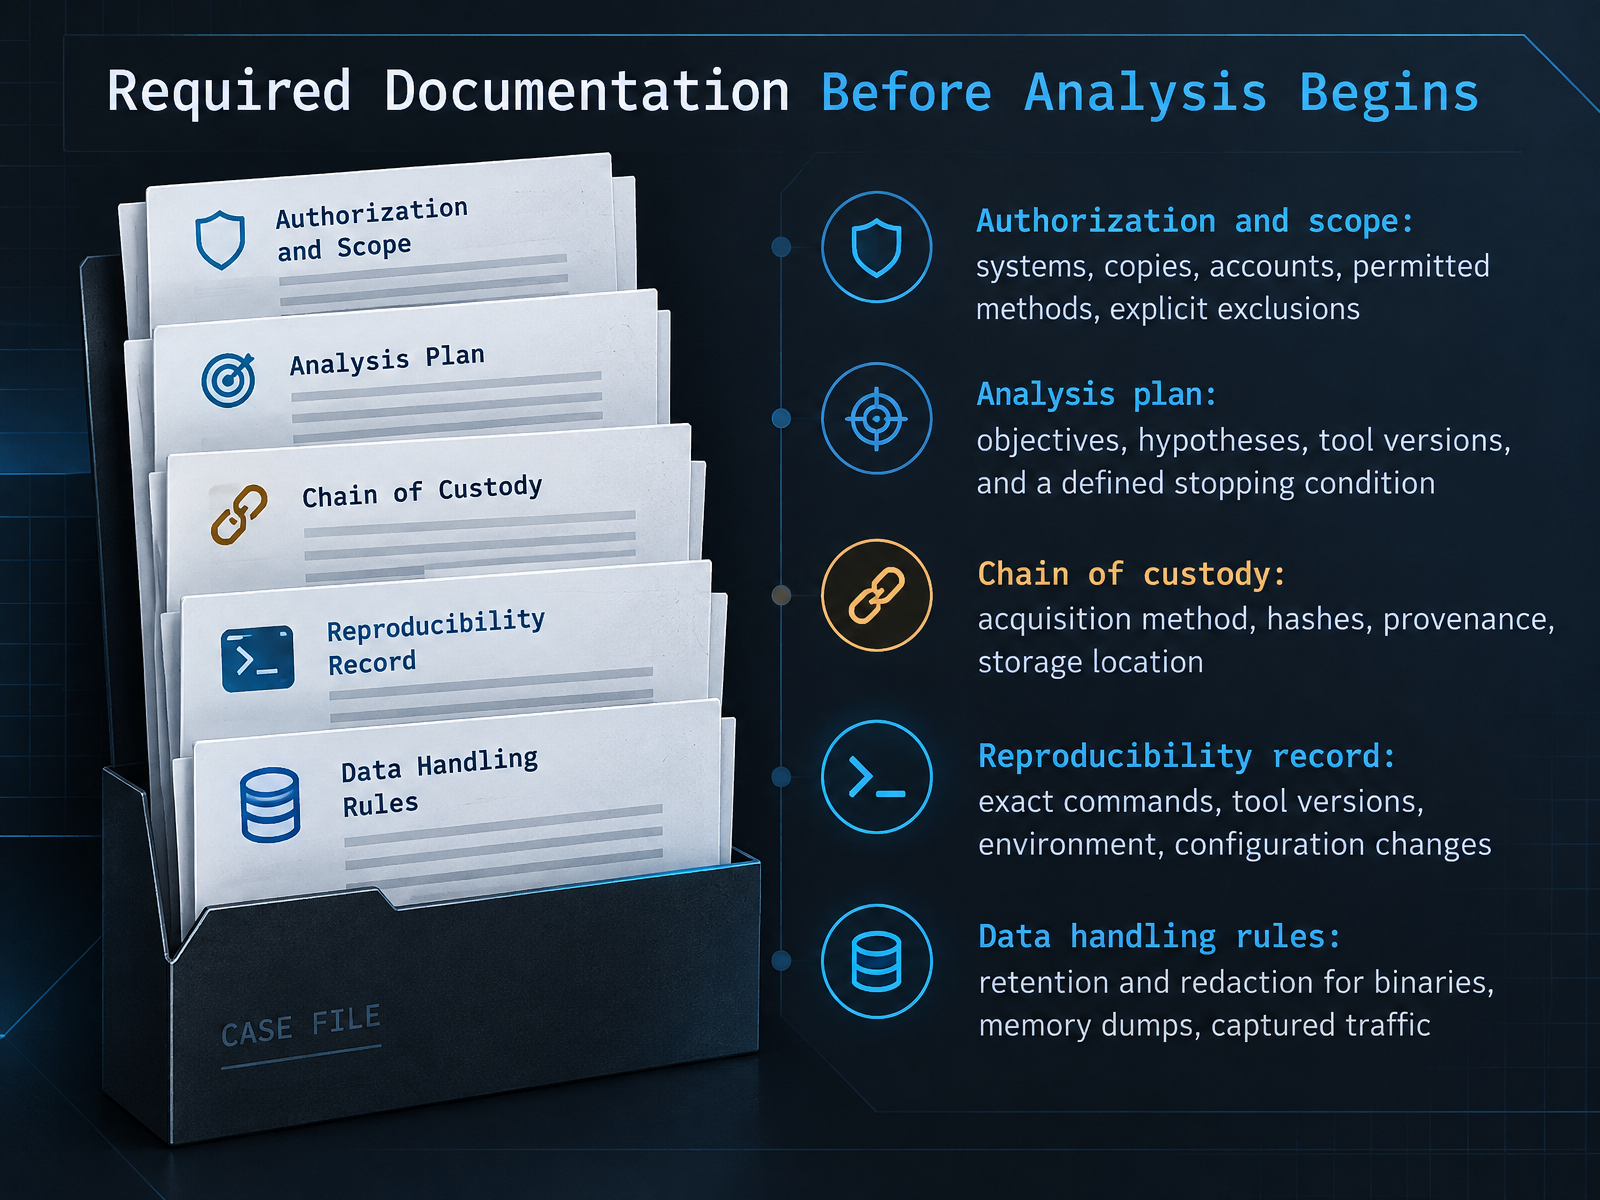
- 09Required Documentation Before Analysis BeginsLet's talk about the paperwork you finish before touching a binary. Authorization and scope come first. Write down which systems, copies, and accounts you may use, which methods are permitted, and what is explicitly excluded. Authorized analysis means you stay inside that line. Next, write an analysis plan. State your objectives, your hypotheses, the tool versions you will use, and a stopping condition, so you know when the work is done. Then chain of custody: record how you acquired the binary, its hashes, its provenance, and where it is stored. Keep a reproducibility record too. Exact commands, tool versions, environment, and any configuration changes. Finally, data handling rules. Decide retention and redaction for binaries, memory dumps, and captured traffic before you collect them. That set of documents protects the analysis and the analyst. Next, we set up the lab itself: preparation and reconnaissance in the isolated lab.
 doi.orglaw.cornell.edutradecommissioner.gc.ca+21 min
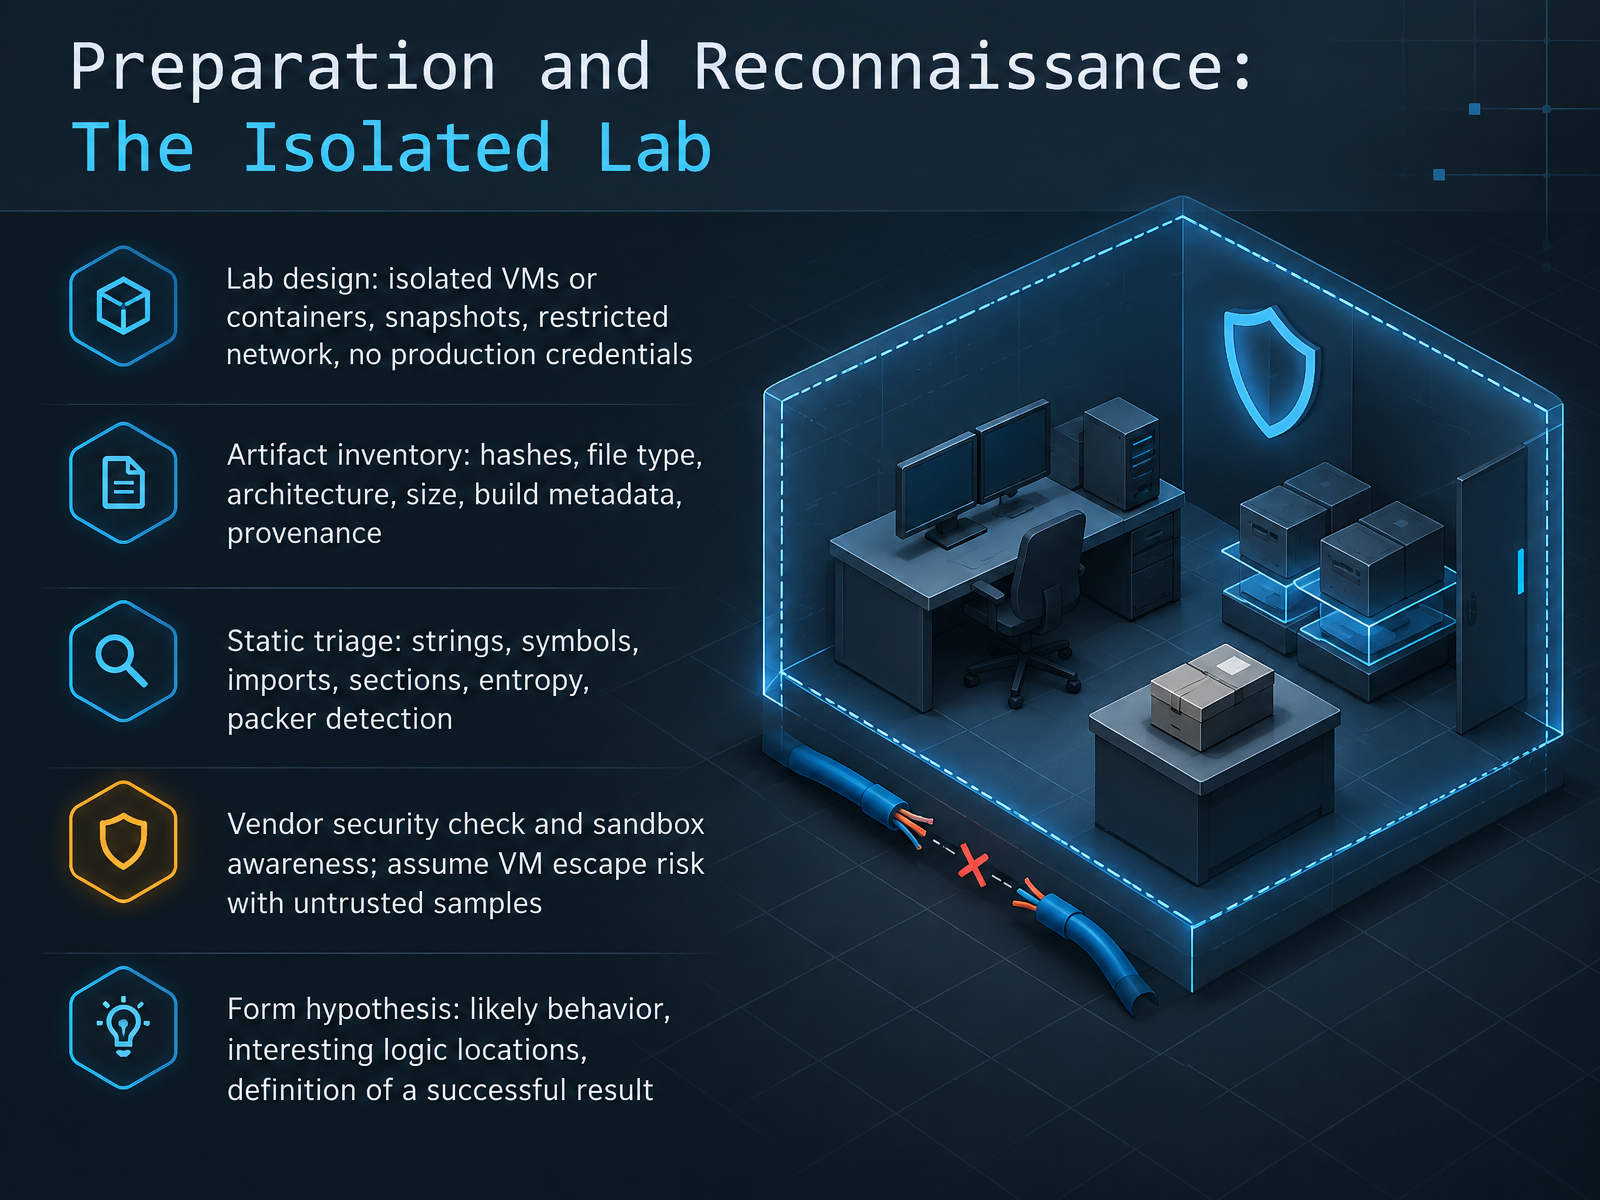
- 10Preparation and Reconnaissance: The Isolated LabNow let's set up the workspace before you touch the binary. This is preparation and reconnaissance in an isolated lab.
First, design the lab. Use isolated virtual machines or containers, not your daily system. Take a snapshot before each run, restrict network access, and never load production credentials. Extraction runs third-party unpackers on untrusted bytes, so treat every sample as hostile. Assume virtual machine escape is possible and plan accordingly.
Next, inventory the artifacts. Record the hash for each file, plus file type, architecture, size, build metadata, and where it came from. That provenance tells you what you can legally analyze.
Then do static triage. Start with strings, which are readable text inside a binary. Check symbols, imports, and section layout. Measure entropy to spot packed or encrypted regions, and run packer detection. Tools like binwalk can map firmware sections and carve out embedded file systems before you load anything into a disassembler.
Also check vendor security advisories and watch for sandbox awareness in the sample.
Finally, form a hypothesis. Write down the likely behavior, the logic locations worth examining, and your definition of a successful result. That keeps the analysis focused.
Next, we move into the static analysis workflow.
 pypi.orgbinwalk.appbinwalk.sh+22 min
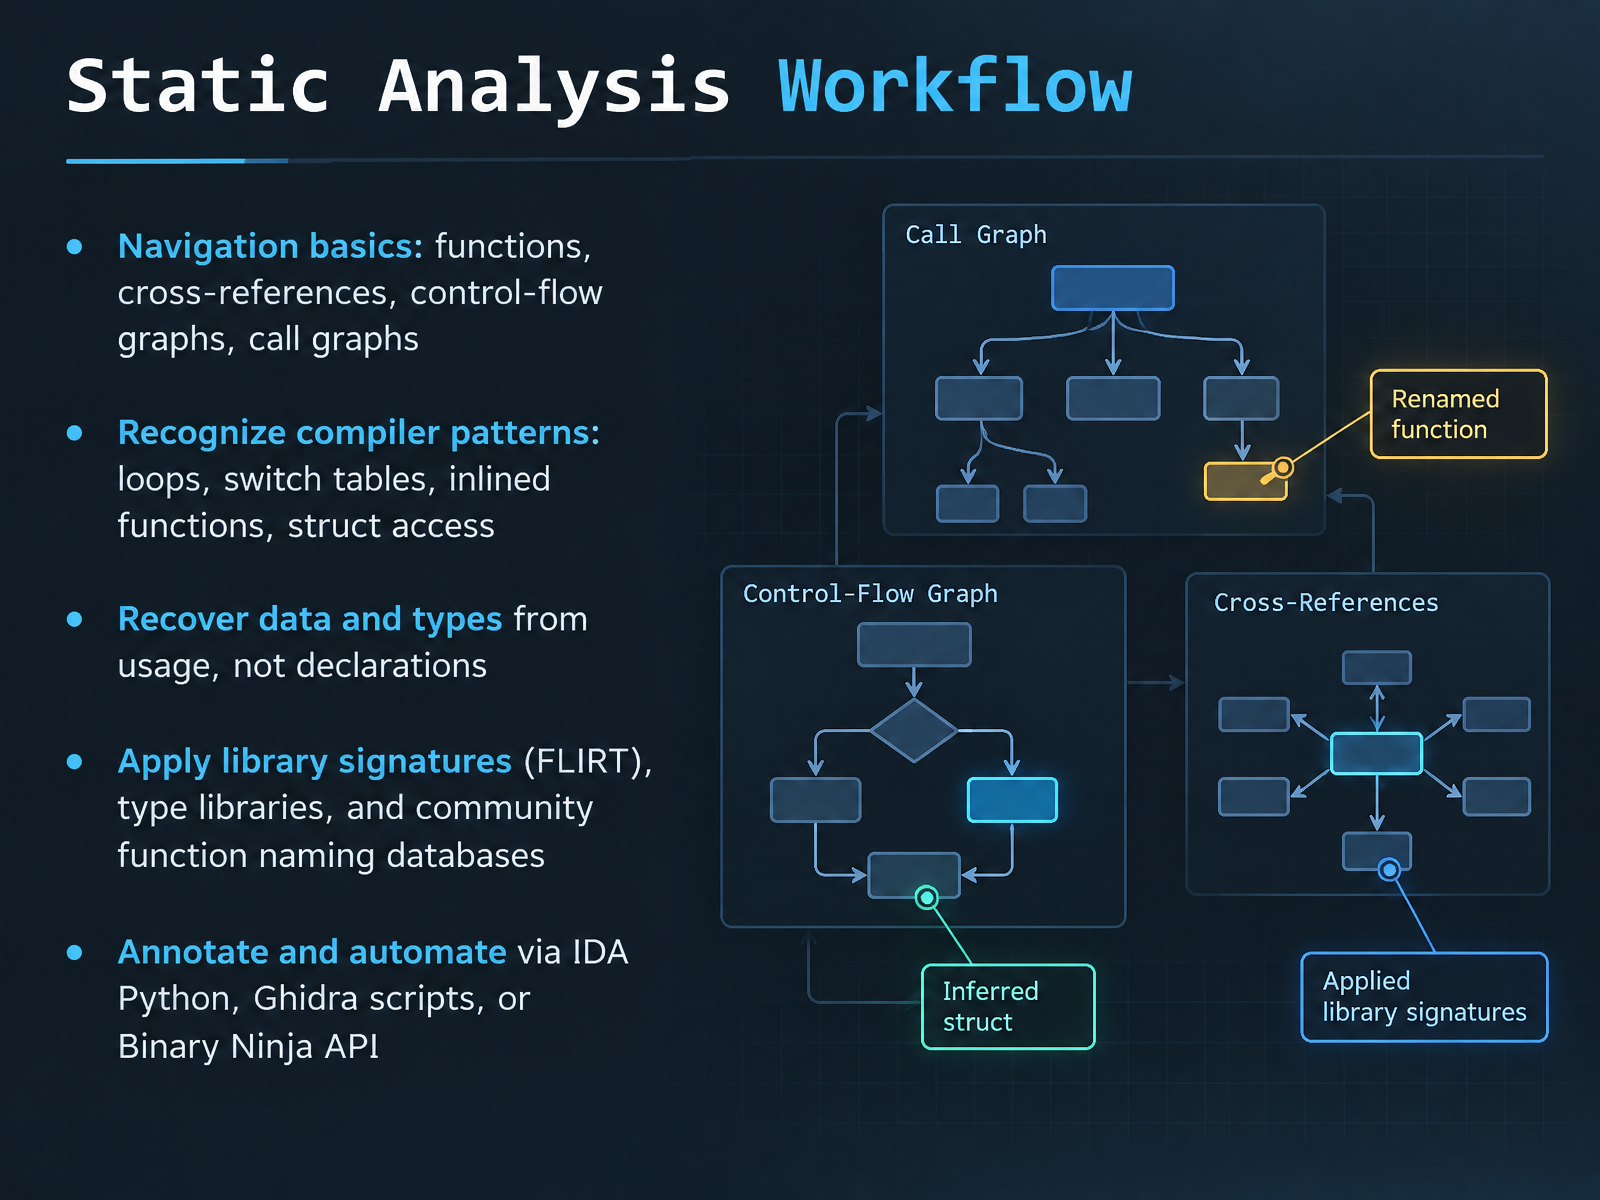
- 11Static Analysis WorkflowNow let's move into the static analysis workflow itself. Start with navigation. A function is a named block of code, and a cross-reference, or xref, tells you who calls it or references a given address. The control-flow graph shows how basic blocks connect inside one function. The call graph shows how functions connect to each other. Together, these let you move through a binary with intent, not just scroll.
Next, learn to recognize compiler patterns. A simple loop, a switch lowered into a jump table, an inlined function, or a struct field access all look different once you know what the compiler emits. Recover data and types from how values are used, not from declarations you do not have. Then apply library signatures, like FLIRT, which matches known library code, along with type libraries and community function naming databases to label what is already known.
Finally, annotate and automate with IDA Python, Ghidra scripts, or the Binary Ninja API. That turns one-off analysis into a repeatable workflow. Next, we move into dynamic analysis and debugging.
 aidev.fittechyorker.comdeepresearch.ninja+22 min
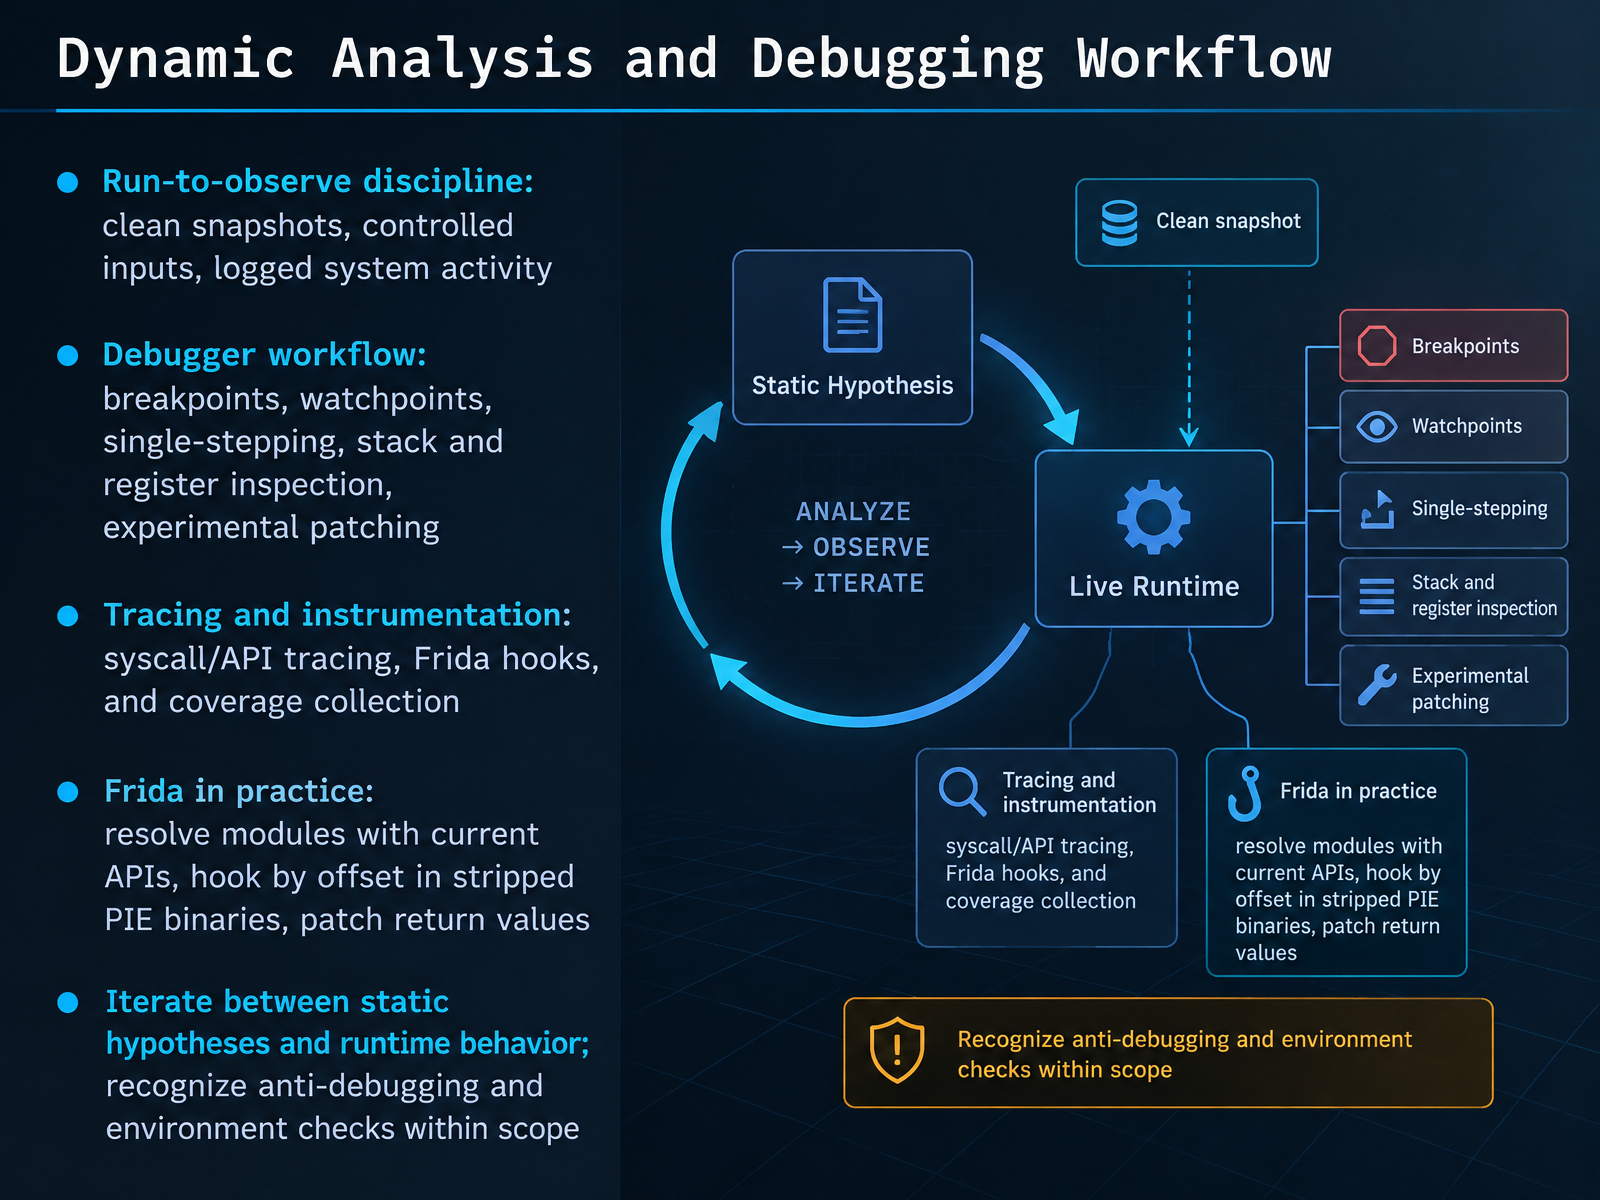
- 12Dynamic Analysis and Debugging WorkflowNow let's bring that static picture to life with dynamic analysis and debugging. The core discipline is simple: run to observe. Start from a clean snapshot, feed controlled inputs, and log system activity so you can tie behavior back to a cause. In a debugger, you set breakpoints to pause at a chosen instruction, watchpoints to trap when a value changes, and you single step to follow execution one instruction at a time. Then you inspect the stack and registers to see the live state. Experimental patching lets you test a hypothesis without rebuilding. Tracing goes wider: syscall and API tracing shows what the program asks the operating system to do. Frida, a dynamic instrumentation toolkit, injects scripts into a running process to hook functions. Its hooking API is Interceptor, and coverage collection tells you which code actually executed. In practice, resolve modules with current APIs, hook by offset in stripped position-independent executables, and patch return values to test a branch. Iterate between static hypotheses and runtime behavior. And recognize anti-debugging and environment checks when they appear, staying within your authorized scope. Next, we move to specialized targets: bytecode, mobile, firmware, and protocols.
 frida.refrida.relearnfrida.info+22 min
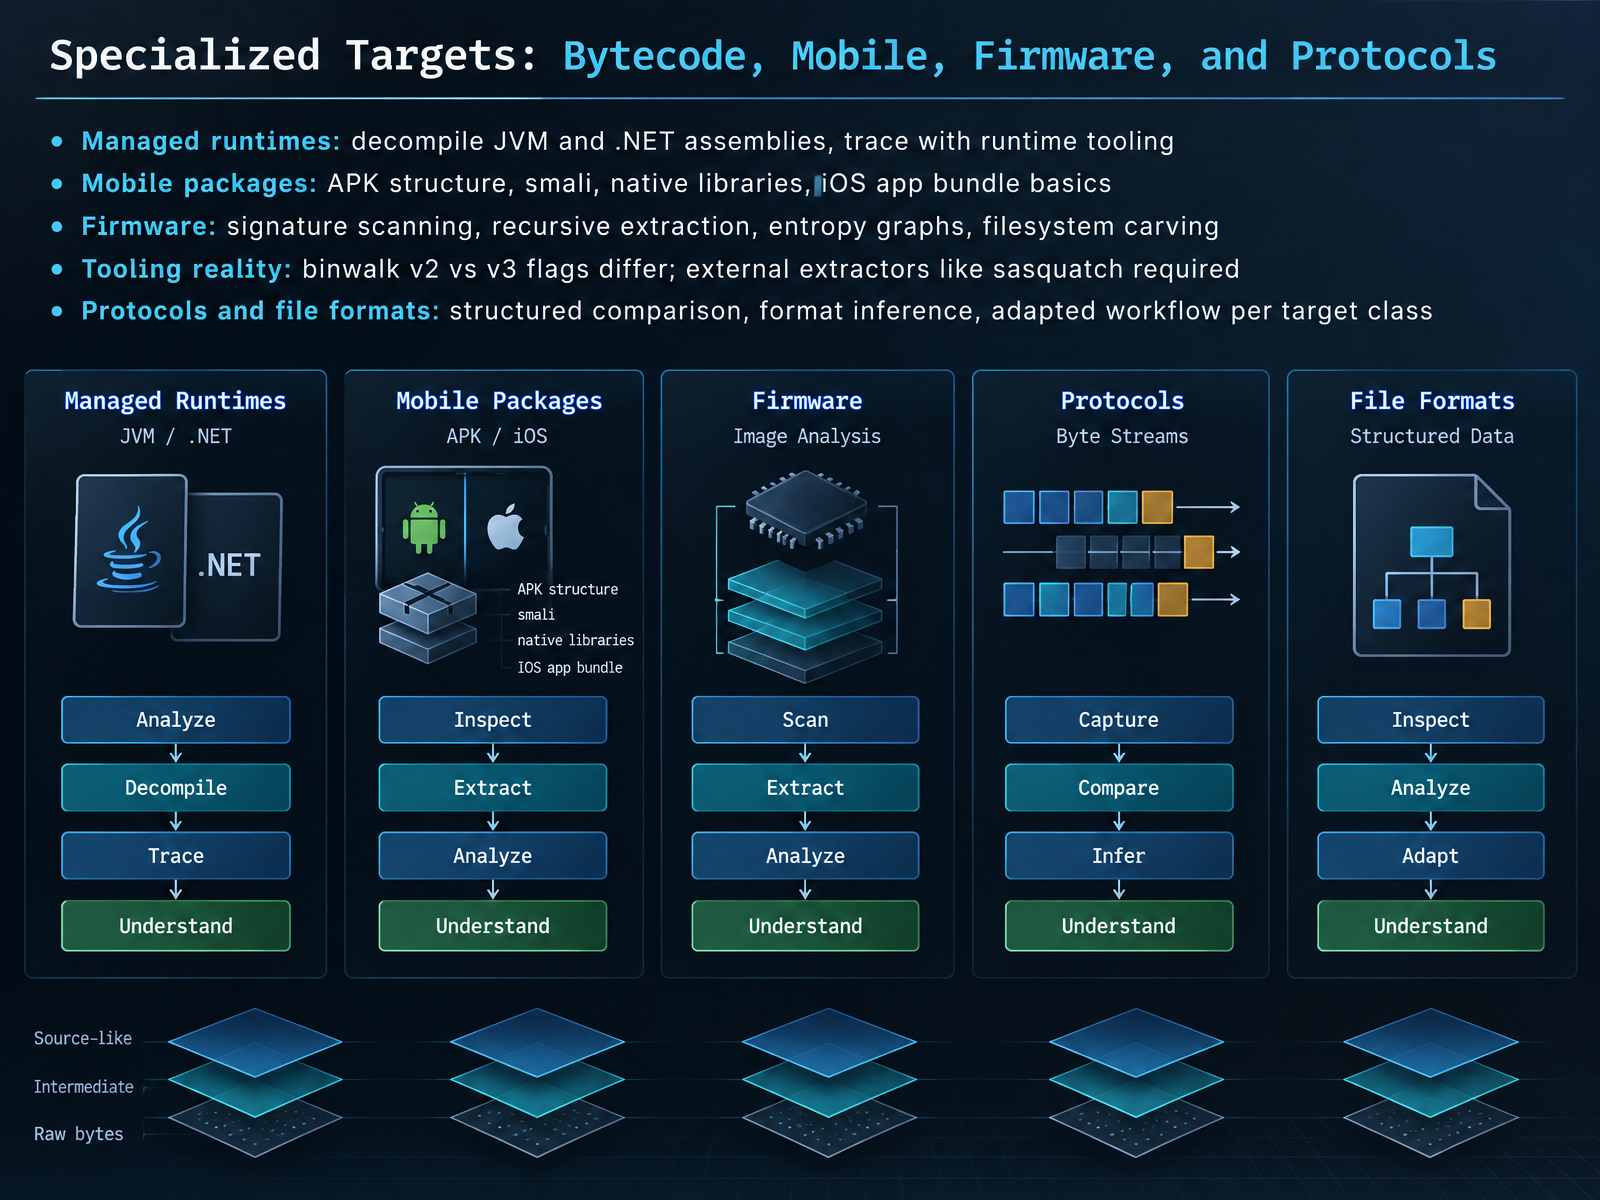
- 13Specialized Targets: Bytecode, Mobile, Firmware, and ProtocolsNot every target is a native executable. Let's cover the specialized cases. First, managed runtimes. For Java and .NET, you are not reading machine code. You decompile the bytecode or the intermediate language back into readable source-like form. Tools like JADX for Android, and ILSpy or dnSpy for .NET, handle that. Then you trace execution with runtime tooling, such as a Java debugger or Frida, a dynamic instrumentation framework that hooks running processes.
Mobile packages add more layers. An Android APK is a ZIP file. Inside it you find smali, the human-readable form of Dalvik bytecode, plus native libraries ending in dot so. For iOS, you work with the app bundle structure.
Firmware is where signature scanning, recursive extraction, and entropy graphs matter most. A flat entropy curve near eight bits per byte usually means encrypted or compressed data. Here is a tooling reality check. Binwalk version two and version three use different flags, and both rely on external extractors. For SquashFS, you often need sasquatch, not the stock unsquashfs, because vendors modify the format.
Finally, protocols and file formats. Compare structures side by side, infer the format from field patterns, and adapt your workflow to each target class. The workflow is not one-size-fits-all.
Next, let's look at documenting findings, communicating results, and wrapping up the course.
 pypi.orgbinwalk.appbinwalk.sh+22 min
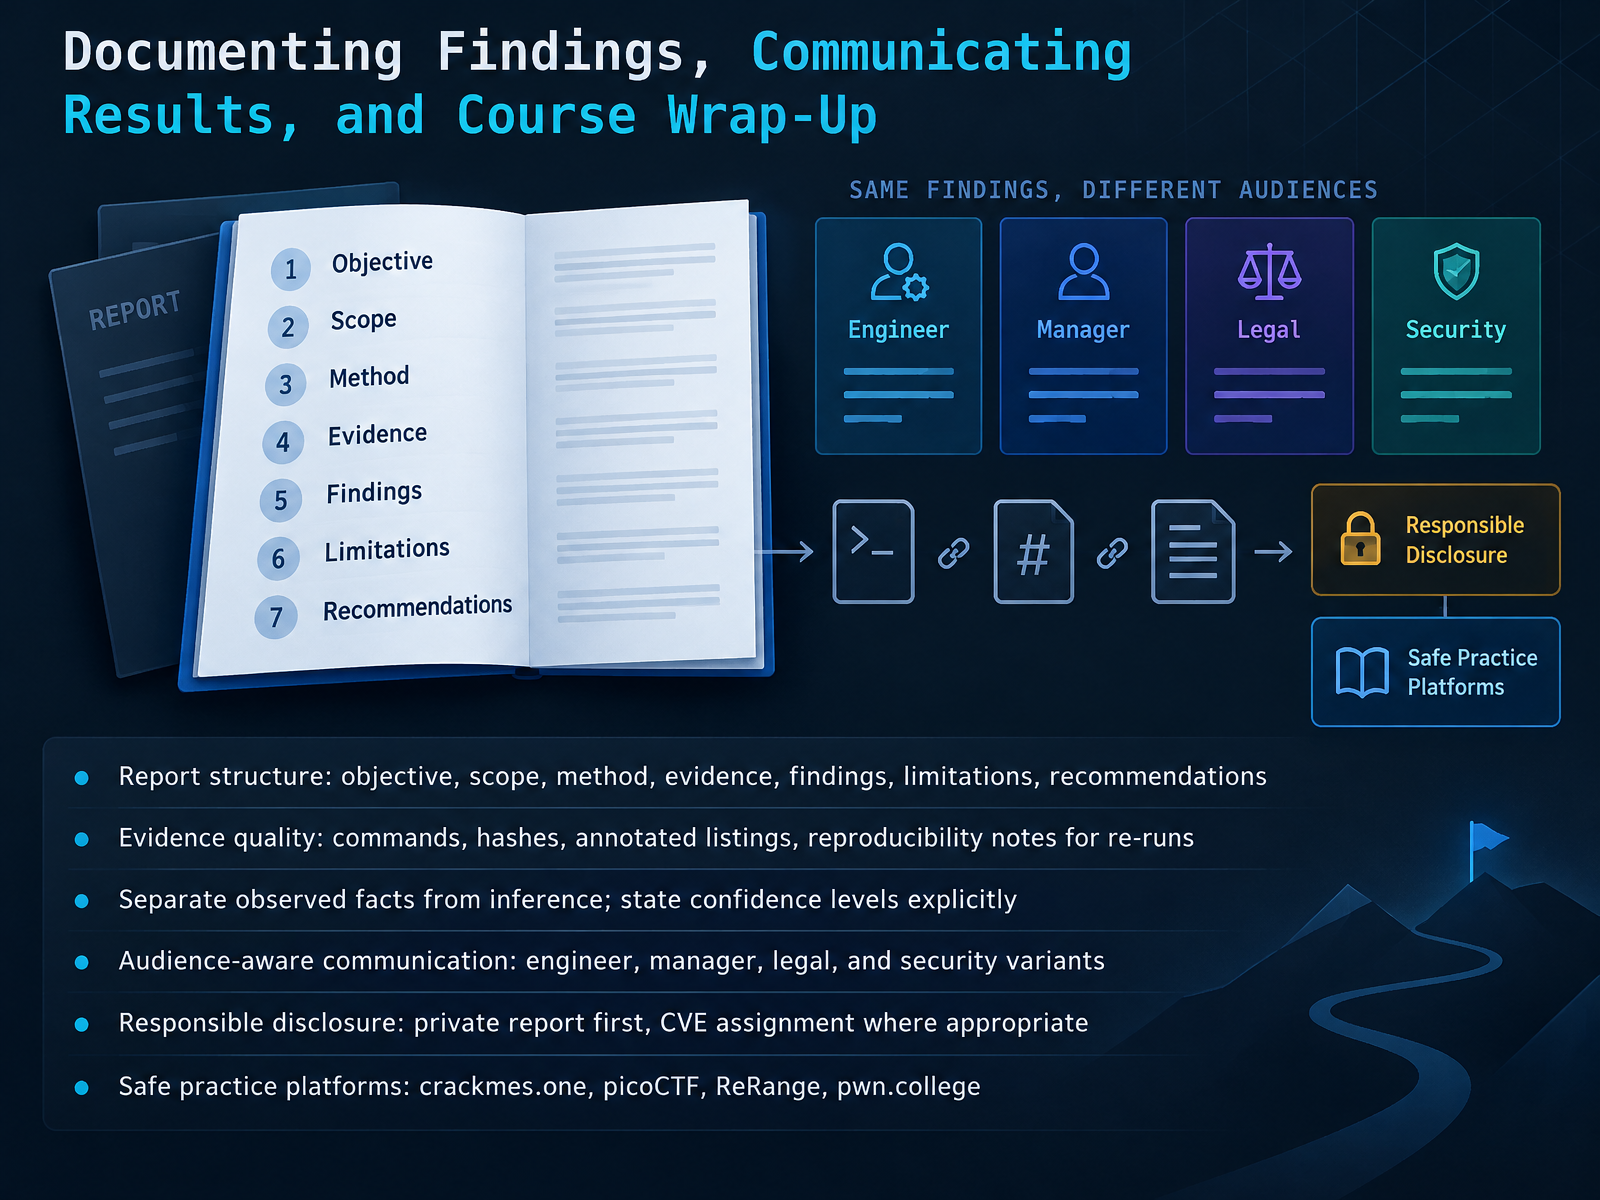
- 14Documenting Findings, Communicating Results, and Course Wrap-UpLet's close with how you write it all up. A good report follows a simple structure: objective, scope, method, evidence, findings, limitations, and recommendations. Keep evidence strong. Include the commands you ran, file hashes, annotated listings, and reproducibility notes so someone else can re-run your work. Then separate observed facts from inference, and state your confidence explicitly. Say what you saw in the binary, and say what you think it means. Those are two different claims.
Match the communication to the audience. Engineers want the disassembly and the control-flow graph. Managers want impact and timeline. Legal and security teams need scope and exposure. For disclosure, report privately first, then request a CVE, or Common Vulnerabilities and Exposures identifier, where appropriate. That is how coordinated disclosure works. It looks like a private report, a fix, then a public record.
When you want safe practice, crackmes dot one, picoCTF, ReRange, and pwn dot college all give you legal targets to reverse. You have the workflow now: select the binary, document the evidence, and choose authorized ground. Keep going, and stay curious.
 2 min
Take the deck with you
Download this course as a file — free, no sign-up needed.
- PDF handoutEvery slide page, ready to print or share.15 pages · 3.4 MBDownload
- Narrated PowerPointThe deck that presents itself — every slide carries the digital human's narration video.15 pages · 16.0 MBDownload
- PowerPoint slidesThe full deck as a .pptx — open it in PowerPoint, Keynote, or Google Slides.15 pages · 3.3 MBDownload
Free to use in your own training — please keep the PersonWise credit page at the end.
Have your own deck? Turn it into a course
Sources consulted
Web sources consulted while building this course.
- Ethical and Legal Considerations in Reverse Engineering: A Comprehensive Analysis — doi.org
- reverse engineering | Wex | US Law | LII / Legal Information Institute — law.cornell.edu
- Reverse engineering considerations when protecting inventions - Tradecommissioner.gc.ca — tradecommissioner.gc.ca
- Thou Shalt Not Conduct Research on Software? Text and Data Mining of Computer Programs in the Current EU Copyright Framework — doi.org
- Reverse-engineering and disassembly of IBM mainframe software in breach of software licence (IBM v LzLabs) - Part 1 Blog Tech Hub — lexology.com
- binwalk3 v3.2.0 — pypi.org
- Binwalk - Firmware Analysis and Extraction Tool — binwalk.app
- Firmware reverse engineering · binwalk/sh — binwalk.sh
- How to Use Binwalk: Extract Files Hidden in Files (2026) | HackerDNA — hackerdna.com
- Firmware RE with Binwalk and Ghidra — stevenfoerster.com
- Reverse Engineering Tools: Ghidra, IDA Free, radare2, Binary Ninja — AI Study Room — aidev.fit
- radare2 vs Ghidra vs Frida vs Binary Ninja (2026): Pricing, Features and Platforms Compared | TechYorker — techyorker.com
- Reverse Engineering Tools: A Comprehensive Guide to IDA Pro, Ghidra, Binary Ninja, and the Ecosystem | DeepResearch Ninja — deepresearch.ninja
- Best Reverse Engineering Tools in 2026 | Reverse Engineering — reverseengineering.app
- Top 10 Best Decompiling Software: 2026 Comparison — worldmetrics.org
- Welcome | Frida • A world-class dynamic instrumentation toolkit — frida.re
- Quick-start guide | Frida • A world-class dynamic instrumentation toolkit — frida.re
- Frida HandBook — learnfrida.info
- frida-trace | Frida • A world-class dynamic instrumentation toolkit — frida.re
- Frida • A world-class dynamic instrumentation toolkit | Observe ... — frida.re