Begin
14 pages · ~28 min
Email Marketing Effectiveness
This training explores the effectiveness of email marketing, helping marketers and business professionals understand its value and make informed decisions about their email campaigns.
A digital instructor presents all 14 pages. Hold “Ask” at any point and ask out loud — the answer comes from this course. No sign-up needed.
What you’ll learn
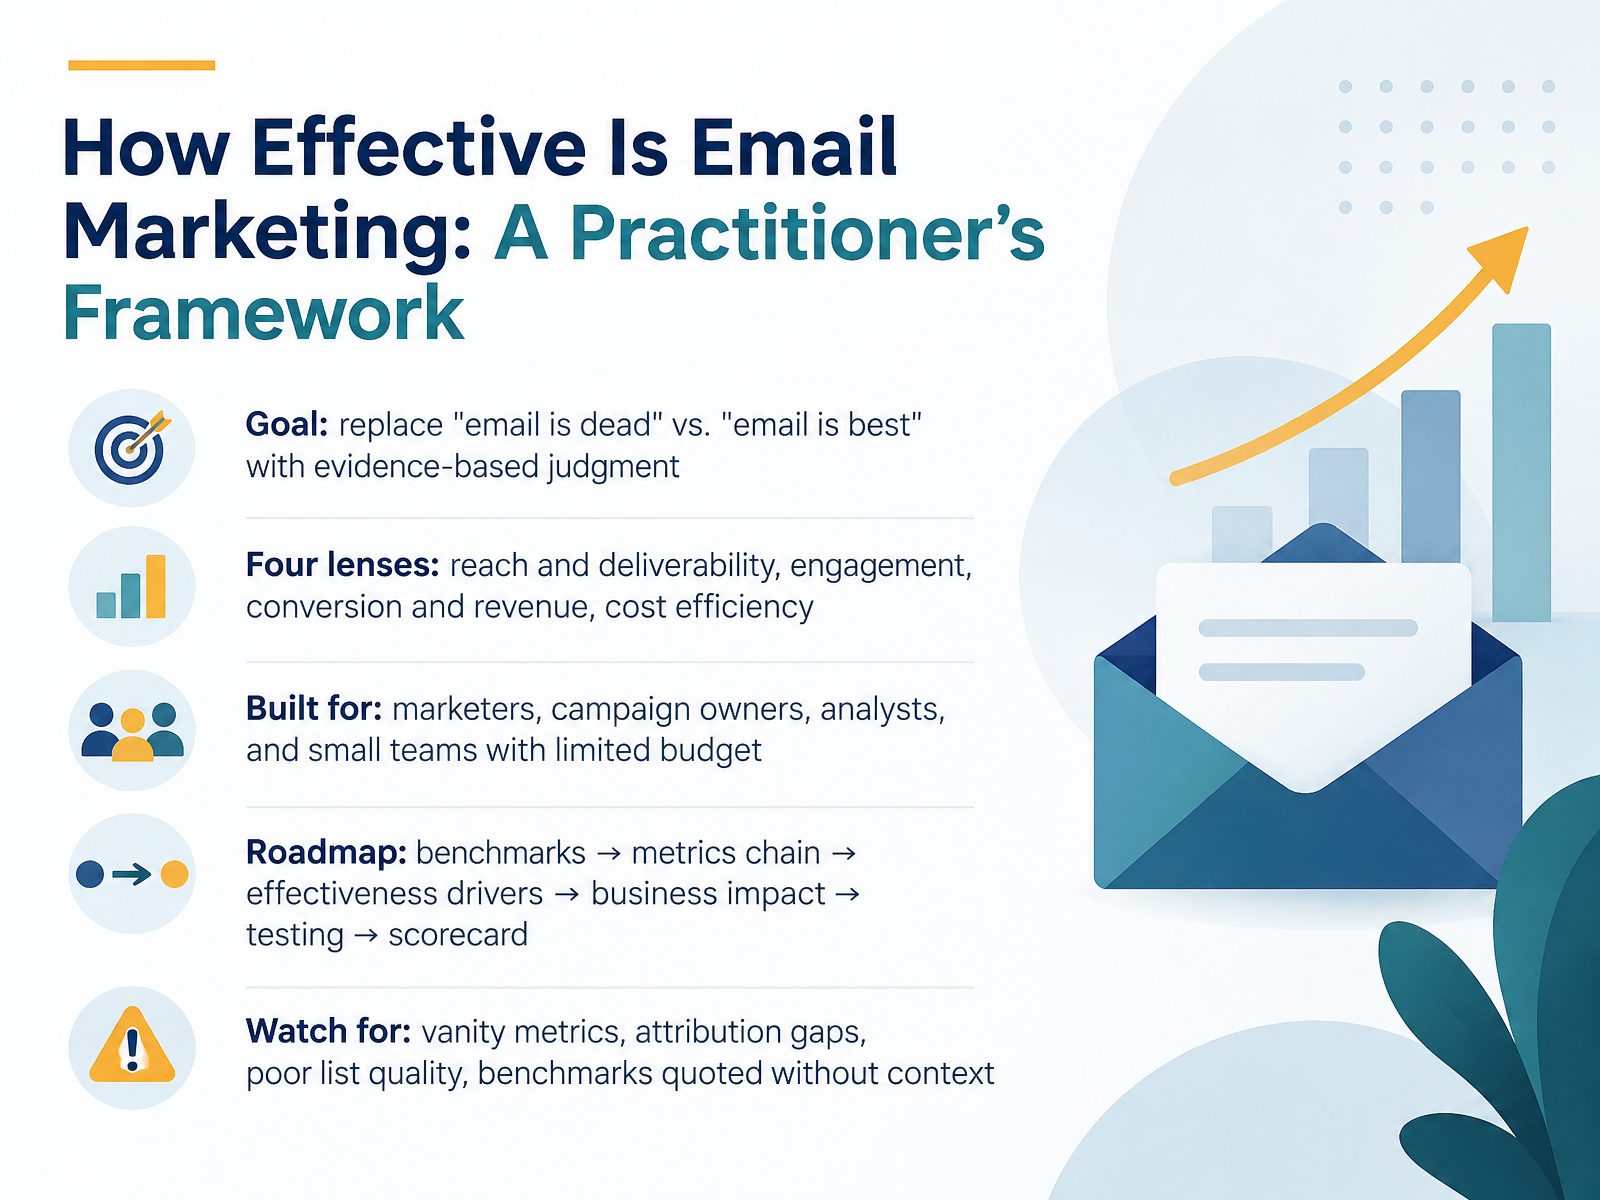
- 01How Effective Is Email Marketing: A Practitioner's FrameworkWelcome. Let's settle a tired debate. Email is not dead, and it is not automatically your best channel. Effectiveness depends on how you run it. Our goal in this course is to replace slogans with evidence-based judgment, using data you can act on in planning, testing, and reporting.
We'll look through four lenses: reach and deliverability, engagement, conversion and revenue, and cost efficiency. That structure works whether you own campaigns, analyze results, or run a small team on a tight budget.
Here's the roadmap. We start with benchmarks, then the metrics chain, then what actually drives effectiveness, then business impact, testing, and a scorecard you can reuse.
Along the way, watch for four traps: vanity metrics, attribution gaps, poor list quality, and benchmarks quoted without context. A return figure means little without your industry, list source, and measurement window. For example, automated flows routinely return far more per recipient than one-off broadcasts, so averaging the two hides the real story.
By the end, you'll have a framework for deciding where email earns its budget, and where it doesn't. Next, we'll ground that in current benchmarks and what good actually looks like in 2026.litmus.comklaviyo.comblog.hubspot.com+22 min
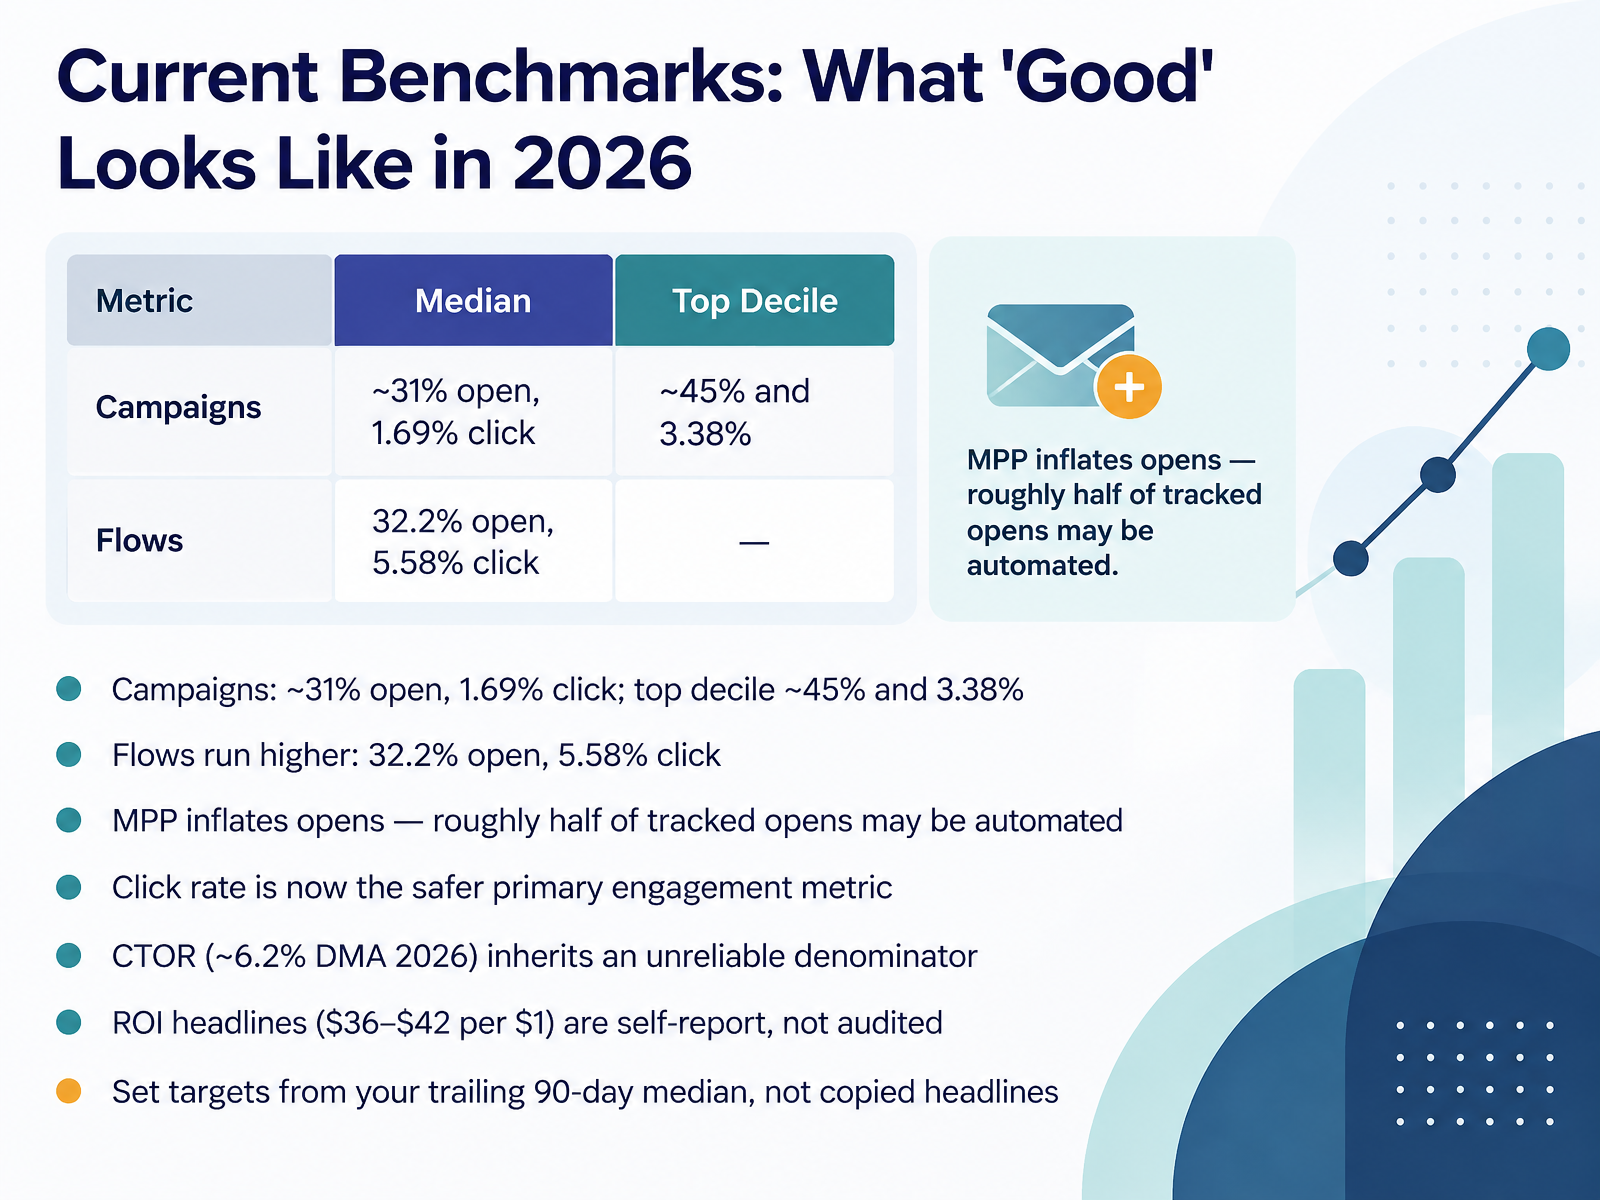
- 02Current Benchmarks: What 'Good' Looks Like in 2026Let's look at what good actually looks like in 2026. For one-off campaigns, a typical open rate is about thirty-one percent, with a click rate of one point six nine percent. The top ten percent of brands hit roughly forty-five percent opens and three point three eight percent clicks. Automated flows run higher, at thirty-two point two percent opens and five point five eight percent clicks. Now, a caution. Apple's Mail Privacy Protection inflates opens, and roughly half of tracked opens may be automated. So treat click rate as your safer primary engagement metric. Click-to-open rate inherits that unreliable denominator, so don't lean on it. And the famous thirty-six to forty-two dollars per dollar ROI is self-reported, not audited. Here's the practical move. Set your targets from your own trailing ninety-day median, not from copied headlines. Next, we'll trace the core metrics chain, from delivery to revenue.
 klaviyo.comwebfx.combrevo.com+22 min
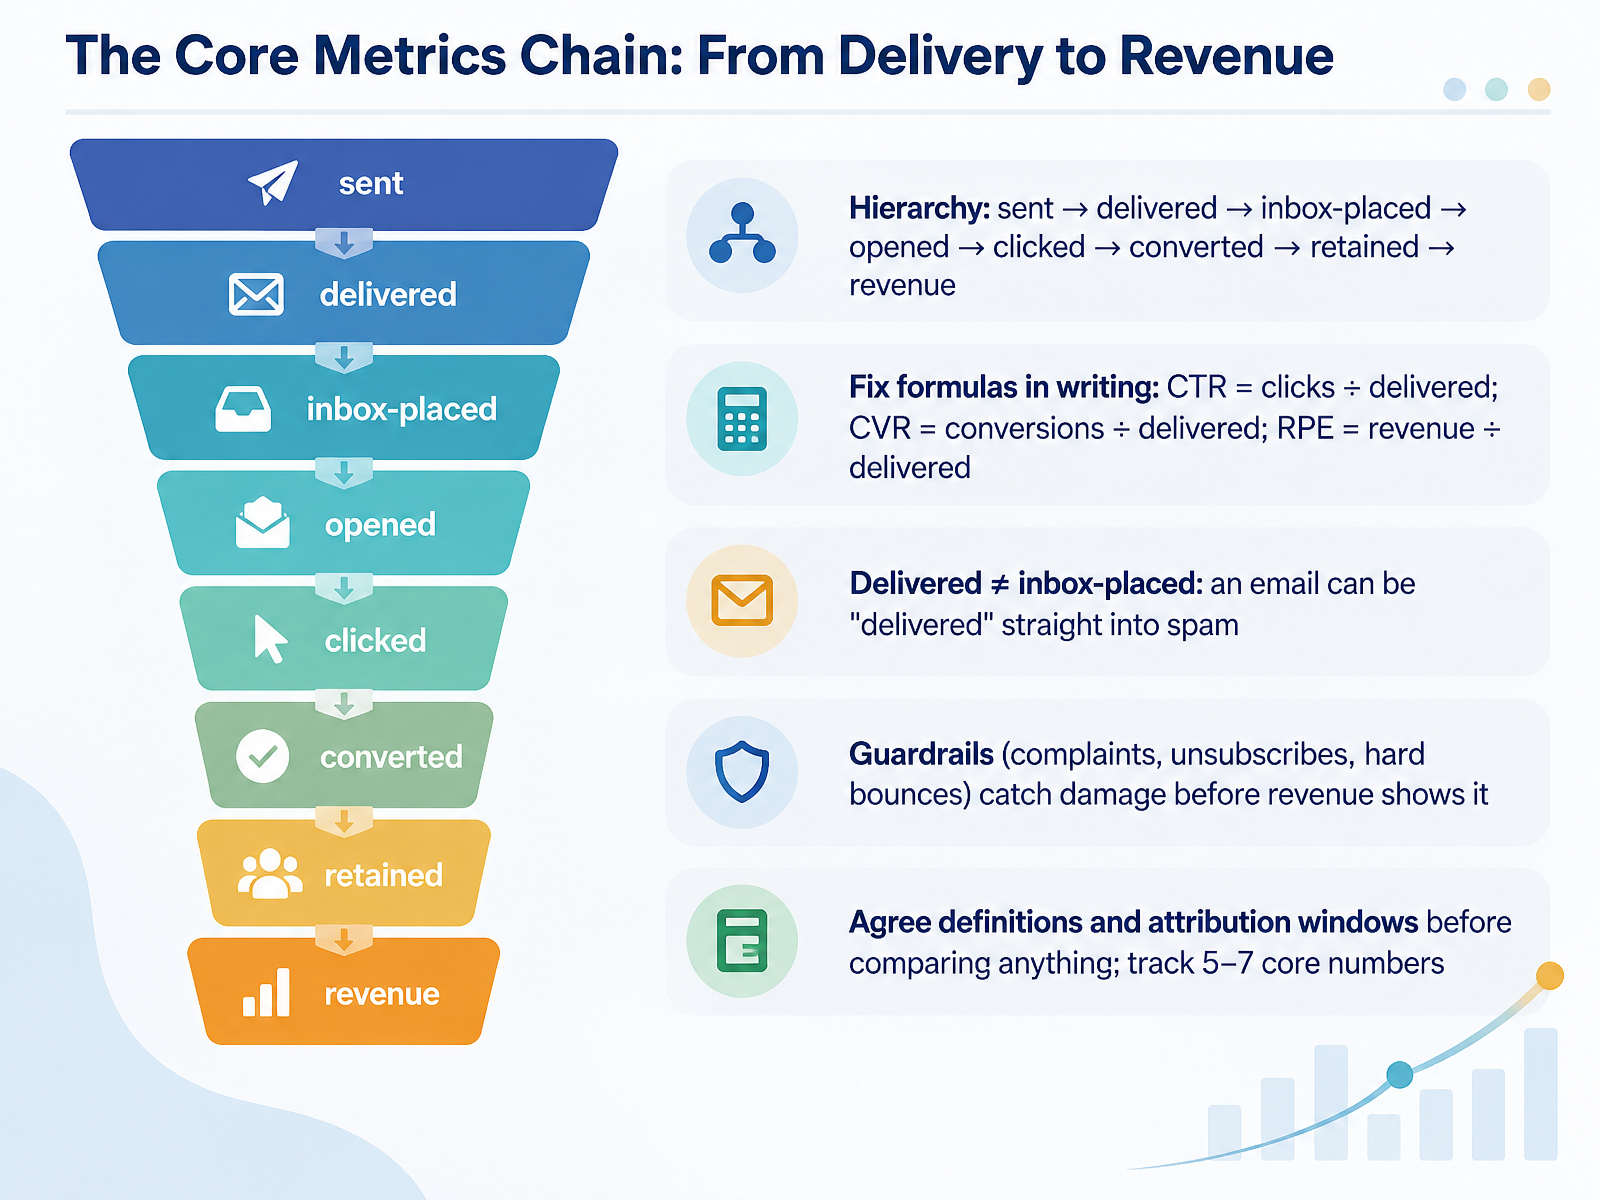
- 03The Core Metrics Chain: From Delivery to RevenueNow let's map the metrics chain, from delivery to revenue. It's a hierarchy. Sent, delivered, inbox-placed, opened, clicked, converted, retained, then revenue. Write your formulas down and keep them fixed. Click-through rate equals clicks divided by delivered. Conversion rate equals conversions divided by delivered. Revenue per email equals revenue divided by delivered. And don't confuse delivered with inbox-placed. An email can count as delivered straight into the spam folder. Deliverability rate equals inbox-placed divided by delivered. Then set guardrails. Complaints, unsubscribes, and hard bounces catch damage before revenue shows it. Finally, agree definitions and attribution windows before you compare anything, and track five to seven core numbers. Next, Deliverability and List Quality: The Non-Negotiable Foundation.
 salesforce.comlitmus.comdocumentation.bloomreach.com+22 min
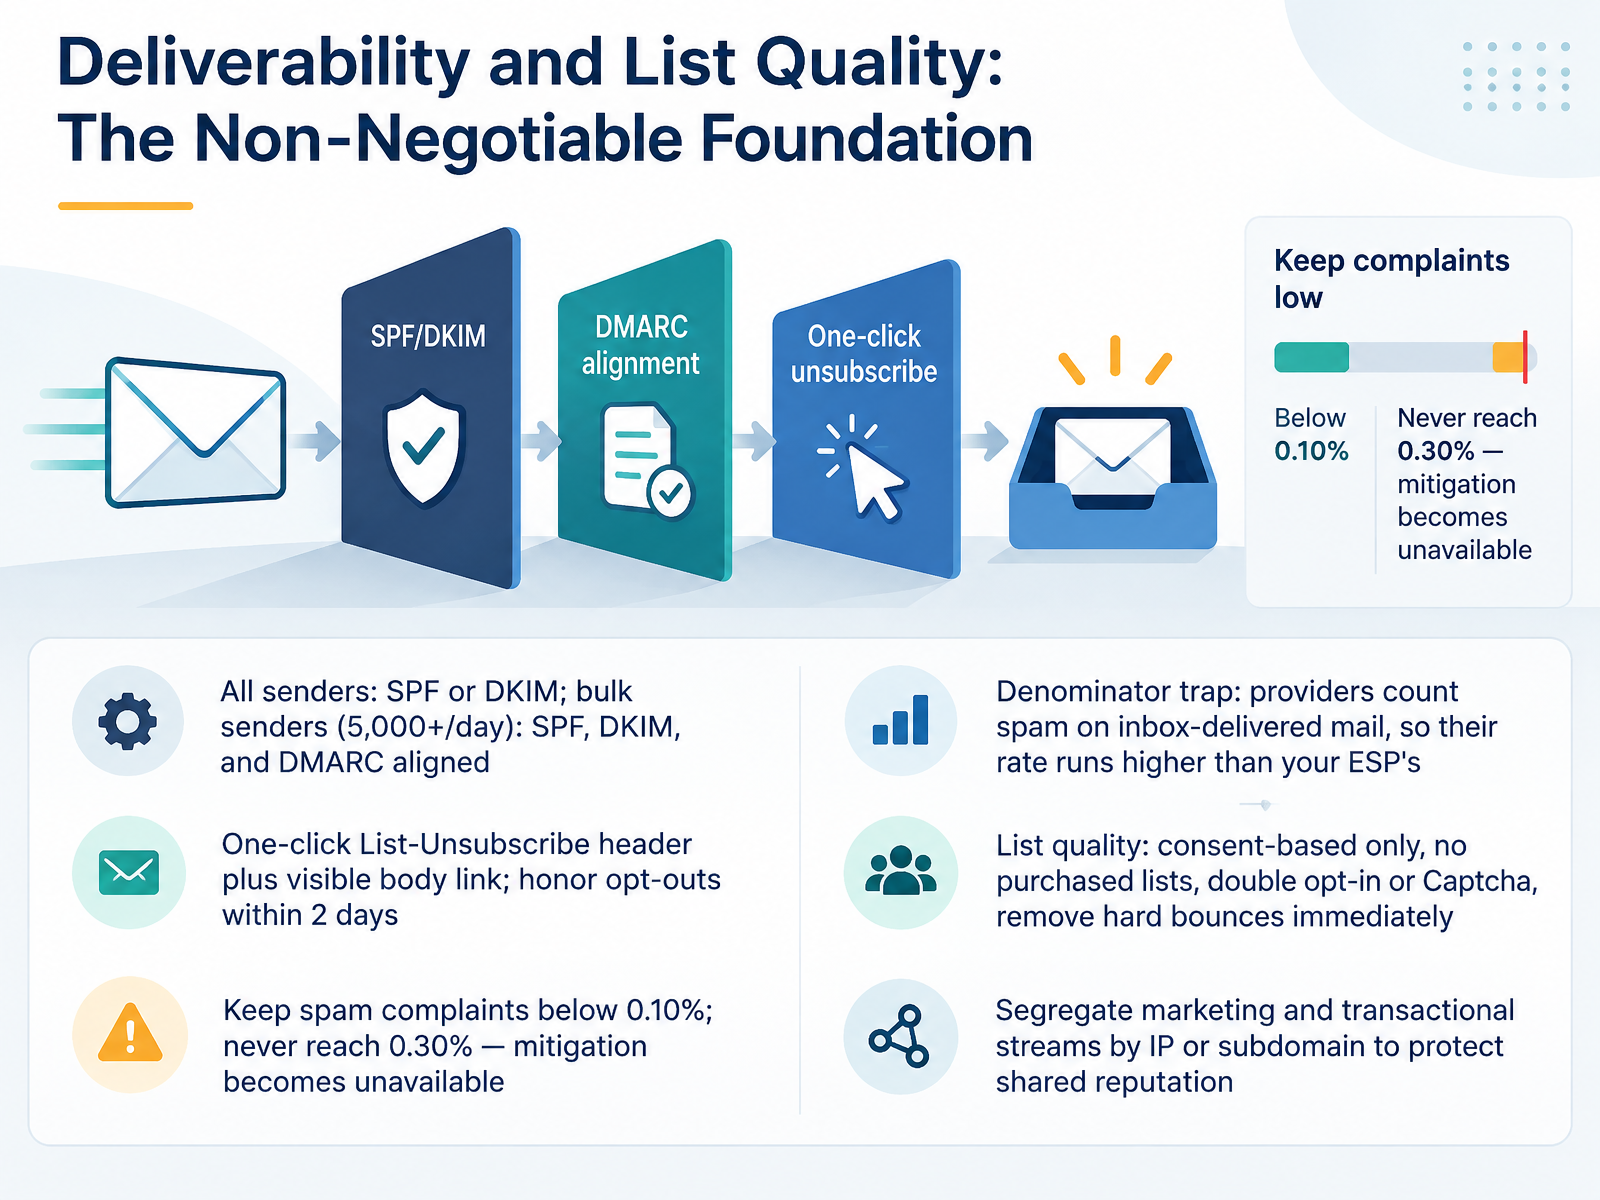
- 04Deliverability and List Quality: The Non-Negotiable FoundationNext, let's talk about deliverability and list quality, the foundation everything else depends on. First, authentication. Every sender needs S P F or D K I M. If you send five thousand or more messages a day, you also need D M A R C, and it has to pass alignment. Second, unsubscribe. Marketing and subscribed messages need a one-click List-Unsubscribe header plus a visible link in the body, and you must honor opt-outs within two days. Third, spam complaints. Keep yours below zero point one zero percent, and never let it reach zero point three zero percent. At that level, mitigation becomes unavailable. Watch the denominator trap. Providers count complaints against inbox-delivered mail, so their rate runs higher than your E S P number. Their number is the one that counts. On list quality: consent-based sources only, no purchased lists, double opt-in or Captcha at signup, and remove hard bounces immediately. Finally, separate marketing and transactional streams by IP or subdomain so a bad campaign doesn't damage shared reputation. So before you plan your next send, review authentication, unsubscribe handling, and complaint rate. Next, we'll look at what drives effectiveness: segmentation and personalization.
 support.google.comsupport.google.comsenders.yahooinc.com+22 min
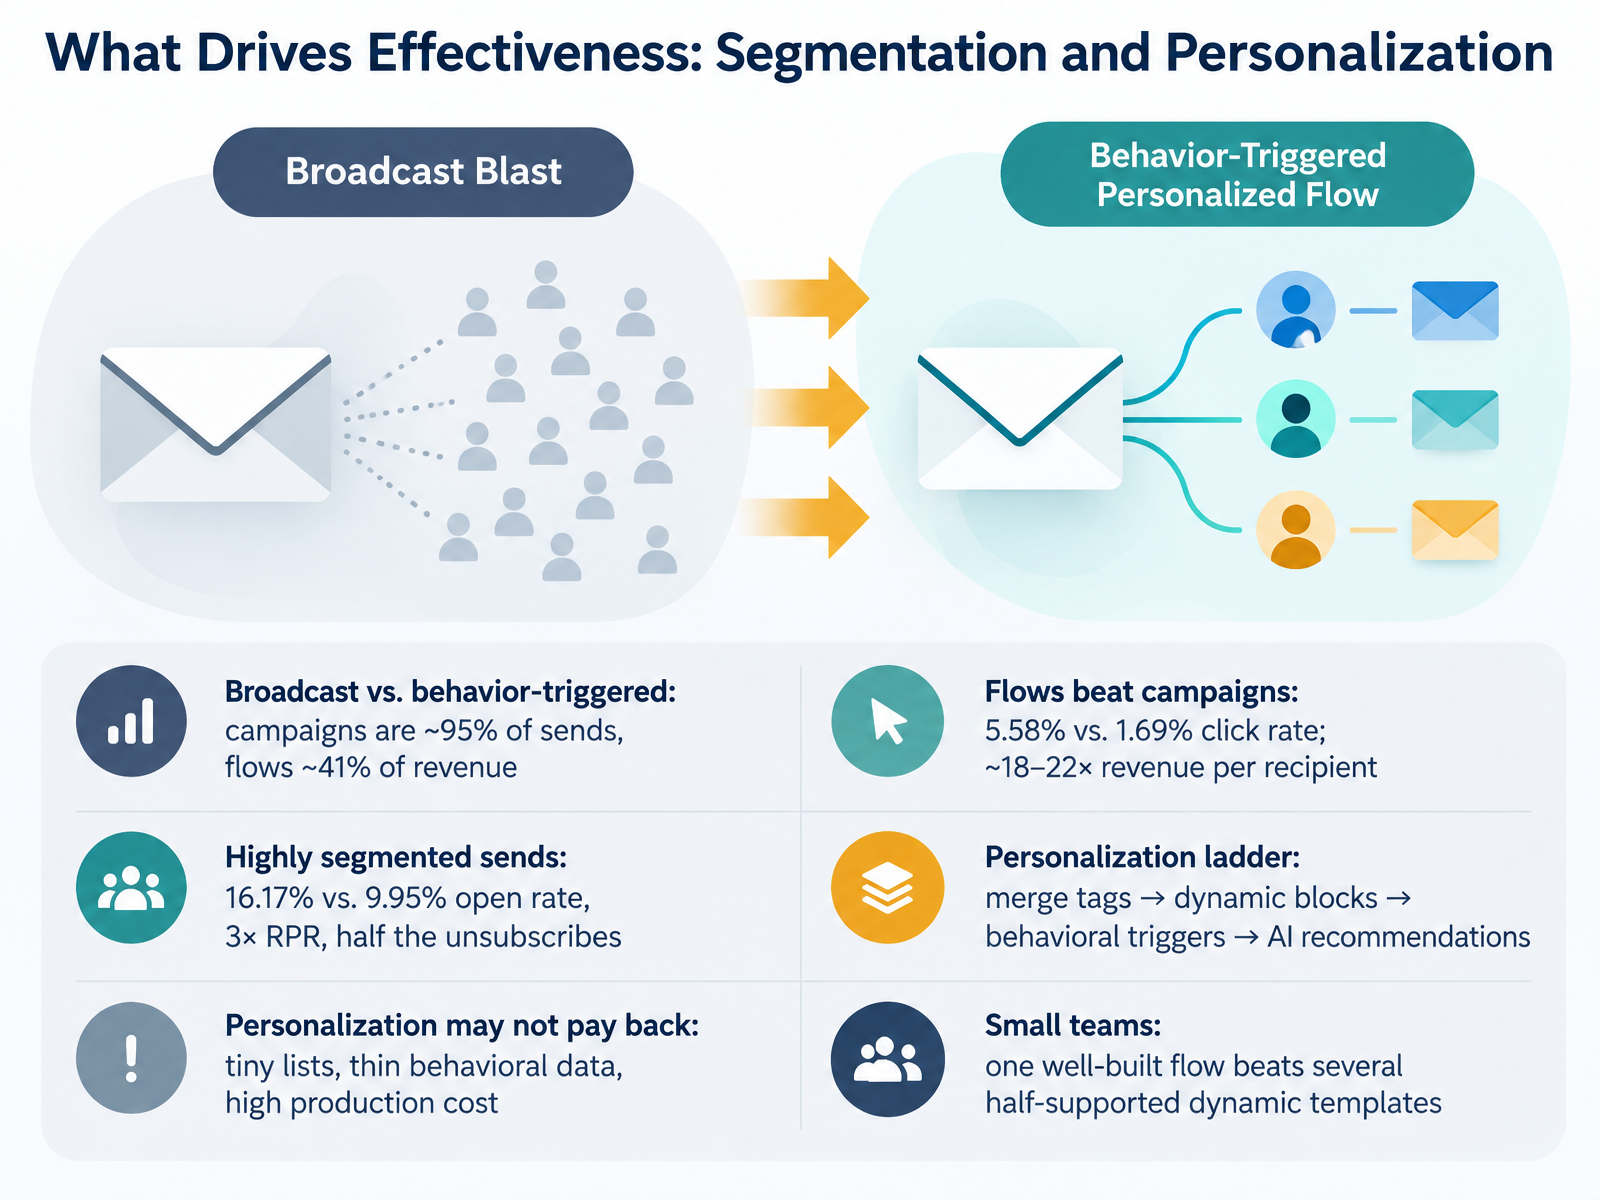
- 05What Drives Effectiveness: Segmentation and PersonalizationNow let's look at what actually drives effectiveness: segmentation and personalization. Start with the numbers. Campaigns are roughly ninety-five percent of sends but flows drive about forty-one percent of revenue. Flows click at five point five eight percent versus one point six nine percent for campaigns, and they earn roughly eighteen to twenty-two times more revenue per recipient. Highly segmented sends open at sixteen point one seven percent versus nine point nine five, return three times the revenue per recipient, and unsubscribe at half the rate. So how far do you personalize? Climb the ladder: merge tags first, then dynamic blocks, then behavioral triggers, then A I recommendations. But personalization may not pay back on tiny lists, thin behavioral data, or high production cost. For small teams, one well-built flow beats several half-supported dynamic templates. Next, we go to lifecycle flows, where the highest leverage lives.
 klaviyo.comklaviyo.comwebfx.com+22 min
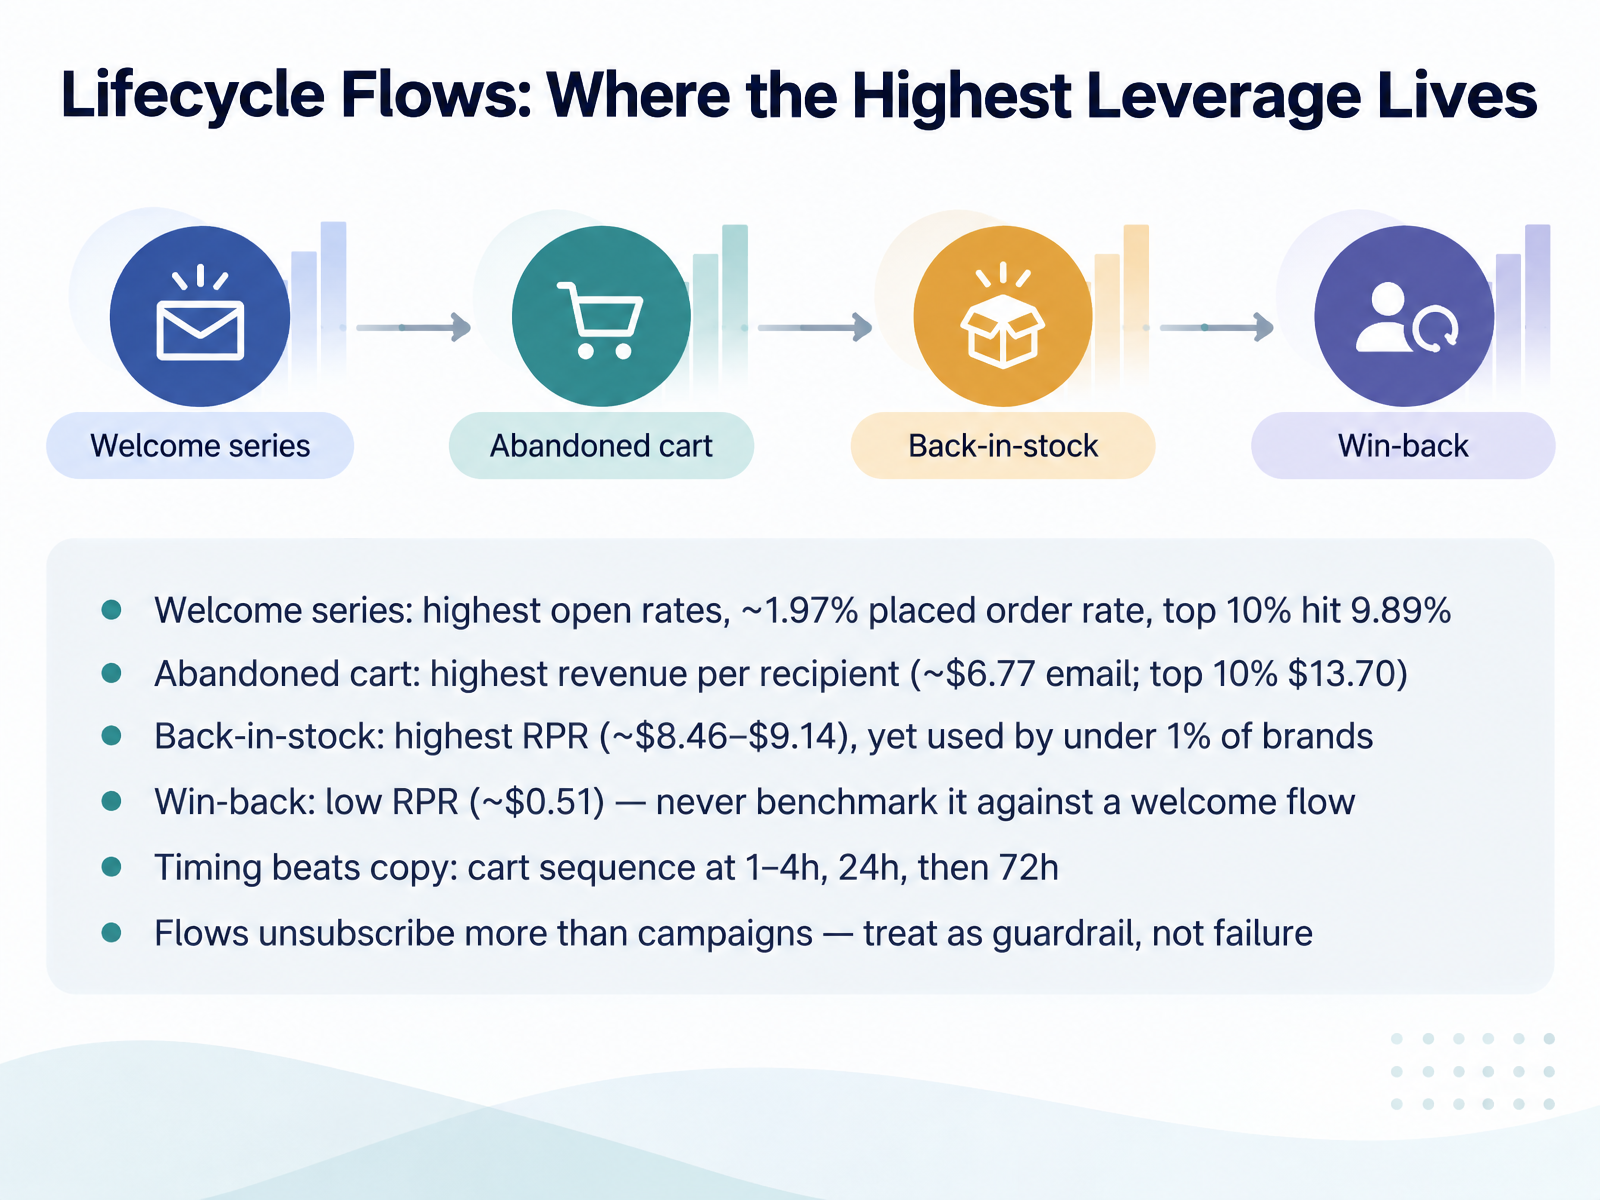
- 06Lifecycle Flows: Where the Highest Leverage LivesNow let's look at lifecycle flows, where the highest leverage lives. Welcome series win on engagement. Average placed order rate is one point nine seven percent, and the top ten percent hit nine point eight nine percent. Abandoned cart flows win on revenue. Average revenue per recipient is six dollars and seventy seven cents, and the top ten percent reach thirteen dollars and seventy cents. Back in stock has the highest revenue per recipient, roughly eight to nine dollars, yet fewer than one percent of brands use it. Win back sits near fifty one cents, so never benchmark it against a welcome flow. Timing beats copy in cart sequences. Send at one to four hours, again at twenty four hours, then at seventy two. And expect flows to unsubscribe more than campaigns. Treat that as a guardrail, not a failure. Next, Beyond the Open: Measuring Real Business Impact.
 1 min
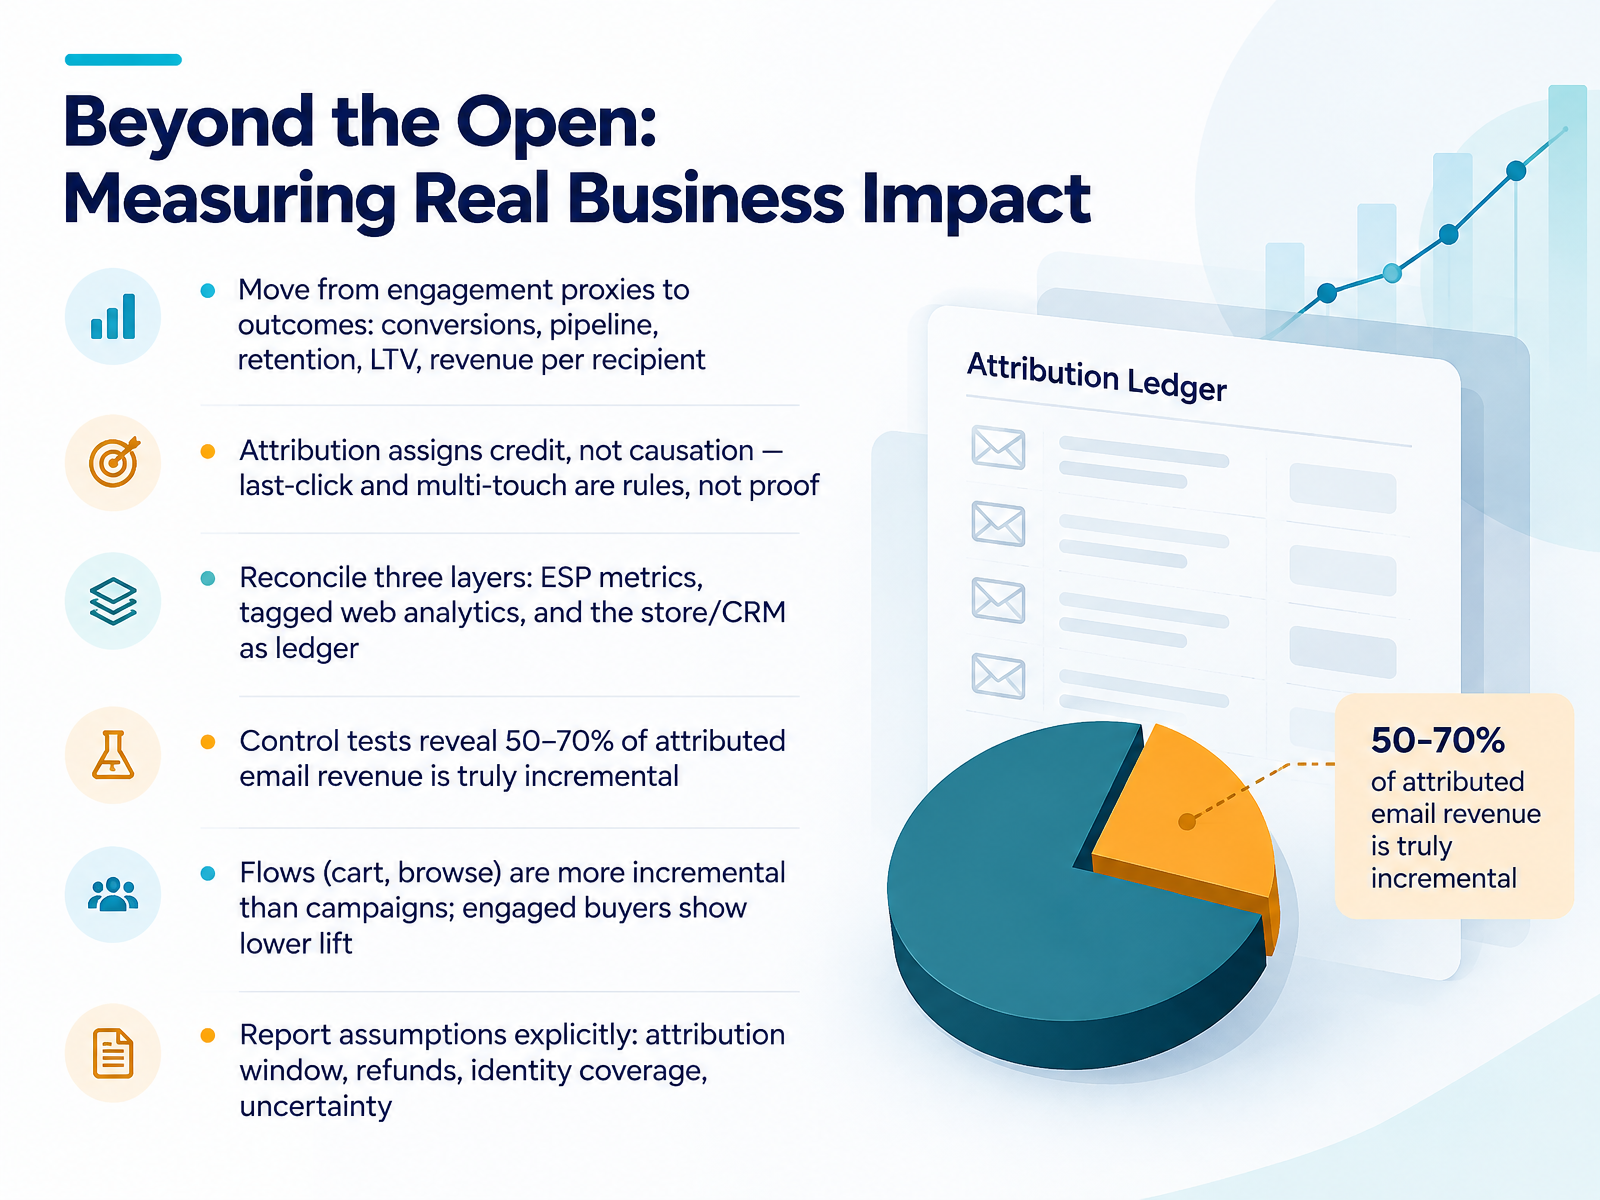
- 07Beyond the Open: Measuring Real Business ImpactNow let's move beyond the open and measure real business impact. Start by trading engagement proxies for outcomes: conversions, pipeline, retention, lifetime value, and revenue per recipient. Next, remember that attribution assigns credit, not causation. Last-click and multi-touch are rules, not proof. So reconcile three layers: your email service provider's metrics, tagged web analytics, and the store or CRM as the ledger. To find what email actually caused, run control tests. In practice, they reveal that only fifty to seventy percent of attributed email revenue is truly incremental. Flows like cart and browse abandonment tend to be more incremental than campaigns, and engaged buyers show lower lift because they would buy anyway. When you report, state your assumptions explicitly: the attribution window, refund treatment, identity coverage, and uncertainty. That keeps your numbers honest and your decisions defensible. Next, we'll look at testing that produces evidence: A B and incrementality.
 2 min
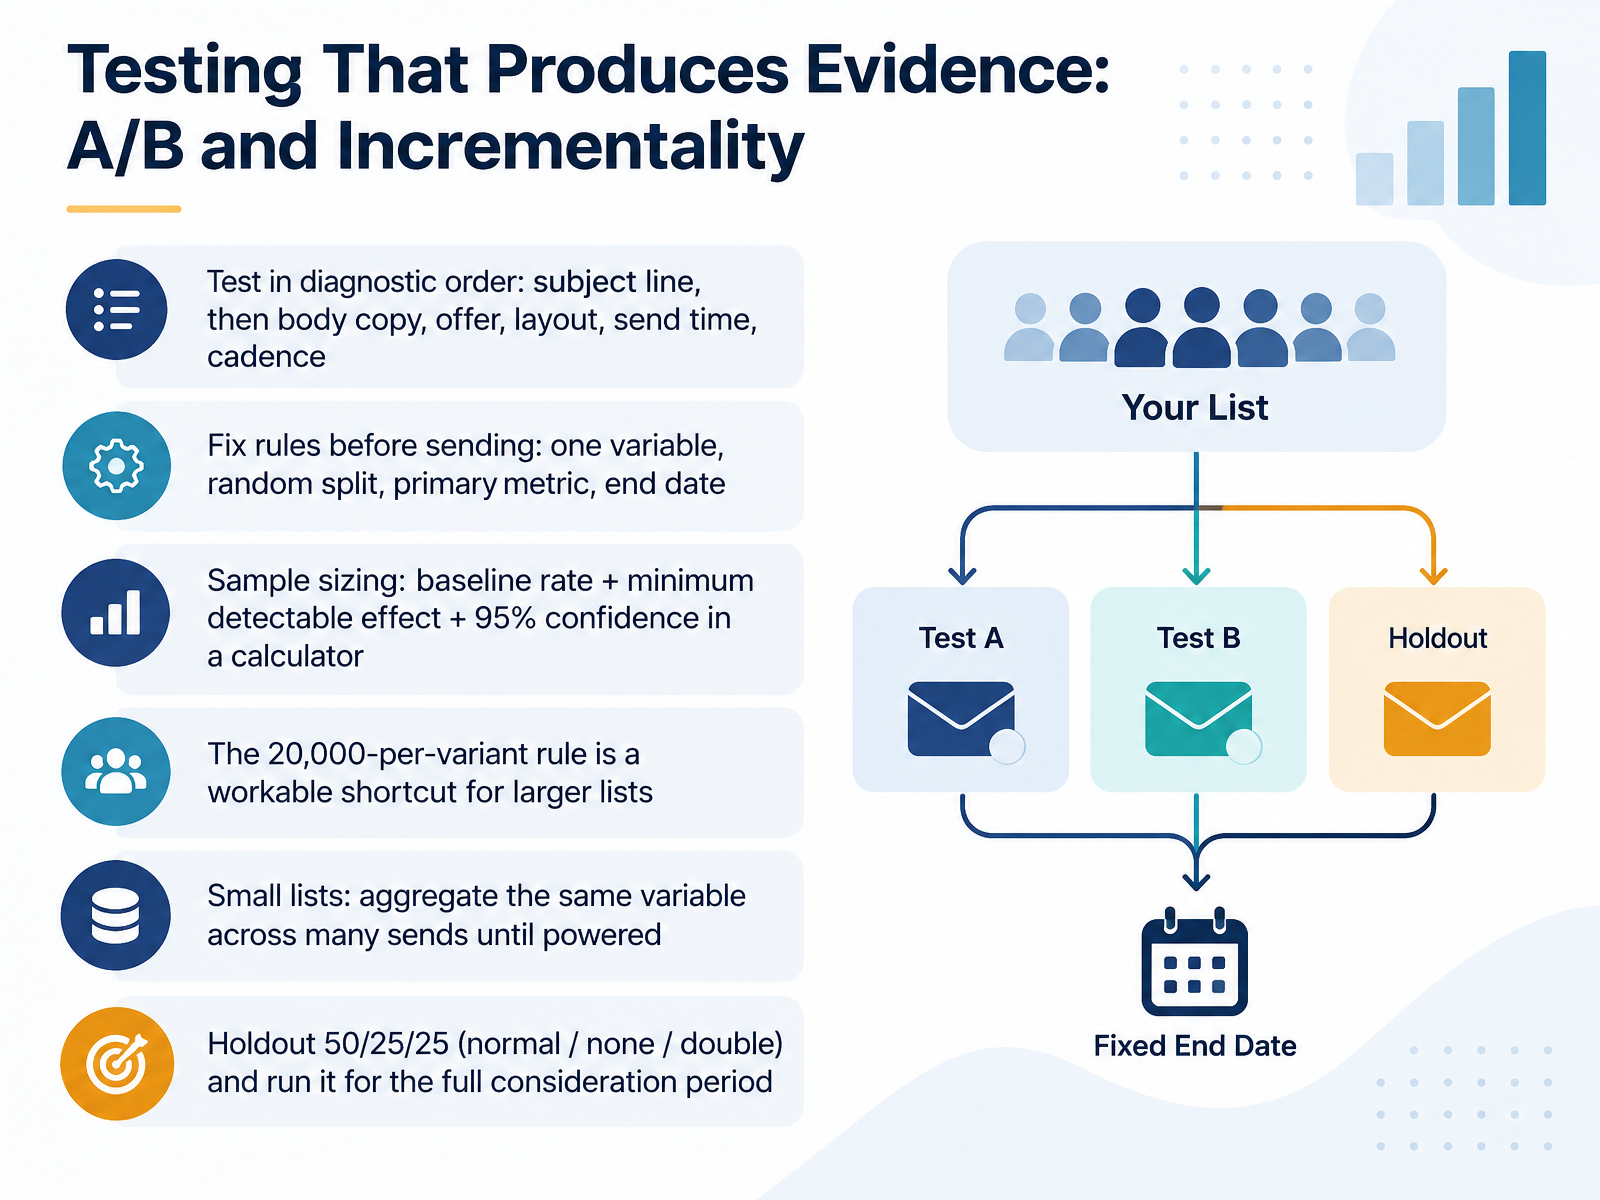
- 08Testing That Produces Evidence: A/B and IncrementalityNow let's look at testing that actually produces evidence. Test in diagnostic order. Start with the subject line, then body copy, then the offer, layout, send time, and cadence. Fix your rules before sending. One variable, a random split, a primary metric, and an end date. To size your sample, plug your baseline rate, your minimum detectable effect, and ninety-five percent confidence into a calculator. For larger lists, a practical shortcut is about twenty thousand recipients per variant. If your list is small, aggregate the same variable across many sends until you are powered. For incrementality, use a holdout split of fifty, twenty-five, twenty-five: normal, none, and double. Run it for the full consideration period, not just a few days. Next, we'll move into content, cadence, and timing as optimization levers.
 2 min
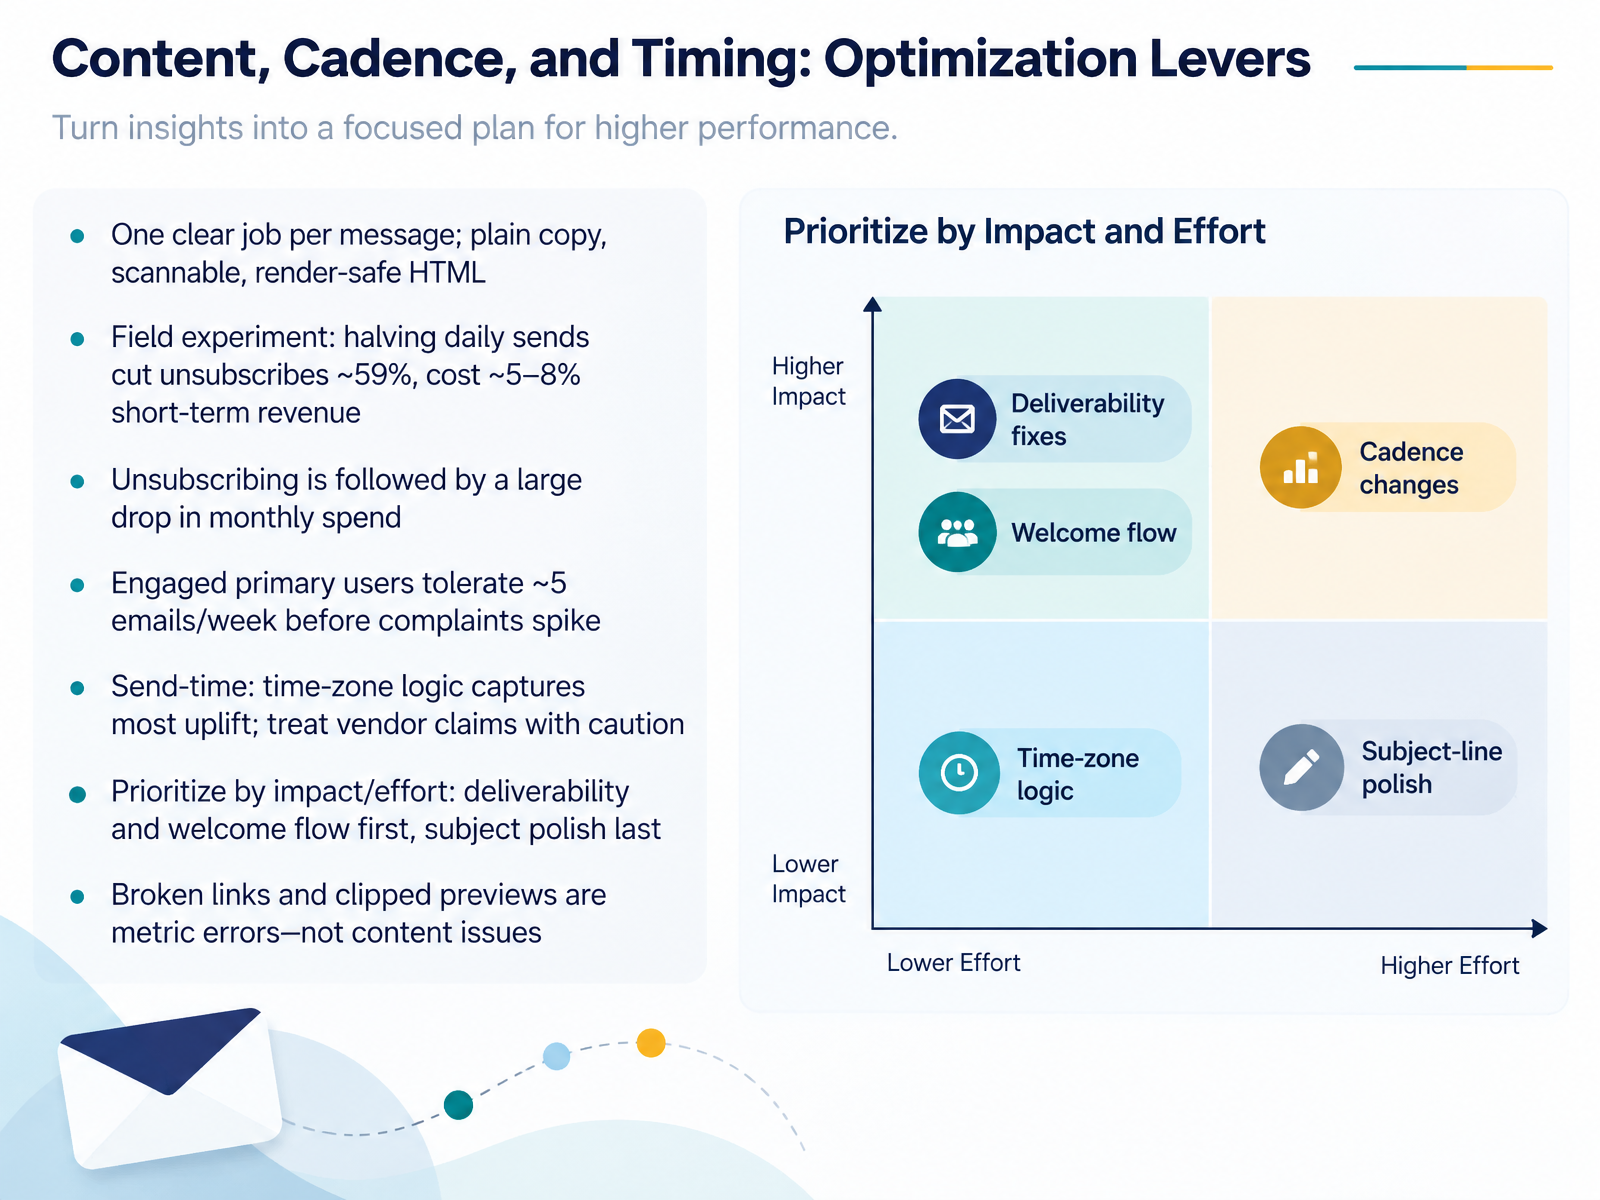
- 09Content, Cadence, and Timing: Optimization LeversNow let's look at the optimization levers you actually control: content, cadence, and timing. Give each message one clear job. Write plain copy, make it scannable, and keep your HTML render-safe. In one field experiment, halving daily sends cut unsubscribes by fifty-nine percent, at a cost of five to eight percent in short-term revenue. And unsubscribing is followed by a large drop in monthly spend, so retention matters. Engaged primary users tolerate about five emails per week before complaints spike. On send time, time-zone logic captures most of the uplift, so treat vendor claims with caution. Prioritize by impact and effort: fix deliverability and your welcome flow first, polish subject lines last. And remember, broken links and clipped previews are metric errors, not content issues. Next, we move on to Building an Effectiveness Scorecard.
 1 min
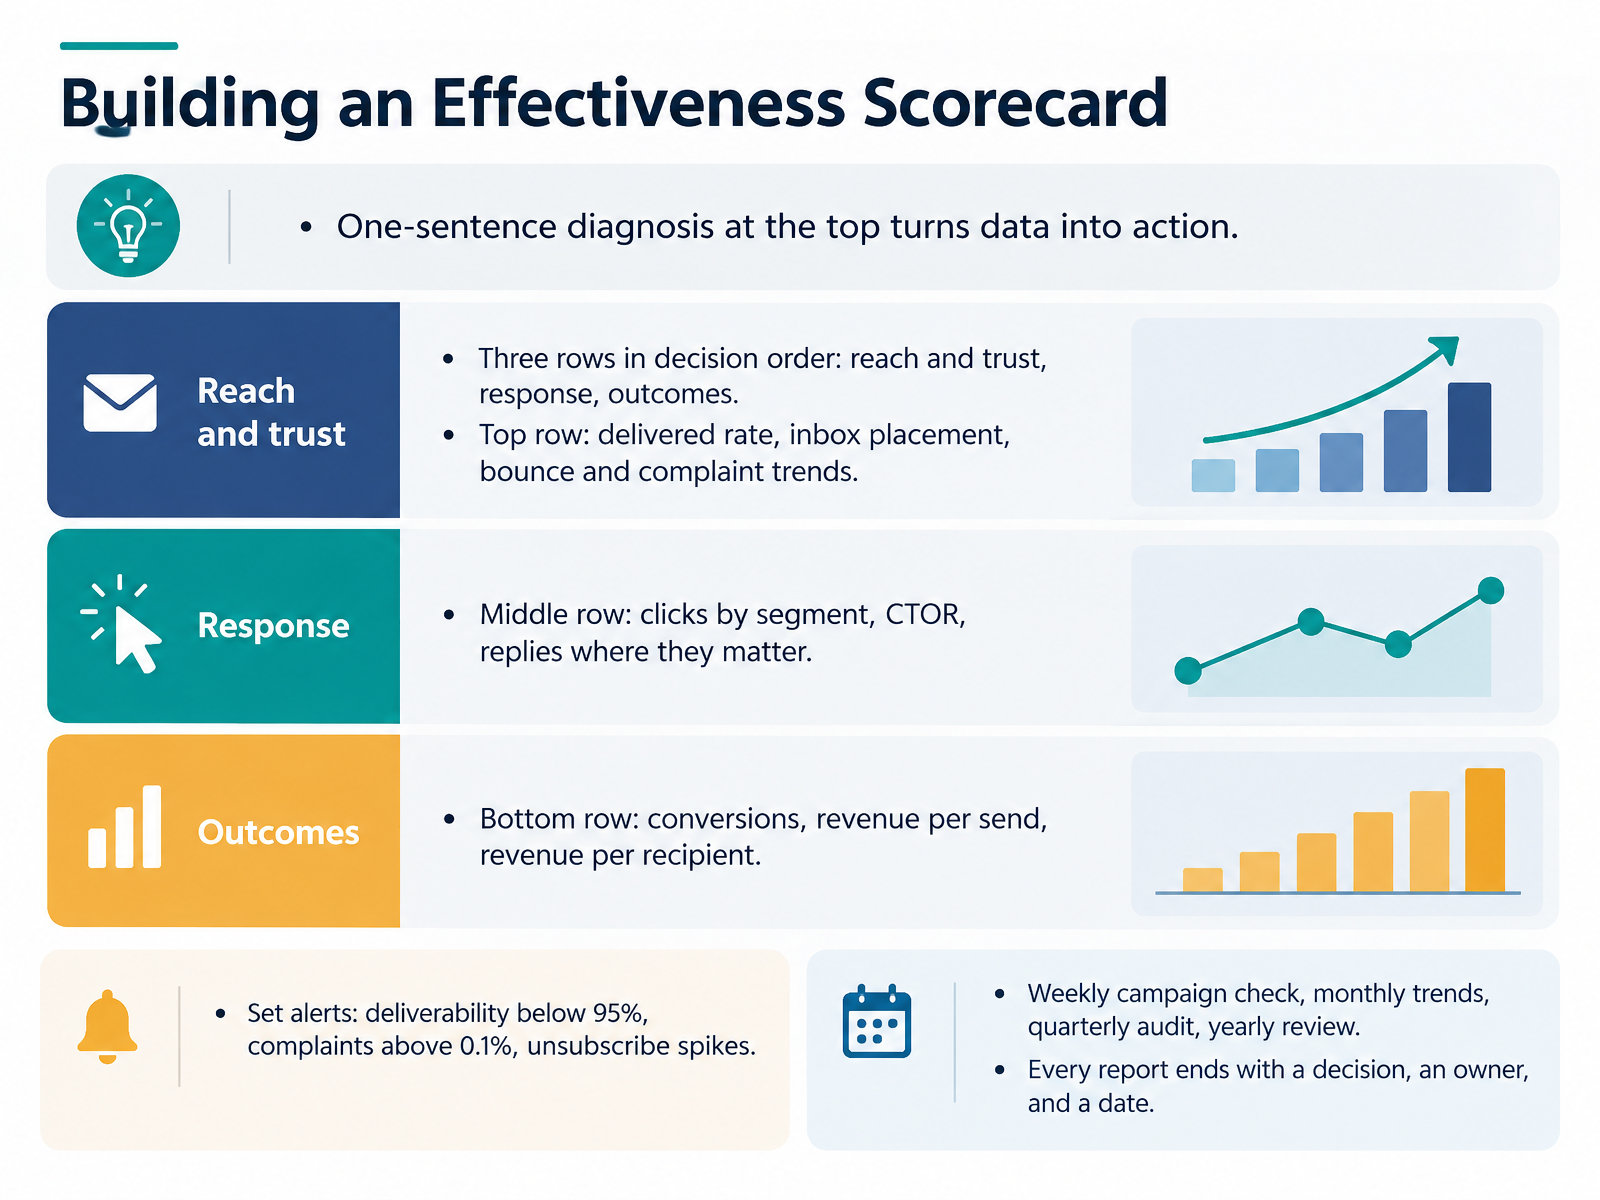
- 10Building an Effectiveness ScorecardNow let's turn these metrics into a scorecard you will actually use. Build it in three rows, in decision order. Top row is reach and trust: delivered rate, inbox placement, plus bounce and complaint trends. Middle row is response: clicks by segment, click to open rate, short for CTOR, which is clicks divided by opens, and replies where they matter. Bottom row is outcomes: conversions, revenue per send, and revenue per recipient. Put one sentence at the top that diagnoses the day, like revenue fell because Gmail inbox placement dropped for the promo segment. That turns data into action. Set alerts: deliverability below ninety five percent, complaints above zero point one percent, and unsubscribe spikes. Run a weekly campaign check, monthly trends, a quarterly audit, and a yearly review. And end every report with a decision, an owner, and a date. That habit alone keeps your scorecard accountable. Next, we will look at communicating effectiveness to leadership and clients.
 2 min
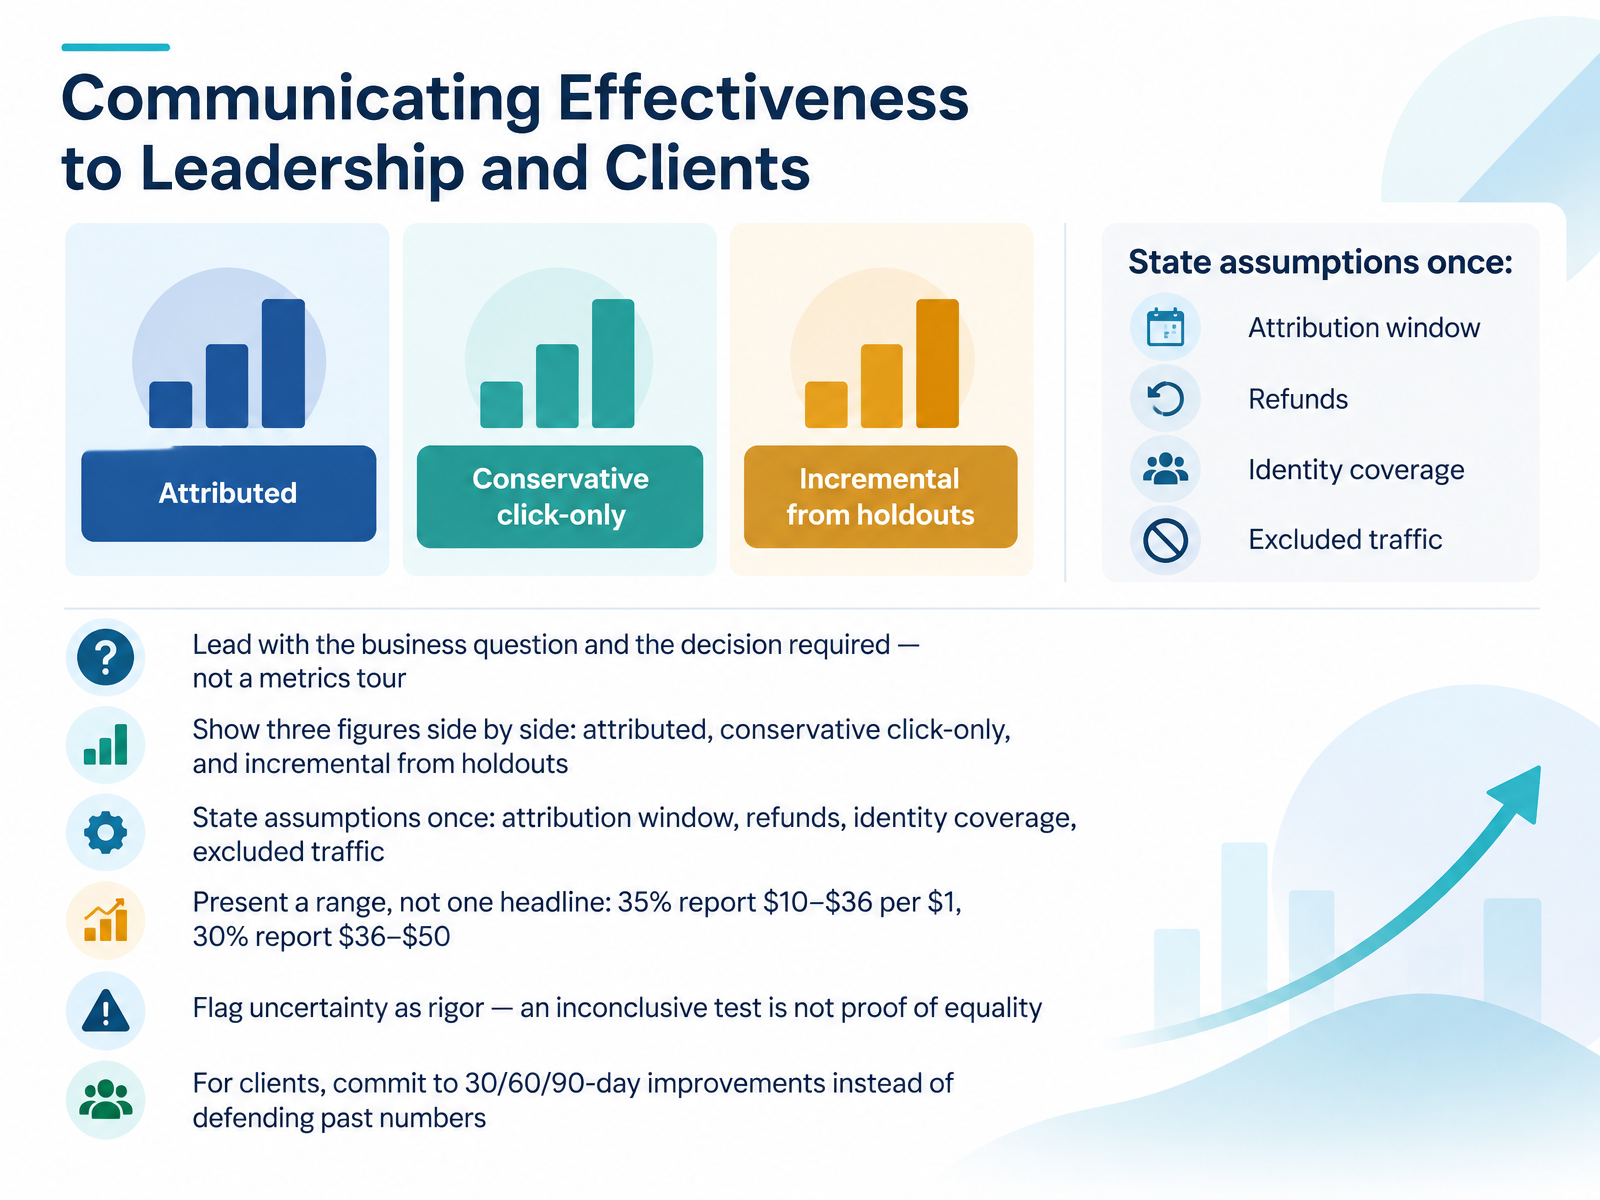
- 11Communicating Effectiveness to Leadership and ClientsNow let's talk about communicating effectiveness to leadership and clients. Lead with the business question and the decision required, not a metrics tour. Show three figures side by side: attributed, conservative click-only, and incremental from holdouts. State your assumptions once: attribution window, refunds, identity coverage, and excluded traffic. Present a range, not one headline number. In Litmus's 2025 survey, thirty-five percent of marketers reported ten to thirty-six dollars per one dollar spent, and thirty percent reported thirty-six to fifty. Flag uncertainty as rigor. An inconclusive test is not proof of equality. For clients, commit to thirty, sixty, and ninety-day improvements instead of defending past numbers. Up next, diagnosing your program with a step-by-step audit.
 1 min
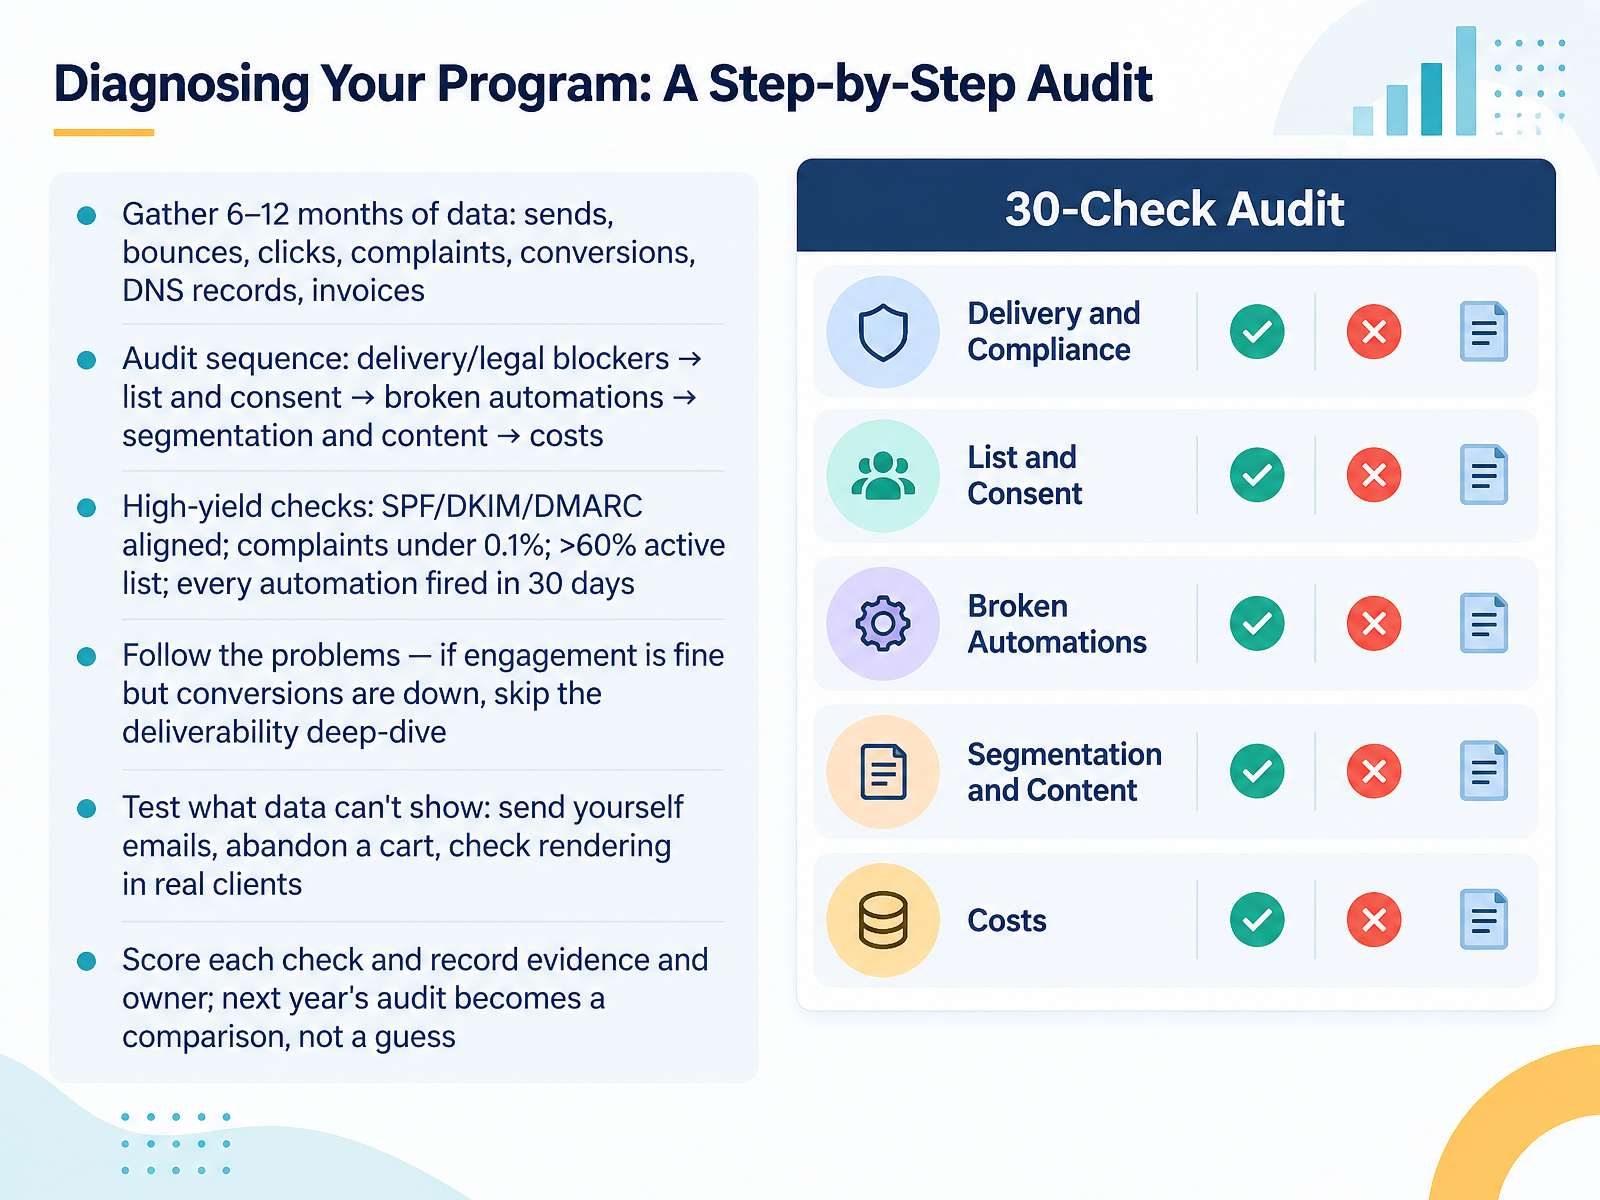
- 12Diagnosing Your Program: A Step-by-Step AuditNow let's run a proper audit. Pull six to twelve months of data: sends, bounces, clicks, complaints, conversions, DNS records, and invoices. Work in order. Fix delivery and legal blockers first. Then list and consent. Then broken automations. Then segmentation and content. Costs come last. Prioritize high-yield checks. S P F, D K I M, and D M A R C must be aligned. Complaints should stay under zero point one percent. More than sixty percent of your list should be active. Every automation should have fired in the last thirty days. Follow the problems. If engagement is fine but conversions are down, skip the deliverability deep-dive. Test what data can't show. Send yourself the emails, abandon a cart, and check rendering in real clients. Score each check, and record evidence and an owner. Next year's audit becomes a comparison, not a guess. Next, your thirty, sixty, ninety day improvement plan.
 2 min
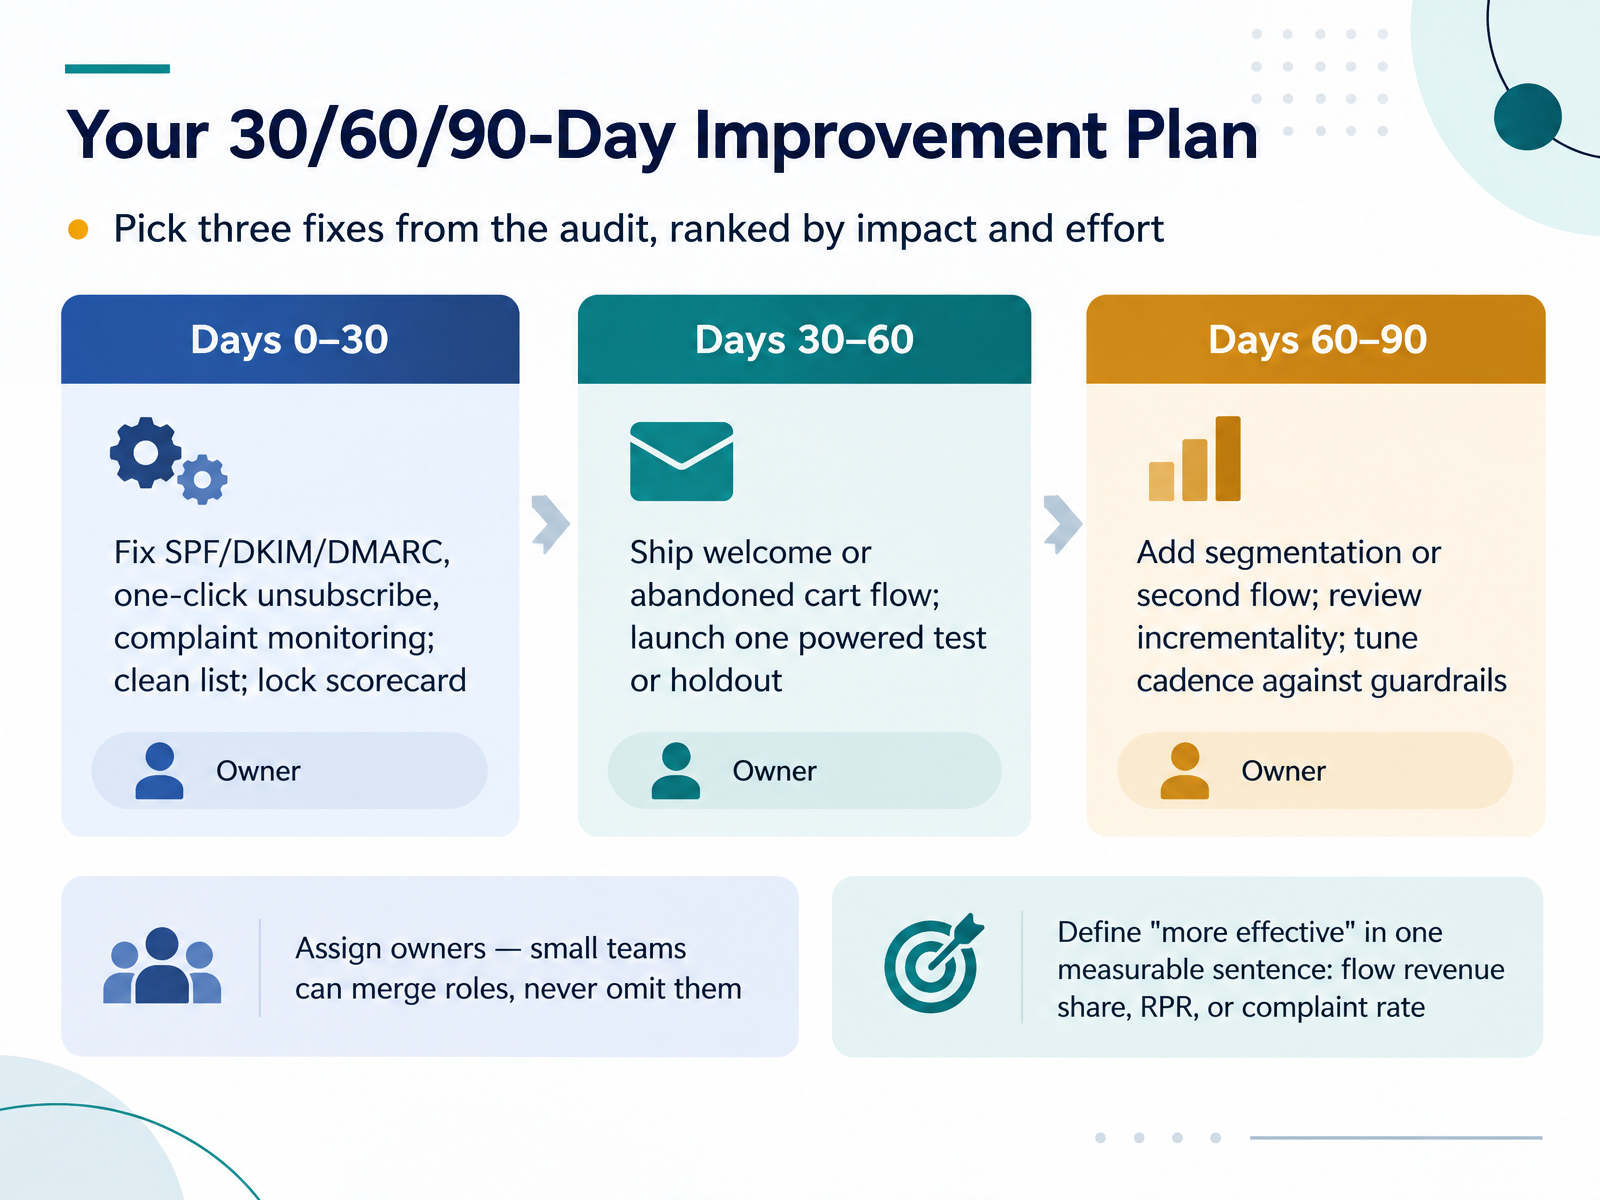
- 13Your 30/60/90-Day Improvement PlanNow let's turn your audit findings into a ninety-day plan. Pick three fixes, ranked by impact and effort. In the first thirty days, repair the fundamentals. Publish SPF, DKIM and DMARC, enable one-click unsubscribe, and monitor complaints against the under zero point one percent target. Clean your list, then lock your scorecard so results stay comparable. From day thirty to sixty, ship a welcome or abandoned cart flow, and launch one powered test or a holdout. Between day sixty and ninety, add segmentation or a second flow, review incrementality, and tune cadence against your guardrails. Assign an owner to every task. Small teams can merge roles, but never omit them. Finally, define more effective in one measurable sentence, whether that's flow revenue share, revenue per recipient, or complaint rate. With that, let's move on to Key Takeaways and Knowledge Check.
 2 min
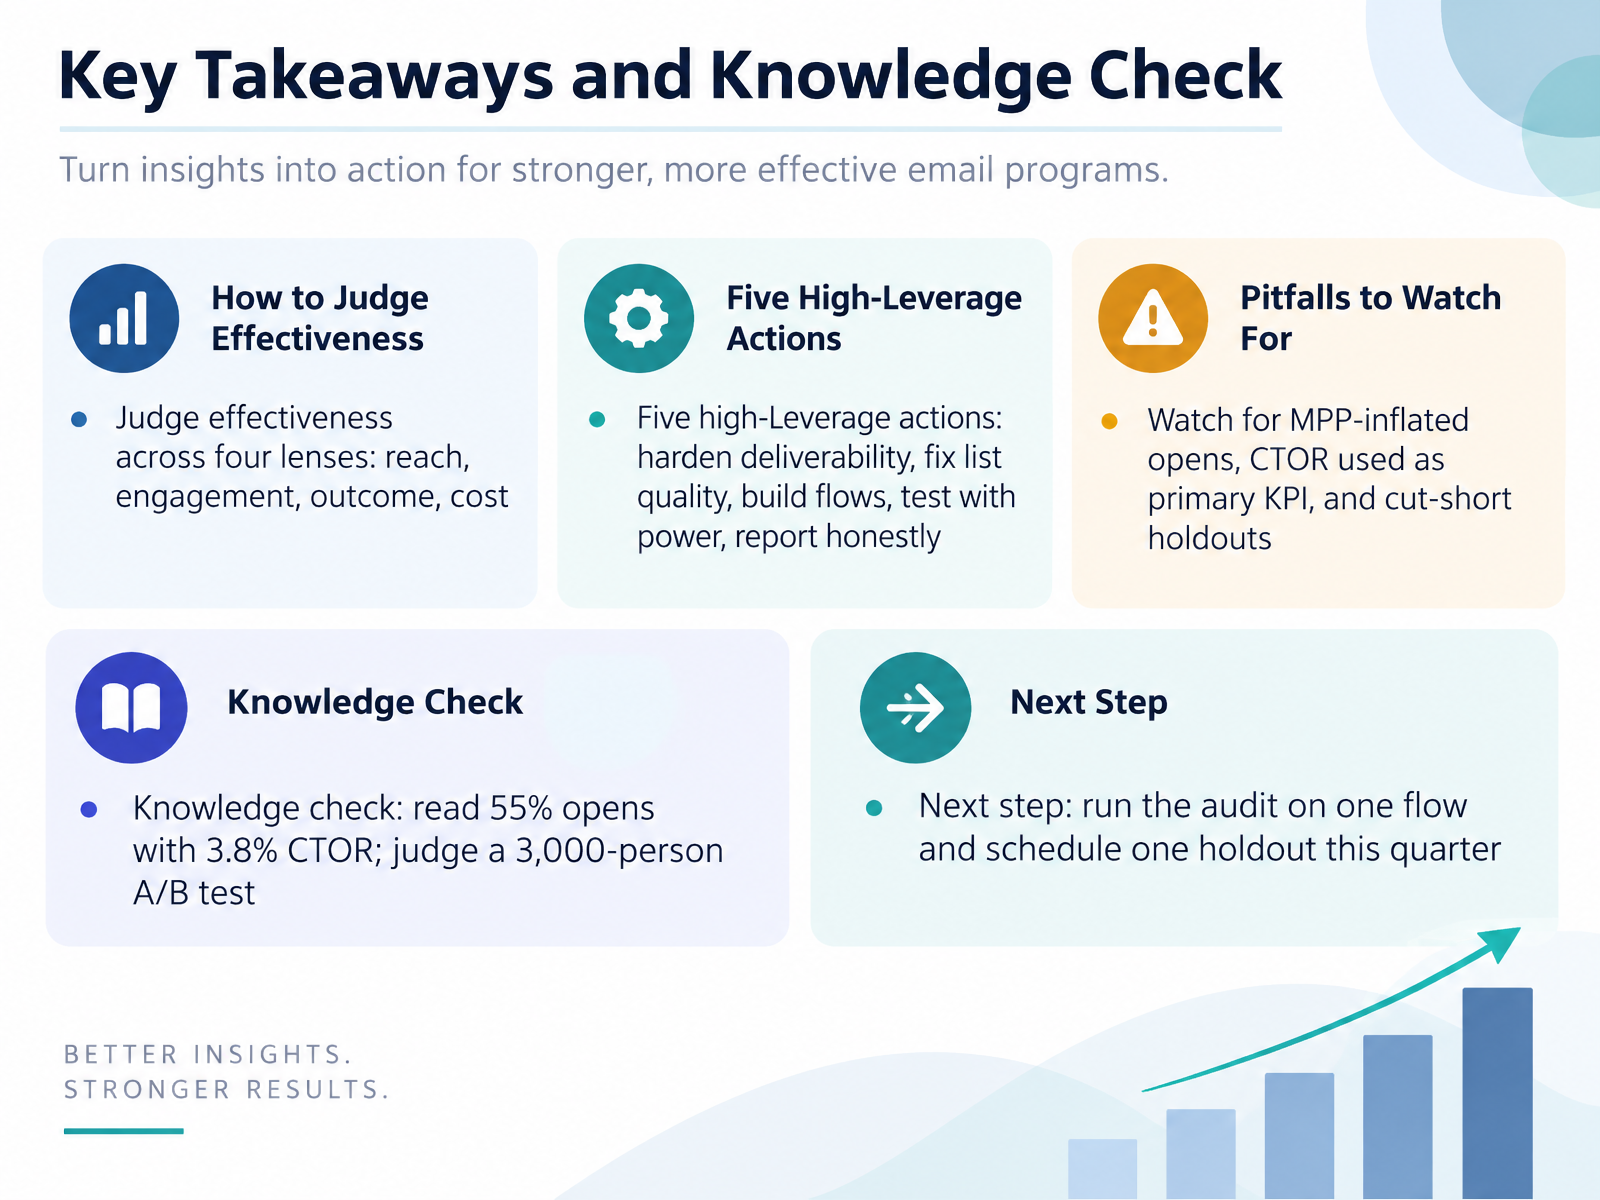
- 14Key Takeaways and Knowledge CheckLet's bring this together. Judge effectiveness across four lenses: reach, engagement, outcome, and cost. Then act on five high-leverage moves: harden deliverability, fix list quality, build flows, test with power, and report honestly. Watch for three traps. Mailbox privacy features inflate opens. A B2C benchmark of fifty-five percent opens with a three point eight percent click-to-open rate shows the gap. So treat click-to-open as a content-testing tool, not your primary KPI. And never cut a holdout short. Here's your knowledge check. That fifty-five and three point eight pairing tells you the opens are inflated, so trust clicks and conversions instead. For a three thousand person A/B test, split it evenly, look for a large effect, and accept that it may be underpowered for a small lift. Your next step: run the audit on one flow, and schedule one holdout this quarter. Thank you for joining. You now have a measurement framework worth defending. Go put it to work.
 salesforce.comlitmus.comdocumentation.bloomreach.com+22 min
Take the deck with you
Download this course as a file — free, no sign-up needed.
- PDF handoutEvery slide page, ready to print or share.15 pages · 3.2 MBDownload
- Narrated PowerPointThe deck that presents itself — every slide carries the digital human's narration video.15 pages · 12.8 MBDownload
- PowerPoint slidesThe full deck as a .pptx — open it in PowerPoint, Keynote, or Google Slides.15 pages · 3.2 MBDownload
Free to use in your own training — please keep the PersonWise credit page at the end.
Have your own deck? Turn it into a course
Sources consulted
Web sources consulted while building this course.
- State of Email Reports 2025-2026: Email Marketing Trends — litmus.com
- 2026 Email Marketing Benchmarks by Industry - Klaviyo — klaviyo.com
- Email marketing ROI: Key stats & proven effectiveness — blog.hubspot.com
- Email Marketing Benchmarks & Industry Statistics — mailchimp.com
- TargetNXT Email Pulse 2026 — targetnxt.com
- Email Marketing Benchmarks by Industry: 2026 Data and Trends — webfx.com
- Email Marketing Benchmarks: Region & Industry Data (2026) — brevo.com
- Email Marketing Benchmark 2026: Open and Click Rates by Country and Industry | Mailpro™ — mailpro.com
- Email Marketing Industry Benchmarks | Tecuy — tecuy.com
- Email marketing benchmarks & business metrics — salesforce.com
- 22 Email Marketing Metrics to Measure Success - Litmus — litmus.com
- Email Marketing Metrics — documentation.bloomreach.com
- Email Analytics: 12 Email marketing metrics to evaluate your success | AWeber — blog.aweber.com
- The S.A.M.E. Project — emailstats.nl
- Email sender guidelines - Gmail Help — support.google.com
- Email sender guidelines FAQ - Gmail Help — support.google.com
- Sender Best Practices | Sender Hub — senders.yahooinc.com
- Mailbox Provider Roundtable: Recapping Microsoft, Gmail, and Yahoo’s Thoughts on New Bulk Sender Requirements - Validity — validity.com
- Comply with Gmail, Yahoo, and Microsoft's requirements for email senders – Home — help.brevo.com
- Email Segmentation Benchmarks - Klaviyo — klaviyo.com