Begin
14 pages · ~28 min
Customer Success Strategy: Goals and Tradeoffs
Learn to define a customer success strategy by setting goals, making strategic choices, and navigating tradeoffs for optimal impact.
A digital instructor presents all 14 pages. Hold “Ask” at any point and ask out loud — the answer comes from this course. No sign-up needed.
What you’ll learn
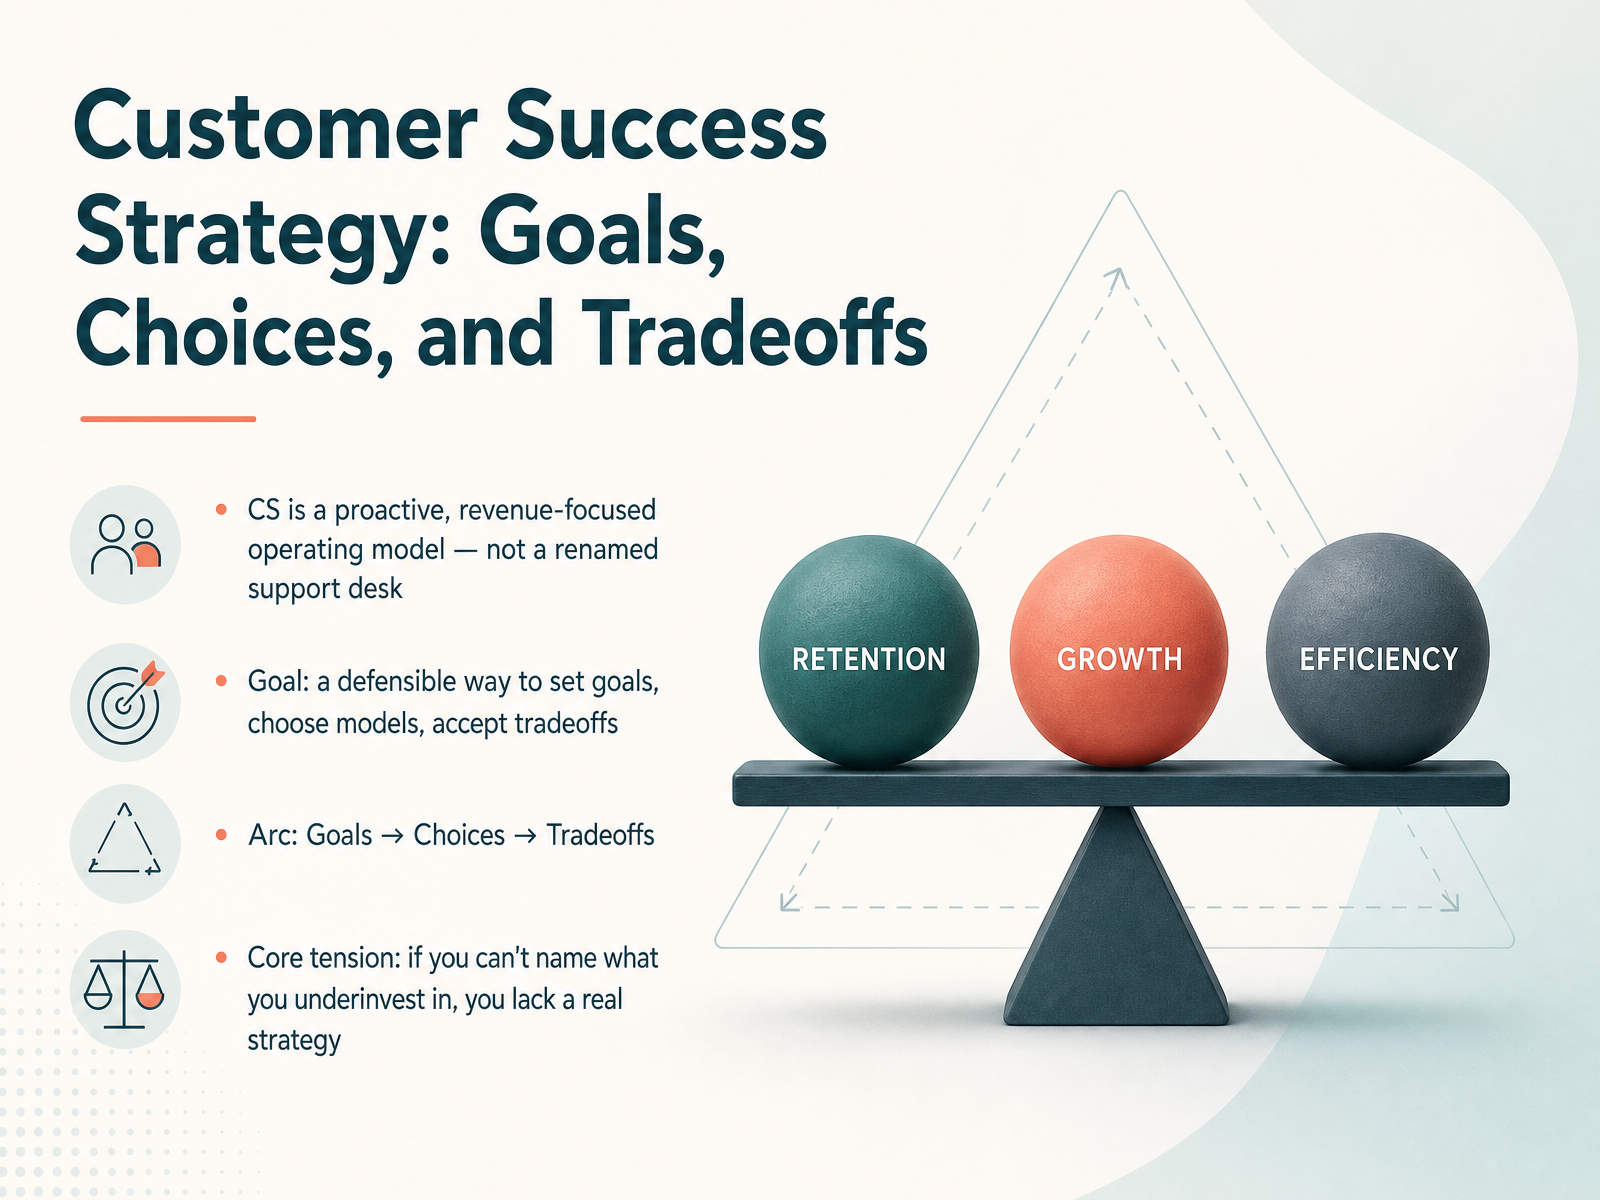
- 01Customer Success Strategy: Goals, Choices, and TradeoffsWelcome. If you're leading customer success, you already feel the pressure: rising acquisition costs, tighter budgets, and a mandate to prove your team's impact on revenue. Here's the reality. Customer success is not a renamed support desk. It is a proactive, revenue-focused operating model. This course gives you a defensible way to set goals, choose the right engagement model, and accept the tradeoffs those choices demand. We'll move through three stages: goals, choices, and tradeoffs. The core tension is this: if you can't name what you underinvest in, you don't have a real strategy. You have a wish list. So as we start, think about your own organization. What are you deliberately choosing not to do? That honest answer is where strategy begins. Let's move on to why customer success fails without explicit goals.knowledgelib.ioprocontentstudio.netfullcast.com+21 min
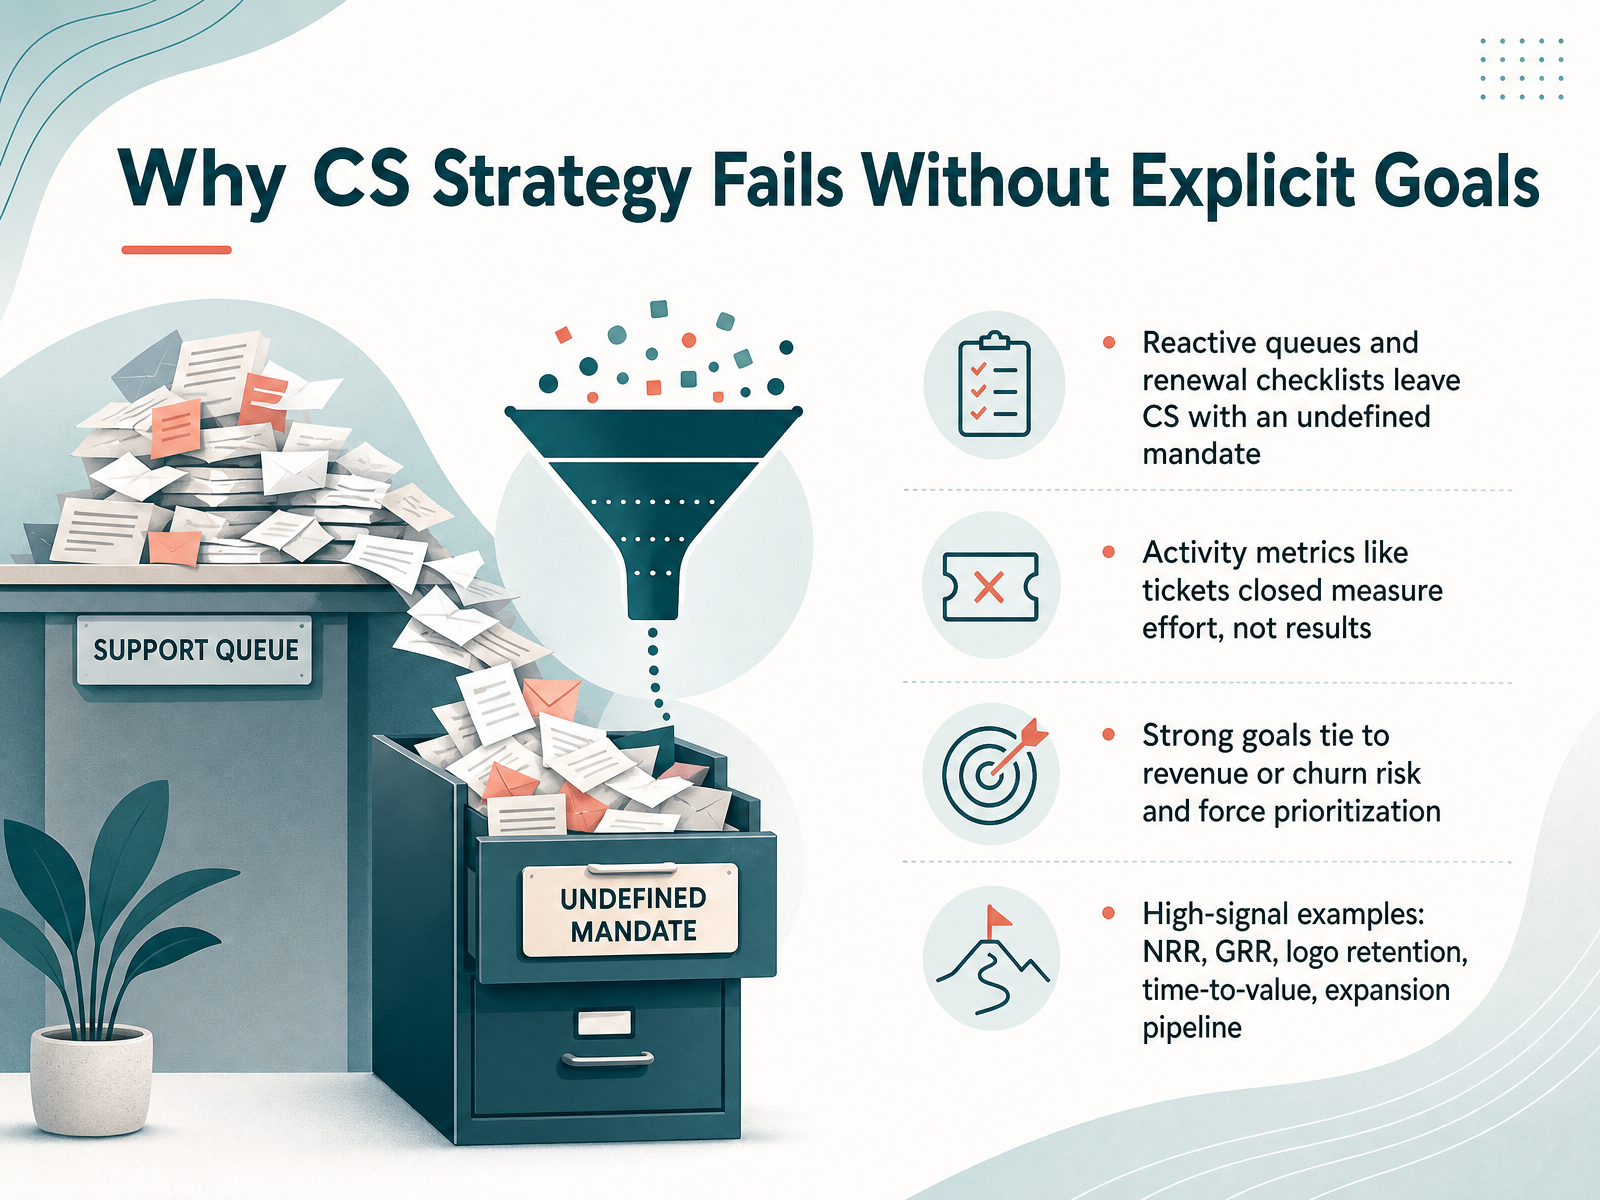
- 02Why CS Strategy Fails Without Explicit GoalsLet's be direct about why customer success strategy fails. It usually isn't a lack of effort. It's a lack of explicit goals. Without them, teams default to reactive queues and renewal checklists. That leaves the function with an undefined mandate. Everyone is busy, but no one can say what winning looks like. The second failure is measuring activity instead of results. Tracking tickets closed or check-ins completed measures effort, not outcomes. A team can close a thousand tickets and still lose the account. Strong goals tie directly to revenue or churn risk. They force prioritization because resources are always limited. That is the tradeoff. Focus on high-signal metrics. Net revenue retention shows if your base is growing. Gross revenue retention reveals the true churn story underneath. Logo retention tells you if small customers are leaking. Time to value predicts early churn more reliably than any survey. And expansion pipeline shows whether you are building growth, not just defending it. These metrics force hard choices. That is the point of strategy. Next, we will compare outcome metrics with activity metrics directly.
 knowledgelib.ioprocontentstudio.netfullcast.com+22 min
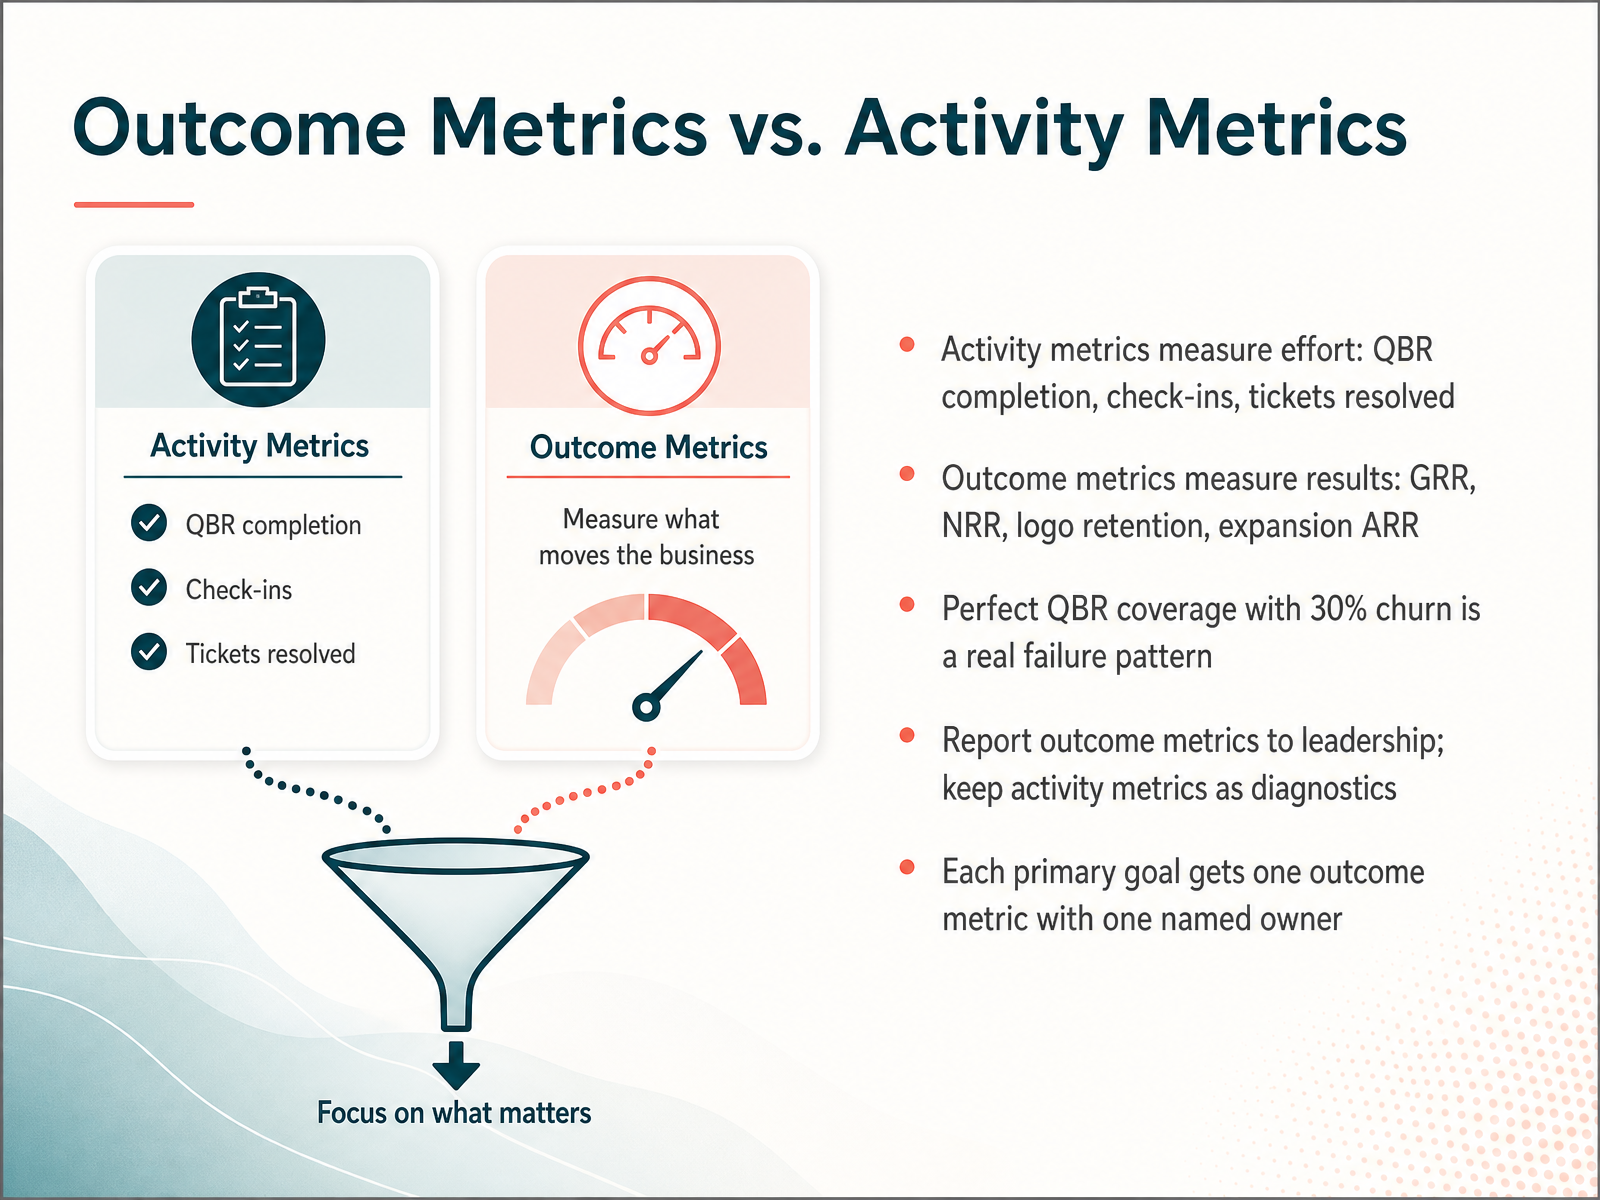
 - 03Outcome Metrics vs. Activity MetricsNow let's talk about the difference between outcome metrics and activity metrics. Activity metrics measure effort: how many QBRs you completed, how many check-ins you had, how many tickets you resolved. Outcome metrics measure results: gross revenue retention, net revenue retention, logo retention, expansion revenue. Here's the hard truth: a team can have perfect QBR coverage and still lose thirty percent of its customers in a year. The activity was there; the outcome was not. That's a failure pattern you cannot afford. So when you report to leadership, lead with outcome metrics. Keep activity metrics as diagnostics, things you check to understand why an outcome moved. And for each primary goal, choose one outcome metric and assign one named owner. That's the discipline. The next choice is the core tradeoff: retention, growth, and efficiency.
 themarketingjuice.comgrowthlayer.appblog.hubspot.com+21 min
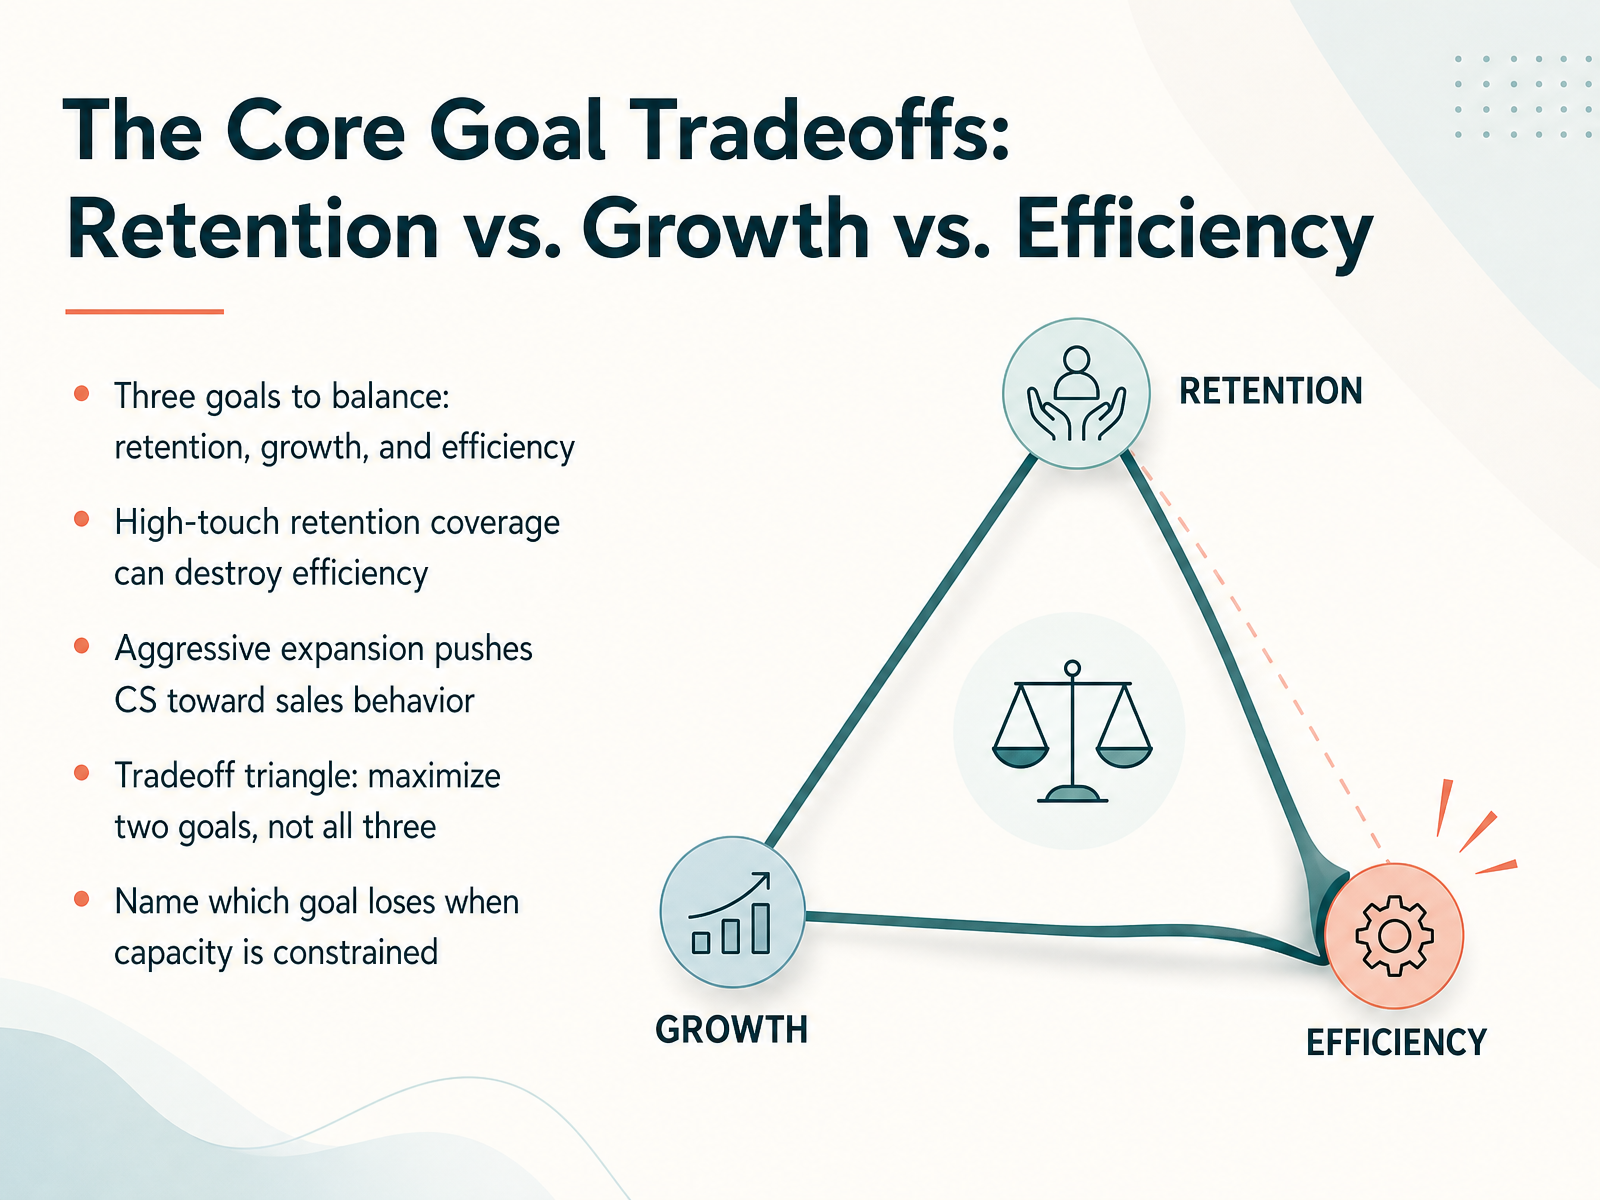
 - 04The Core Goal Tradeoffs: Retention vs. Growth vs. EfficiencyNow let's address the core tradeoff. Customer success is pulled in three directions at once: retention, growth, and efficiency. You want to keep customers, you want to expand them, and you want to do it without your costs spiraling. The reality is you cannot maximize all three. High-touch retention coverage on every account destroys efficiency. That level of service is expensive, and most accounts don't need it. On the other hand, aggressive expansion pushes your CS team into sales behavior, which can erode trust and damage retention. Think of it as a triangle. You can maximize two of these goals, but not all three. The disciplined approach is to name which goal loses when capacity is constrained. For most teams, especially with limited resources, that is efficiency. You accept a slightly higher cost to serve in exchange for stronger retention and growth. Naming that tradeoff explicitly is what turns an ad hoc decision into a deliberate strategy. Up next, we discuss strategic choice one: segmentation before coverage.
 knowledgelib.ioprocontentstudio.netfullcast.com+21 min
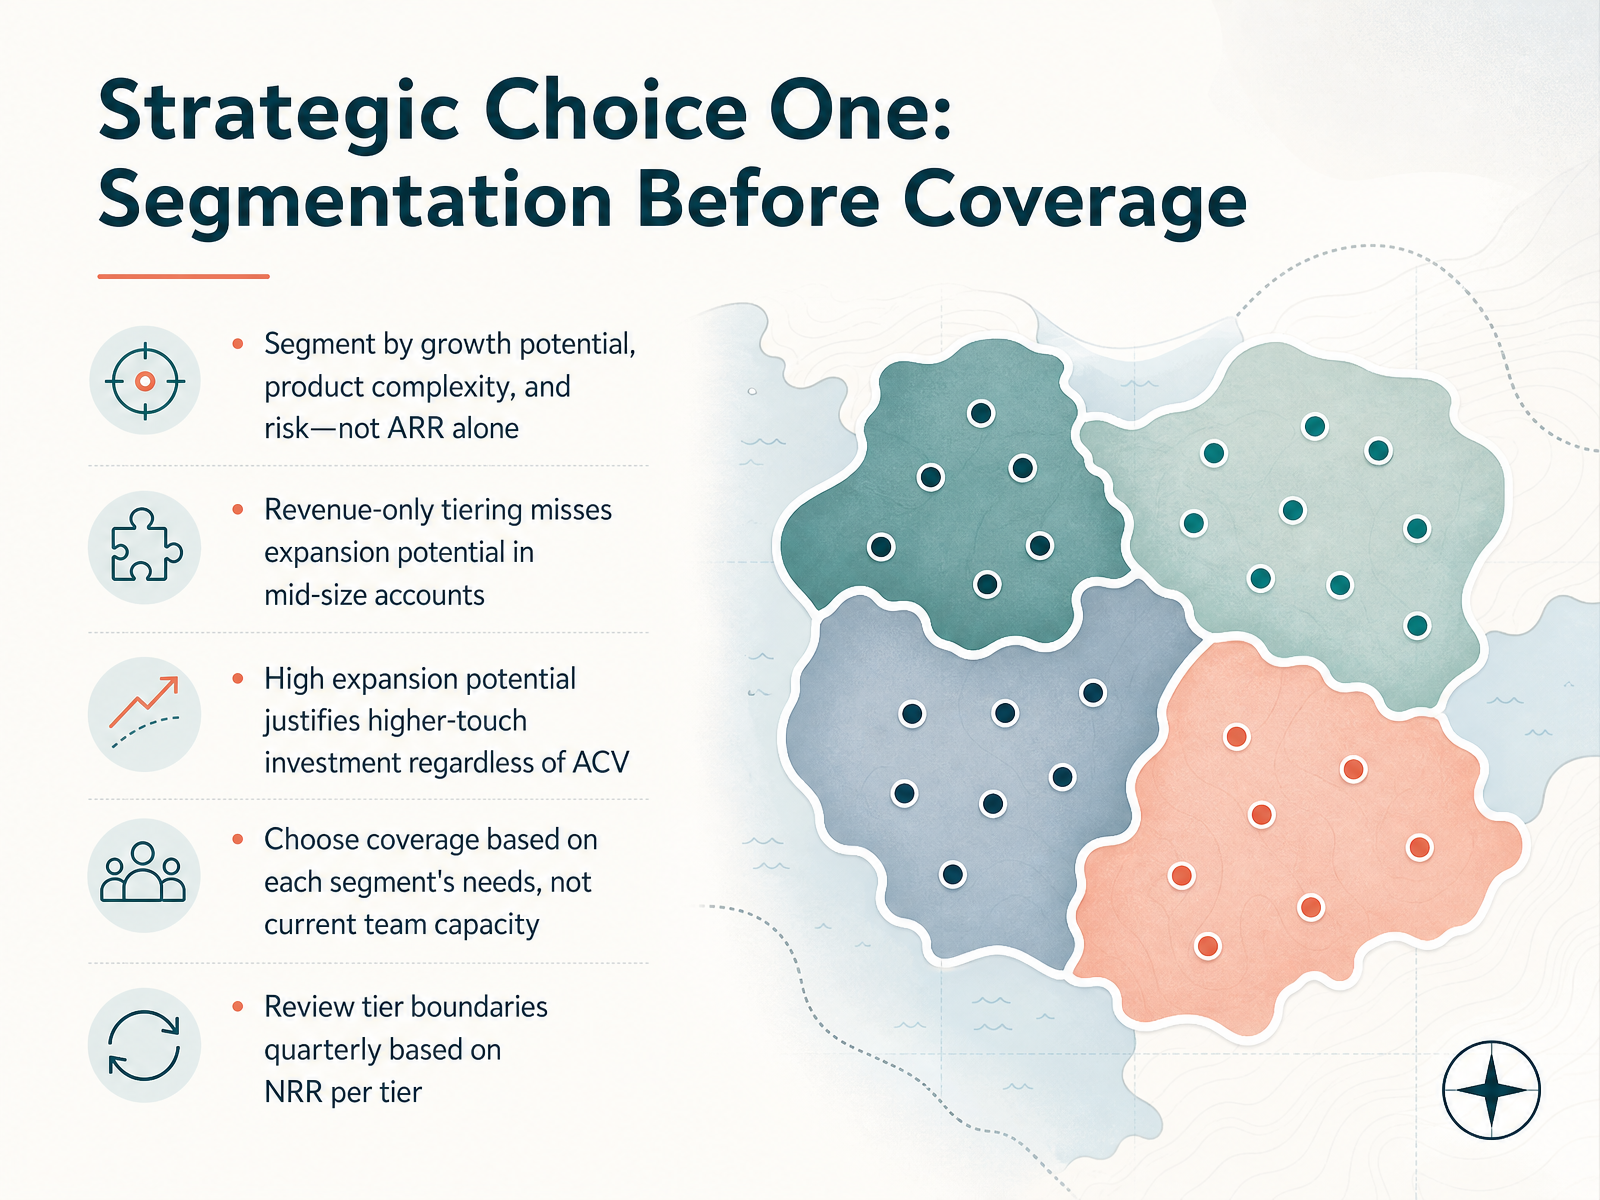
 - 05Strategic Choice One: Segmentation Before CoverageNow let’s make our first strategic choice: segmentation before coverage. Too many teams tier accounts by annual recurring revenue alone. That’s convenient, but it’s a mistake. Revenue-only tiering misses expansion potential hiding in mid-size accounts. A twenty-thousand-dollar account with strong product adoption could grow into sixty thousand within two years. A flat fifty-thousand-dollar account that never expands may not justify the same investment. So segment by growth potential, product complexity, and risk. Use current revenue as a starting point, but not the final word. If high expansion potential exists, that account justifies higher-touch investment regardless of its current contract size. That is the tradeoff: you choose where to spend scarce human attention. Coverage should reflect each segment’s needs, not just your team’s current capacity. If capacity limits your plan, that tells you where to hire or where to automate. Review your tier boundaries quarterly, using net revenue retention per tier as your guide. Let the data move accounts up or down. This keeps your model honest. Now, once segmentation is set, we move to choosing the coverage model itself. That’s next.
 knowledgelib.ioprocontentstudio.netfullcast.com+22 min
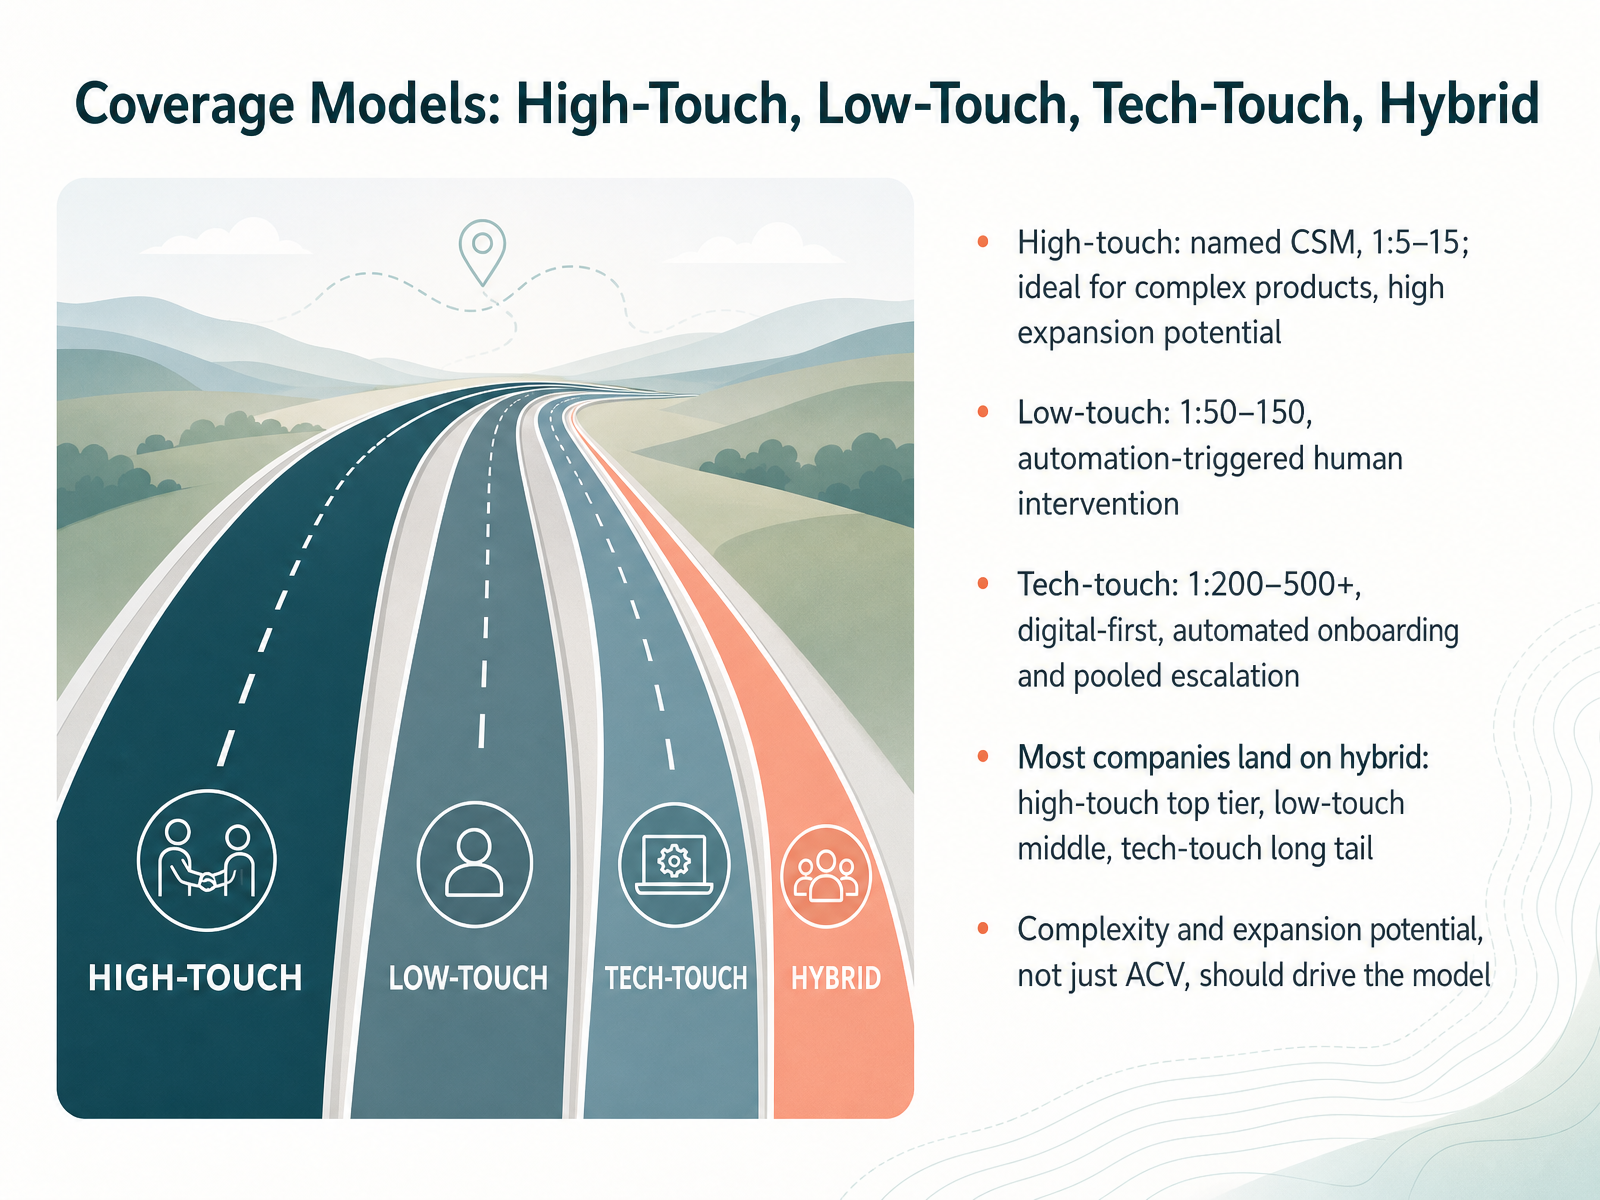
 - 06Coverage Models: High-Touch, Low-Touch, Tech-Touch, HybridLet’s talk about coverage models. The core tradeoff here is human attention versus scale. High-touch means a named CSM for every five to fifteen accounts. It’s the right call for complex products and accounts with strong expansion potential. Low-touch pushes that ratio to fifty or even one hundred fifty accounts, using automation to trigger human intervention only when the data says so. Then there’s tech-touch. Fully digital. Automated onboarding, pooled escalation, and ratios above five hundred accounts per CSM. That works for a simple product and a long tail of smaller accounts. Most companies don’t pick just one. They land on a hybrid: high-touch for the top tier, low-touch for the middle, tech-touch for the long tail. One important point before you set these tiers. Don’t rely on ACV alone. Complexity and expansion potential should drive the model. A mid-sized account with heavy integration needs and a forty percent expansion path deserves more attention than a flat, larger account that never grows. So define your segments by revenue, complexity, and growth. Then assign the model. That tradeoff, done deliberately, is how you protect your best revenue and scale the rest efficiently. Next, we’ll look at strategic choice two: team design and reporting lines.
 knowledgelib.ioprocontentstudio.netfullcast.com+22 min
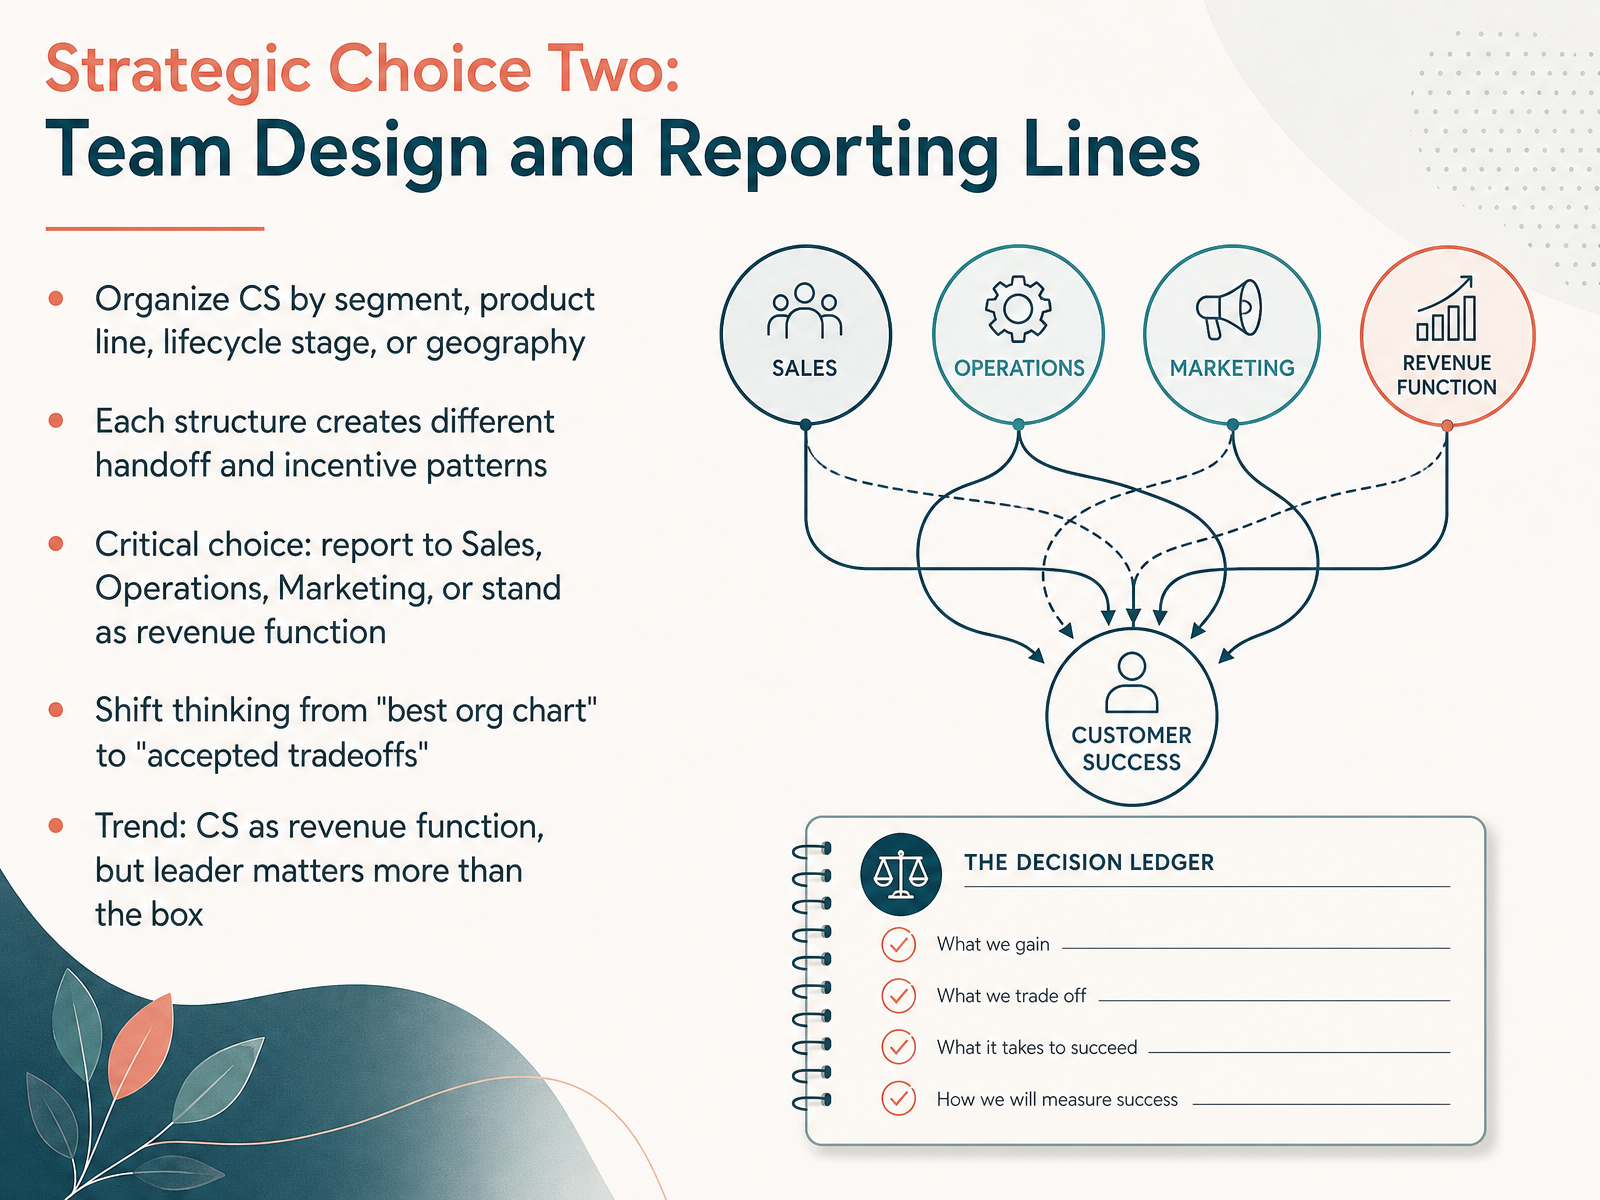
 - 07Strategic Choice Two: Team Design and Reporting LinesNow let's look at the second strategic choice: team design and reporting lines. How you organize your customer success team is a genuine tradeoff, not a search for the perfect org chart. If you organize by segment, you get deep expertise in each customer type, but you risk inconsistent playbooks across segments. Organize by lifecycle stage, and you build specialized onboarding or renewal skills, but handoffs between stages become friction points. The most consequential decision is the reporting line. Reporting to Sales tightens commercial alignment, but can push expansion ahead of genuine customer value. Reporting to Operations optimizes for efficiency, but can distance the team from revenue ownership. The trend is clear: more CS leaders now report to the CRO, and CS is increasingly treated as a revenue function with explicit expansion targets. But here's the honest takeaway. The leader in the seat matters more than the box on the chart. A CRO who understands that value drives revenue is very different from a head of sales with a bigger title. So make your choice deliberately, accept the tradeoffs it brings, and hold your leaders accountable for the outcome. That brings us to our next strategic choice: playbooks and motion design.
 knowledgelib.ioprocontentstudio.netfullcast.com+22 min
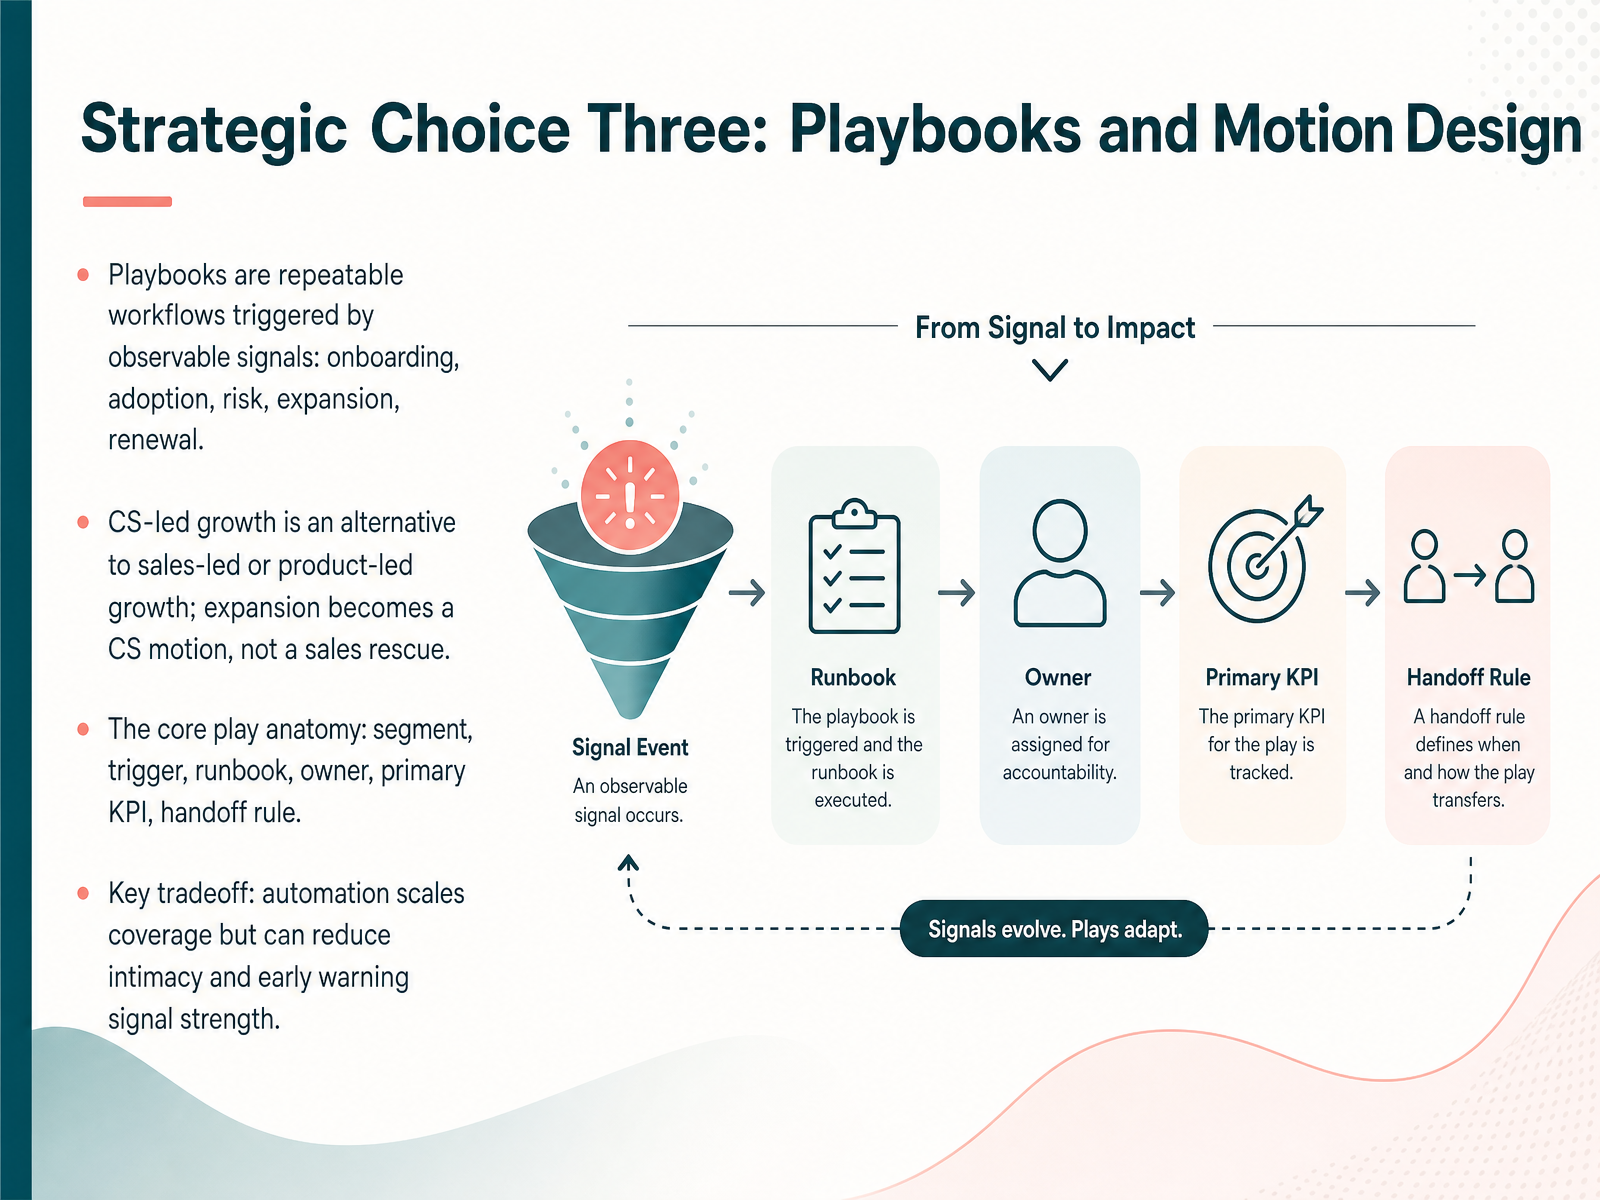
 - 08Strategic Choice Three: Playbooks and Motion DesignNow let's look at the third strategic choice: playbooks and motion design. Playbooks are repeatable workflows triggered by observable signals—like onboarding, adoption, risk, expansion, and renewal. They turn good intentions into consistent action. Consider CS-led growth as an alternative to sales-led or product-led growth. Expansion becomes a CS motion, not a sales rescue. Each play has core anatomy: segment, trigger, runbook, owner, primary KPI, and handoff rule. This ensures clarity and accountability. Here's the key tradeoff: automation scales coverage but can reduce intimacy and weaken early warning signals. For example, an automated onboarding flow can reach hundreds of accounts, but you might miss a customer quietly struggling with a key feature. Balance automation with human checkpoints for your highest-value segments. Design each play to trigger on data, not calendar dates, and always define who owns the next step. This keeps your team proactive and focused. Up next, we'll explore the cost of choice in capacity and coverage ratios.
 knowledgelib.ioprocontentstudio.netfullcast.com+21 min
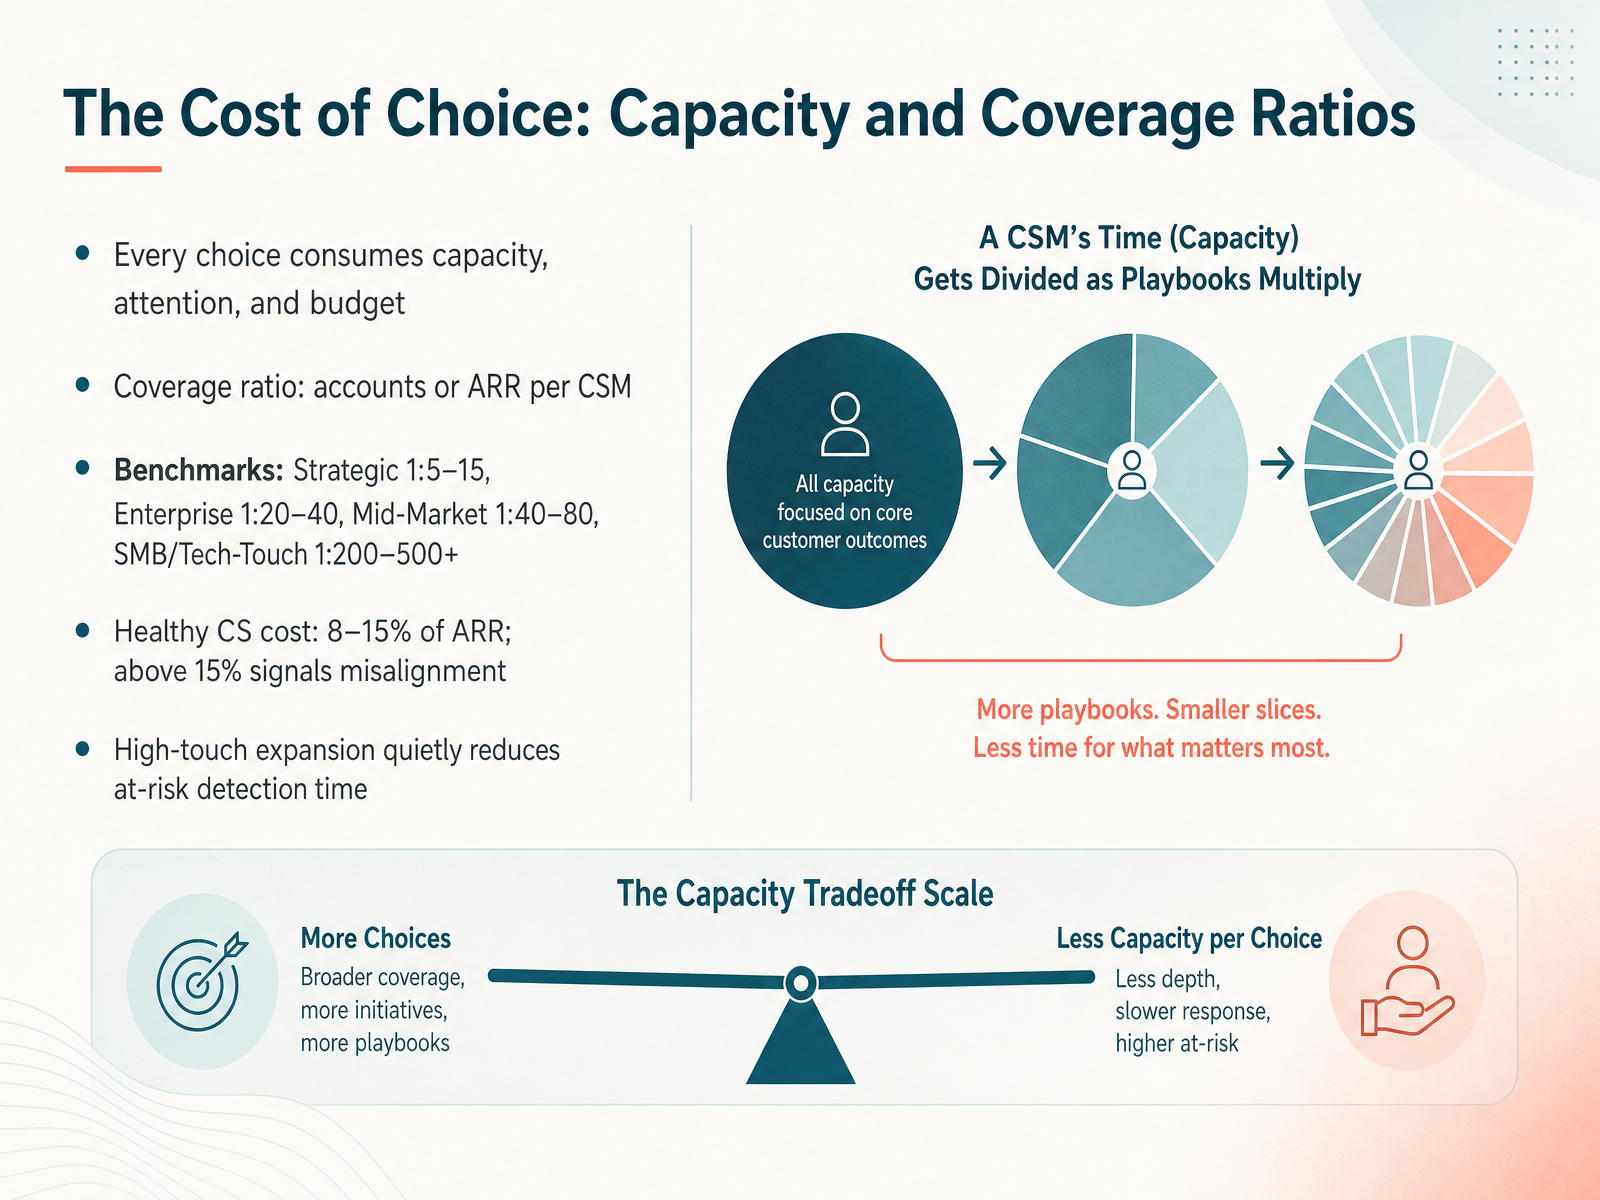
 - 09The Cost of Choice: Capacity and Coverage RatiosLet’s talk about what every choice really costs. Every account you assign to a CSM consumes capacity, attention, and budget. The coverage ratio—accounts or ARR per CSM—is your first honest look at that tradeoff. For strategic accounts, expect one CSM to five to fifteen accounts. Enterprise, one to twenty to forty. Mid-market, one to forty to eighty. And for SMB or tech-touch, one to two hundred or more. These are ranges, not rules. The real signal is cost. Healthy CS operating cost sits between eight and fifteen percent of ARR. Above fifteen percent, you are over-servicing revenue and dragging down valuation. Watch the quiet danger: high-touch expansion work consumes hours that should go to detecting at-risk accounts. When your best CSMs are busy farming expansion, early warning fades. That is a tradeoff you did not choose, but you are paying for it. So choose deliberately. Align your ratios to segment value, and keep cost of serve inside the healthy band. Now, let’s look at how health scores turn these capacity decisions into operational strategy.
 getfairview.comknowmba.comsaas-capital.com+21 min
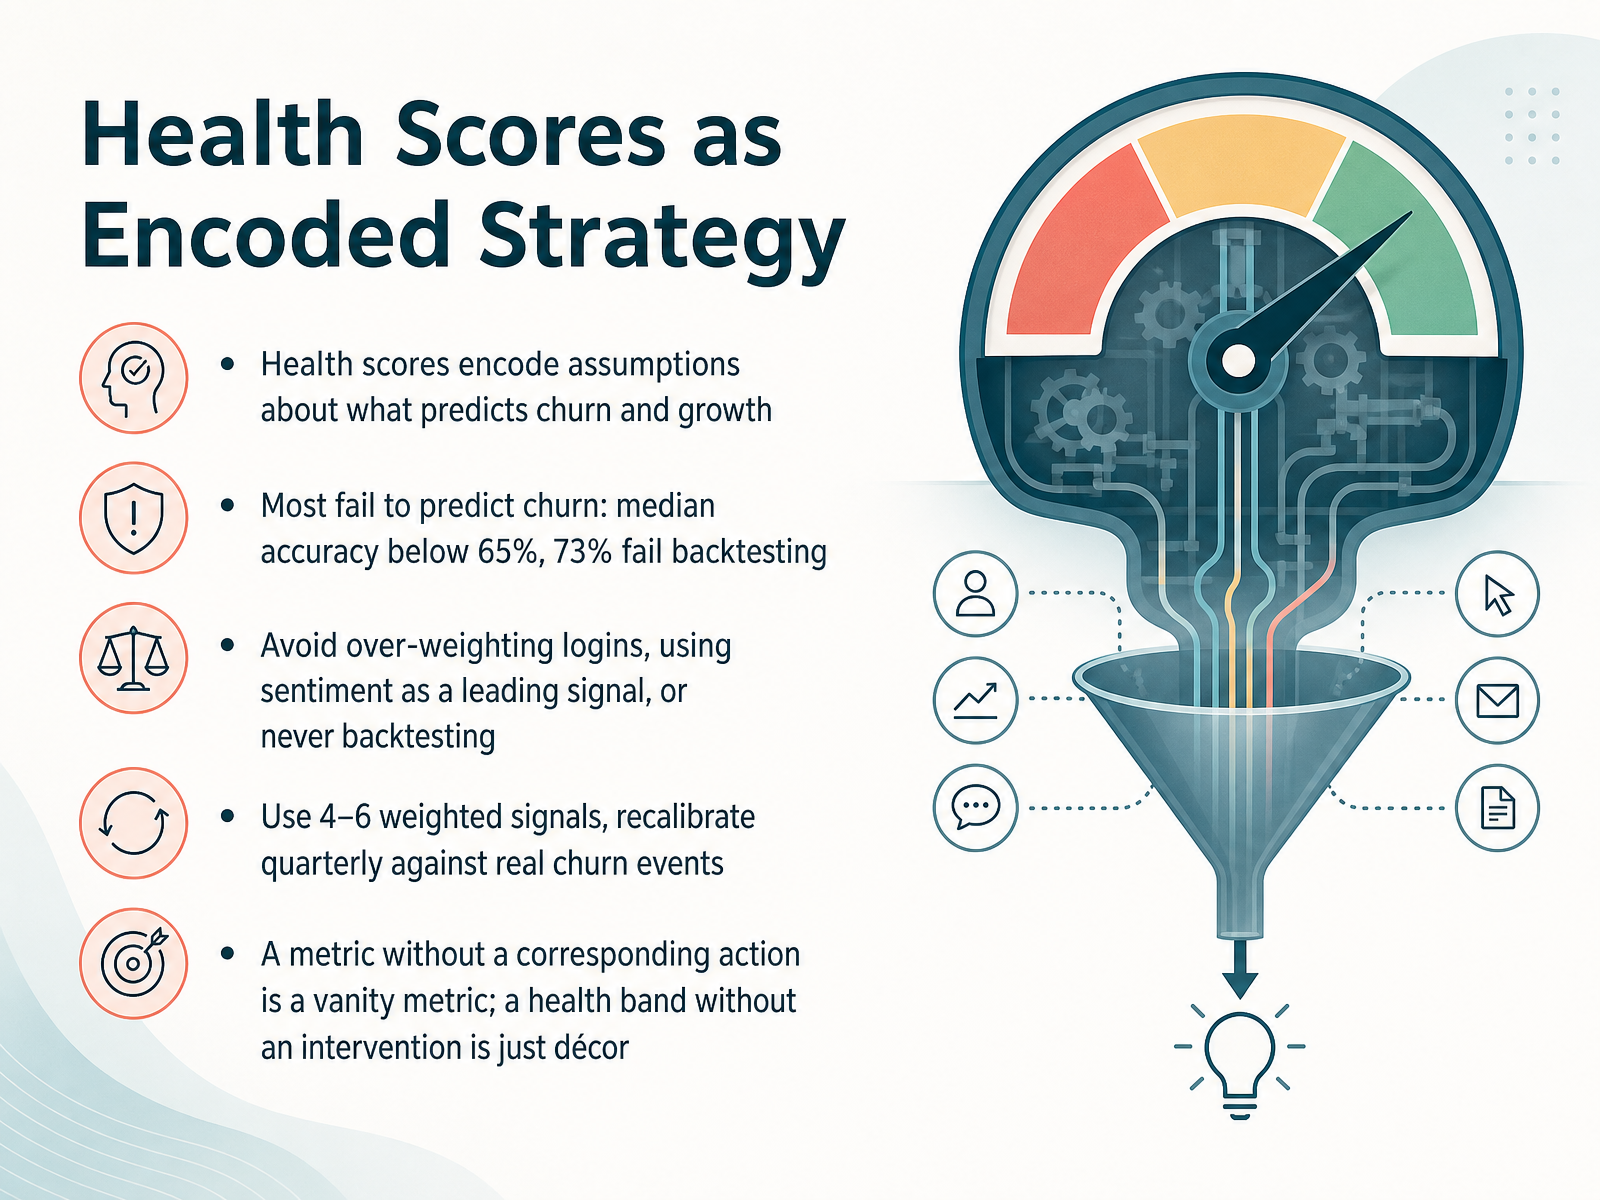
 - 10Health Scores as Encoded StrategyNow let's talk about health scores, because they are not just a metric. They are your strategy, encoded into a formula. Every score makes assumptions about what predicts churn and growth. And most of them fail. Median accuracy sits below sixty-five percent, and nearly three quarters of scores never hold up in a backtest. So avoid the common traps. Don't overweight logins, they measure habit, not value. Don't let sentiment be your leading signal, because customers stop complaining before they stop paying. And always backtest. Use four to six weighted signals, and recalibrate them every quarter against real churn events. If a metric doesn't have a corresponding action, it's a vanity metric. And if a health band doesn't trigger an actual intervention, it's just décor. Build the score so it tells your team what to do, not just what to see. Next, we will look at how your metrics act as a mirror for your entire strategy.
 themarketingjuice.comgrowthlayer.appblog.hubspot.com+22 min
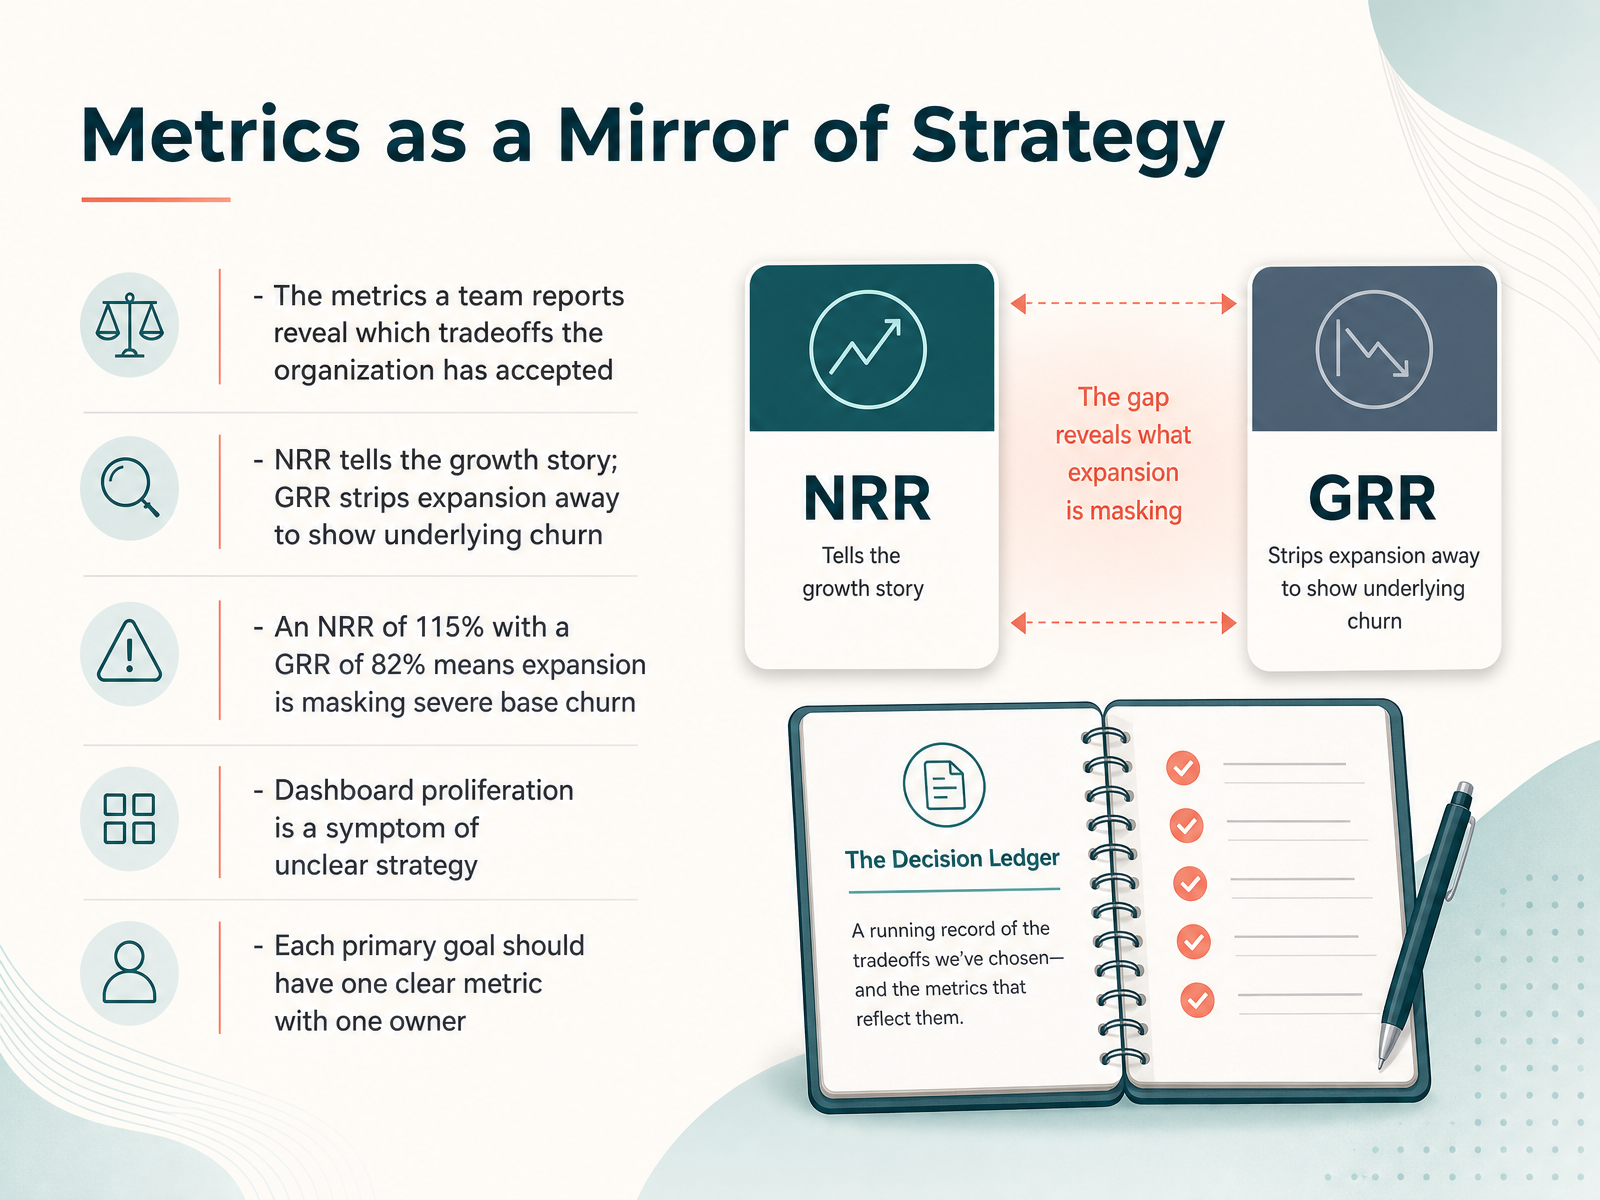
 - 11Metrics as a Mirror of StrategyNow, let's talk about metrics as a mirror of your strategy. The numbers you report reveal which tradeoffs you've accepted, whether you say so or not. For example, net revenue retention tells your growth story. Gross revenue retention strips away expansion and shows your true churn. If your NRR is a hundred and fifteen percent, but your GRR is only eighty-two percent, that's a clear signal. Expansion is masking severe base churn. You might feel good about the headline, but the foundation is leaking. Dashboard proliferation is often a symptom of unclear strategy. If you see teams reporting forty different metrics, they likely don't know which ones really matter. Each primary goal should have one clear metric, and that metric should have one owner. When you align metrics to your strategic tradeoffs, they become powerful. When you don't, they just add noise. So, from strategy to operating reality, let's walk through a decision template you can use to make these choices concrete.
 themarketingjuice.comgrowthlayer.appblog.hubspot.com+22 min
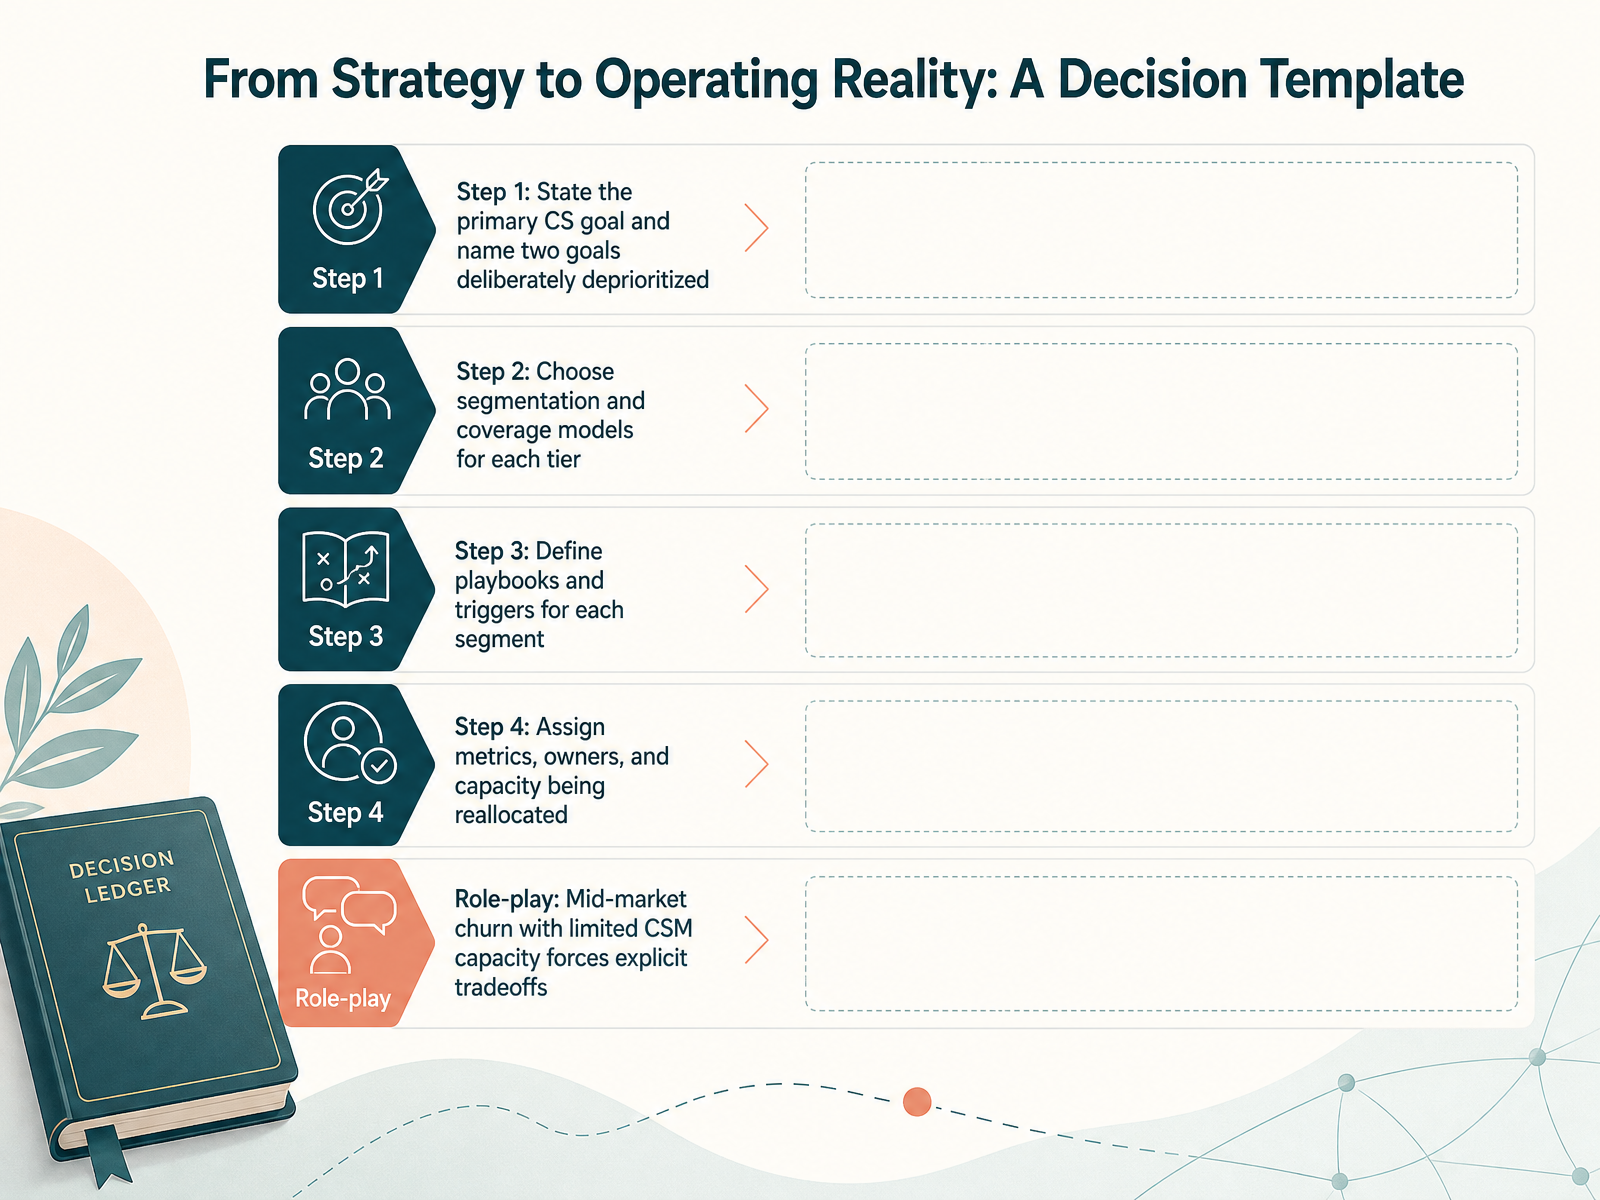
 - 12From Strategy to Operating Reality: A Decision TemplateThis is where strategy becomes operational. Use this four-step template to turn your choices into a reality you can manage. Step one: state the primary goal, and name two goals you are deliberately deprioritizing. If the primary goal is protecting renewal revenue, then expansion speed and onboarding depth may have to wait. Step two: choose segmentation and coverage models for each tier. The hybrid model works for most: high-touch for your top accounts, tech-touch for the long tail. Step three: define playbooks and triggers for each segment. A playbook without a trigger is just a document. The trigger might be a health score drop, or a renewal approaching ninety days out. Step four: assign metrics, owners, and the capacity being reallocated. Name the person, and name what they are no longer doing. Now let's put this template to work. We'll walk through a case application: mid-market churn under a capacity constraint.
 knowledgelib.ioprocontentstudio.netfullcast.com+21 min
 - 13Case Application: Mid-Market Churn Under Capacity ConstraintLet’s apply this to a real scenario. You’re at a thirty million dollar ARR company with eight CSMs covering three hundred and fifty accounts. That’s a one-to-forty-four ratio. Net retention is at one hundred and three percent, but churn is starting to climb. The instinct is to hire. That’s Option A. But hiring takes ninety days to ramp, and your team is already at capacity. The accounts most at risk won’t wait. So consider Option B instead. Redeploy the team. Put three CSMs on your top accounts, giving them four times the focus. Pool four CSMs for the mid-market, with a shared inbox for faster response. And dedicate one CSM to digital onboarding for the long tail. You haven’t added a single head, but you’ve redesigned coverage to match revenue at risk. That’s the tradeoff. Hiring protects the old model. Redesigning protects the revenue. The lesson here is simple: redesign your coverage model before you ask for more headcount. Now let’s wrap up with the key takeaways and first moves.
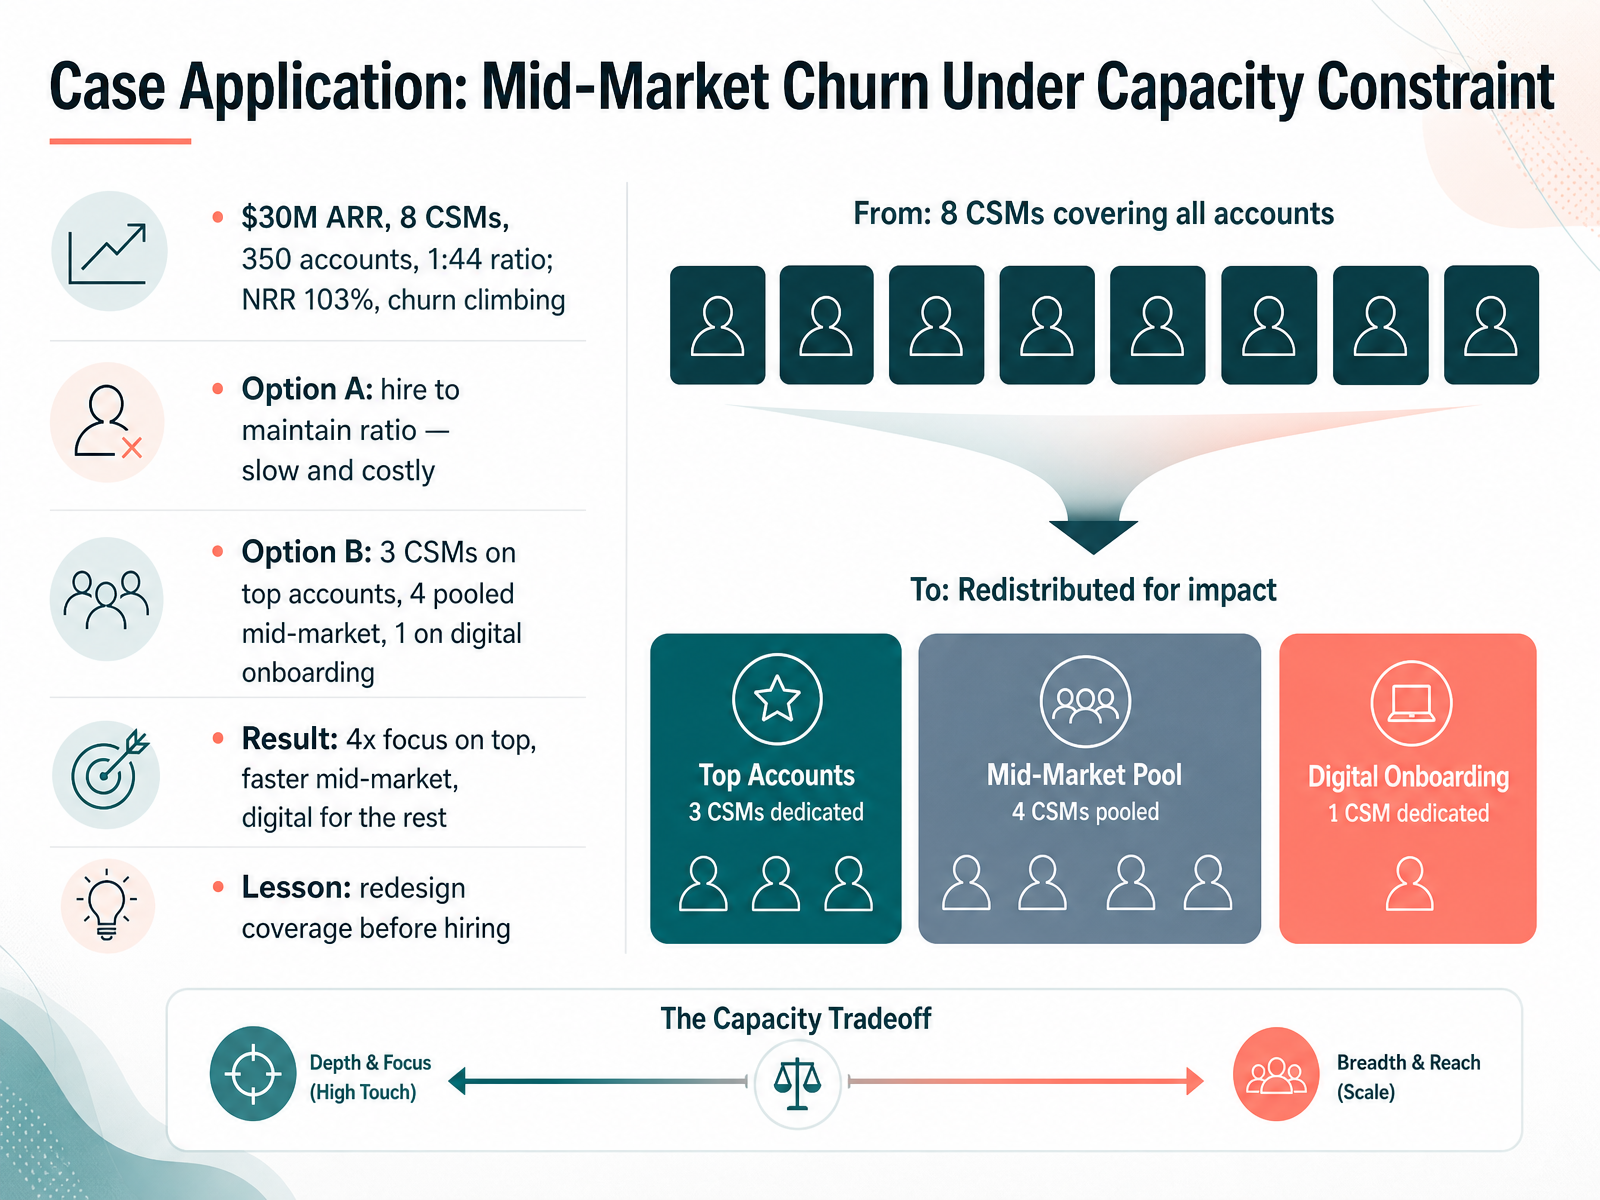 thecscafe.comorm-tech.comhumanr.ai+22 min
 - 14Key Takeaways and First MovesLet’s close with the core logic of this entire session. Goals create clarity. Choices create coverage. And tradeoffs create honesty. If you cannot name what you are deliberately underinvesting in, you do not have a strategy. You have a wish list. A real strategy requires a decision you can defend, including what you are choosing not to do. Here are your first moves. If you are a practitioner, identify one conflicting goal in your current book of business. State the tradeoff out loud. If you are a leader, map one customer segment to one playbook, and turn that into a coverage decision. Start with the ACV tier, then adjust for complexity and expansion potential. And remember, strategy is revisable. Make your tradeoffs visible before the quarter forces them on you. A tradeoff is not a failure. It is a sign of disciplined thinking. Thank you for your time. Now go make one deliberate choice this week. That is where strategy begins.
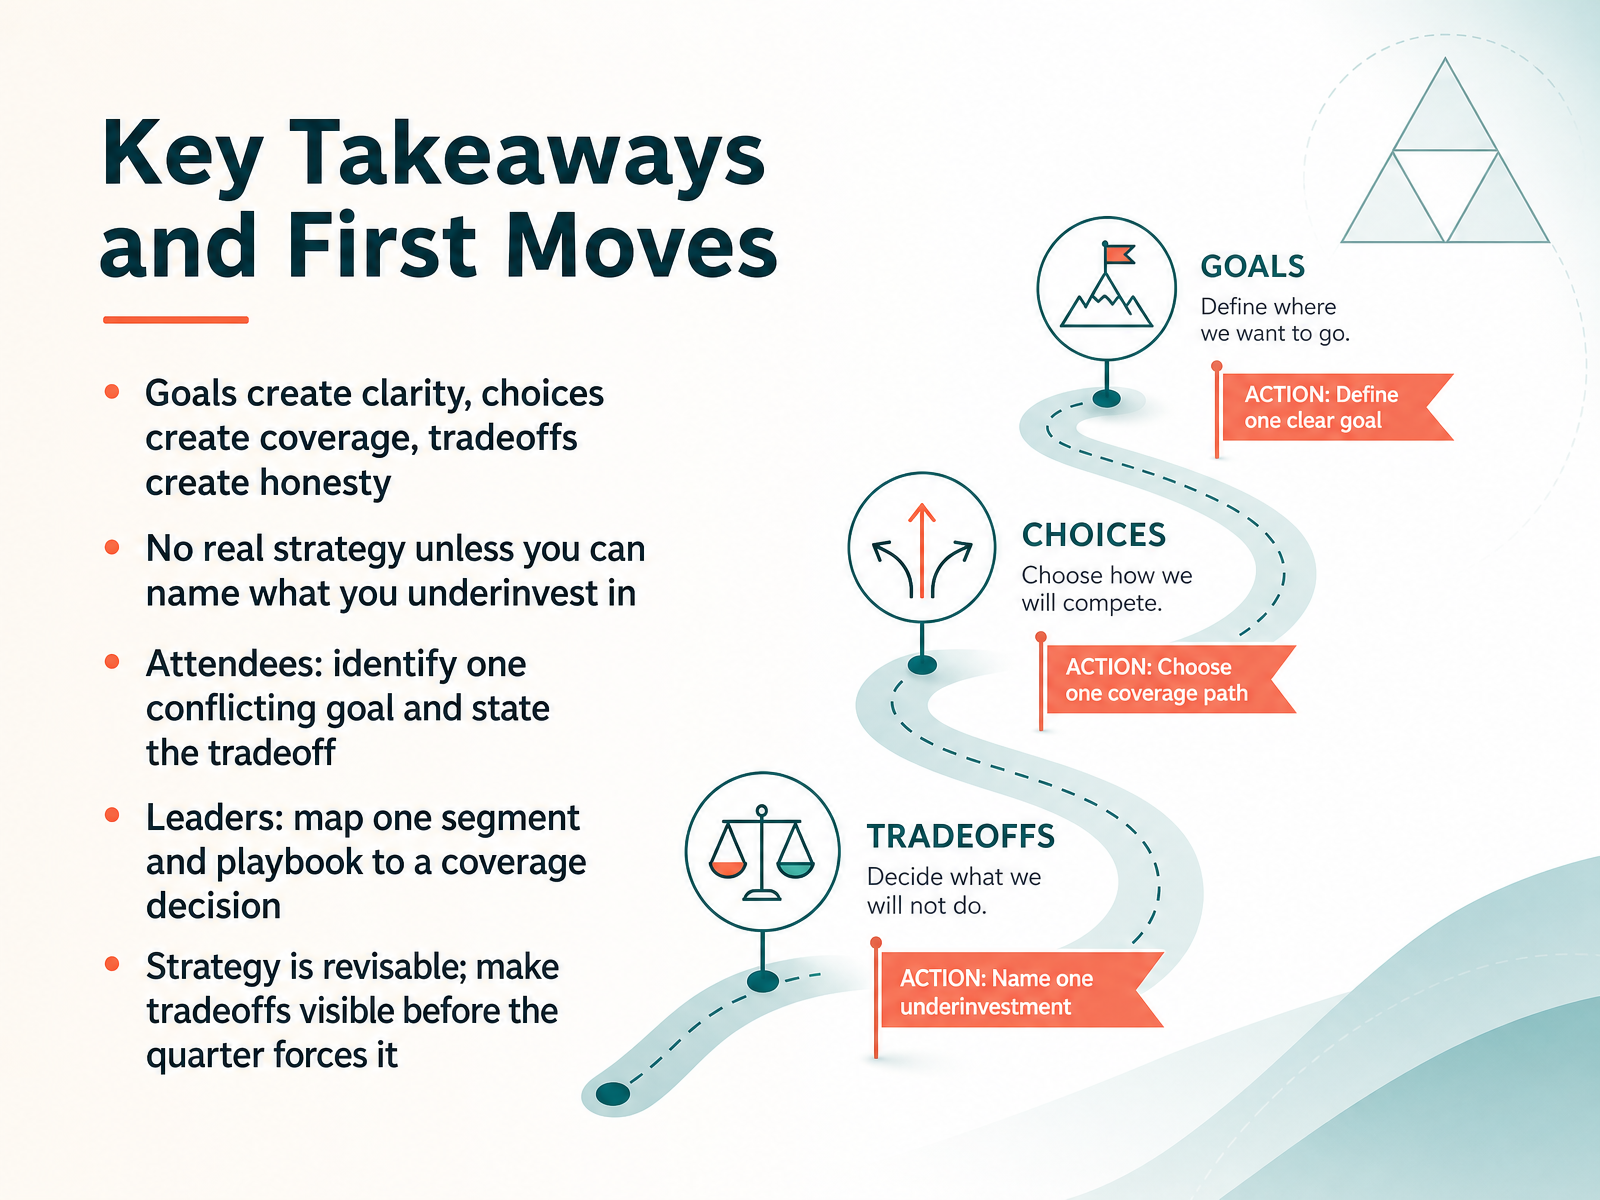 knowledgelib.ioprocontentstudio.netfullcast.com+21 min
Take the deck with you
Download this course as a file — free, no sign-up needed.
- PDF handoutEvery slide page, ready to print or share.15 pages · 3.3 MBDownload
- Narrated PowerPointThe deck that presents itself — every slide carries the digital human's narration video.15 pages · 13.4 MBDownload
- PowerPoint slidesThe full deck as a .pptx — open it in PowerPoint, Keynote, or Google Slides.15 pages · 3.2 MBDownload
Free to use in your own training — please keep the PersonWise credit page at the end.
Have your own deck? Turn it into a course
Sources consulted
Web sources consulted while building this course.
- Customer Success Model Selection Decision Framework | knowledgelib.io — knowledgelib.io
- Customer Success Strategy: The Complete Guide for B2B SaaS — procontentstudio.net
- Customer Success Strategy: Framework for Revenue Leaders - Fullcast — fullcast.com
- Customer Success for SaaS: The Definitive 2026 Guide — mava.app
- 7 steps to building a customer success strategy (and combat churn) — blog.hubspot.com
- Customer Success KPIs That Measure Outcomes, Not Activity — themarketingjuice.com
- SaaS Customer Success Metrics: The KPIs That Actually Predict Renewal and Expansion | GrowthLayer — growthlayer.app
- The 15 customer success metrics that actually matter in 2026 — blog.hubspot.com
- "Post-Sale Metrics Guide: Essential KPIs for Customer Success Teams - 2026" — resources.rework.com
- Customer Success Metrics | Customerscore.io — customerscore.io
- Cost to Serve: Definition — Fairview — getfairview.com
- CSM Coverage Model: Formula, Examples & Common Mistakes | KnowMBA — knowmba.com
- 2026 Spending Benchmarks for Private B2B SaaS Companies — saas-capital.com
- SaaS Cost of Revenue Benchmarks: 29% COGS, 71% Margin — humanr.ai
- Customer Success Team Size Benchmarks by ARR (2026 Guide) — humanr.ai
- CSM to Customer Ratio: 2026 Benchmarks & How to Find Yours — thecscafe.com
- How to Calculate CSM Capacity and Size a Book of Business | ORM — orm-tech.com
- CSM to Customer Ratio — Benchmarks by Segment | Lyniro — lyniro.com
- ARR Per CSM: The Metric That Gets Headcount Approved — thecscafe.com