Data Science Fundamentals
Begin
15 pages · ~30 min
Data Science Fundamentals
An introductory course on data science fundamentals covering key concepts, tools, and workflows to build a foundation for analyzing and interpreting data effectively.
What you’ll learn
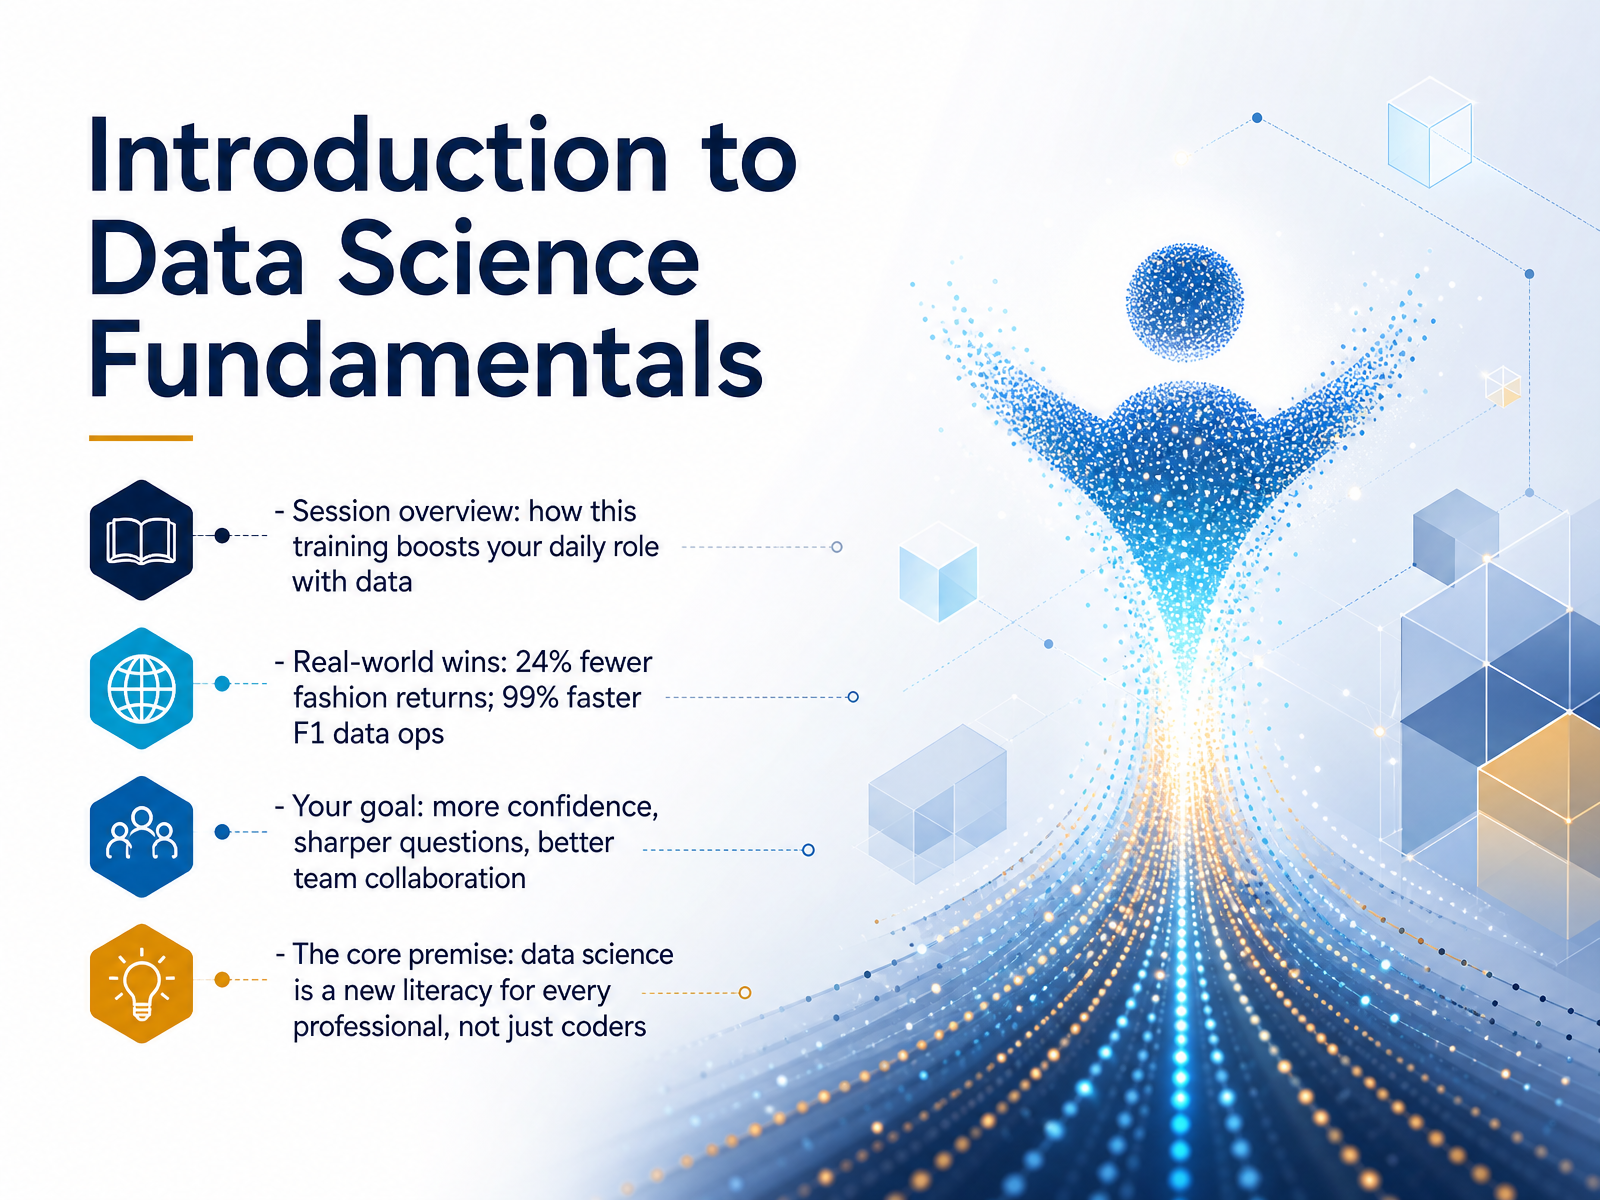
- 01Introduction to Data Science FundamentalsWelcome to Data Science Fundamentals. I'm glad you're here. This session is designed to help you feel more confident and effective in your daily work with data, no matter your role. Over the next few minutes, we'll explore how data science is a new kind of literacy, one that every professional needs, not just coders or analysts. We'll look at real-world wins, like how a fashion company used data to cut clothing returns by twenty-four percent, and how a Formula One team made their data operations ninety-nine percent faster. These aren't just tech stories; they are business stories. Our goal together is simple: to help you ask sharper questions, collaborate better with your teams, and see data as a practical tool you can use every day. Let's get started by unpacking what data science truly means and clearing up some common misconceptions.business.google.comaws.amazon.combusiness.google.com+22 min
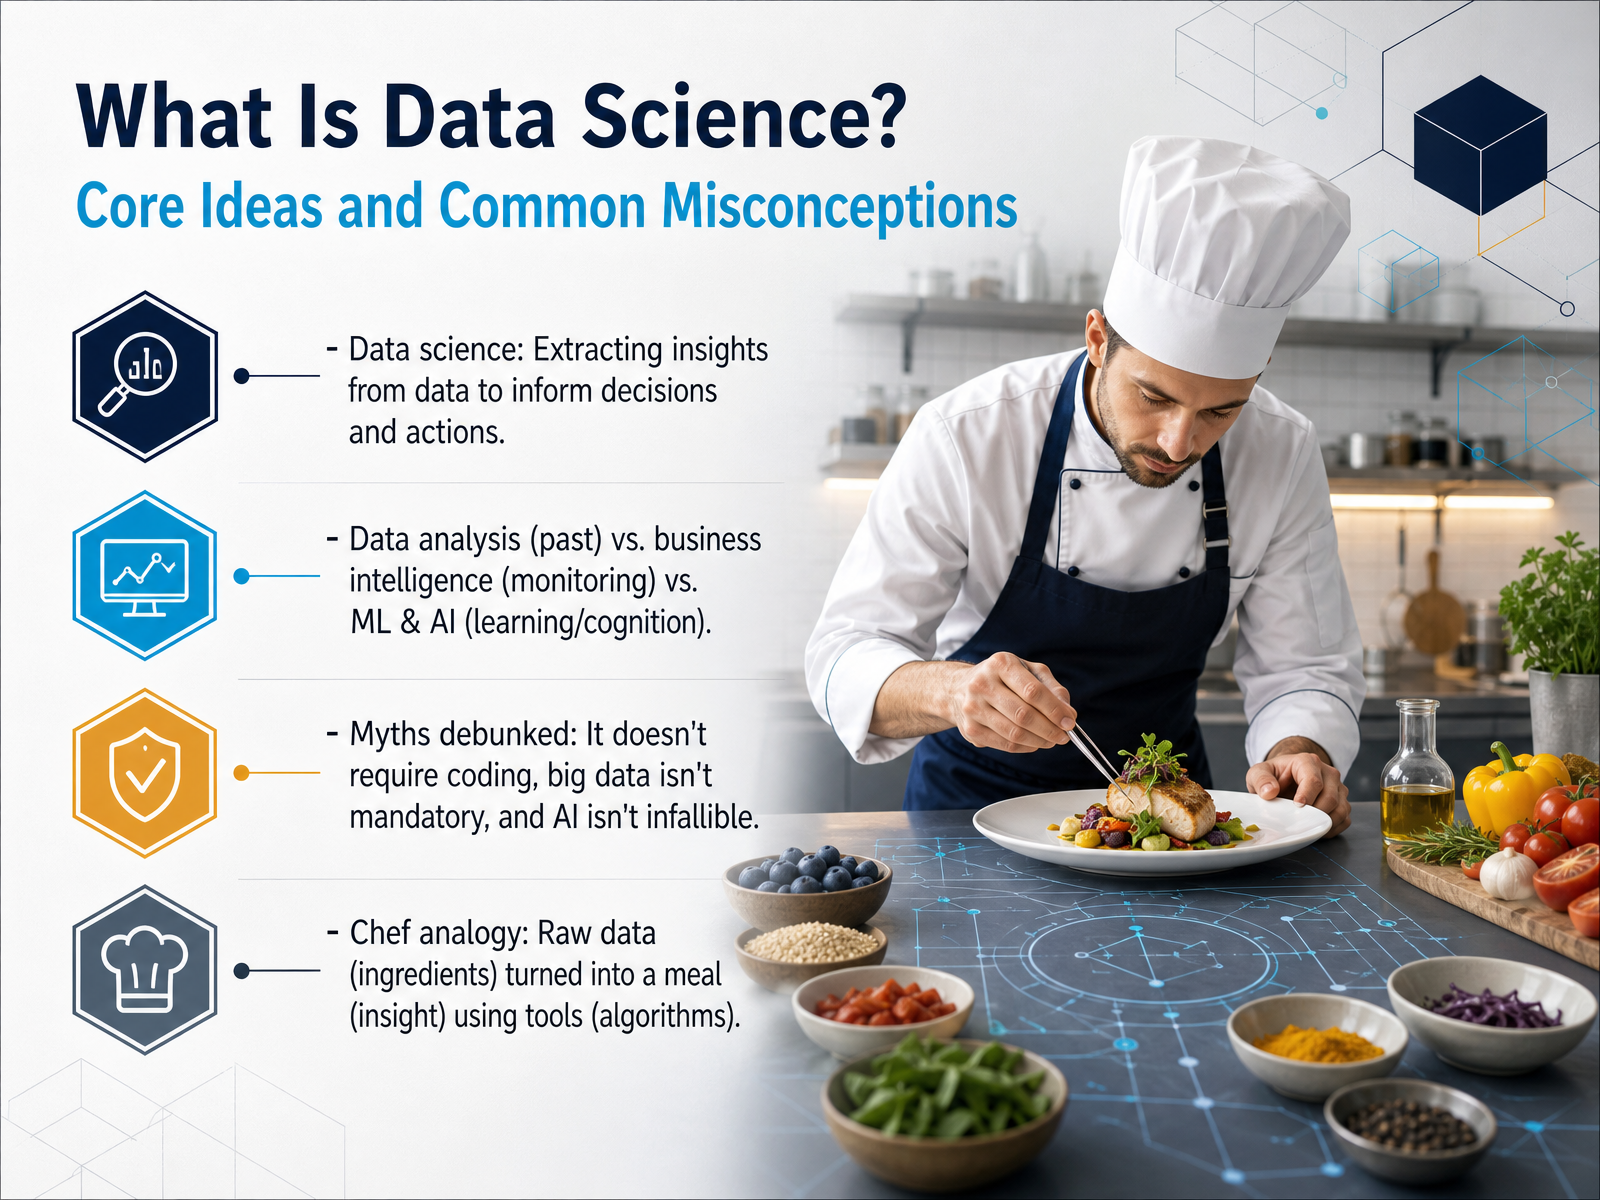
- 02What Is Data Science? Core Ideas and Common MisconceptionsNow we have a clear picture of why data literacy matters, let's explore what data science actually is. Because the term gets thrown around a lot, and honestly, it can sound more intimidating than it really is. At its heart, data science is simply the practice of extracting useful insights from data to help us make better decisions and take smarter actions. Think of it like cooking. Your raw ingredients are the data; your tools and algorithms are the pots, pans, and recipes; and the final meal you serve is the insight. Now, a common misconception is that data science is one giant, mysterious thing. It is actually helpful to think of it as a spectrum. On one end, you have data analysis, which looks backward to understand what happened last quarter. In the middle, there is business intelligence, which monitors what is happening right now through dashboards. And on the far end, you have machine learning and AI, which learn patterns from data to predict what might happen next. You also do not need to be a coding wizard, or have mountains of so-called big data, to start. The most important ingredients are a clear question and a willingness to explore. And a final thing to keep in mind: AI is a powerful tool, but it is not infallible. Its outputs are drafts that need human judgment, not final answers set in stone. Understanding these core ideas sets us up perfectly to walk through the practical steps of a project, so let's turn now to the data science lifecycle, moving from a business question to a real impact.
 deloitte.comhai.stanford.eduoxfordeconomics.com+22 min
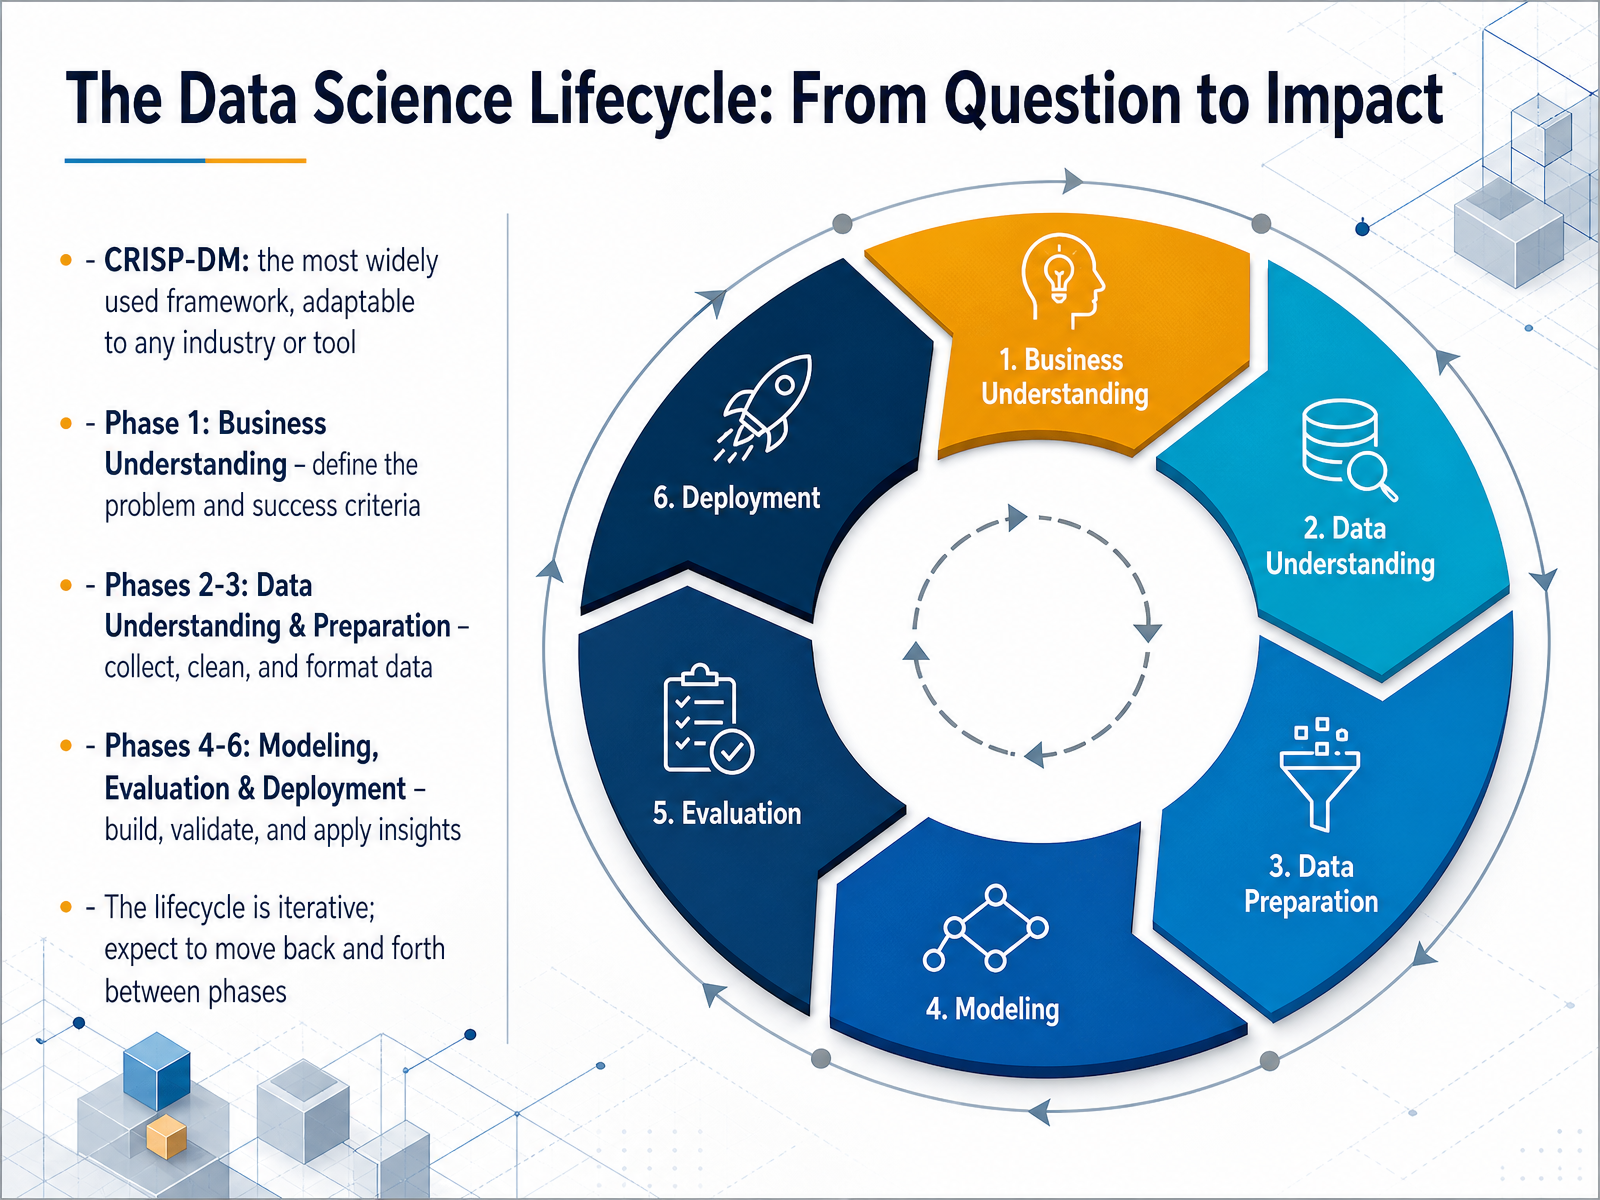
 - 03The Data Science Lifecycle: From Question to ImpactNow let’s walk through the heartbeat of every data science project: the lifecycle, often called CRISP-DM. That stands for Cross-Industry Standard Process for Data Mining. Think of it as a trusted roadmap that works whether you’re in finance, marketing, healthcare, or retail. The journey starts with Business Understanding, where we define the problem and agree on what success looks like. Then we move into Data Understanding and Data Preparation. This is where we collect, explore, and clean the data. Honestly, this step often takes the most time, because messy data leads to misleading answers. After that, we enter Modeling, Evaluation, and Deployment. We build the analysis, check if it truly answers the business question, and then put those insights to work. One really important thing to remember: this lifecycle is iterative. You’ll move back and forth between phases as you learn more about the data and the business context. Up next, we’ll zoom in on that very first, critical stage: The Foundation: Business Understanding.
 sfmagazine.comudacity.comen.wikipedia.org+22 min
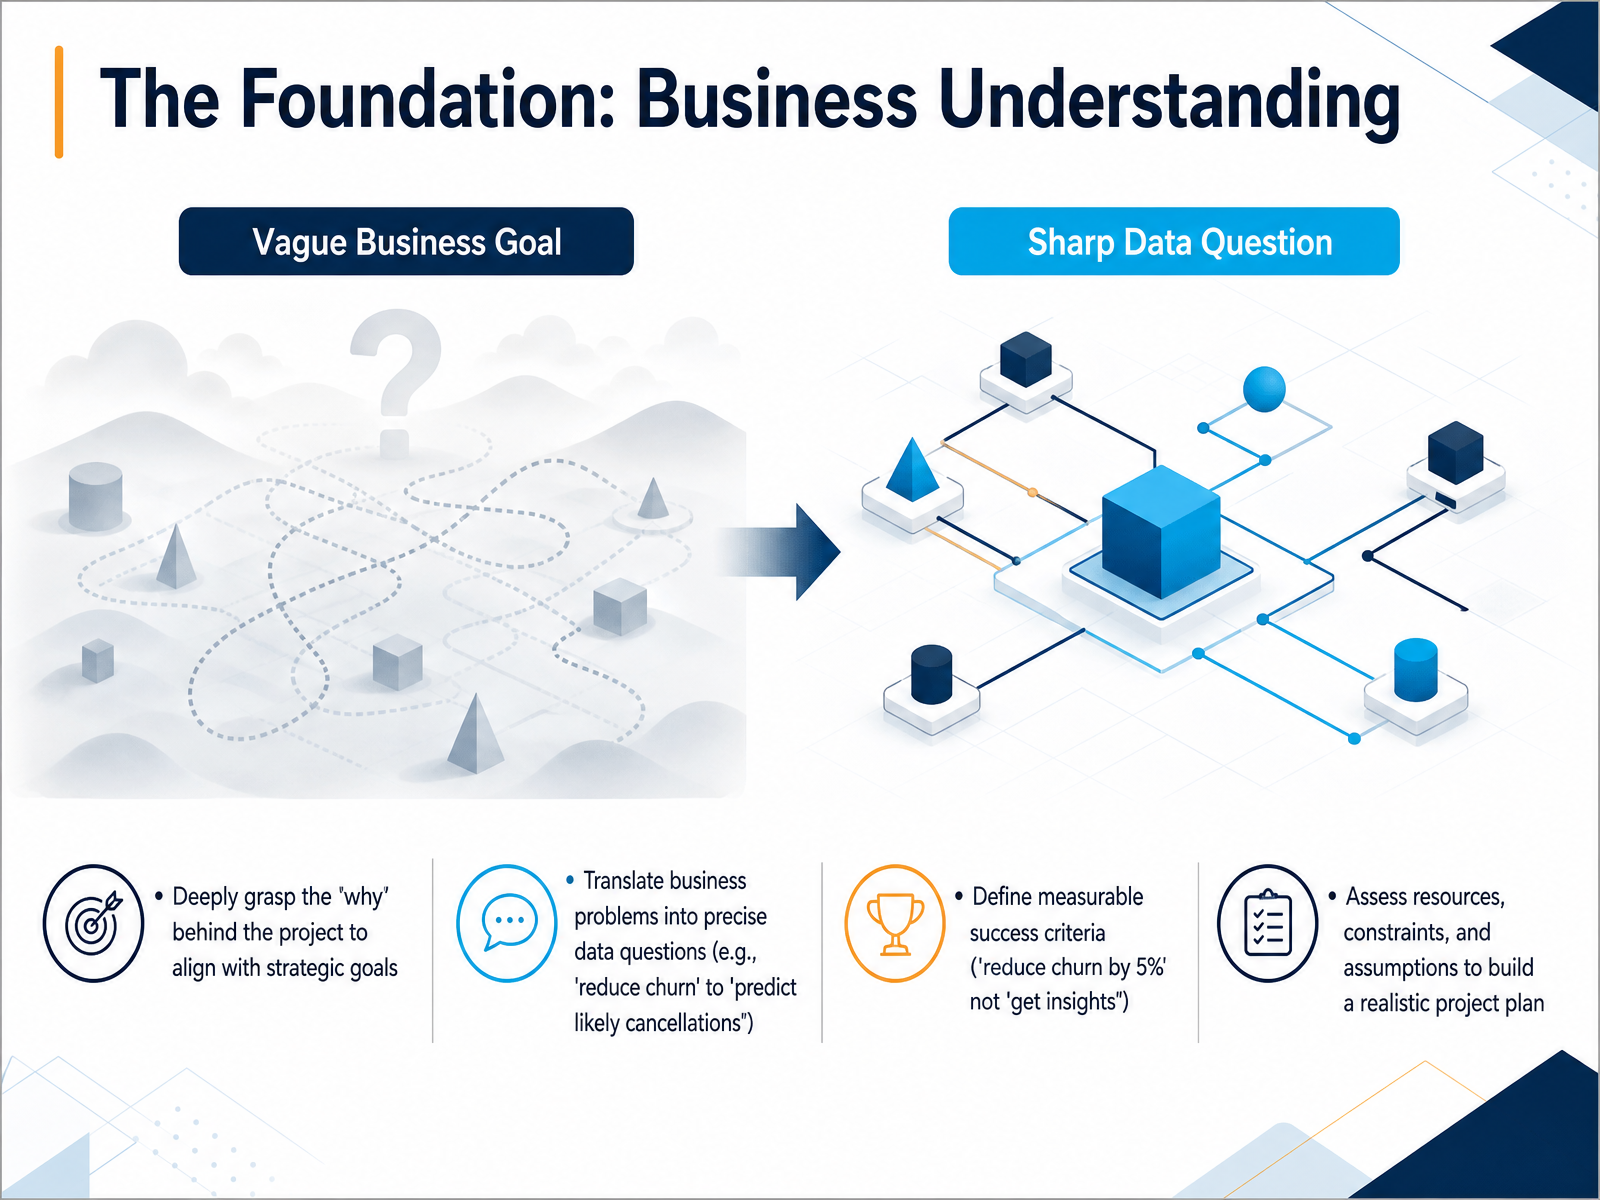
 - 04The Foundation: Business UnderstandingNow, let's look at the very first and perhaps most important phase: business understanding. This is where we step back and ask the big question—why are we doing this project? It’s about deeply grasping the core business problem and making sure our data work is tied directly to strategic goals. We start by translating a general business problem into a precise data question. For example, instead of a vague goal like 'reduce customer churn,' we reframe it as 'predict which customers are likely to cancel in the next 30 days.' This shift turns a worry into an actionable task. Next, we define exactly what success looks like. We move from soft targets like 'get some insights' to a hard, measurable success criterion, such as 'reduce the churn rate by five percent.' Finally, we take a realistic inventory. We assess what data, people, and tools we have, and what constraints or assumptions exist. This creates a solid, realistic project plan from the very start. With a clear business question and a definition of success, we're ready to look at the raw materials. Coming up next, we'll explore the different types of data and why they matter.
 sfmagazine.comudacity.comen.wikipedia.org+22 min
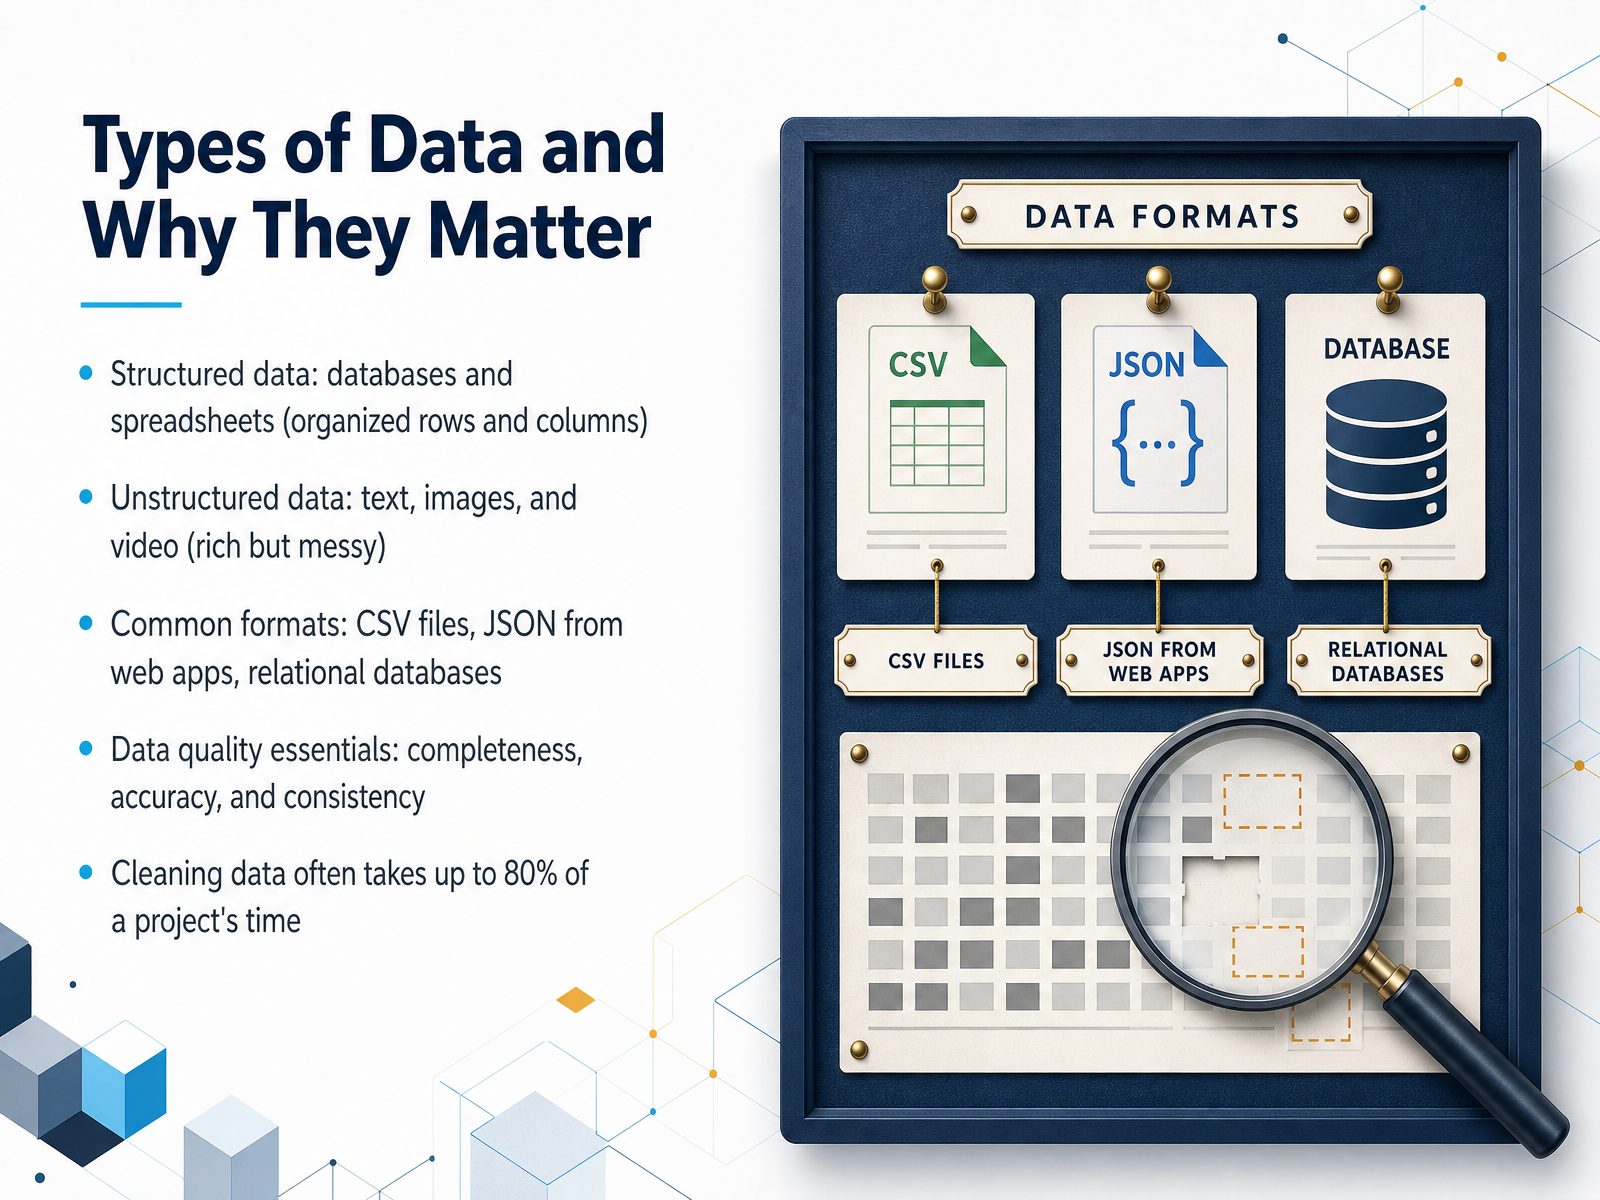
 - 05Types of Data and Why They MatterNow let's talk about the raw material itself: the data. Not all data is created equal, and recognizing the type you're working with is the first big step toward understanding it. Think of data in two main buckets. First, structured data. This is the highly organized information you see in databases and spreadsheets, with neat rows and columns. It's easy to search and analyze. Second, unstructured data. This is the rich but messy stuff like text from emails, images, or video files. It's packed with insights, but it takes more effort to unlock them. You'll also encounter common formats, like a CSV file for a spreadsheet, a JSON file from a web application, or a relational database. And here’s a critical concept: data quality. For data to be useful, it needs to be complete, accurate, and consistent. This is why the often-cited '80 percent rule' exists. In many projects, data preparation—which includes cleaning—can take up to 80 percent of the total time. It’s not a glitch in the process; it is the process. Next, we'll build on this by learning how to turn that raw curiosity into sharp, focused questions in our next slide: Asking the Right Questions: From Curiosity to Clarity.
 sfmagazine.comudacity.comen.wikipedia.org+22 min
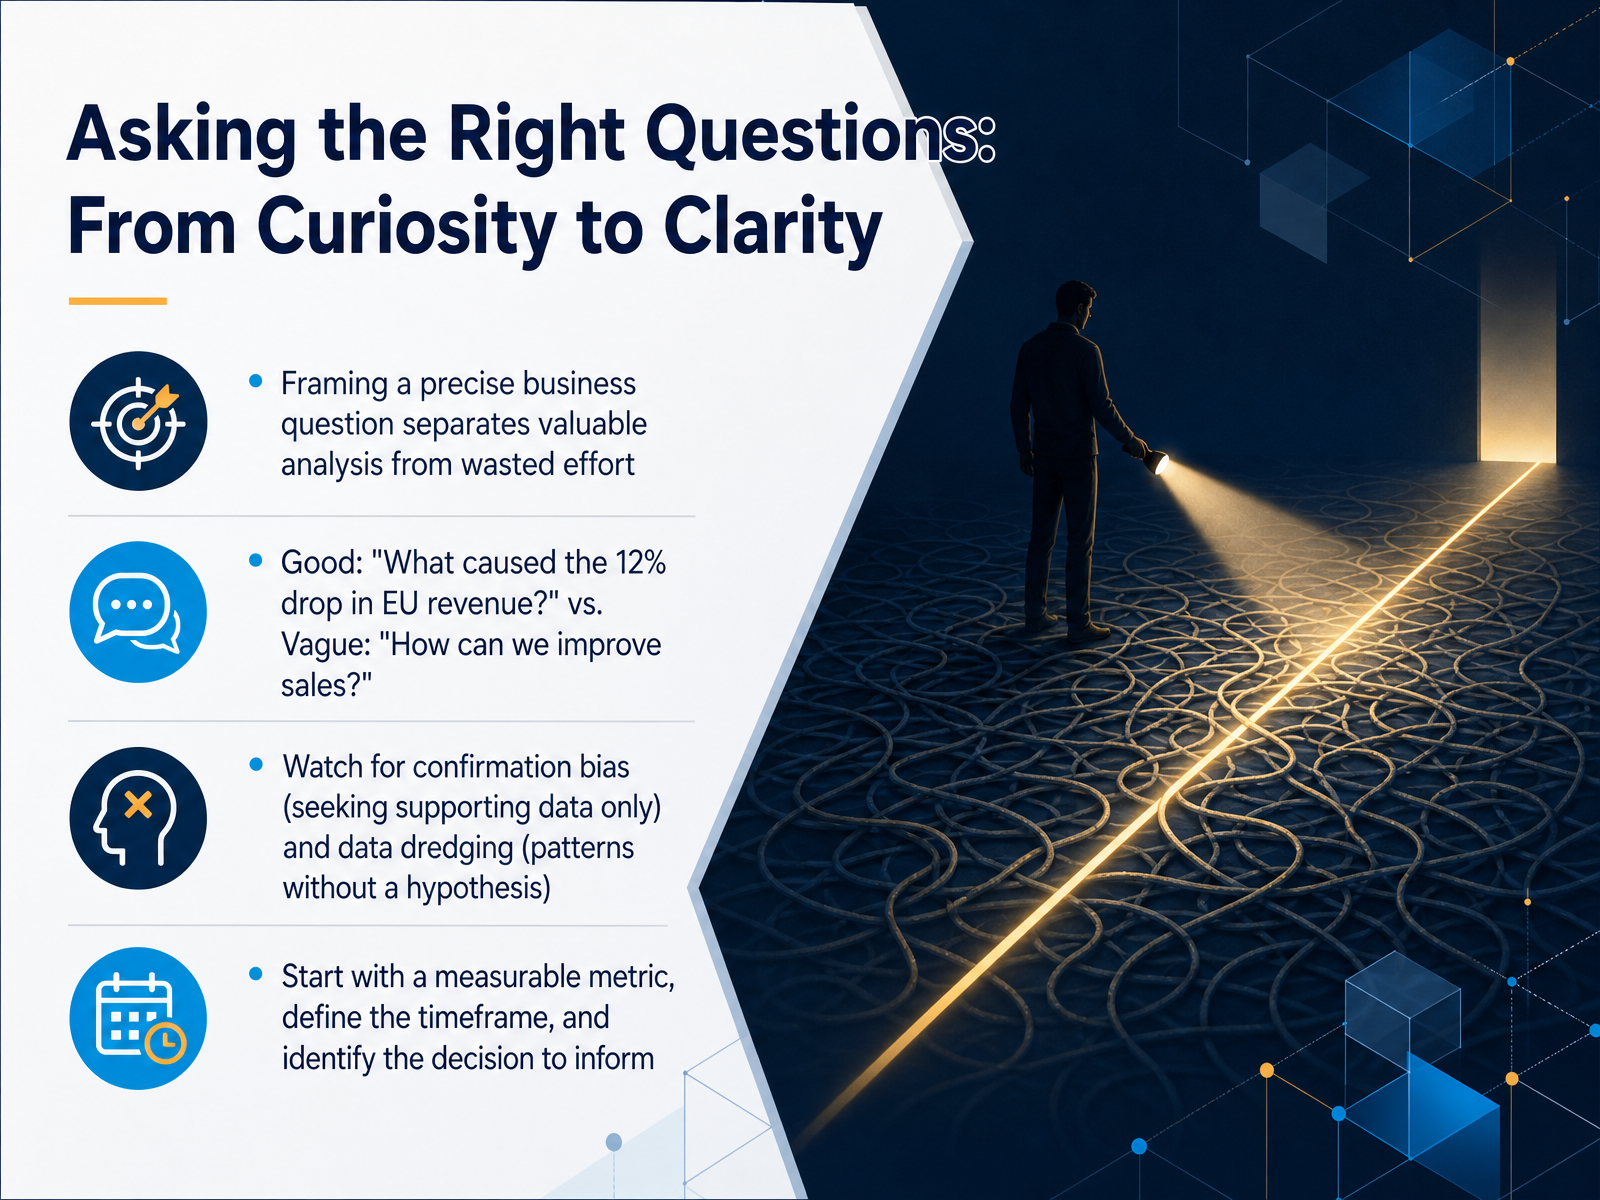
 - 06Asking the Right Questions: From Curiosity to ClarityNow let's talk about asking the right questions. It's the step that separates valuable analysis from wasted effort. The first phase of the data analytics process, often called business understanding, is all about framing a precise business question. For example, a precise question is, 'What caused the twelve percent drop in our EU revenue last quarter?' This is much better than a vague one like, 'How can we improve sales?' A specific question tells your team exactly what to investigate. When you're forming your question, watch out for two common traps. The first is confirmation bias, which means looking only for data that supports what you already believe. The second is data dredging, where you search through data randomly hoping to find a pattern, without a clear hypothesis to guide you. In practice, start with a measurable metric, define a clear timeframe, and identify the exact decision this analysis will inform. This grounds your project in a real business need and keeps everyone focused. Next, we'll explore the four main types of analytics that help you turn raw data into meaningful insights.
 sfmagazine.comudacity.comen.wikipedia.org+22 min
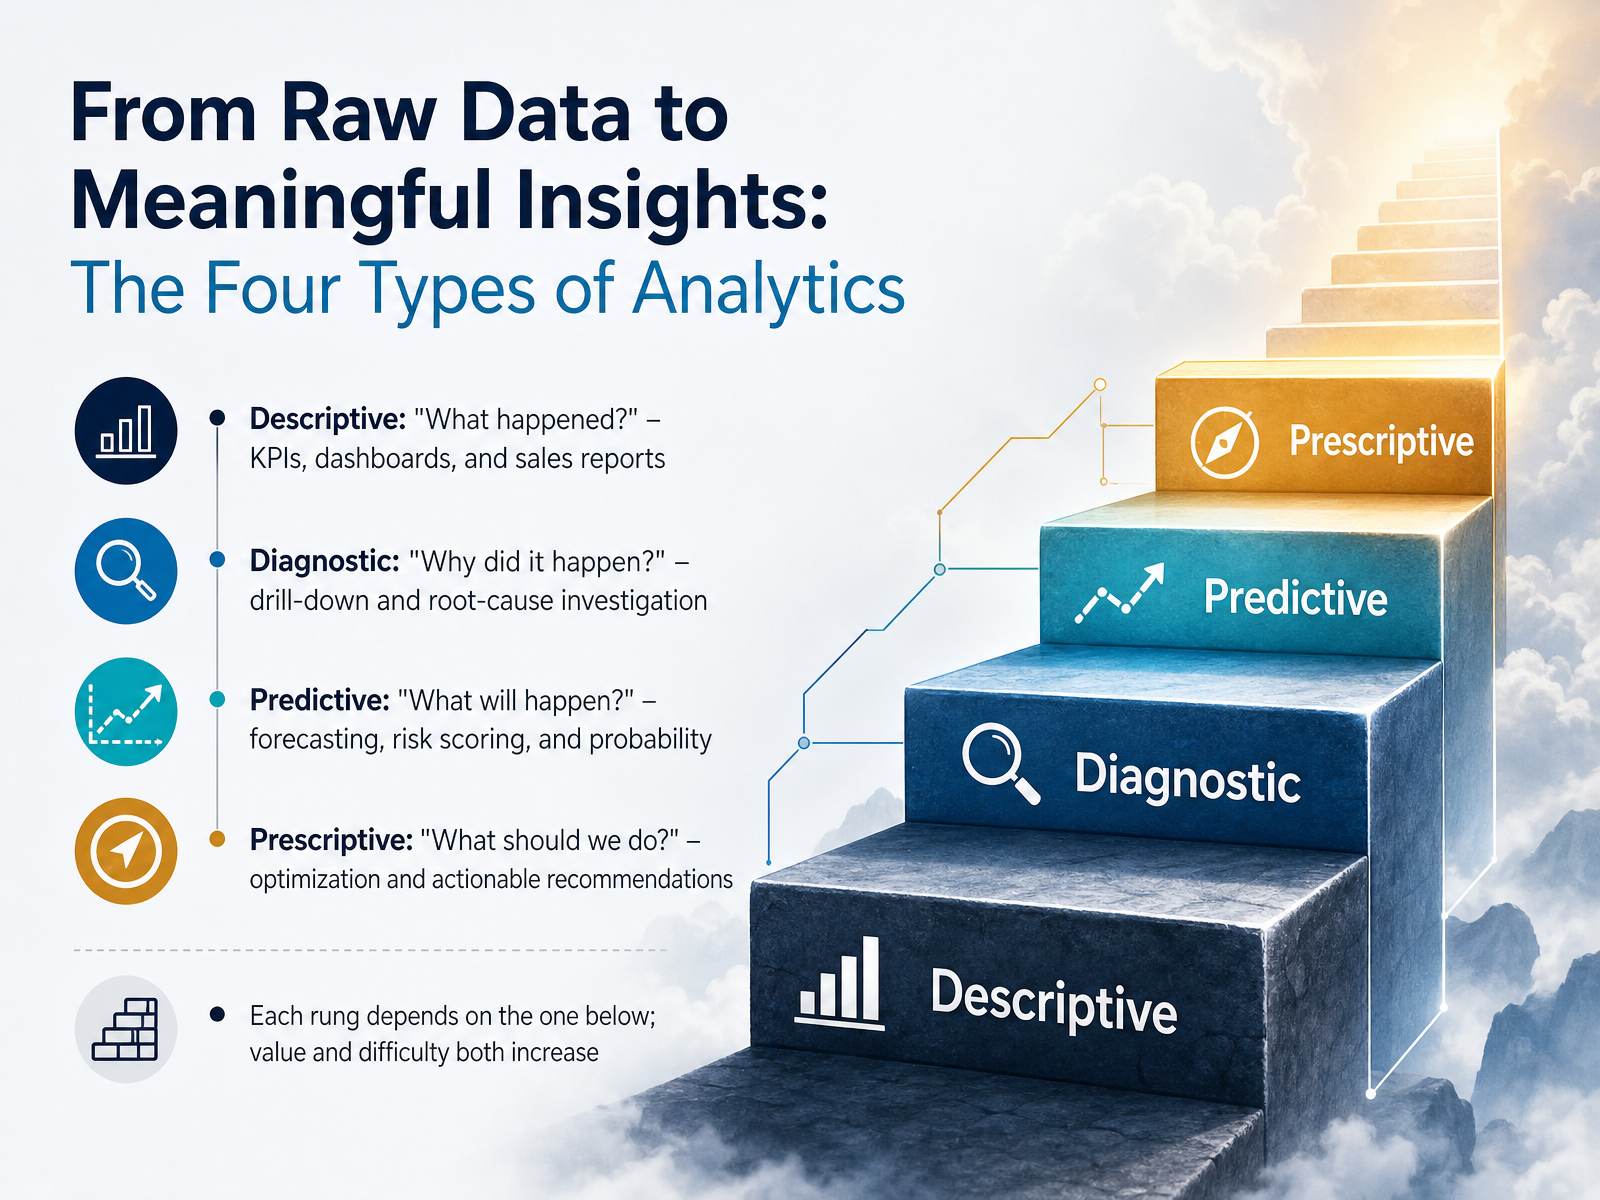
 - 07From Raw Data to Meaningful Insights: The Four Types of AnalyticsLet's now explore the four main types of analytics that turn raw data into meaningful insights. Think of them as rungs on a ladder, where each step depends on the one below it. The first rung is descriptive analytics, which answers 'What happened?' by summarizing historical data through dashboards and key performance indicators, like a weekly sales report showing revenue dropped twelve percent. The second rung is diagnostic analytics, which investigates 'Why did it happen?' by drilling down into the data to find the root cause, such as discovering that the sales drop was isolated to a specific region after a competitor's promotion. Moving up, we have predictive analytics, which asks 'What will happen?' by using historical patterns to forecast future outcomes, like scoring leads based on their probability to convert. Finally, prescriptive analytics answers 'What should we do?' by recommending specific actions, such as an optimization model telling a logistics team to reroute specific trucks to save time and fuel. As you climb, both the value and the difficulty increase, but a solid foundation in the descriptive and diagnostic rungs is where most real business value starts. Next, we'll take a single business question and walk it up this entire ladder with a practical example featuring Sparq Store.
 infinisynapse.commetricasoftware.comcoursera.org+22 min
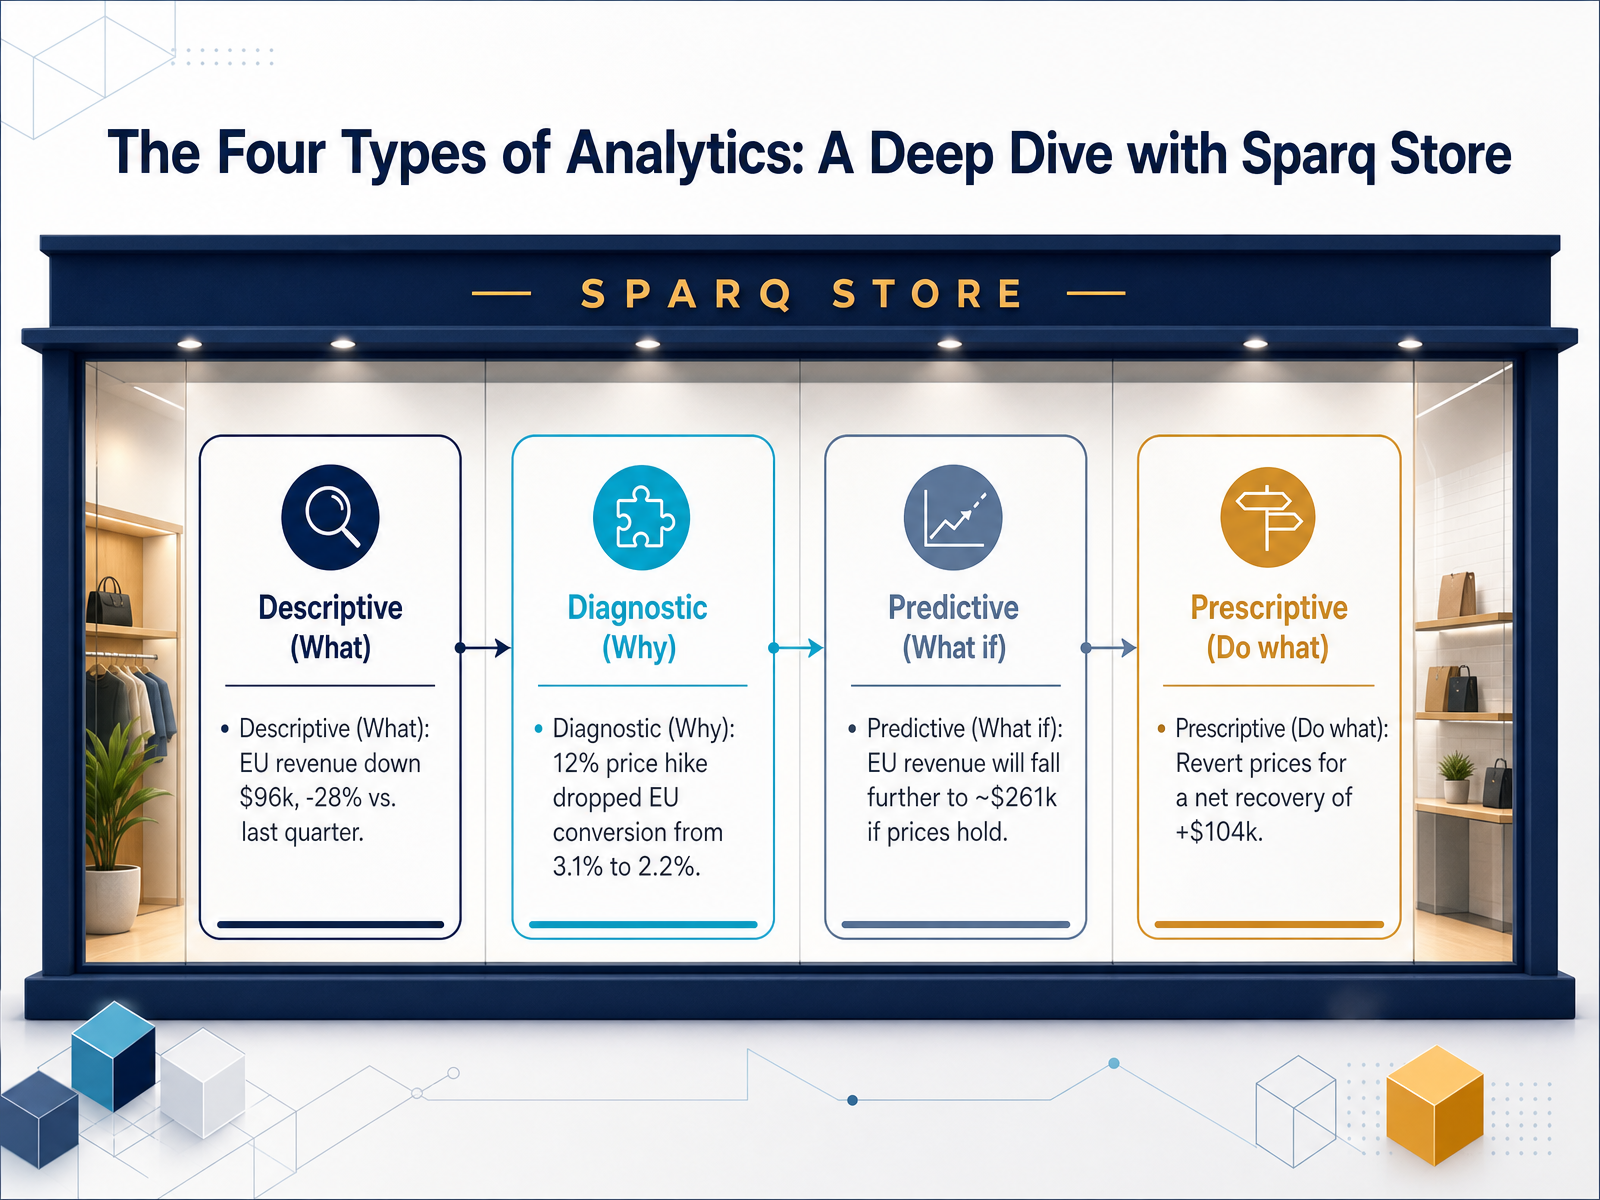
 - 08The Four Types of Analytics: A Deep Dive with Sparq StoreNow let's walk through all four types of analytics in one connected story, using a fictional online business called Sparq Store. This makes the progression really concrete. We start with descriptive analytics, which answers the question, what happened. The team pulls last quarter's numbers and sees European Union revenue dropped by about ninety-six thousand dollars, a drop of roughly twenty-eight percent. That is a clean descriptive fact. It tells us the outcome, but not the reason. So we move to diagnostic analytics to ask, why did it happen. By digging deeper, the team discovers that a twelve percent price increase in Europe drove the customer conversion rate down from three point one percent to only two point two percent. That diagnosis connects the price action directly to the revenue drop. Next we look forward with predictive analytics, asking what will happen if nothing changes. The forecast suggests European Union revenue will fall further to around two hundred sixty-one thousand dollars next quarter as some customers don't return. And finally, we reach prescriptive analytics, which asks what we should do about it. After modeling different options, the clear recommendation emerges. Reverting to the original prices is expected to recover about one hundred four thousand dollars in net revenue, far outweighing the small margin trade-off. So in just a few logical steps, we move from seeing a problem to knowing the smartest action to take. When you get comfortable with this sequence, you can apply it to almost any business question. Next up, we will explore an equally important skill. Visual storytelling, and how to communicate data clearly and honestly.
 infinisynapse.commetricasoftware.comcoursera.org+22 min
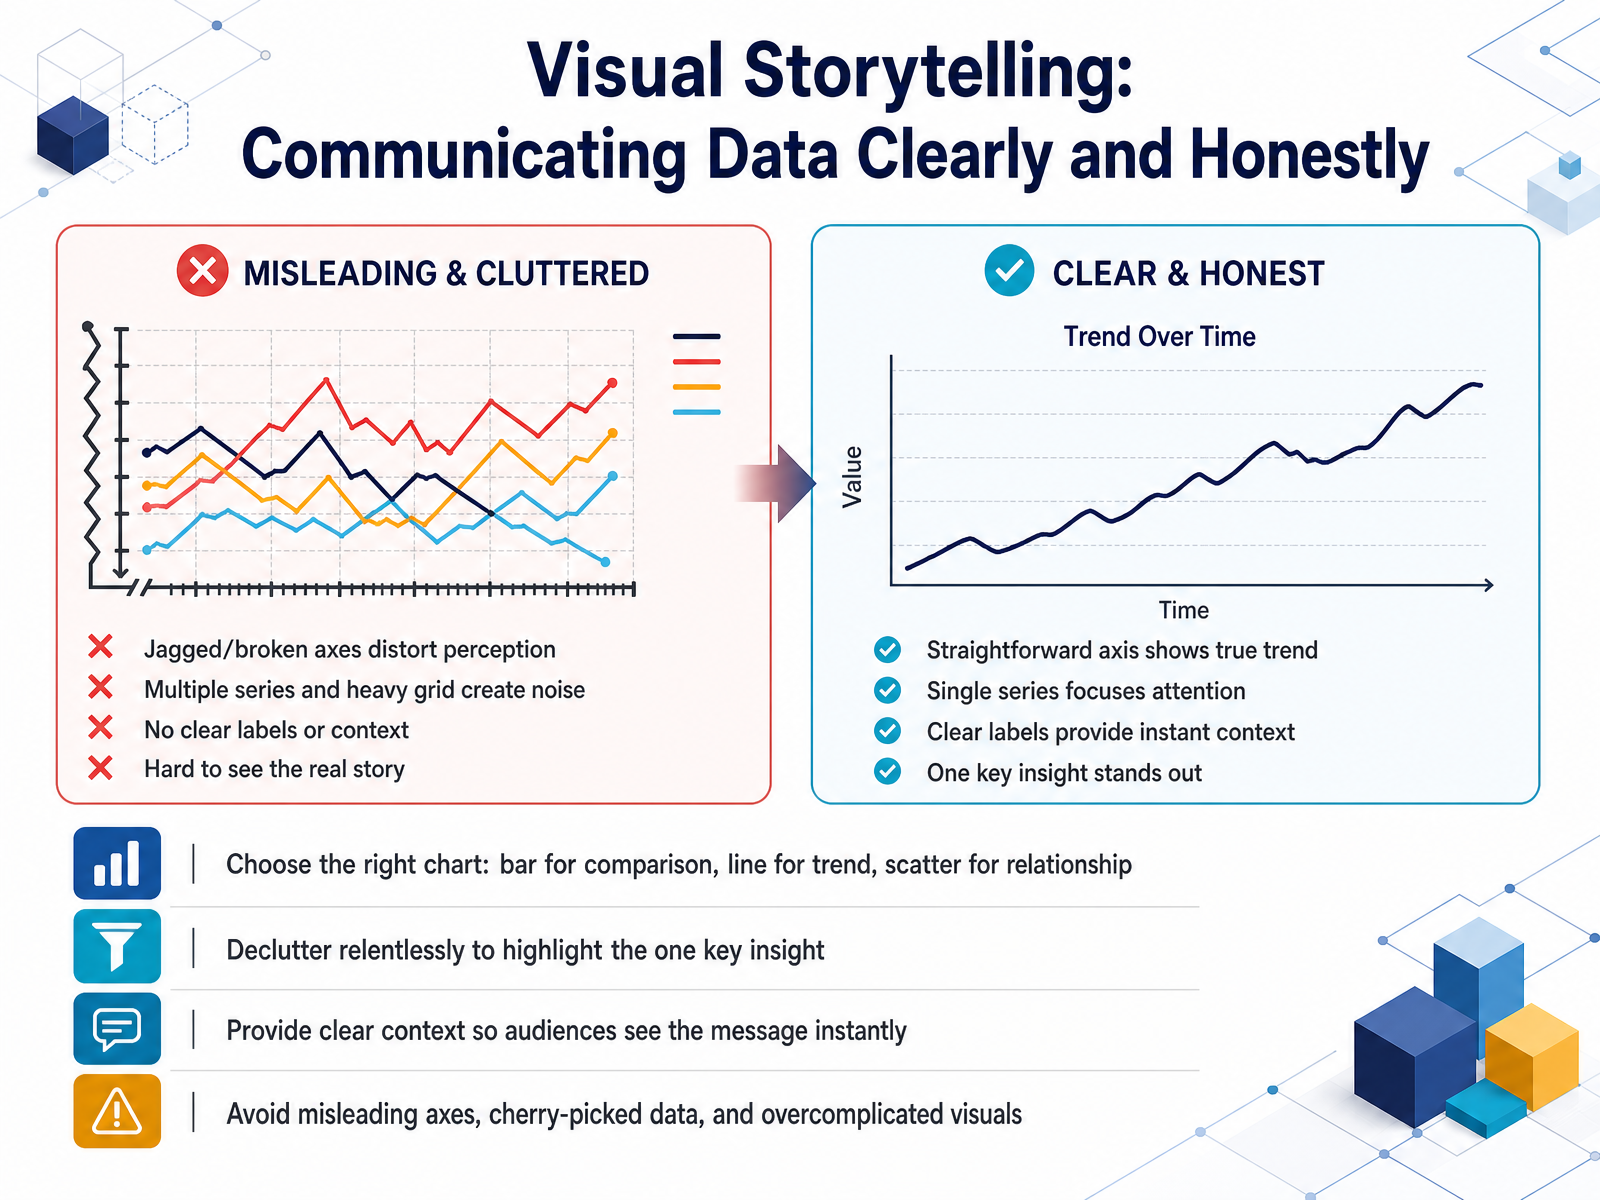
 - 09Visual Storytelling: Communicating Data Clearly and HonestlyNow, let's talk about visual storytelling. This is where you turn your data into a clear message your audience can understand instantly. The first rule is simple: match your chart to your goal. Use a bar chart to compare categories, like sales across different regions. A line chart is best for showing a trend over time, like monthly website visits. And a scatter plot helps you see a relationship between two things, like advertising spend versus new customers. Next, declutter relentlessly. Remove heavy gridlines, extra labels, or distracting colors. Every element you take away makes your one key insight stand out more. You also need to provide clear context. A good title and labeled axes mean your audience sees the message in seconds, without guessing. Finally, always be honest. Avoid starting a bar chart's axis at a misleading number, or zooming in on a timeline to cherry-pick a trend. Simple, honest visuals build trust and drive better decisions. Up next, we will peek into machine learning and AI to understand what you really need to know in 2026.
 2 min
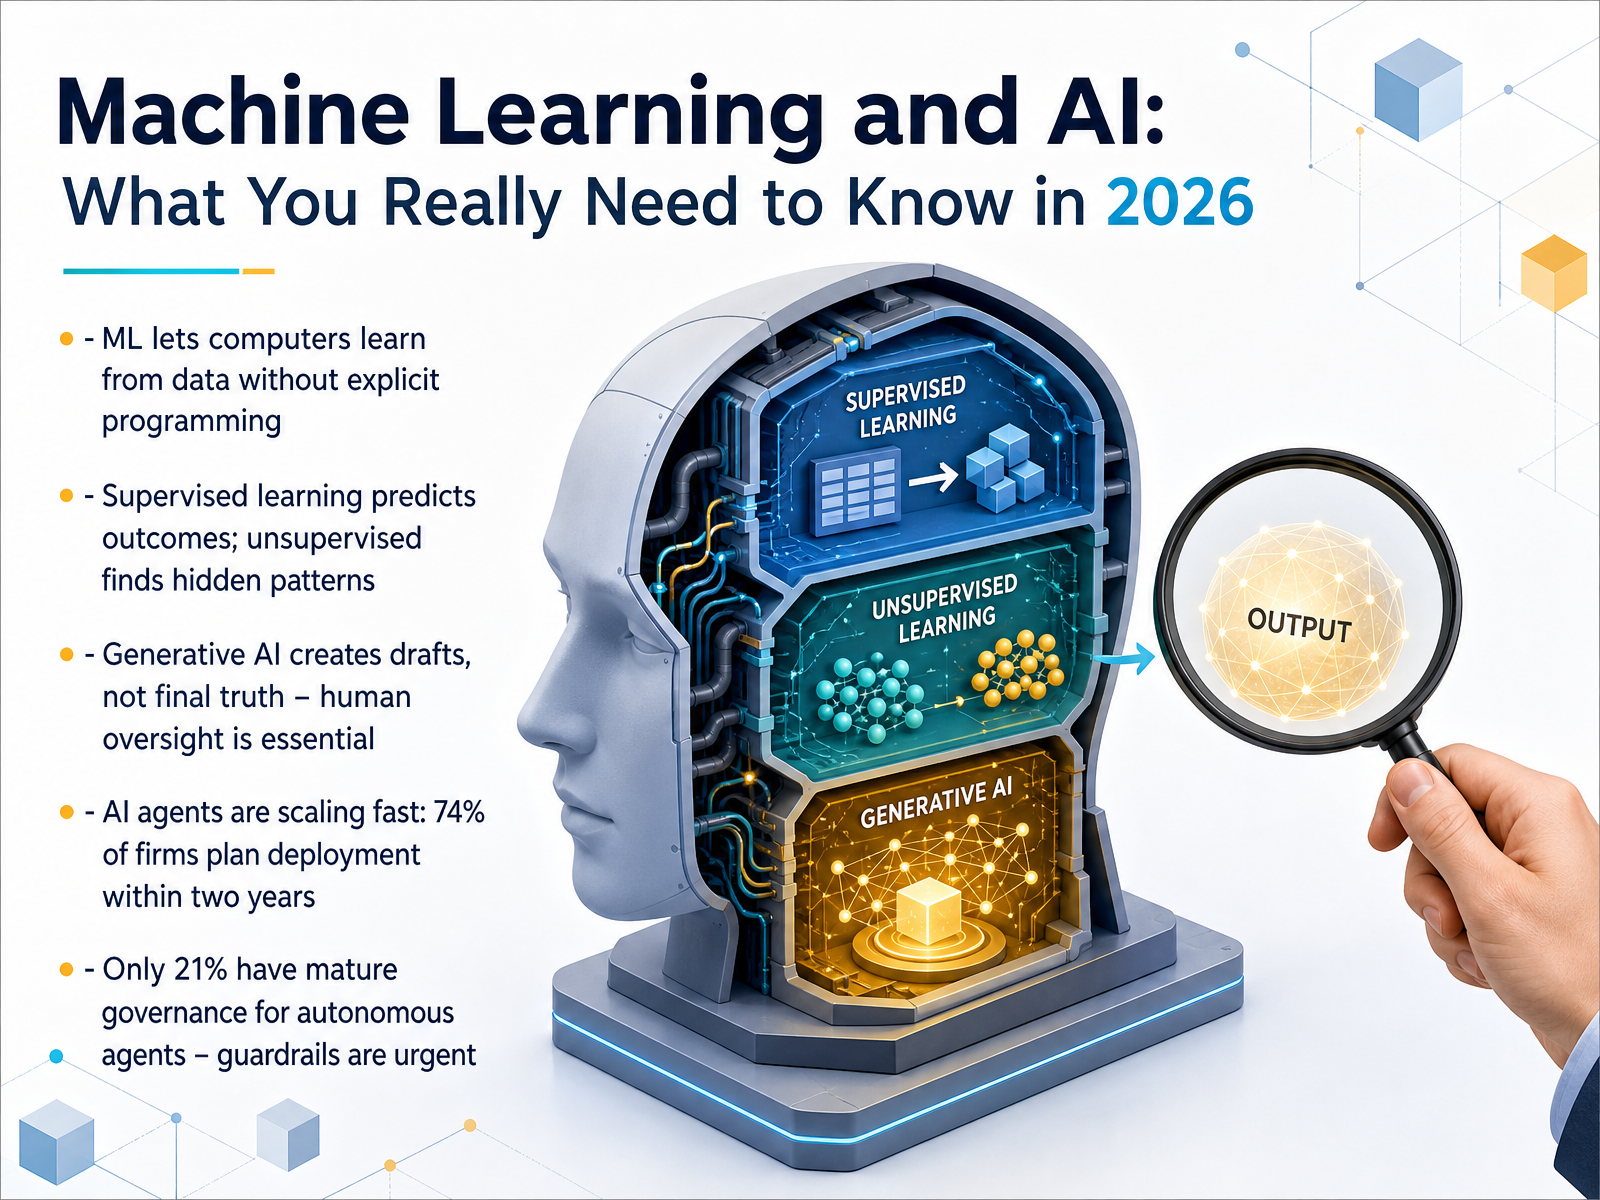
2 min - 10Machine Learning and AI: What You Really Need to Know in 2026Let's shift gears a bit and demystify two terms we hear constantly: machine learning and artificial intelligence. At its core, machine learning is simply the idea that computers can learn patterns from data without being programmed with specific step-by-step rules. Think of it like this: instead of telling a computer exactly what a fraudulent transaction looks like, you show it a million examples, and it learns the pattern on its own. That's supervised learning, where you guide the model to predict a known outcome. Unsupervised learning, on the other hand, finds hidden groupings you didn't even know to look for, like customer segments you never identified. Now, generative AI takes this further by creating new drafts—text, images, or code—but here's the critical part for all of us: it creates a first draft, not a final truth. Human oversight is absolutely essential to verify accuracy. This is especially urgent as we see the rise of AI agents, which are autonomous systems that can perform multi-step tasks. Data from Deloitte shows three out of four companies plan to deploy these agents within two years. Yet, only one in five have mature governance in place. The guardrails are racing to catch up. With that need for oversight in mind, let's tackle one of the most crucial topics: ethics and responsibility in the age of AI.
 deloitte.comhai.stanford.eduoxfordeconomics.com+22 min
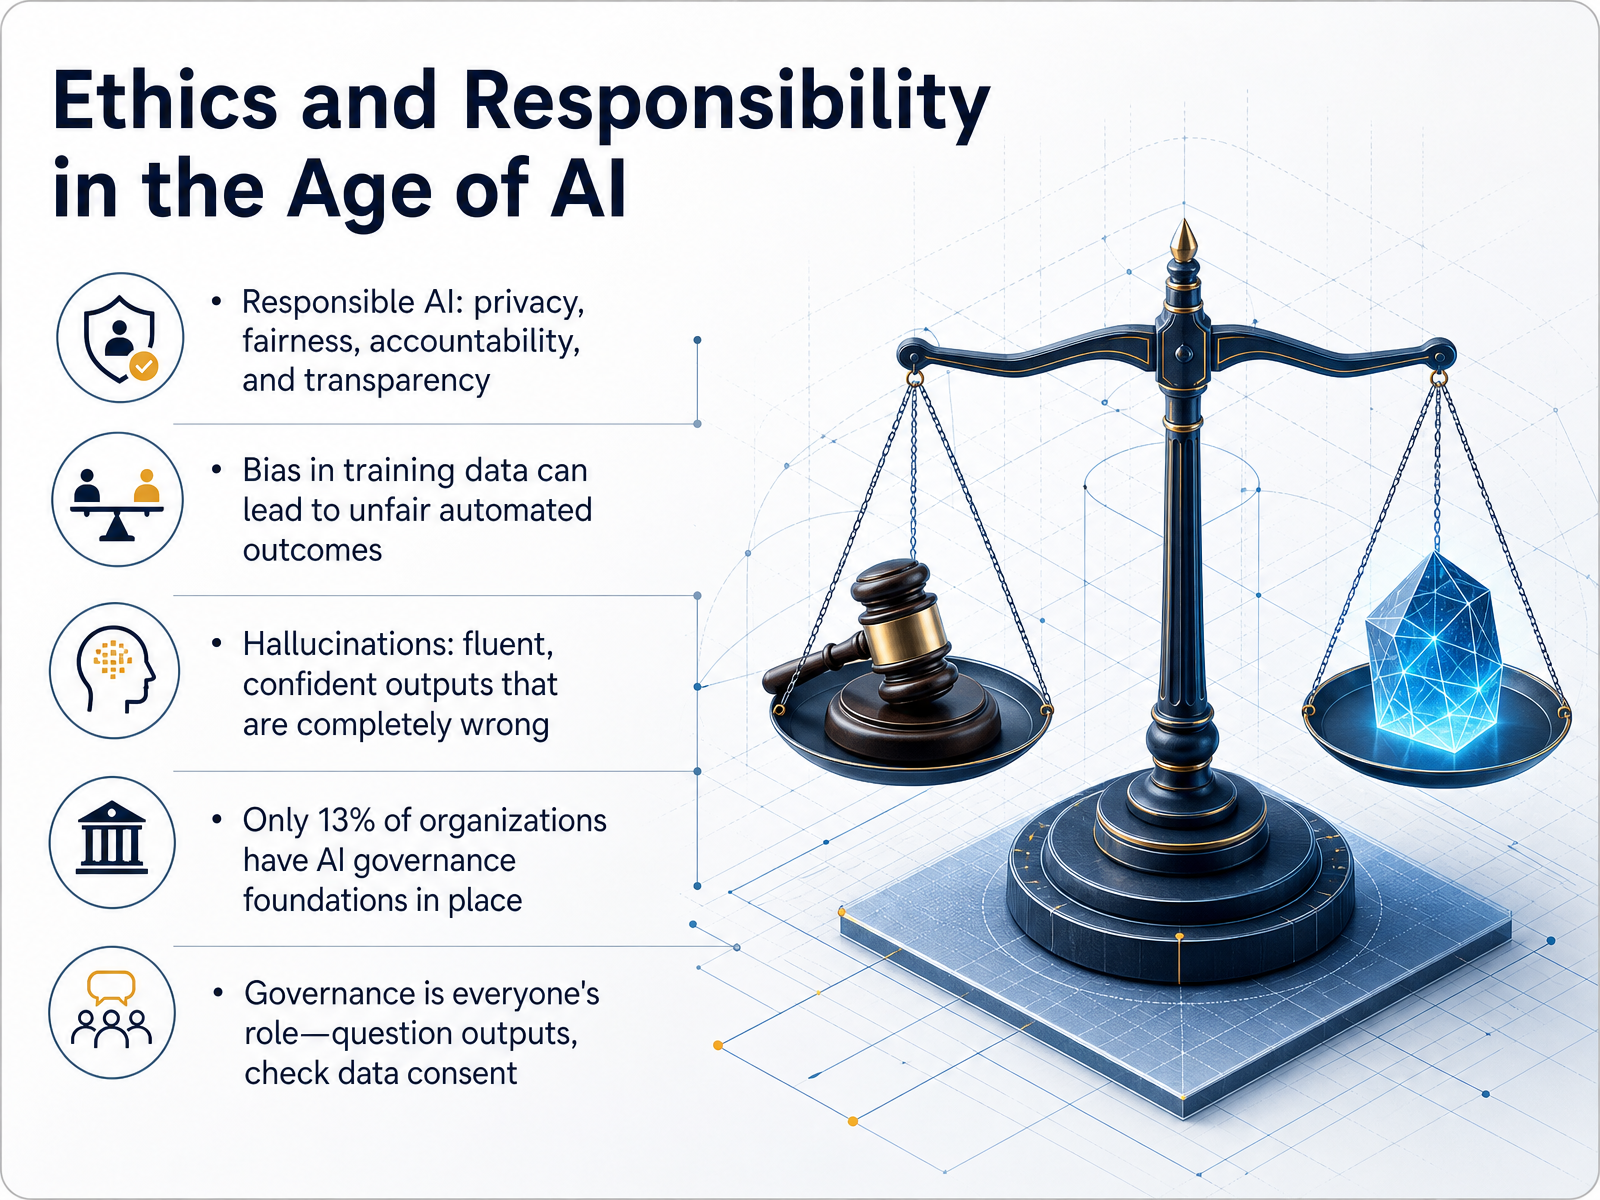
 - 11Ethics and Responsibility in the Age of AINow let's talk about something that's becoming more important every day: ethics and responsibility in the age of AI. Think of this as building a strong safety net beneath all the powerful tools we've discussed. First, the core principles are privacy, fairness, accountability, and transparency. In practice, that means always asking: Do we have consent to use this data? Can we explain how a decision was made? Who is responsible if something goes wrong? A major risk is bias. If the data we use to train an AI contains hidden prejudices, the automated outcomes will be unfair, like a hiring tool that overlooks qualified candidates because of skewed historical data. Another critical issue is 'hallucinations.' That's when an AI generates a response that sounds fluent and confident but is completely wrong. These aren't lies; the model simply doesn't know what it doesn't know. Here's a number that should give us all pause: only thirteen percent of organizations have basic AI governance foundations in place. That means most companies are scaling AI without a real safety net. But here's the good news: governance isn't just for lawyers or executives. It's everyone's role. You can contribute by questioning surprising outputs, checking data consent, and treating AI as a tool that supports your judgment, not a replacement for it. Let's carry this mindset of shared responsibility forward as we look at collaborating effectively with data teams and tools.
 deloitte.comhai.stanford.eduoxfordeconomics.com+22 min
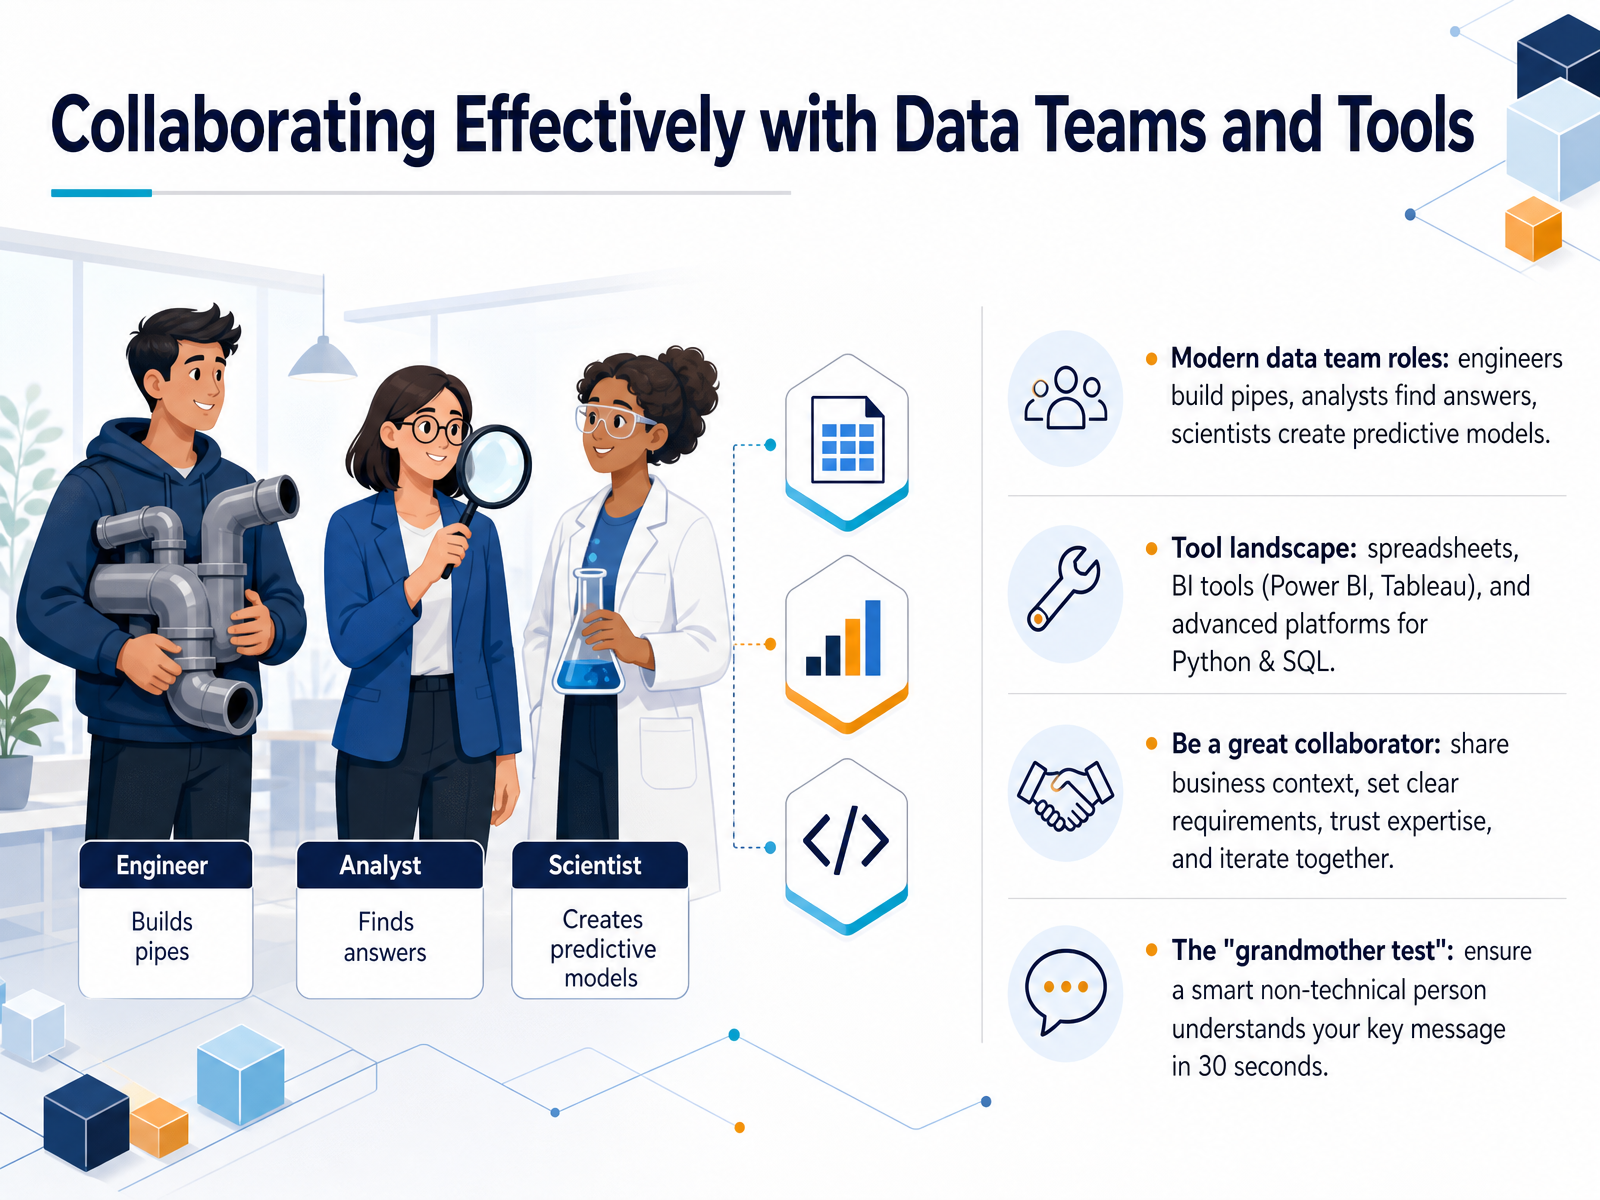
 - 12Collaborating Effectively with Data Teams and ToolsNow, let's talk about how to collaborate effectively with data teams and the tools they use. Think of a modern data team like a construction crew, with three key roles. First, data engineers build the pipes and infrastructure that move data around reliably. Second, data analysts dig into that data to find answers to specific business questions, like why sales dropped last month. And third, data scientists create predictive models, like forecasting next quarter's revenue. Understanding these roles helps you know who to go to for what. You'll also encounter a landscape of tools. You have your familiar spreadsheets, powerful business intelligence tools like Power BI and Tableau for dashboards, and advanced platforms for coding in Python and SQL. But remember, being a great collaborator isn't about knowing every tool. It's about sharing the 'why' behind your request—the full business context—setting clear requirements, trusting their technical expertise, and then iterating on the solution together. A helpful mental check is what some call the 'grandmother test.' When you share a result, could a smart, non-technical person understand your key message and the recommended action in just 30 seconds? If not, it's a signal to simplify your communication, which makes collaboration far more effective. Next, we'll turn these ideas into practical first steps on your own data literacy journey.
 deloitte.comhai.stanford.eduoxfordeconomics.com+22 min
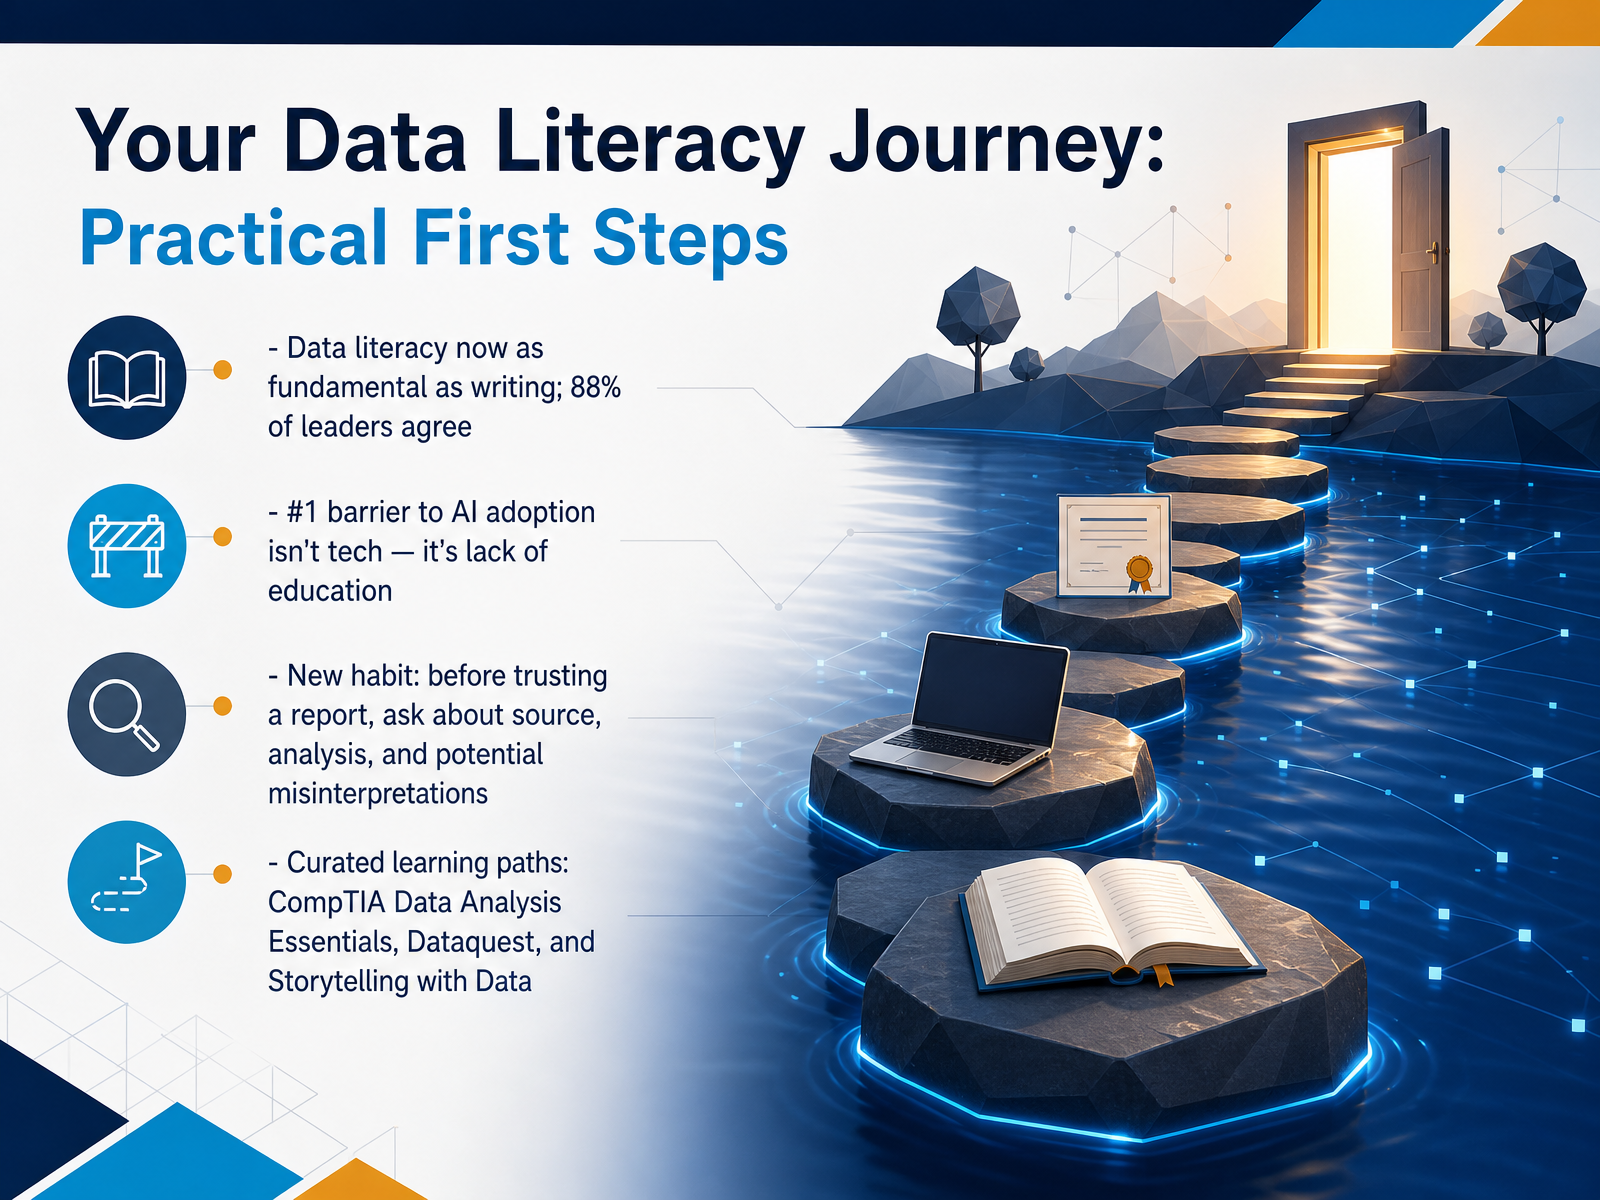
 - 13Your Data Literacy Journey: Practical First StepsData literacy has truly become a baseline expectation, much like writing. In fact, a recent report found that 88 percent of business leaders now agree it is as fundamental as the ability to write. It is no longer a niche skill reserved for analysts. When companies hit a wall with AI adoption, the number one barrier is not the technology itself. It is the lack of education and foundational understanding across the team. So, how do you start building this muscle? I want to share one new habit you can use immediately. Before you trust any report or dashboard, pause and ask three simple questions. First, where did this data come from? Second, how was it analyzed? And third, what might be misinterpreted or missing? These questions will protect you from bad decisions and build your critical thinking. If you want to go deeper, there are excellent curated paths. You can take CompTIA Data Analysis Essentials for practical, hands-on exercises. Dataquest offers a great path on data literacy and AI fundamentals. And I highly recommend the book 'Storytelling with Data' to master clear communication. These are all built for busy professionals, not just technical experts.
 2 min
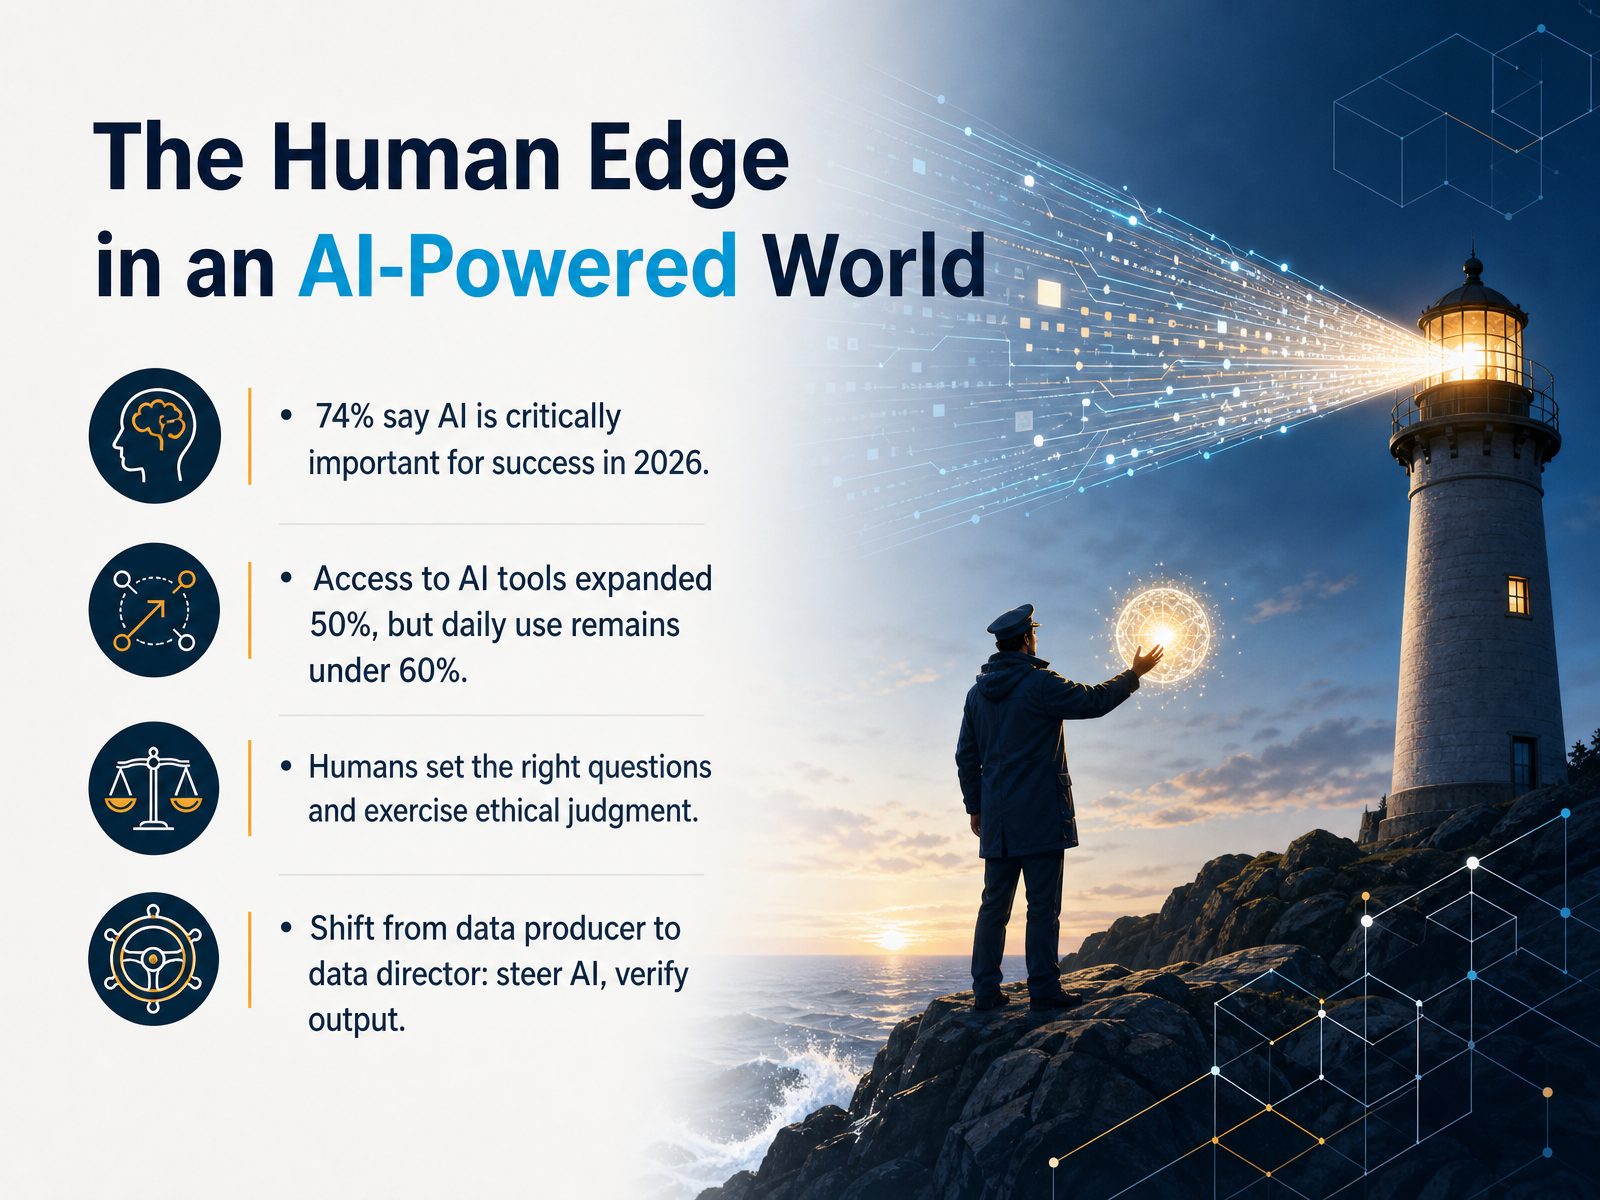
2 min - 14The Human Edge in an AI-Powered WorldWe have talked a lot about what AI can do, but let us bring it back to what makes your role so essential. Think of this as the human edge. The numbers tell an interesting story. Seventy-four percent of professionals now say AI is critically important for success. Companies have expanded access to AI tools by fifty percent in just one year. Yet, daily use still hovers under sixty percent. That gap is not a technology problem. It is a human opportunity. The real value is unlocked when you step in to ask the right questions and apply ethical judgment. AI can produce a draft, but you know if it is accurate, fair, and useful. Your role is shifting from a data producer to a data director. Instead of doing the manual grind, you now steer the AI, verify the output, and make the final call. It is like moving from being the engine to being the driver. You do not need to build the car; you just need to know where you want it to go. Up next, we will wrap up with the key takeaways for your data journey ahead.
 deloitte.comhai.stanford.eduoxfordeconomics.com+22 min
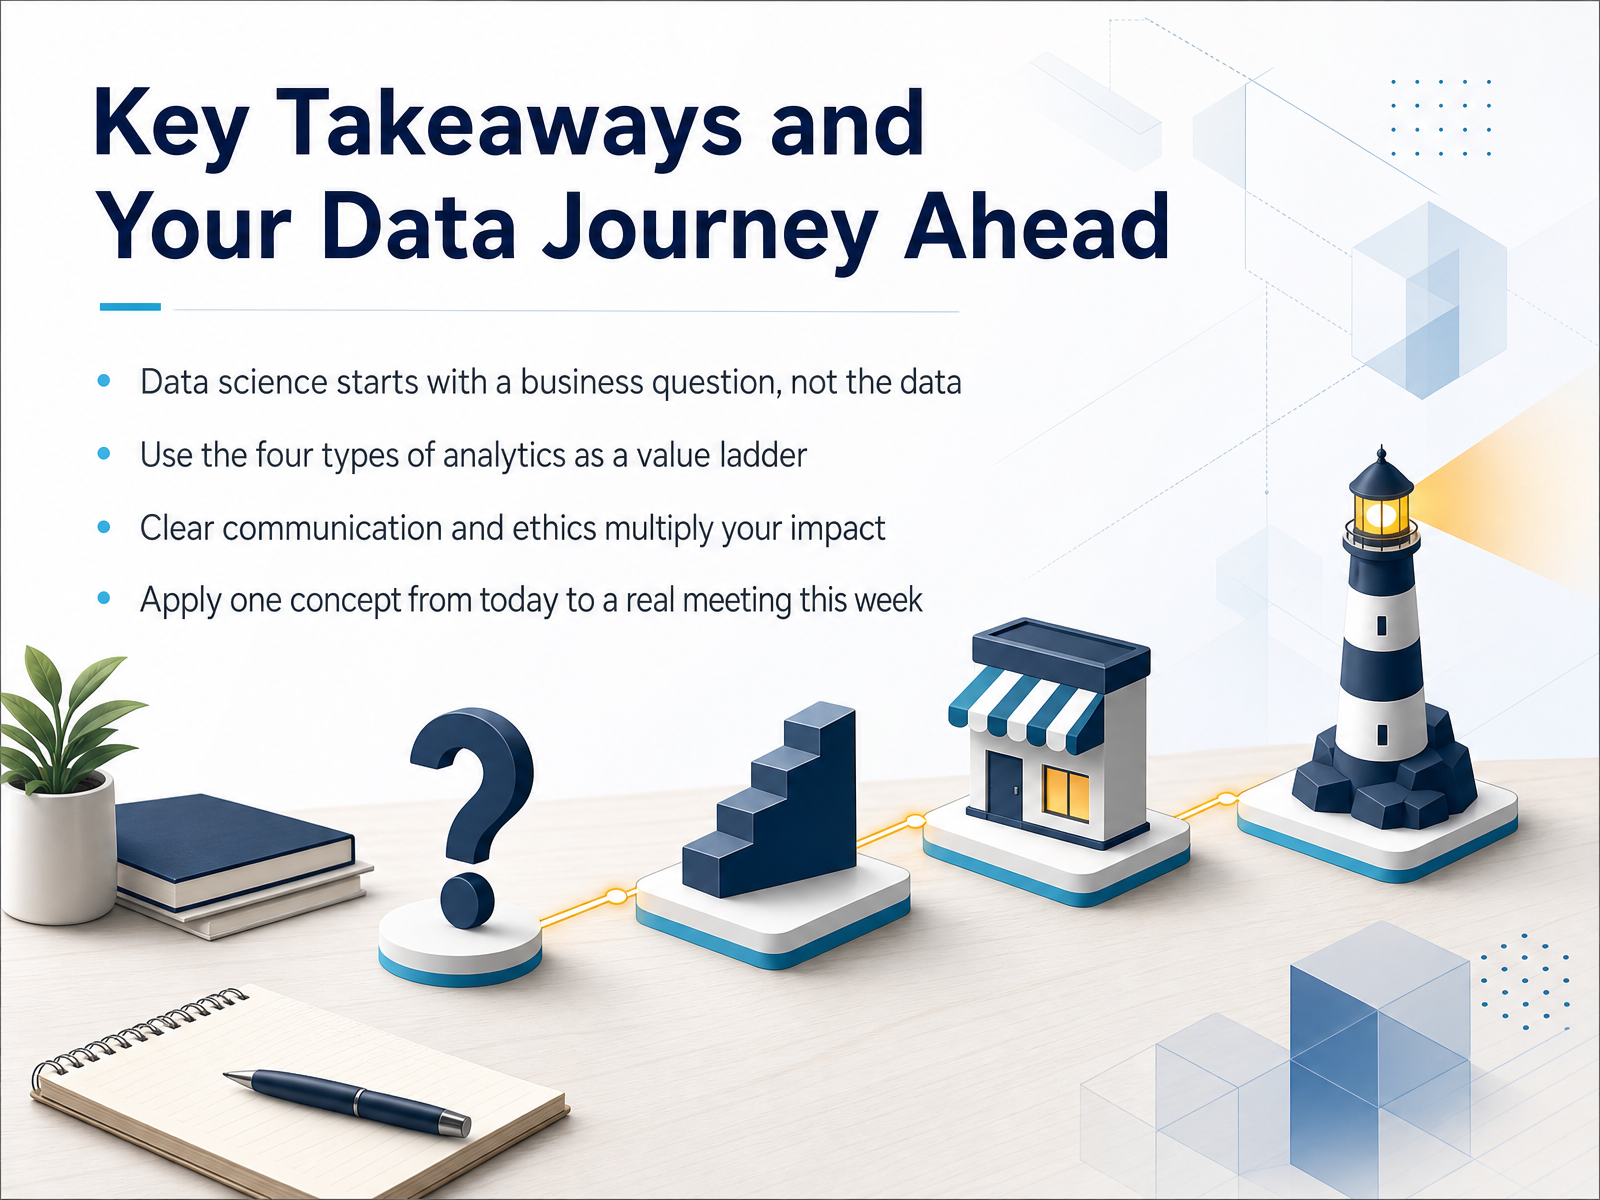
 - 15Key Takeaways and Your Data Journey AheadLet's take a moment to anchor everything we've covered. The first and most important takeaway is this: data science always starts with a clear business question. You don't begin with a pile of data and hope to find something. You begin by asking what you need to know to make a better decision. Second, think of the four types of analytics as a value ladder. You can start simply by describing what happened, and when you're ready, you can climb toward predicting what might happen next. Third, remember that your technical skill gets you the insight, but clear communication and strong ethics multiply your impact. A simple analysis, presented clearly and used responsibly, can drive millions in business value. And finally, your challenge is to take just one concept from today and apply it in a real meeting this week. Maybe you'll ask a sharper question about a data source, or suggest a clearer chart. Small, deliberate practice builds lasting confidence. Thank you for your time and your attention today. You now have a practical foundation—go out and start your data journey, one smart question at a time.
 2 min
2 min
Take the deck with you
Download this course as a file — free, no sign-up needed.
- PDF handoutEvery slide page, ready to print or share.16 pages · 4.3 MBDownload
- Narrated PowerPointThe deck that presents itself — every slide carries the digital human's narration video.16 pages · 18.3 MBDownload
- PowerPoint slidesThe full deck as a .pptx — open it in PowerPoint, Keynote, or Google Slides.16 pages · 4.2 MBDownload
Free to use in your own training — please keep the PersonWise credit page at the end.
Have your own deck? Turn it into a course
Sources consulted
Web sources consulted while building this course.
- Bestseller case study: Reducing fashion returns with AI — business.google.com
- From weeks to minutes: How Formula 1® uses agentic AI on AWS to accelerate data operations | Artificial Intelligence — aws.amazon.com
- Muji: Grow sales with OMO marketing - Think with Google APAC — business.google.com
- Natura &Co Transforms Finance with Generative AI | SAP News — news.sap.com
- Evolving from legacy BI to agentic AI at Tradeshift with Amazon Quick | Artificial Intelligence — aws.amazon.com
- The State of AI in the Enterprise — deloitte.com
- The 2026 AI Index Report | Stanford HAI — hai.stanford.edu
- The Value of AI 2026 | Oxford Economics — oxfordeconomics.com
- 2026 State of AI for Business Report — smarterx.ai
- Results and prospects for AI in business applications in 2026 | Computer Weekly — computerweekly.com
- A Data Analytics Mindset with CRISP-DM | IMA — sfmagazine.com
- CRISP-DM Explained: A Proven Data Mining Methodology — udacity.com
- Cross-industry standard process for data mining — en.wikipedia.org
- Data Mining Techniques: CRISP-DM Framework Explained — online.csp.edu
- IBM SPSS Modeler CRISP-DM Guide — public.dhe.ibm.com
- Data Analysis Techniques: Methods & Examples | InfiniSynapse — infinisynapse.com
- 4 Types of Data Analytics: Descriptive, Diagnostic, Predictive ... — metricasoftware.com
- Descriptive, Predictive, and Prescriptive Analytics — coursera.org
- Types of Data Analytics Enterprises Should Use in 2026 — tblocks.com
- Descriptive → Prescriptive — Business Analytics — datarekha — datarekha.com