How Compilers Work
Begin
12 pages · ~24 min
How Compilers Work
An introduction to how compilers transform source code into executable programs, exploring key stages like lexical analysis, parsing, and code generation.
What you’ll learn
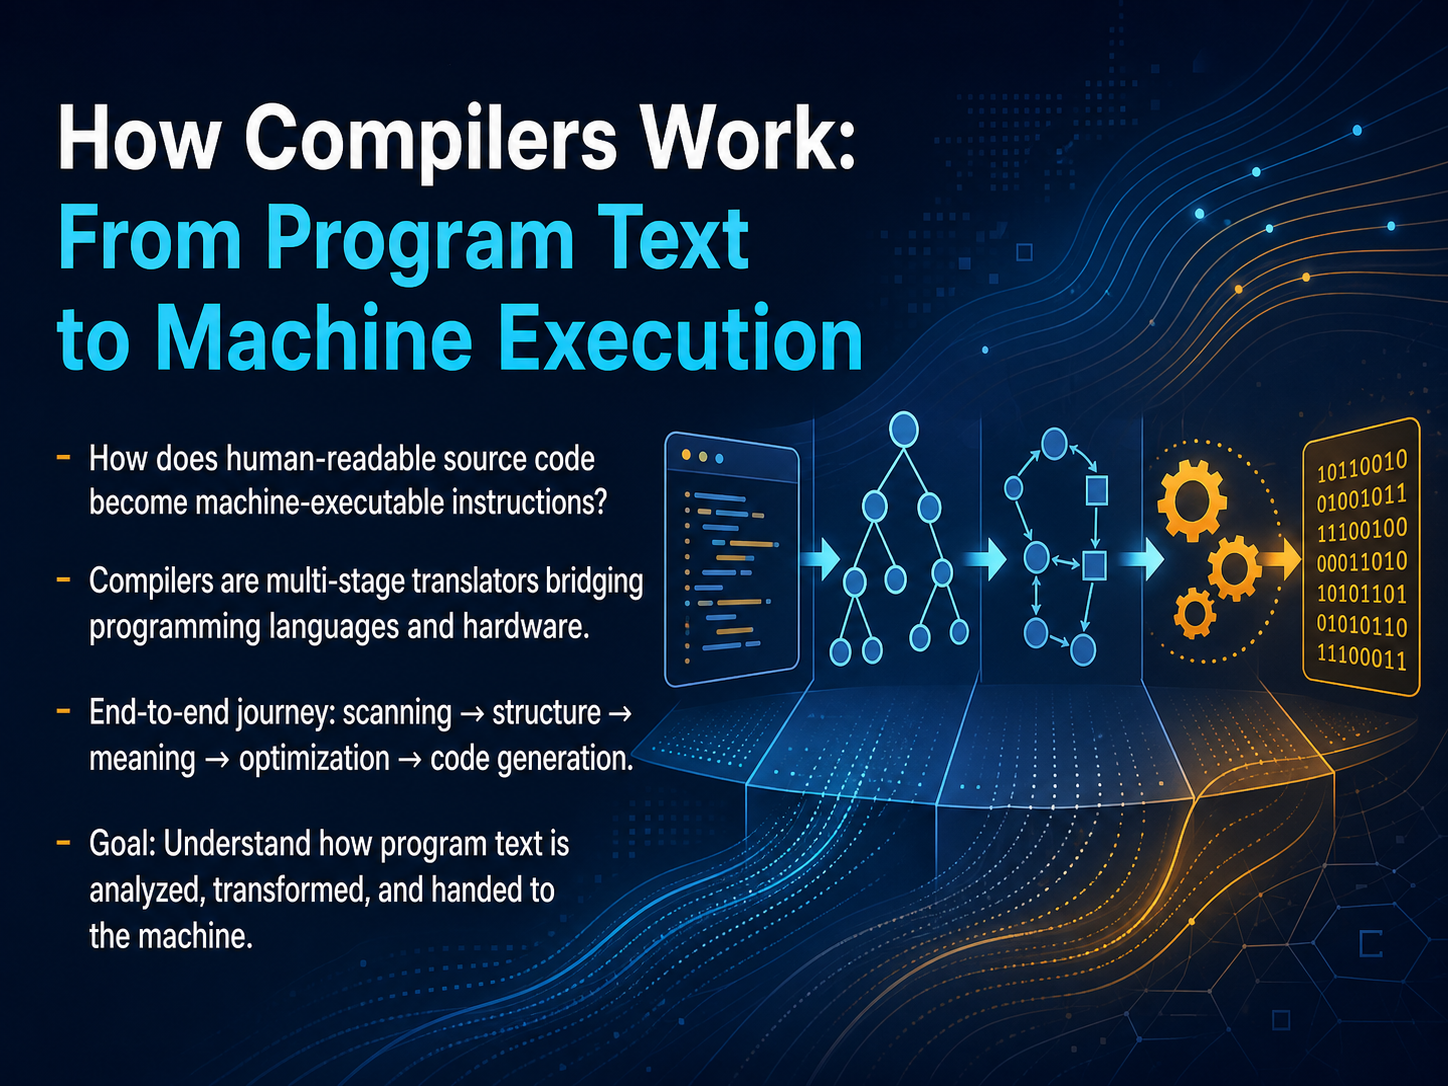
- 01How Compilers Work: From Program Text to Machine ExecutionWelcome. Today we are going to walk through how a compiler works, from the program text you write all the way down to machine execution. You have probably typed a build command hundreds of times, but what actually happens between your source code and the running process? That is exactly what we are here to unpack. A compiler is a multi-stage translator. It reads your human-readable code, verifies that it makes sense, transforms it through several representations, optimizes it, and finally emits the low-level instructions your hardware understands. By the end of this session you will have a clear mental model of the full journey: scanning the raw text, building structure, analyzing meaning, applying optimizations, and generating machine code. Think of it as learning the engineering inside a tool you already trust. Let us start by looking at the big picture of the compilation pipeline.snapshots.sourceware.orgwiki.gentoo.orgsnapshots.sourceware.org+22 min
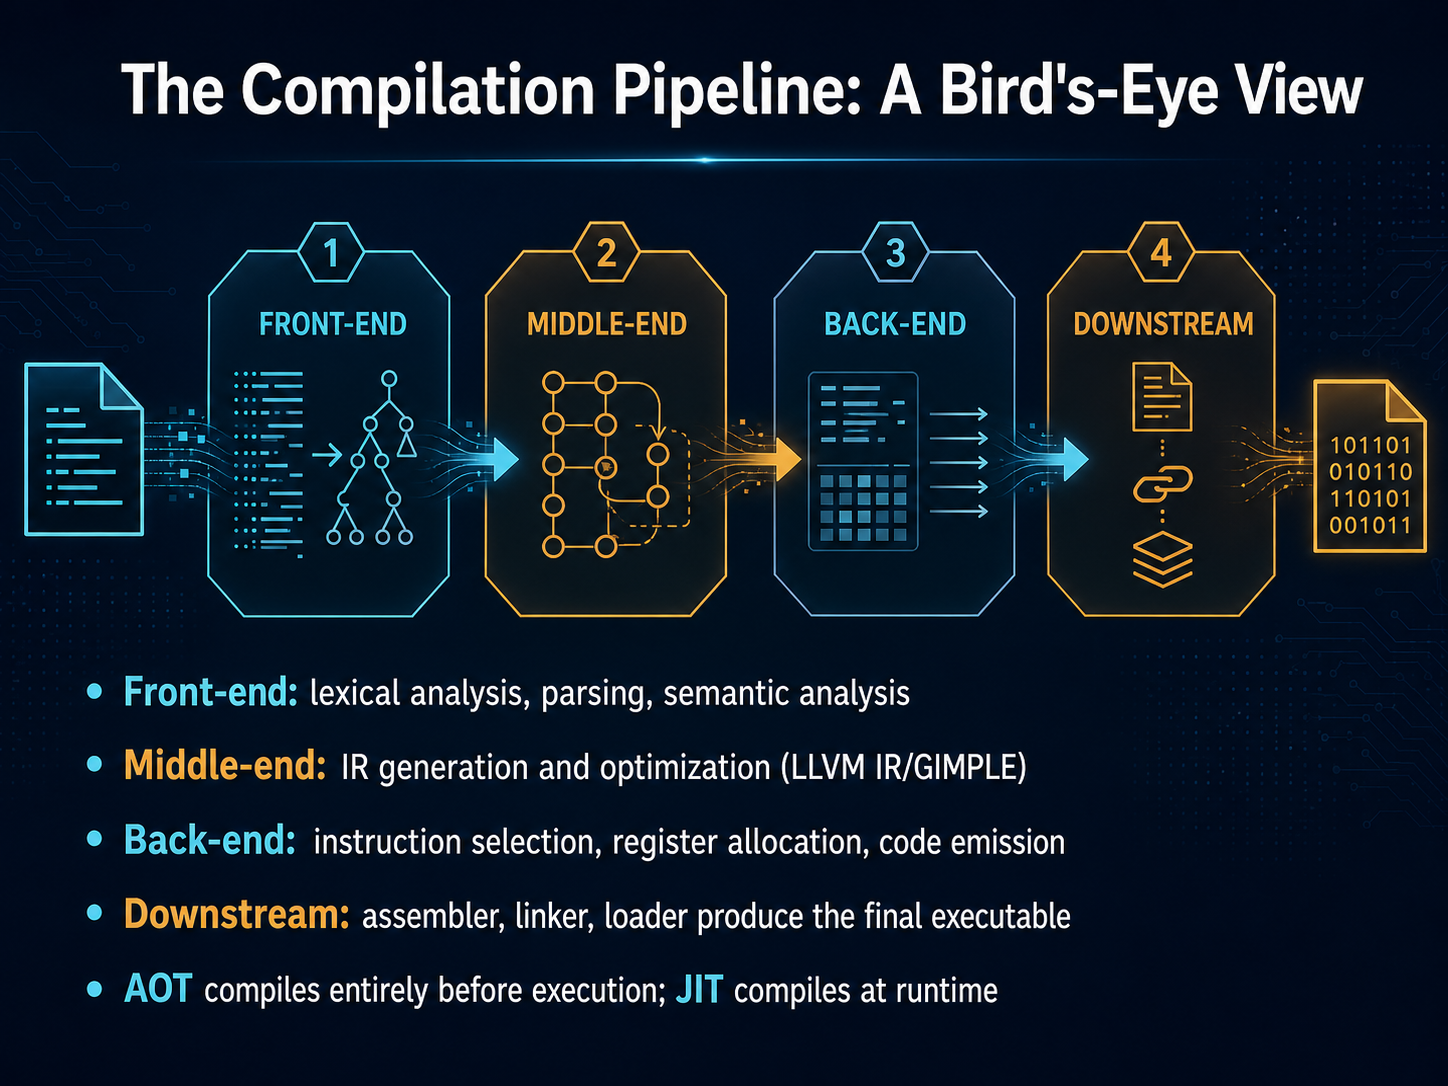
- 02The Compilation Pipeline: A Bird's-Eye ViewNow, let's zoom out and look at the entire compilation pipeline from a bird's-eye view. Think of a compiler not as a single, monolithic translator, but as a chain of specialized stages, each transforming the program into a different representation. The pipeline starts with the front-end. This stage reads your source text and performs lexical analysis to break it into tokens, then parsing to build a syntax tree, and finally semantic analysis to verify meaning. Next, the middle-end takes over. It generates an Intermediate Representation, like LLVM IR or GCC GIMPLE. This IR is a neutral instruction set that is not tied to any specific source language or target machine. The middle-end runs optimization passes on this IR, improving speed and reducing size in a language- and target-independent way. From there, we move to the back-end. This stage handles instruction selection, choosing real CPU operations, and register allocation, mapping virtual variables to physical hardware registers. It then emits the final machine code. After code emission, downstream tools take charge. The assembler converts instructions into object code, the linker combines object files and resolves references, and the loader brings the final executable into memory. Finally, there are two overarching strategies. Ahead-of-time compilation does all this work before the program ever runs. Just-in-time compilation does it on the fly at runtime, optimizing based on actual usage. Now that we have the big picture, let's dive into the very first step: Lexical Analysis, where we scan raw text into meaningful tokens.
 llvm.orgllvm.orgdeepwiki.com+22 min
 - 03Lexical Analysis: Scanning Text into TokensNow let's dive into the first major step: lexical analysis, often called scanning. This is where your source code gets broken down into the smallest meaningful pieces, called tokens. Think of tokens as the atomic units of your language—keywords like `if` or `while`, identifiers like variable names, literals like the number two, operators, and delimiters. To recognize these tokens efficiently, the lexer uses regular expressions to describe their patterns. Under the hood, these patterns are turned into finite automata, which are state machines that can scan through the text at high speed. Let’s see a quick example. Given the line `result = a + b * 2;`, the lexer produces a stream of tokens: an identifier for result, an equals operator, an identifier for a, a plus operator, identifier b, multiply operator, and the literal two. It strips away the meaning of the expression and just delivers a clean list of symbols. When building a lexer, you often have a choice: you can use a scanner generator like flex or lex, which gives you a very readable specification, or you can write one by hand for maximum performance and control. Tools like Tree-sitter take this concept even further, producing robust, incremental parsers that can handle syntax errors gracefully. With our tokens ready, the next stage—syntax analysis—uses these building blocks to construct a structured tree. That's exactly what we'll cover next in Syntax Analysis: Parsing Structure from Tokens.
 tree-sitter-tree-sitter.mintlify.apptree-sitter.github.iotree-sitter.github.io+22 min
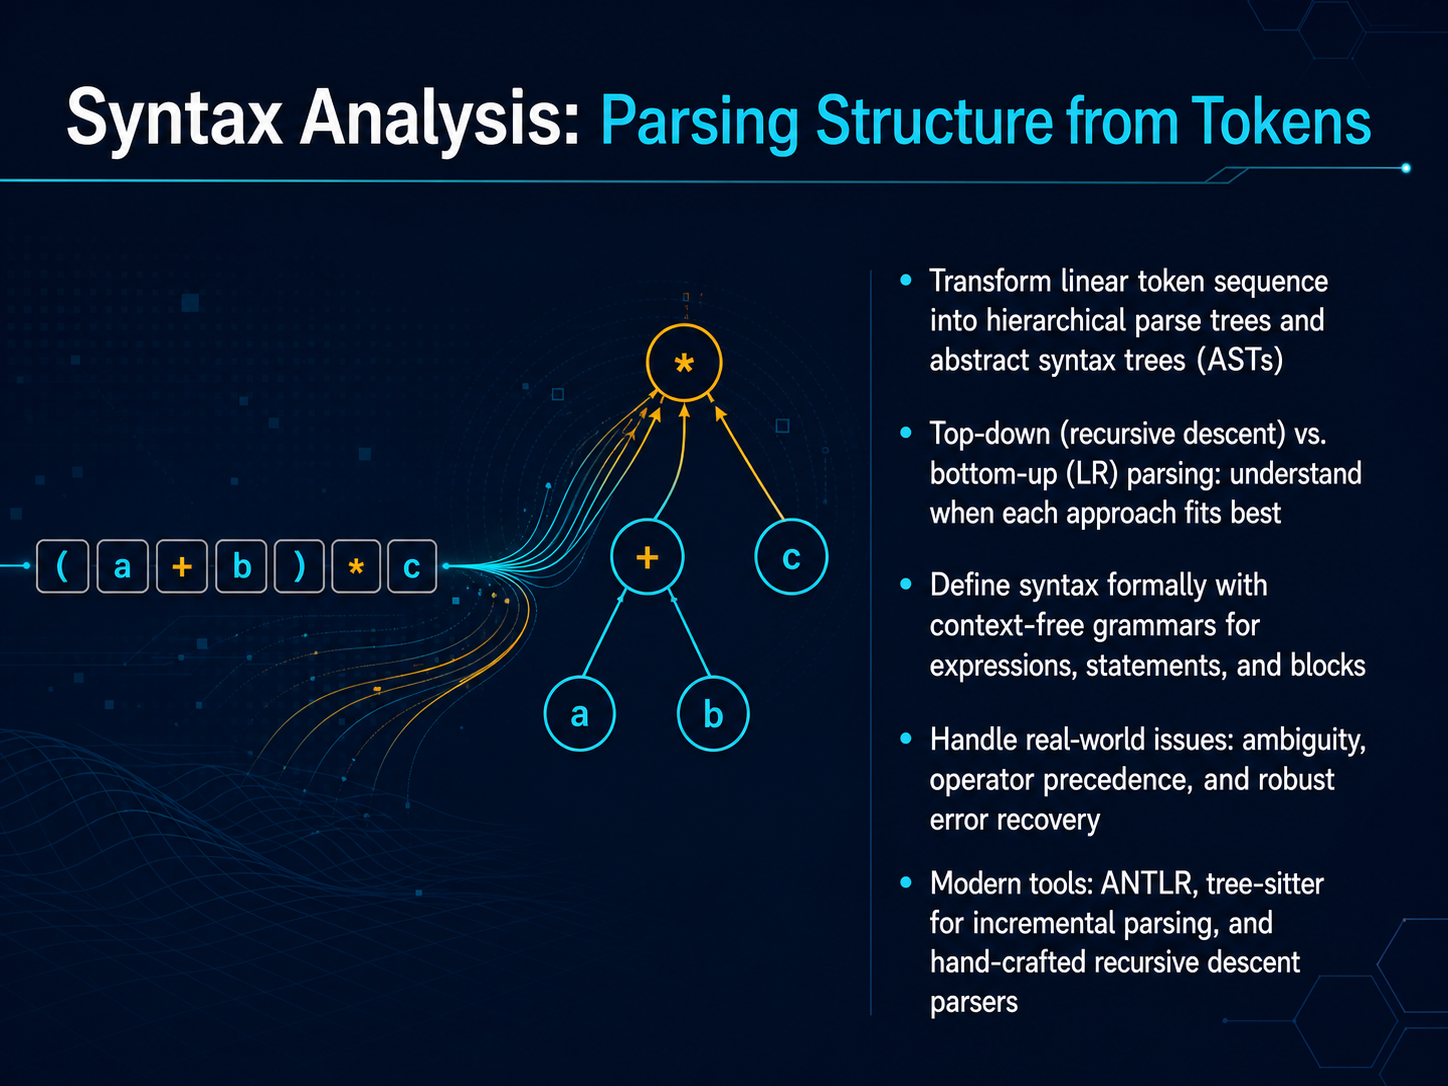
 - 04Syntax Analysis: Parsing Structure from TokensNow that the lexer has produced a flat list of tokens, we need to give that list structure. That's the parser's job, and we call this stage syntax analysis. The parser transforms that linear token sequence into a hierarchical representation—usually a parse tree or, more commonly, an abstract syntax tree, or AST. An AST strips away syntactic noise like semicolons and keywords, leaving a clean tree that captures the logical nesting of expressions and statements. To define the rules of this structure, we use a context-free grammar. This formally specifies what sequences of tokens are valid for expressions, statements, and blocks. When you're building a parser, you generally choose between a top-down approach, like recursive descent, and a bottom-up approach, like LR parsing. Recursive descent is hand-written and intuitive, while LR parsers are more powerful and automated. Real-world grammars introduce tricky problems like ambiguity and operator precedence. An expression like 'a minus b minus c' requires us to enforce left-associativity, which the parser's rules handle. Parsers also have to be robust, recovering from syntax errors to continue finding problems rather than stopping at the first mistake. For modern tooling, you might hand-craft a recursive descent parser for full control, or use a parser generator like ANTLR. Increasingly, tools like tree-sitter are used for incremental parsing, which is perfect for IDEs and editors that need to re-parse on every keystroke. So to recap, the parser turns a token stream into a structured AST, resolves ambiguity through grammar rules, and recovers from errors gracefully. Now that we have a valid syntax tree, the next step is to check whether it actually makes sense. Let's move on to semantic analysis, where we add meaning to trees.
 tree-sitter-tree-sitter.mintlify.apptree-sitter.github.iotree-sitter.github.io+22 min
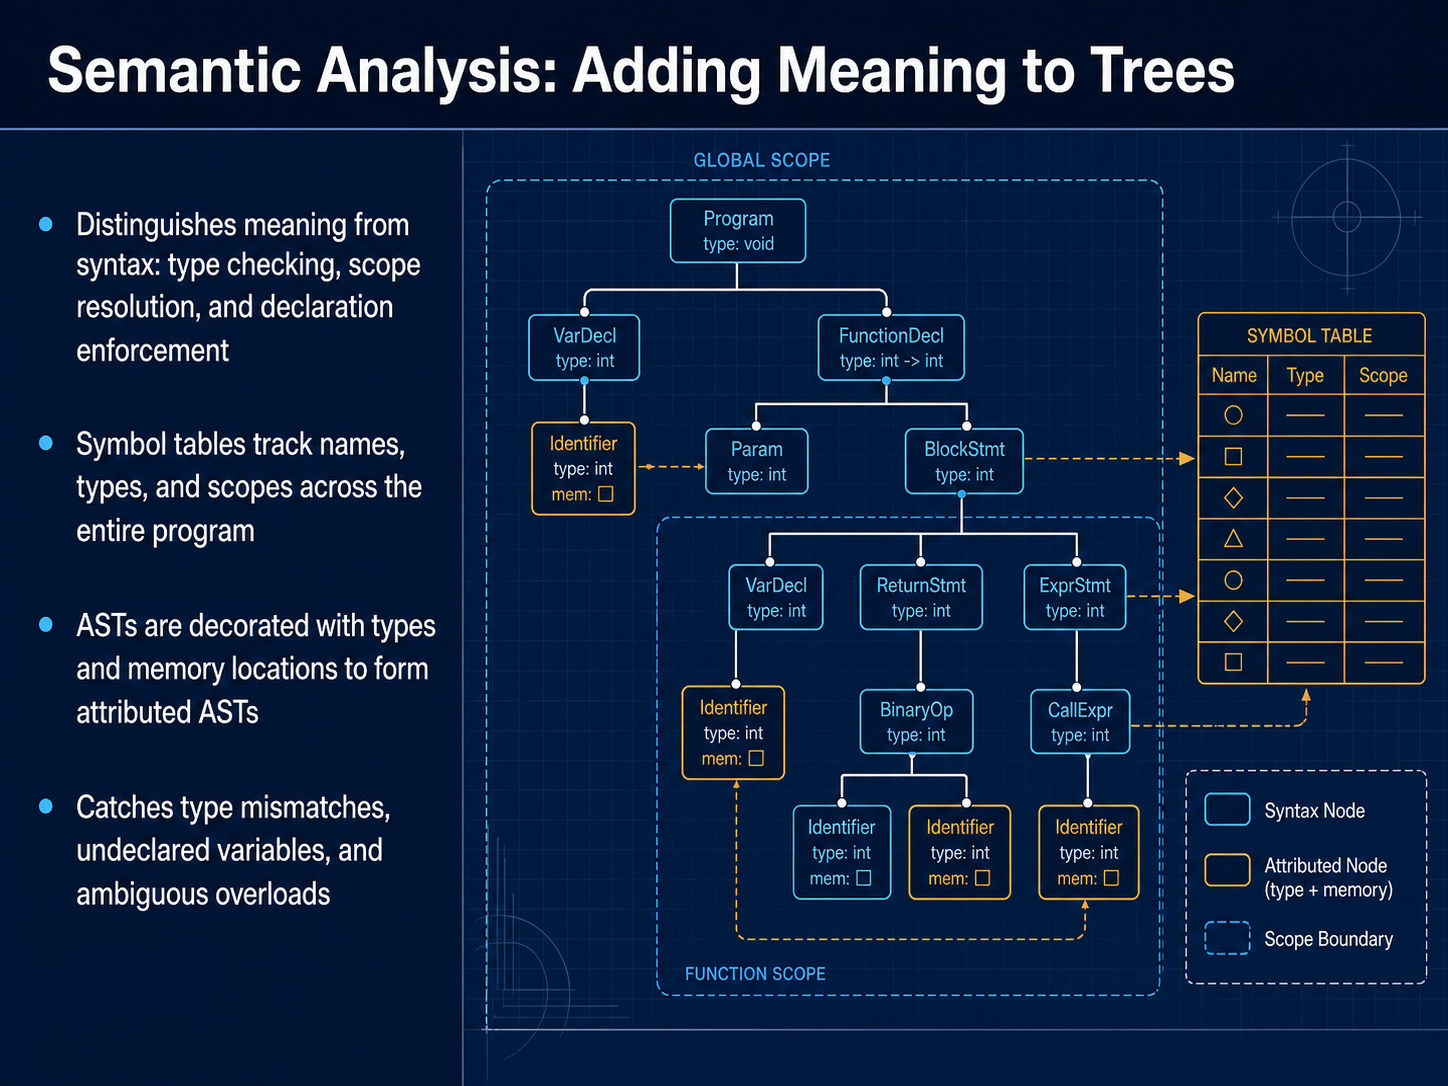
 - 05Semantic Analysis: Adding Meaning to TreesNow that we have a parse tree, we need to give it meaning. That is the job of semantic analysis. While syntax checks the structure of your code, semantic analysis checks its logic. It performs type checking, scope resolution, and declaration enforcement. Think of it as the compiler asking, "Does this code actually make sense?" A central tool here is the symbol table. This table tracks every identifier you create—things like variable names and function names—along with their types and the scope where they are valid. It is how the compiler knows that an integer variable used as a string is an error. As the analyzer traverses the AST, it decorates the nodes with this information, attaching types and memory locations. This transforms our raw Abstract Syntax Tree into an attributed AST. This decorated tree now holds the semantic blueprint of the program and allows the compiler to catch significant bugs early, like type mismatches, undeclared variables, or ambiguous function overloads, long before the code ever runs. Next, let's look at how we translate this decorated tree into a format the compiler can optimize: the intermediate representation.
 ucsd-cse231.github.iocontinuation.passing.stylestudiegids.universiteitleiden.nl+22 min
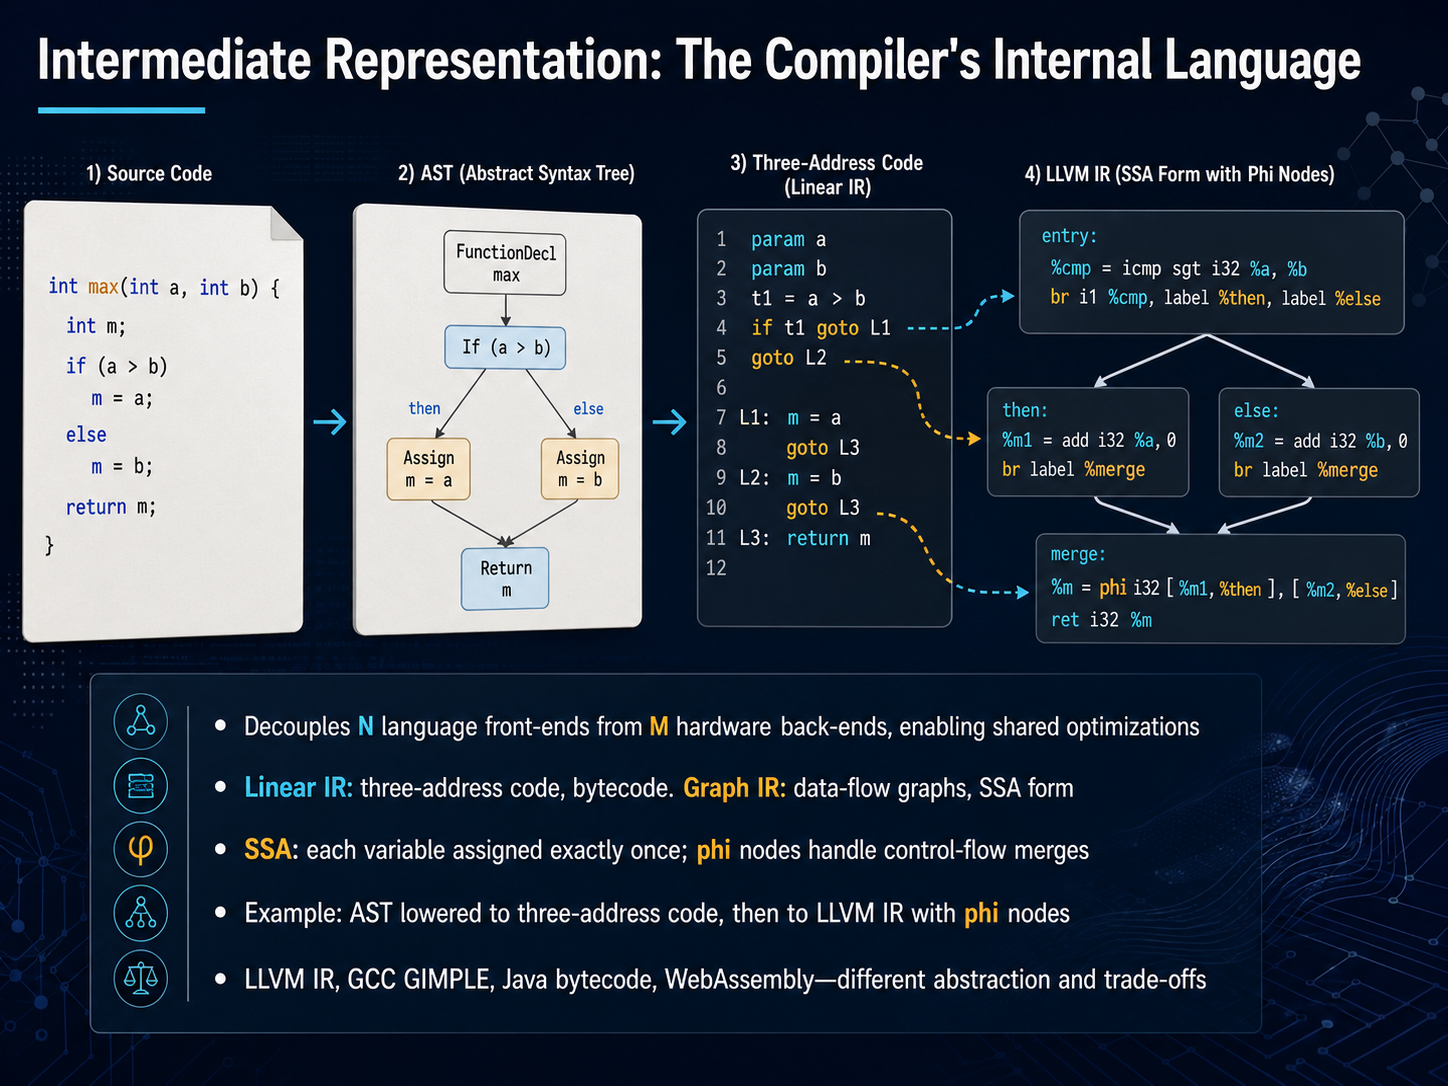
 - 06Intermediate Representation: The Compiler's Internal LanguageNow that the frontend has built a syntax tree, the compiler needs a shared language where the real heavy lifting happens. That's the intermediate representation, or IR. Think of it as solving the N times M problem. Instead of writing a translator from every language to every chip, you write one frontend that targets the IR, and one backend that goes from the IR to a specific machine. Add a new language or a new processor, and the work stays linear. IRs come in two main shapes. Linear IRs, like three-address code, read like simple assembly. Graph IRs represent data flow directly, and the most important form here is Static Single Assignment, or SSA. In SSA, every variable is assigned exactly once. To handle branches and loops, we insert special phi nodes that merge values from different control flow paths. A practical example is LLVM IR. An abstract syntax tree is first lowered to three-address code, then converted into LLVM IR with phi nodes. Different compilers pick different abstractions. GIMPLE is GCC's high-level IR, while Java bytecode and WebAssembly are designed for portability. LLVM IR sits in the middle, low-level and typed, making it a powerful target for both optimization and code generation. This shared IR is what makes a single optimization pass benefit every supported language and target at once.
 llvm.orgllvm.orgdeepwiki.com+22 min
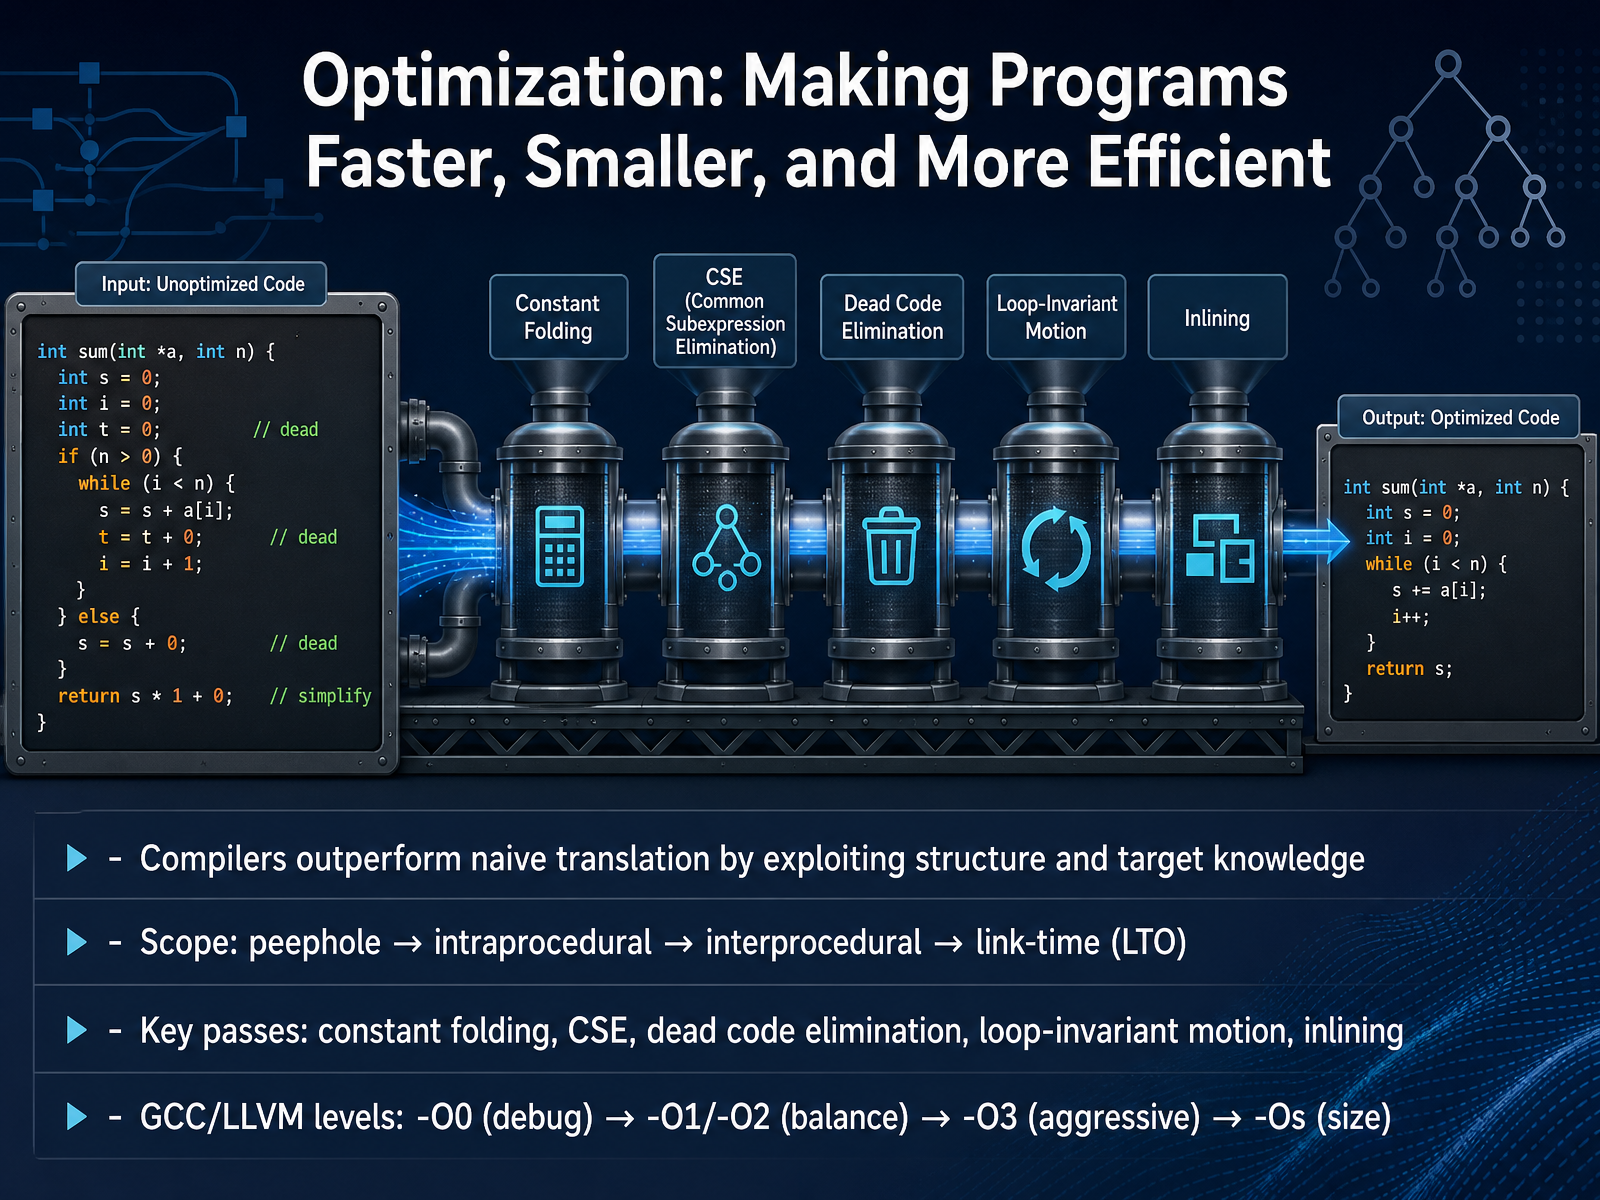
 - 07Optimization: Making Programs Faster, Smaller, and More EfficientNow that the compiler understands your program's structure, it can work to make it better. Optimization is where the compiler earns its reputation, transforming a straightforward translation into faster, smaller, and more efficient code. It does this by exploiting knowledge of the target machine and the program's entire structure. The scope of these optimizations ranges from peephole patterns, which replace a handful of instructions, all the way up to link-time, or LTO, optimizations that can see across the entire program. Some key passes you will see include constant folding, which pre-computes expressions like five times ten, and dead code elimination, which removes instructions whose results are never used. Inlining replaces a function call with the body of the function itself, while loop-invariant motion hoists calculations out of a loop so they are only done once. To control all this, compilers like GCC and LLVM offer optimization levels. Dash O zero performs no optimization for fast debug builds. The recommended balance is typically Dash O two, which enables most optimizations that do not trade off speed against space. Dash O three is aggressive for speed, and Dash O s tunes for a smaller binary size. Next, we will walk through how this optimized representation is then lowered to real machine instructions in a slide called Code Generation: From IR to Machine Instructions.
 snapshots.sourceware.orgwiki.gentoo.orgsnapshots.sourceware.org+22 min
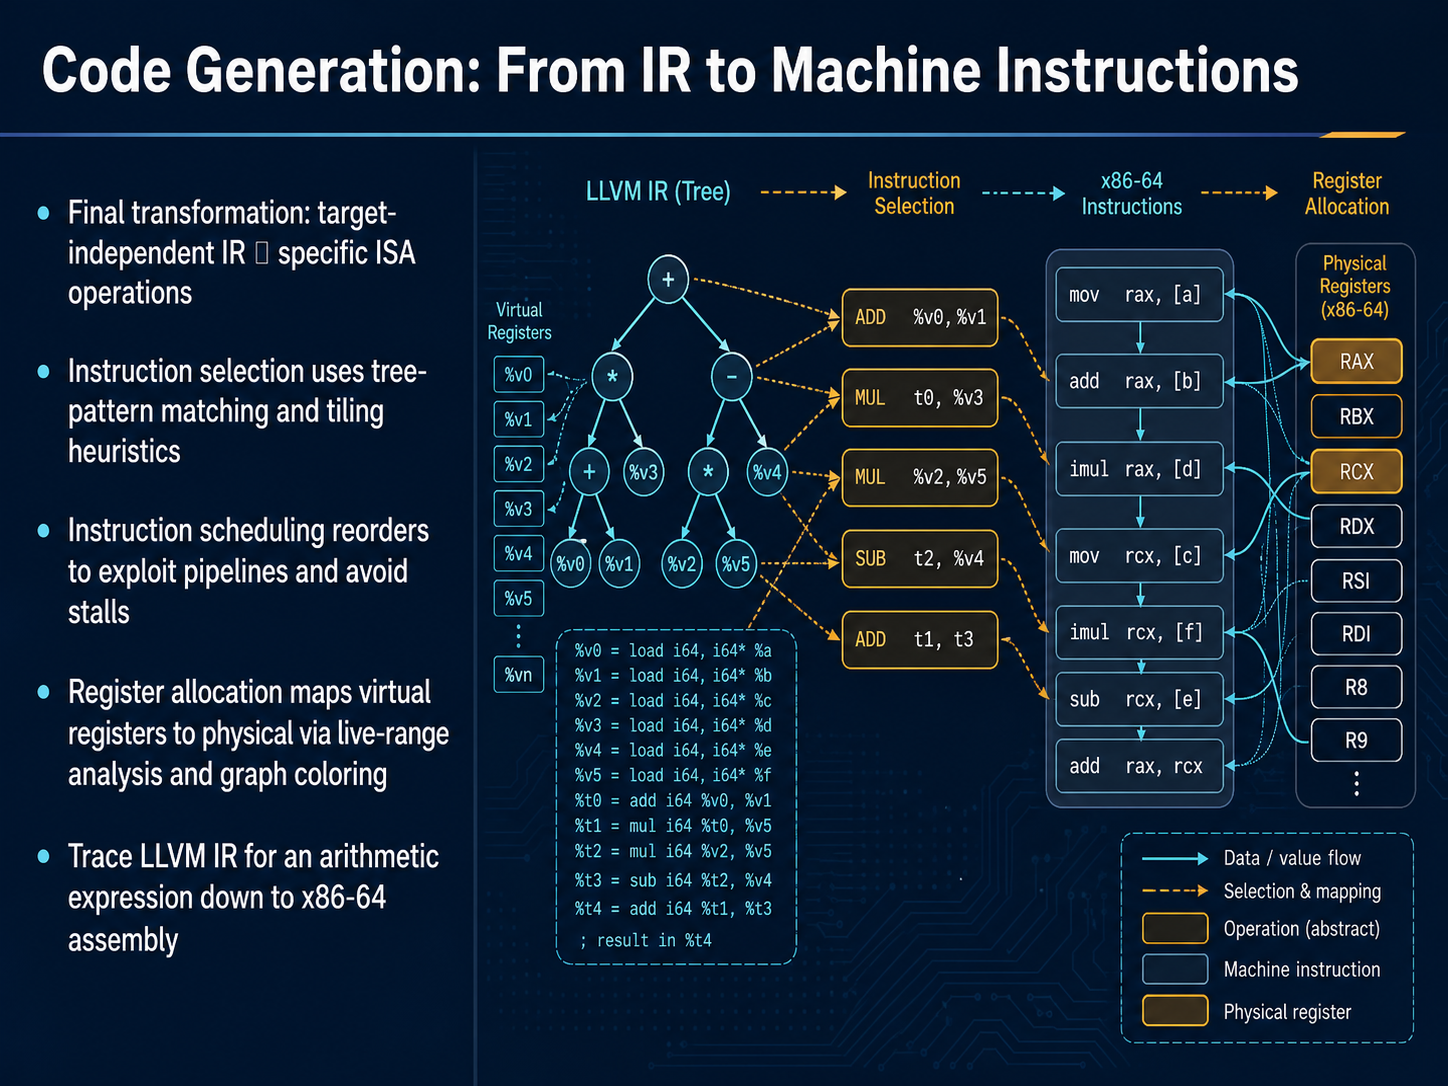
 - 08Code Generation: From IR to Machine InstructionsNow we reach code generation, the final transformation from our target-independent IR into real machine instructions for a specific ISA. Instruction selection takes the IR operations and matches them against predefined patterns, often using tree-pattern matching and tiling heuristics to cover the IR efficiently with native instructions. Once we have a sequence of instructions, scheduling reorders them to keep the processor pipelines full and avoid costly stalls. Next comes register allocation, which maps our virtual registers onto the physical registers of the target. It does this by analyzing live ranges and building an interference graph. The classic approach uses graph coloring, but modern compilers also apply techniques like linear scan or even learning-based methods to handle the complexity. In LLVM, you can trace an arithmetic expression from the IR form all the way down to x86-64 assembly and see each step of pattern matching, scheduling, and register assignment. Understanding this pipeline gives you a mental model for how high-level code becomes efficient machine-level execution. Up next, we'll take a deeper look at register allocation itself, focusing on graph coloring and live ranges.
 ucsd-cse231.github.iocontinuation.passing.stylestudiegids.universiteitleiden.nl+22 min
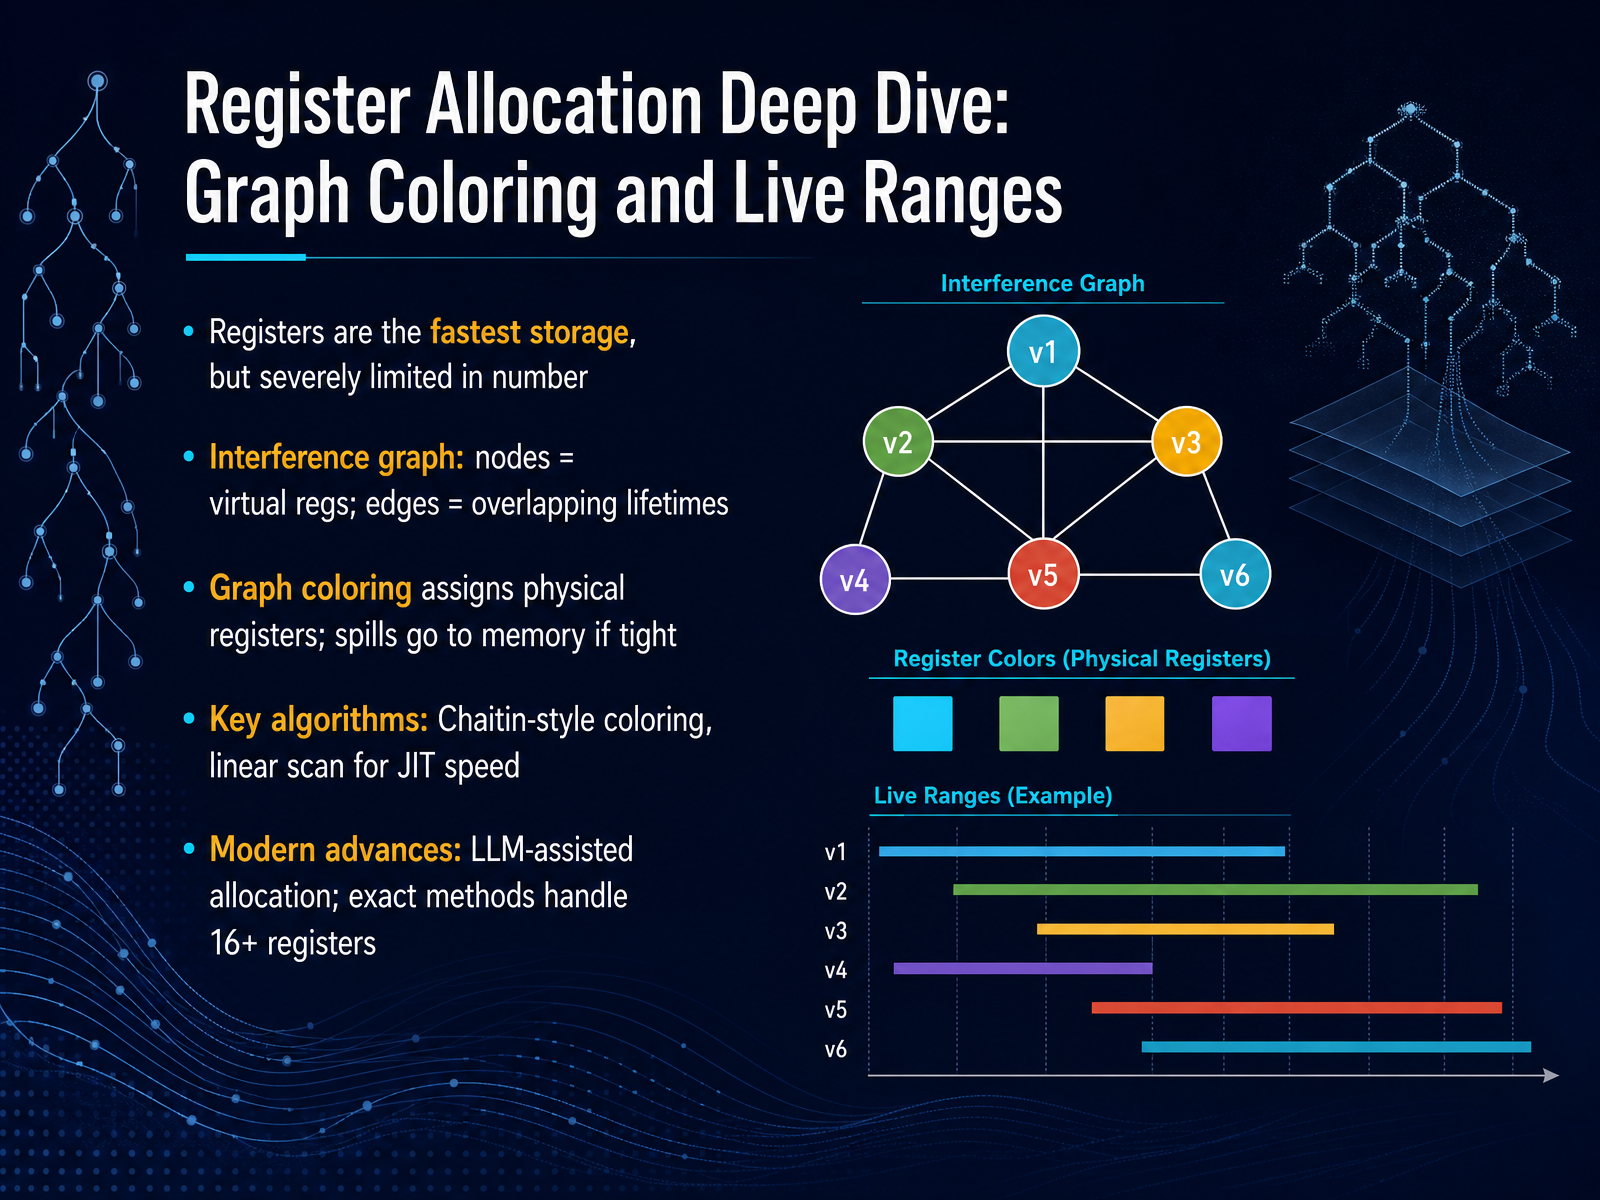
 - 09Register Allocation Deep Dive: Graph Coloring and Live RangesNow let's dive deeper into the mechanics of register allocation. Registers are the absolute fastest storage in a computer, but they are severely limited. The compiler has to map a large set of virtual registers onto a small set of physical ones. To decide which virtual registers can share a physical register, we build what's called an interference graph. Each node represents a virtual register, and we draw an edge between two nodes if their lifetimes overlap. After that, we use graph coloring to assign physical registers, where each color represents a physical register. If two nodes share an edge, they cannot receive the same color. When there aren't enough registers, some values must be spilled to slower memory. Classic approaches include Chaitin-style coloring algorithms and linear scan, which is still popular in J I T compilers because it's extremely fast. But modern advances are pushing further. Recent work has achieved exact allocation for architectures with sixteen or more registers, and researchers are now using large language models to generate high-performance register assignments that can even beat expert-tuned libraries. Up next we'll move beyond static compilation and see how J I T, P G O, and emerging targets add new dimensions to the problem.
 2 min
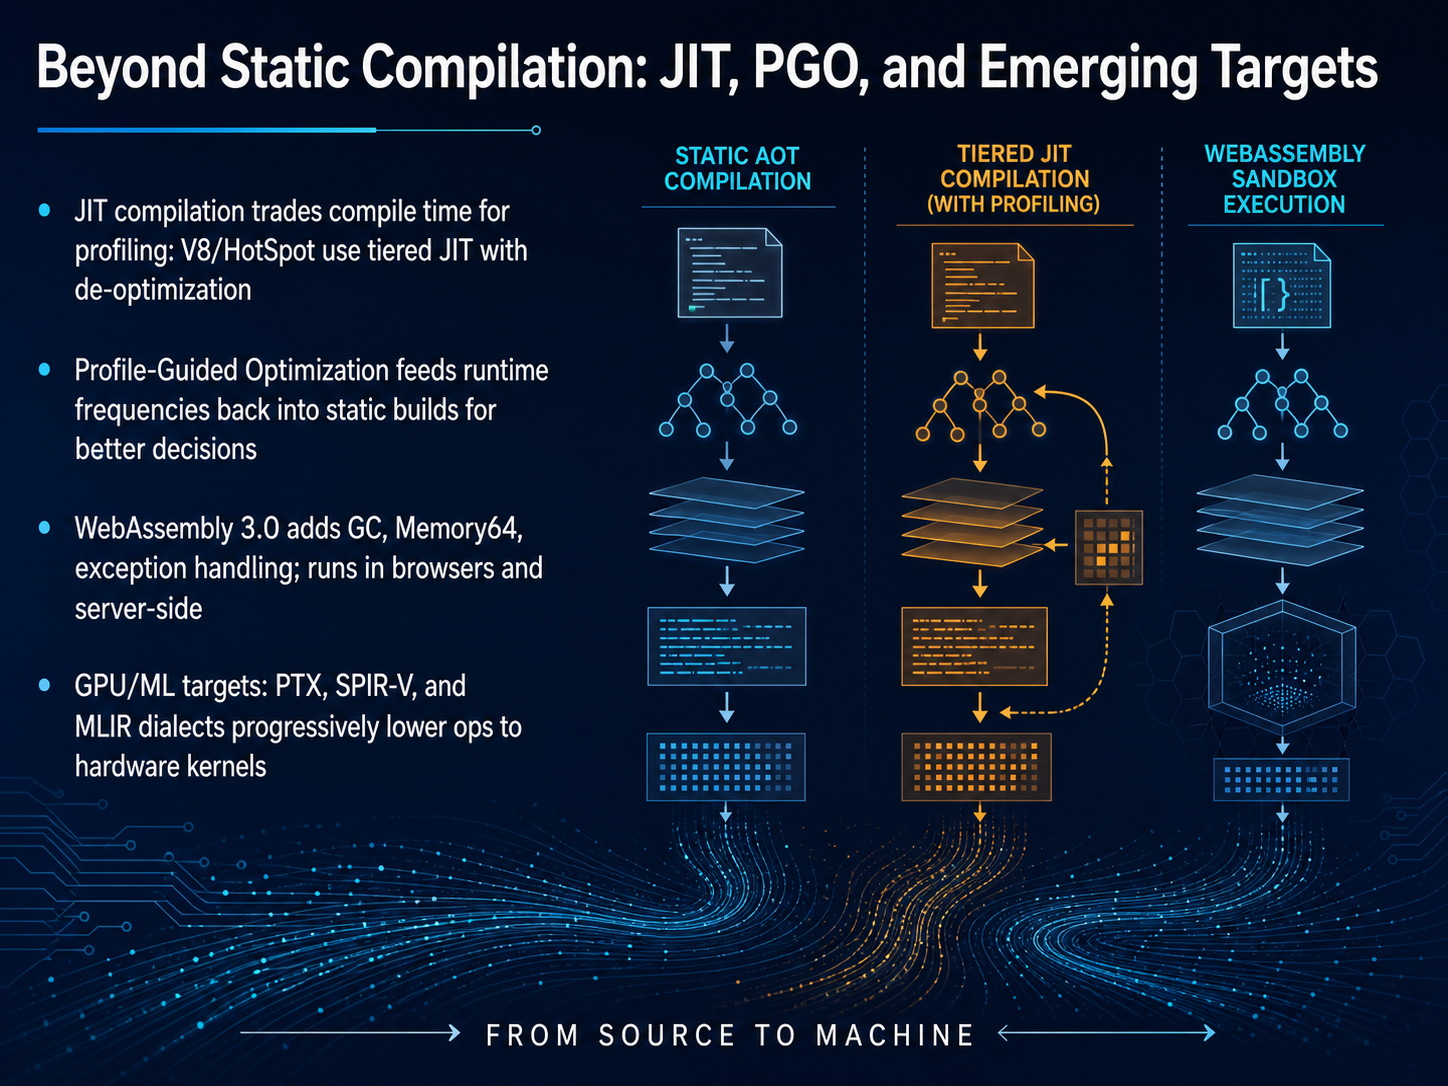
2 min - 10Beyond Static Compilation: JIT, PGO, and Emerging TargetsStatic compilation gives us a finished product before the program ever runs. But modern compilers don't always stop there. Let's look at techniques that push beyond traditional ahead-of-time builds. Just-in-time compilation flips the script. Engines like V8 and HotSpot start executing quickly, then profile the running code to identify hot paths. They recompile those hot functions with aggressive optimizations, and crucially, they can de-optimize back to a simpler form if runtime assumptions turn out to be wrong. Profile-guided optimization takes a different approach. You compile a special instrumented build, run it on real-world workloads to collect execution frequencies, and then feed that profile back into a full static rebuild. The compiler now makes smarter inlining and layout decisions because it knows which branches are truly hot. The targets themselves are evolving too. WebAssembly 3.0 has standardized garbage collection, 64-bit memory addressing with Memory64, and native exception handling, making it a serious compile target for both browsers and server-side runtimes. We're also seeing compilation flow into GPUs and machine learning accelerators, with intermediate representations like PTX, SPIR-V, and MLIR dialects progressively lowering operations to hardware kernels. So the boundary between compile time and run time keeps getting thinner, and the target list keeps growing. Up next, let's make this concrete by looking at the tools and artifacts you'll use every day in 'Seeing the Compiler in Practice: Tools, Artifacts, and Exploration.'
 llvm.orgllvm.orgdeepwiki.com+22 min
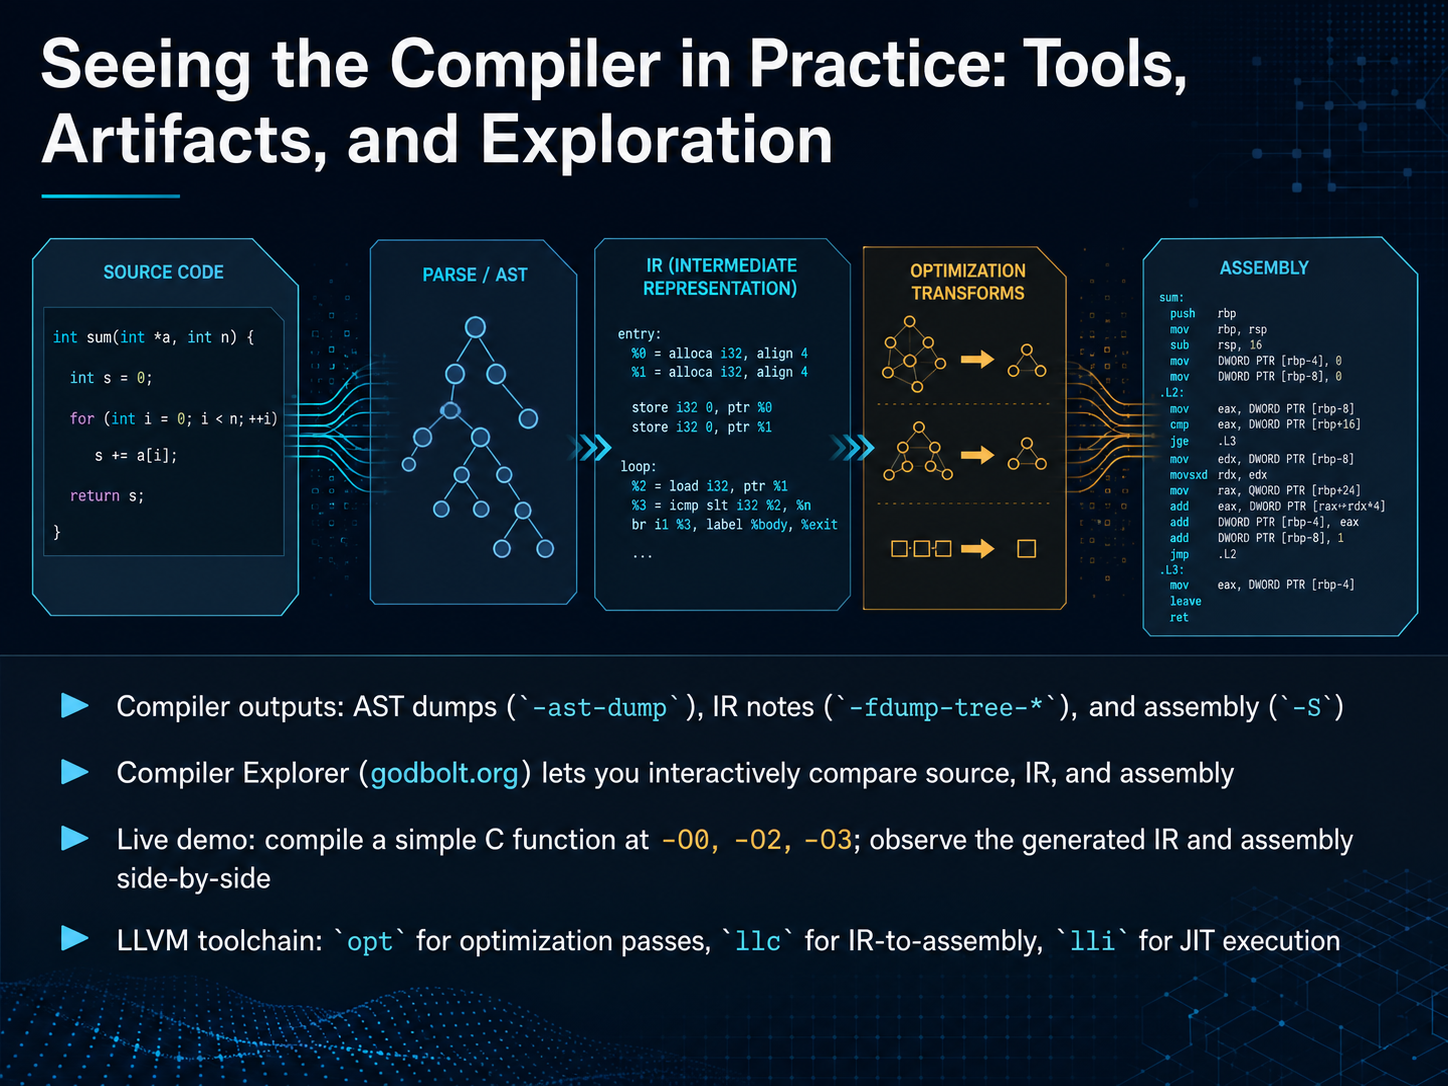
 - 11Seeing the Compiler in Practice: Tools, Artifacts, and ExplorationNow we get to the most satisfying part: actually looking inside the box. The compiler can show you exactly what it's doing. With Clang, you can dump the abstract syntax tree to see how your code was parsed. You can print the LLVM IR at any stage with flags like dash fdump-tree. And when you pass the capital S flag, the compiler stops right after generating assembly, so you can read the final machine instructions. One tool that makes this effortless is Compiler Explorer at godbolt dot org. You type a simple C function on the left, choose a compiler and optimization level, and instantly see the IR and generated assembly side-by-side. Try this yourself: compile a function at capital O zero, capital O two, and capital O three. Watch how the instructions shrink, eliminate dead code, and sometimes even compute the result at compile time. Under the hood, the LLVM toolchain lets you control each step separately. You can run the optimizer with the opt tool to apply specific passes, use llc to translate IR directly to assembly, or even execute IR in a just-in-time environment with lli. This visibility is your most powerful debugging tool.
 llvm.orgllvm.orgdeepwiki.com+22 min
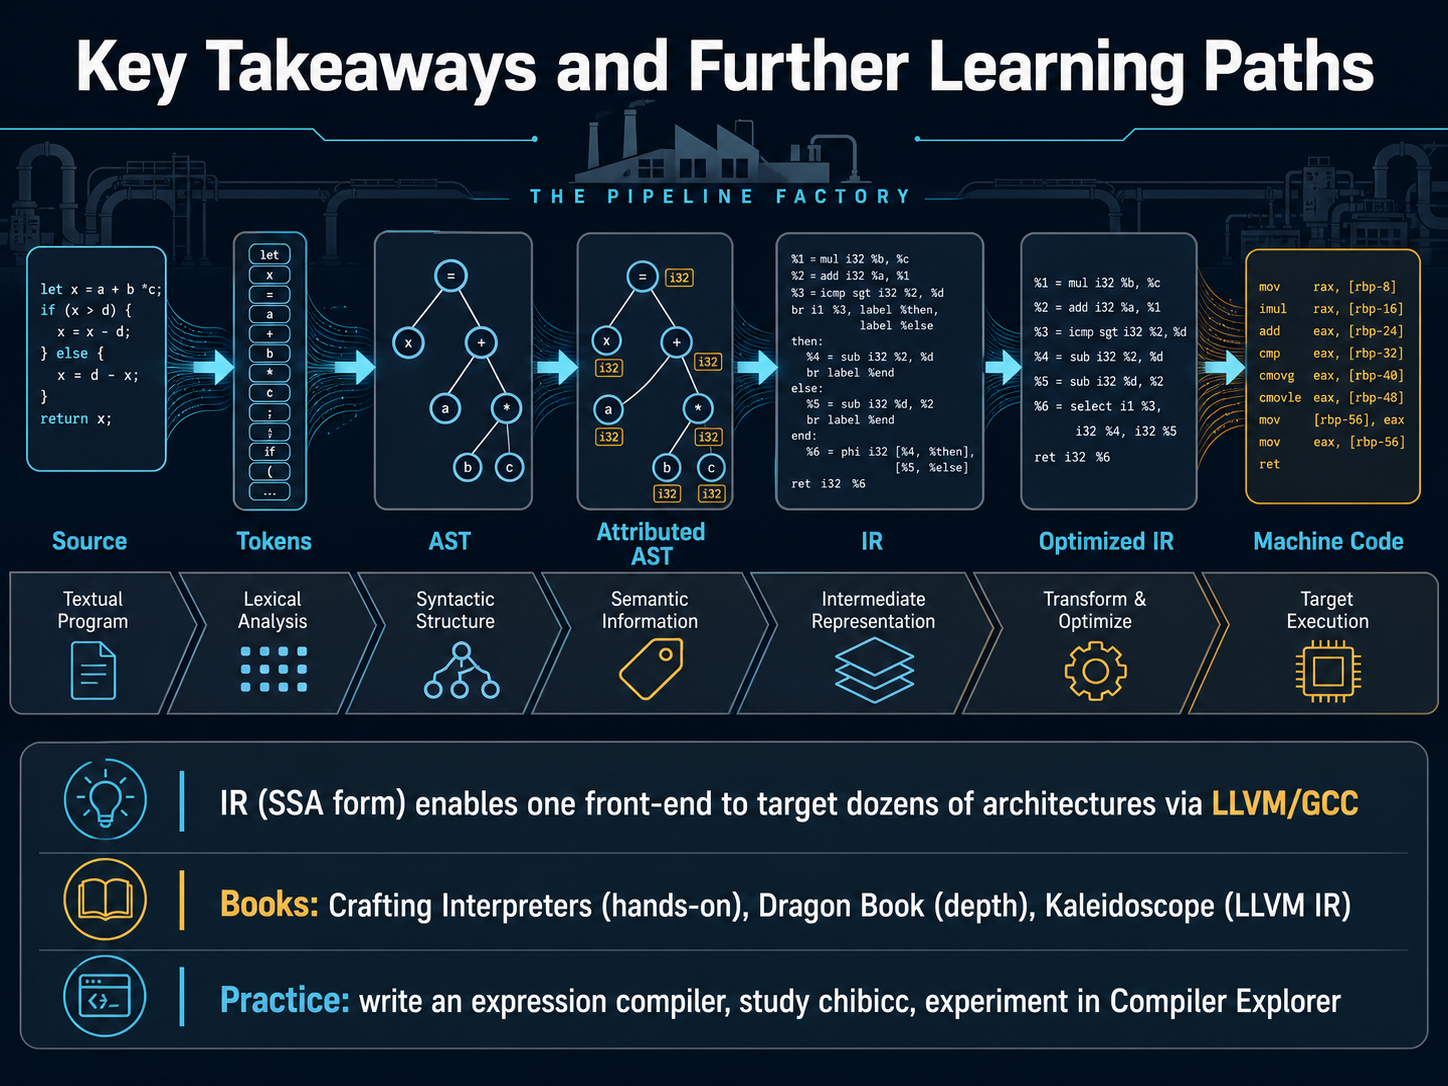
 - 12Key Takeaways and Further Learning PathsLet’s take a step back and follow the entire journey our code has just completed. We started with plain source text, moved through tokens and the abstract syntax tree, then into the decorated AST and intermediate representation. From there, optimization passes cleaned things up, and the back end produced real machine code. That pipeline—source to tokens, to AST, to attributed AST, to IR, to optimized IR, and finally to machine code—is the heartbeat of every modern compiler. The real power move is adopting an intermediate representation, especially in SSA form. It’s the reason one front end can target dozens of architectures through frameworks like LLVM and GCC. If you want to go deeper, start with Crafting Interpreters for a hands-on feel, or the Dragon Book for rigorous theory. The Kaleidoscope tutorial is the fastest way to generate real LLVM IR. For practice, write a tiny expression compiler, study the chibicc source code, and spend time inside Compiler Explorer. That practical loop—build, test, and inspect—is where the real learning happens. Thanks for sticking with me through this process. Take these ideas and write some compilers of your own.
 ucsd-cse231.github.iocontinuation.passing.stylestudiegids.universiteitleiden.nl+22 min
Take the deck with you
Download this course as a file — free, no sign-up needed.
- PDF handoutEvery slide page, ready to print or share.13 pages · 3.5 MBDownload
- Narrated PowerPointThe deck that presents itself — every slide carries the digital human's narration video.13 pages · 14.6 MBDownload
- PowerPoint slidesThe full deck as a .pptx — open it in PowerPoint, Keynote, or Google Slides.13 pages · 3.5 MBDownload
Free to use in your own training — please keep the PersonWise credit page at the end.
Have your own deck? Turn it into a course
Sources consulted
Web sources consulted while building this course.
- Optimize Options (Using the GNU Compiler Collection (GCC)) — snapshots.sourceware.org
- GCC optimization - Gentoo Wiki — wiki.gentoo.org
- Optimize Options (Using the GNU Compiler Collection (GCC)) — snapshots.sourceware.org
- GCC optimization options — developer.arm.com
- How many GCC optimization levels are there? — stackoverflow.com
- LLVM Language Reference Manual — LLVM 23.0.0git documentation — llvm.org
- LLVM IR: Past, Present and Future — llvm.org
- LLVM IR Reference and Core IR Infrastructure | llvm/llvm-project | DeepWiki — deepwiki.com
- kindatechnical() - LLVM IR: The Industry Standard — kindatechnical.com
- How LLVM Works: The IR That Took Over Modern Computing — thesoftwarefrontier.com
- https://tree-sitter-tree-sitter.mintlify.app/using-parsers/overview — tree-sitter-tree-sitter.mintlify.app
- Getting Started - Tree-sitter — tree-sitter.github.io
- Basic Parsing - Tree-sitter — tree-sitter.github.io
- Tree-sitter: Introduction — tree-sitter.github.io
- https://tree-sitter-tree-sitter.mintlify.app/quickstart — tree-sitter-tree-sitter.mintlify.app
- Compiler Construction - UCSD CSE 231: Compiler Construction Spring 26 — ucsd-cse231.github.io
- CS 107 Compilers (Spring 2026) — continuation.passing.style
- Compiler Construction, 2025-2026 - Prospectus - Universiteit Leiden — studiegids.universiteitleiden.nl
- Learn Compilers in a Single Post: A Complete Tutorial From Lexing and Parsing to IR Optimization and Code Generation | PyShine — pyshine.com
- Course info – Compilers — hy-compilers.github.io