Begin
14 pages · ~28 min
Designing a Fair Test: Variables and Controls
This training teaches learners to design fair tests by identifying variables and applying controls, building essential skills for conducting reliable experiments.
A digital instructor presents all 14 pages. Hold “Ask” at any point and ask out loud — the answer comes from this course. No sign-up needed.
What you’ll learn
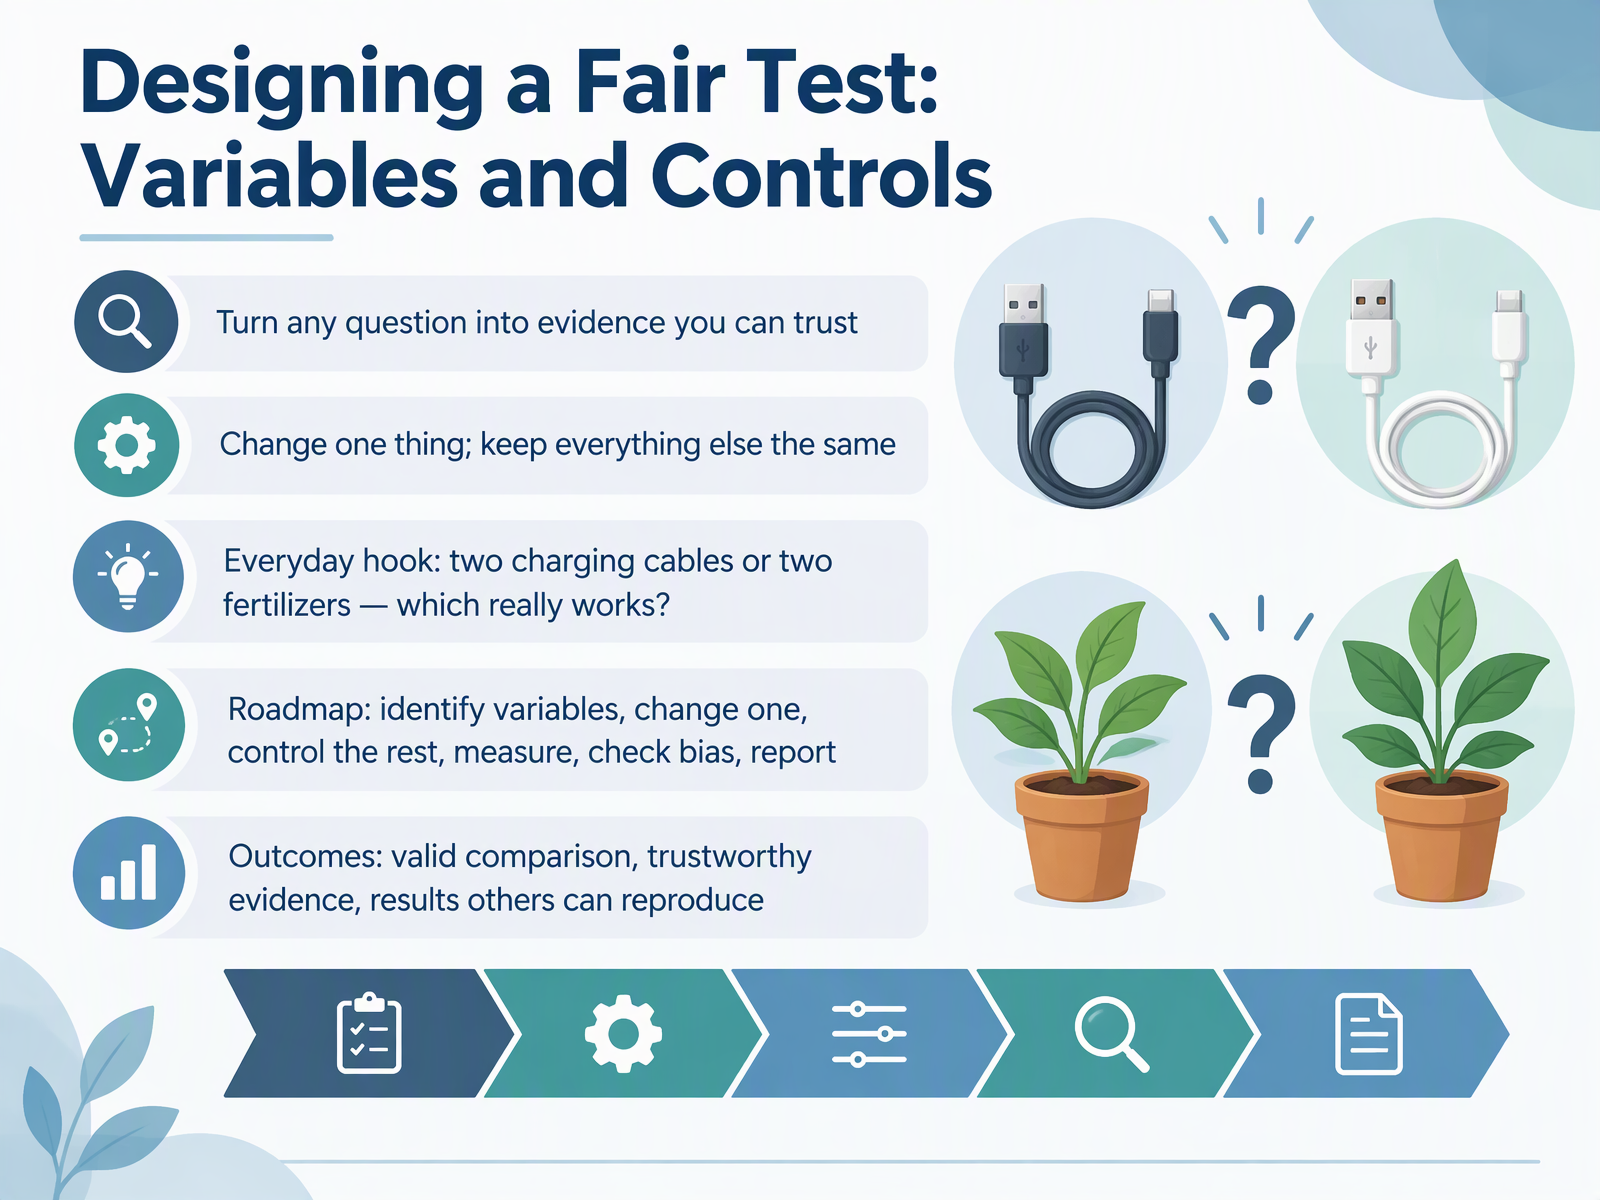
- 01Designing a Fair Test: Variables and ControlsWelcome. I am glad you are here. This course is about designing a fair test. In plain terms, that means turning a question into evidence you can trust. The core idea is simple. Change one thing, and keep everything else the same. Here is a question you may have faced. You have two charging cables, or two fertilizers. Which one really works? Without a fair test, you cannot tell. Over the next slides, we will follow a clear roadmap. Identify the variables, change one, control the rest, measure what happens, check for bias, and report your results. By the end, you will be able to make a valid comparison, gather trustworthy evidence, and get results others can reproduce. Let us begin with what a fair test really means.bbc.co.ukbbc.co.ukundsci.berkeley.edu+21 min
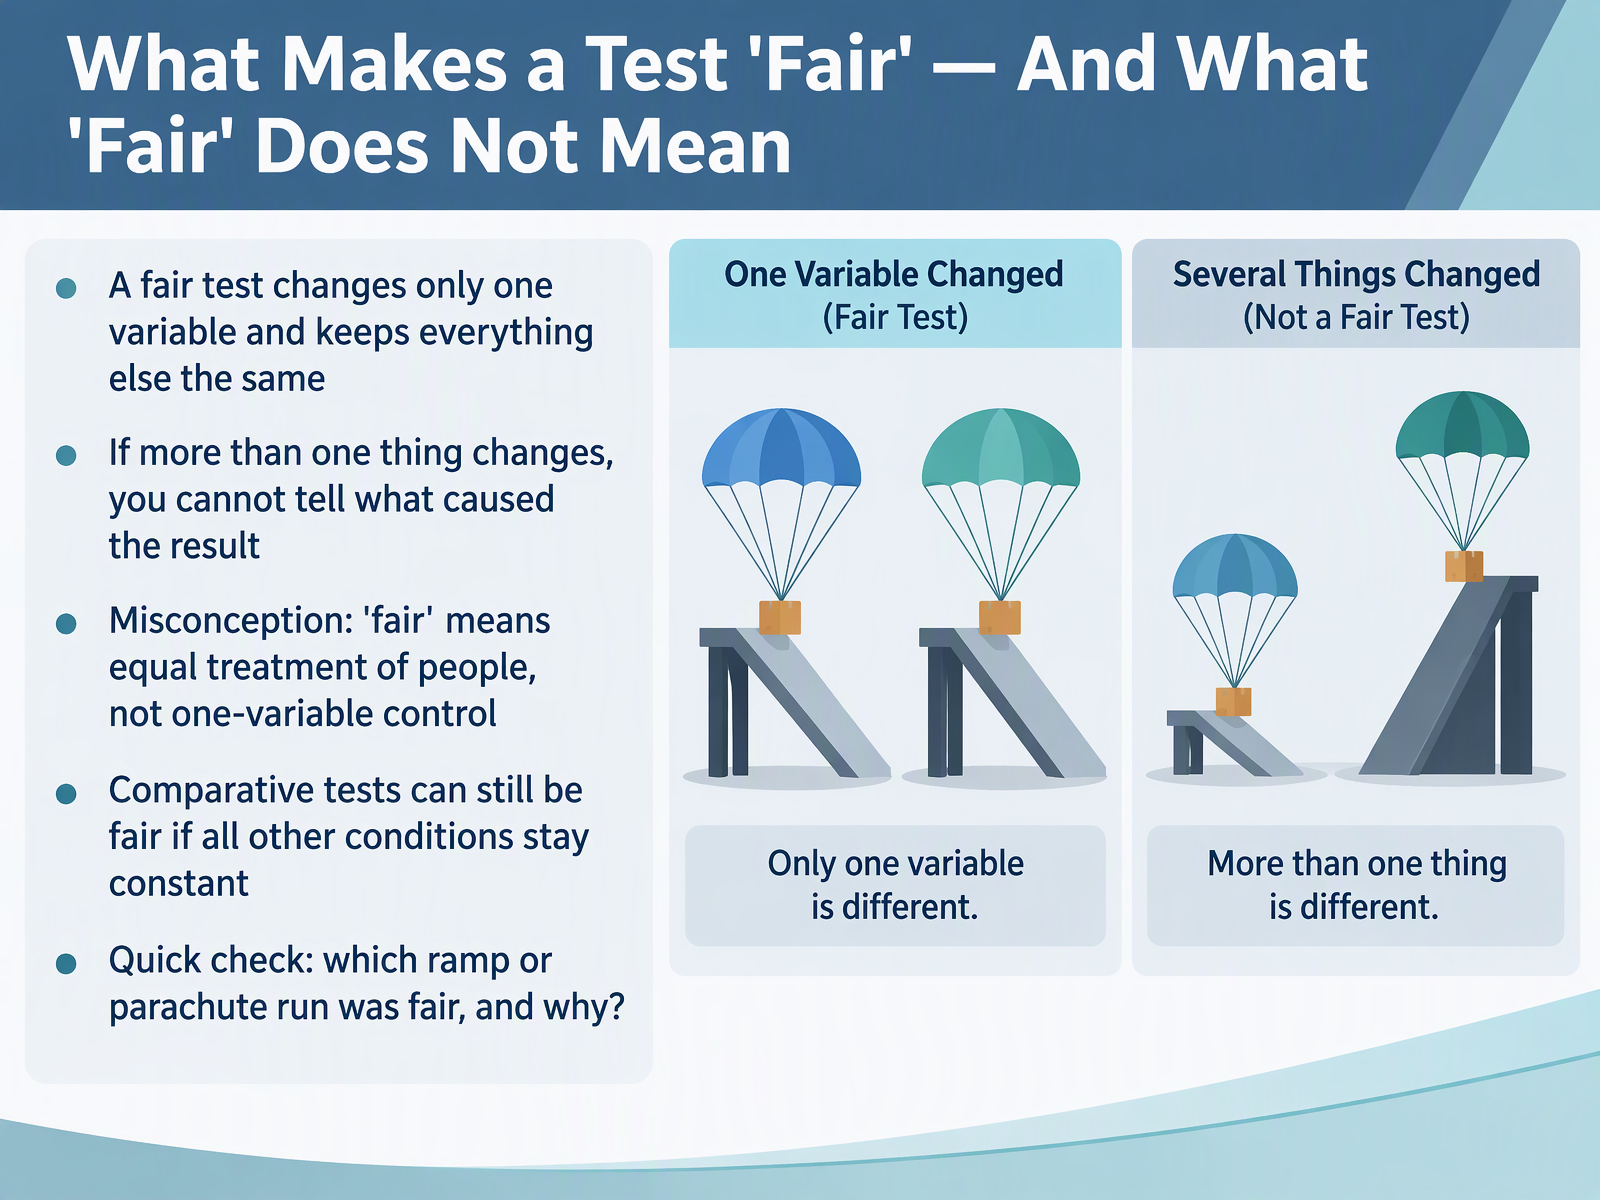
- 02What Makes a Test 'Fair' — And What 'Fair' Does Not MeanLet's talk about what makes a test fair. In science, a fair test changes only one variable, and keeps everything else the same. A variable is simply something that can change in an experiment. If more than one thing changes, you cannot tell what caused the result. Here is a common confusion. The word fair can sound like equal treatment of people. In science, it does not mean that. It means one-variable control. Also, a comparative test can still be fair, as long as all other conditions stay constant. For example, compare two parachute runs, but change only the canopy size. Same drop height, same weight, same stopwatch. Ask yourself whether only one thing changed. Take a moment now. Which ramp or parachute run was fair, and why? Next, we will name the three variable roles: independent, dependent, and controlled.
 bbc.co.ukbbc.co.ukundsci.berkeley.edu+22 min
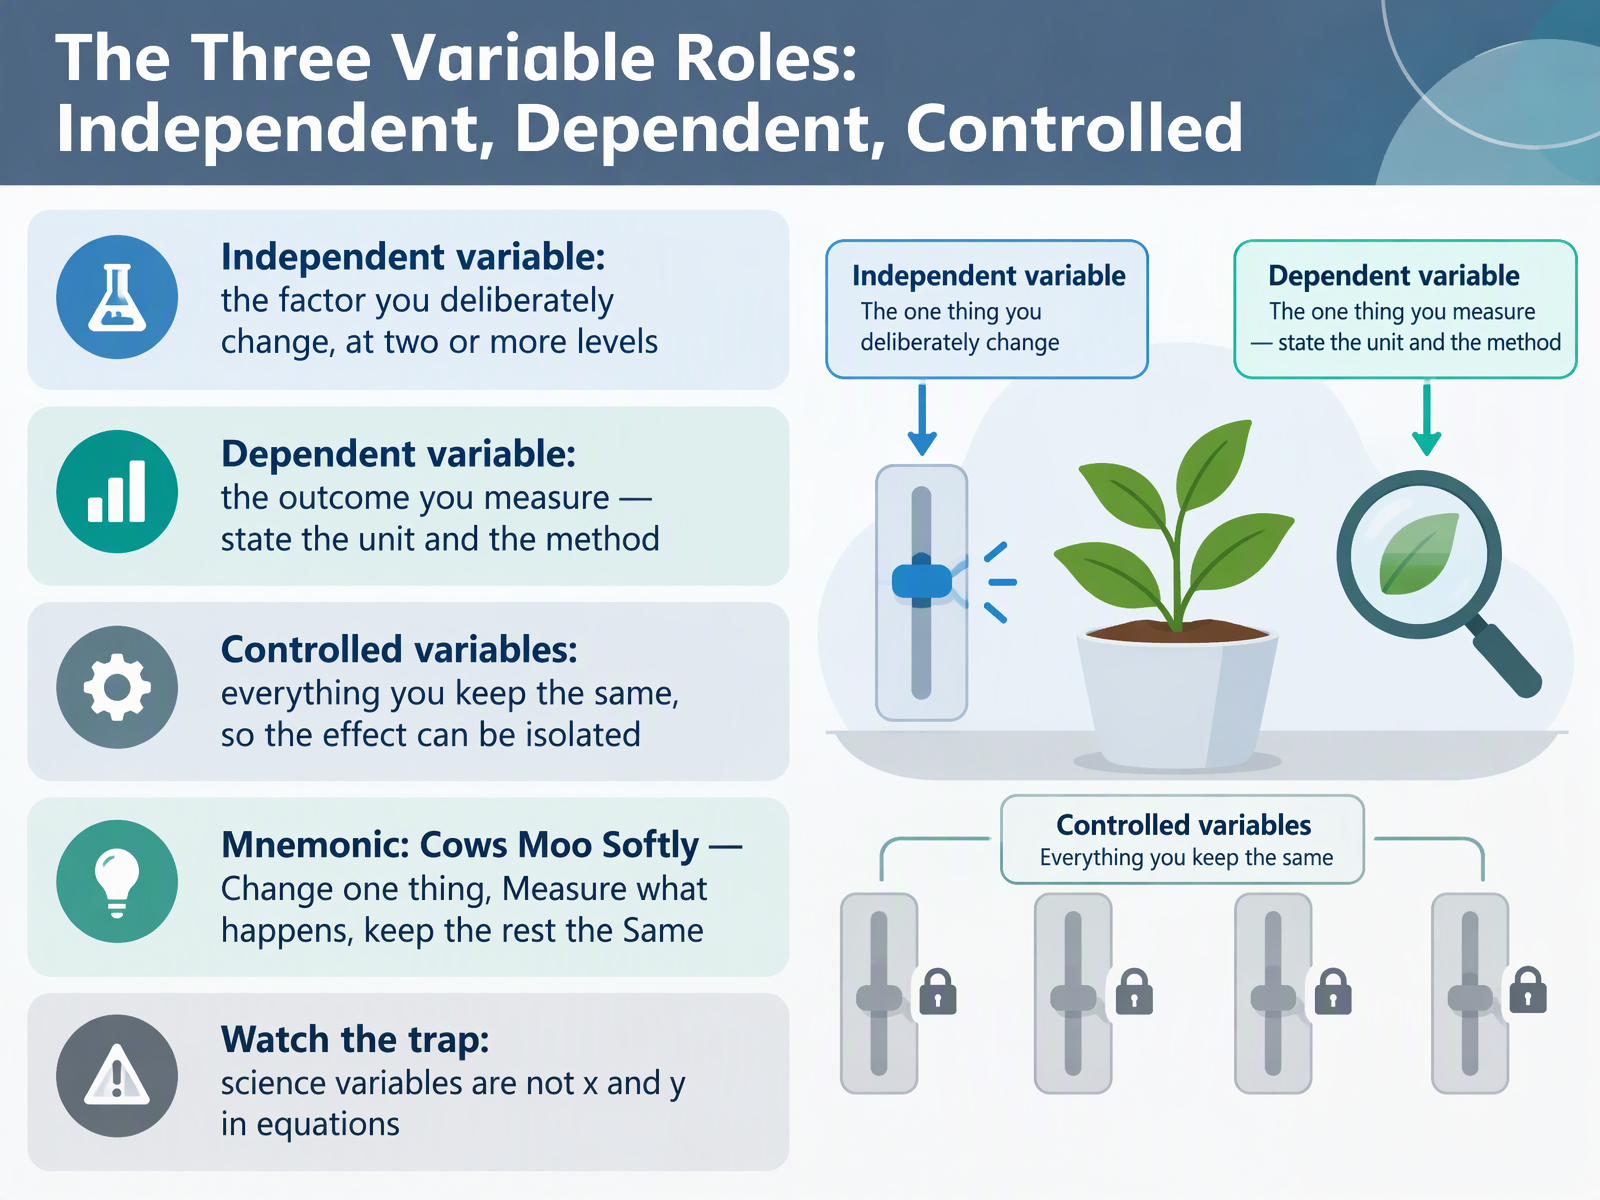
- 03The Three Variable Roles: Independent, Dependent, ControlledNow let's name the roles a variable can play. The independent variable is the factor you deliberately change, at two or more levels. For example, water temperature at cold, warm, and hot. The dependent variable is the outcome you measure. Always state the unit and the method. For instance, time for sugar to dissolve, in seconds, using a stopwatch. Controlled variables are everything you keep the same, so the effect can be isolated. Same amount of water. Same amount of sugar. Same stirring. Here's a mnemonic. Cows Moo Softly. Change one thing. Measure what happens. Keep the rest the same. One caution. Science variables are not x and y in equations. They are real things you change or measure. Ask yourself whether only one thing changed. Next, we look at hidden factors: confounding variables, controls, and control groups.
 soinc.orgbiolab.vic.edu.ausciencebuddies.org+21 min
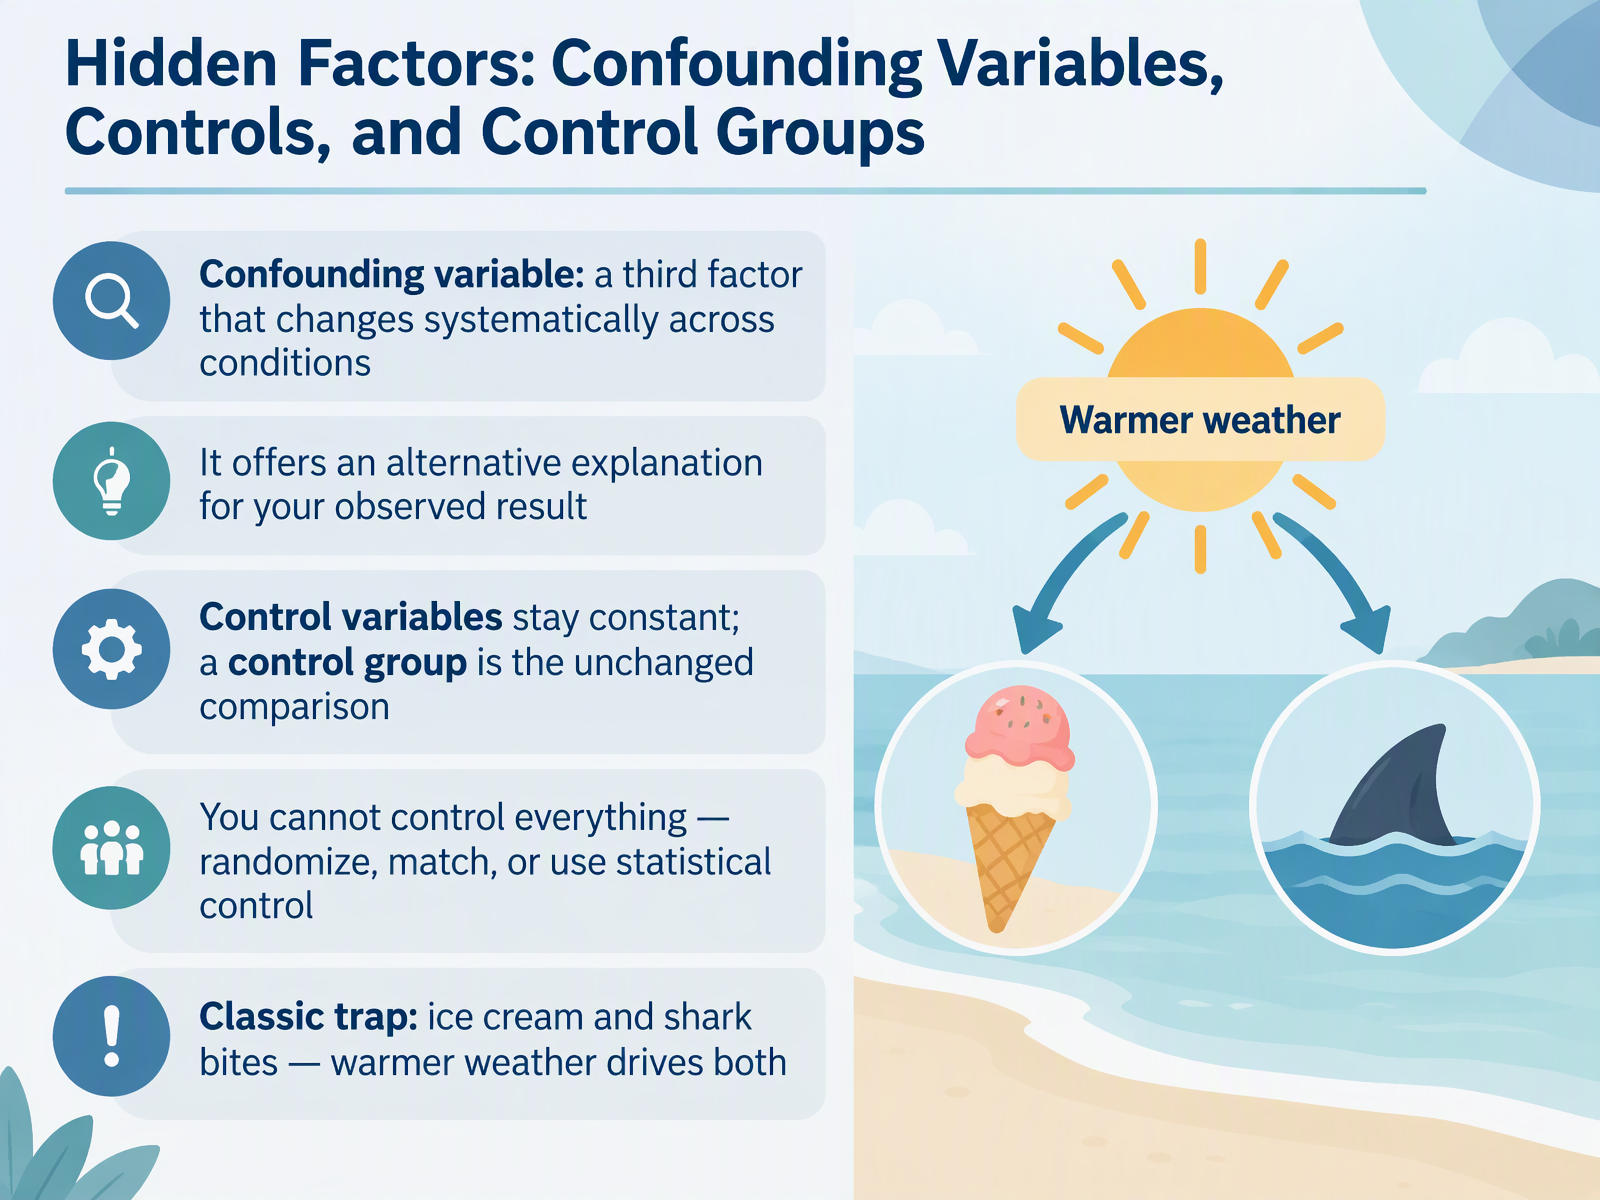
- 04Hidden Factors: Confounding Variables, Controls, and Control GroupsNow let's look at the factors that hide in the background. A confounding variable is a third factor that changes systematically across your conditions. It gives you an alternative explanation for your result, so you cannot be sure the change came from the thing you manipulated. Control variables are different. They are the factors you hold constant on purpose. And a control group is the unchanged comparison, the group that does not receive the treatment. Here is the honest part. You cannot control everything. So researchers randomize, match participants, or use statistical control. A classic trap is ice cream and shark bites. They rise together, but warmer weather drives both. So ask yourself whether only one thing changed, and what else could explain the result. Next, we look at why controls matter for validity and bias.
 cseweb.ucsd.eduopenstax.orglibguides.usc.edu+21 min
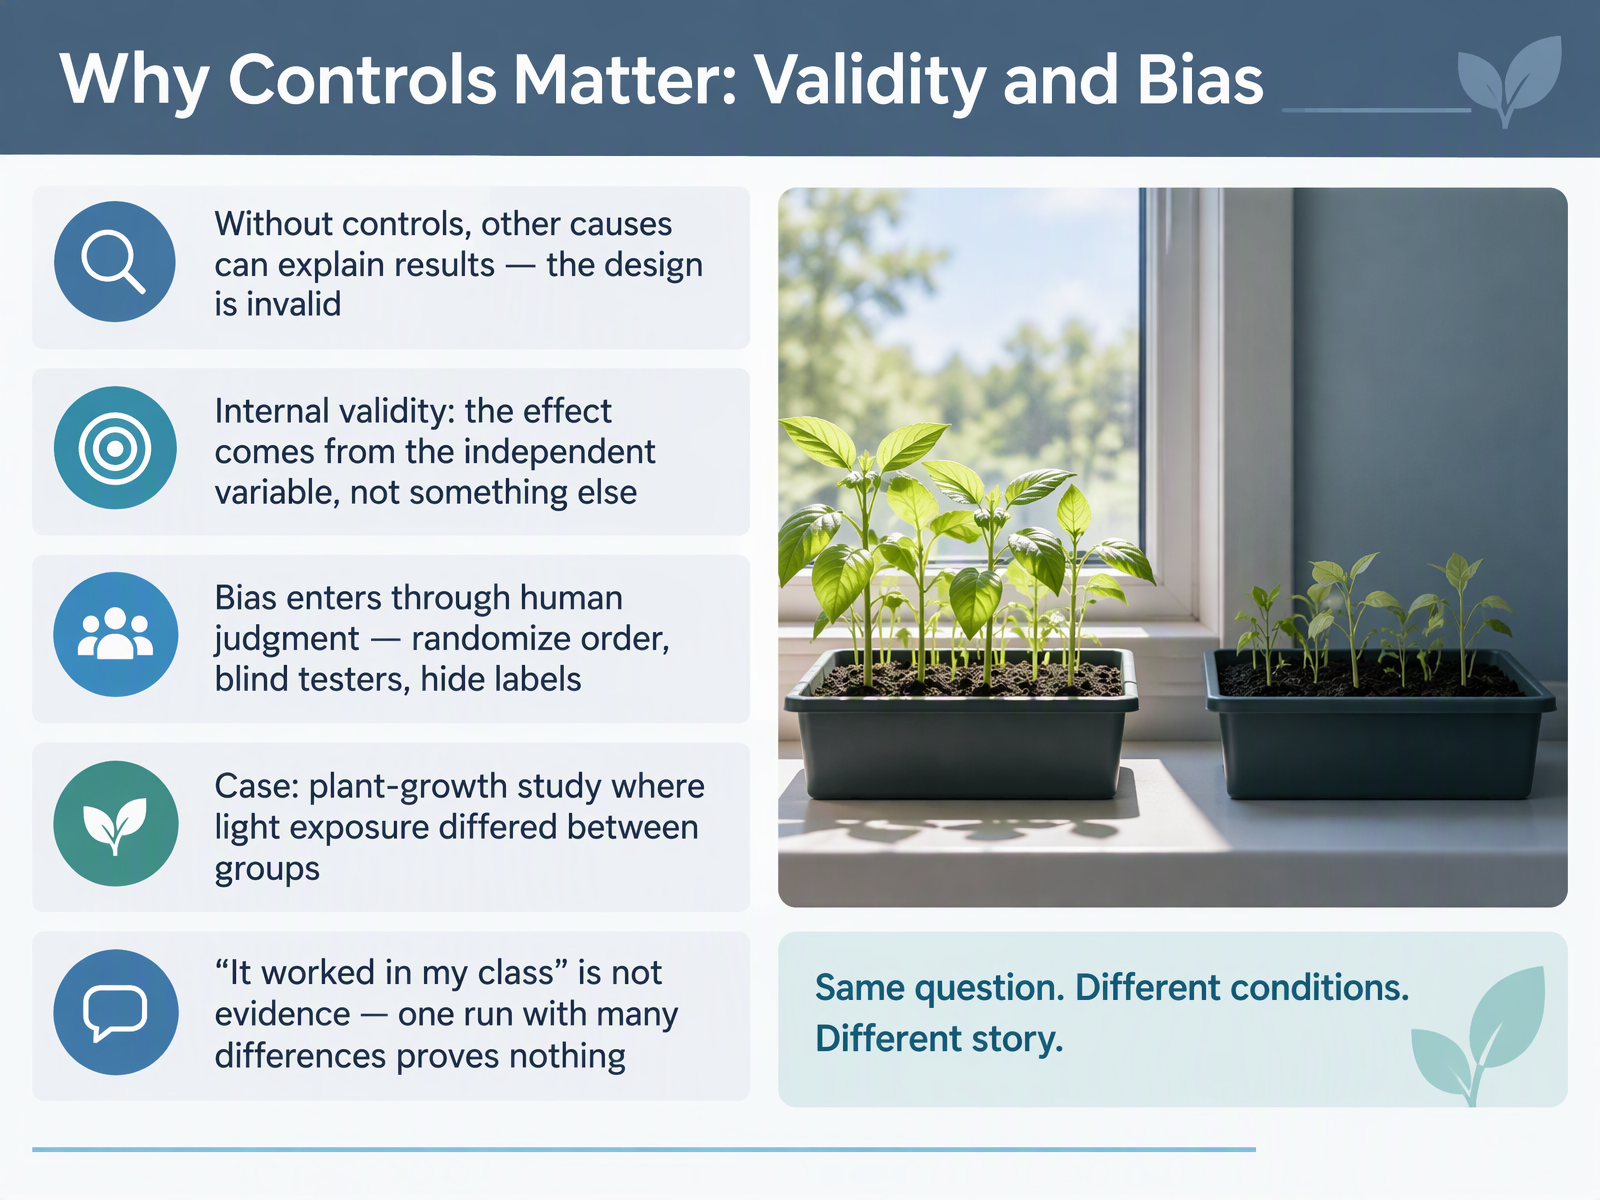
- 05Why Controls Matter: Validity and BiasLet's look at why controls matter, through validity and bias. Suppose two groups of bean plants grow at different rates. Without controls, other causes can explain the result, and the design is invalid. Internal validity means the effect comes from the independent variable, not something else. In a plant-growth study, one group got more light than the other. So the light difference, not your treatment, could explain the outcome. Human judgment can also introduce bias. To reduce it, randomize the order of trials, have testers who do not know the groups, and hide the labels. And remember, it worked in my class is not evidence. One run with many differences proves nothing. Ask yourself whether only one thing changed. Next, we will see how to set up controls in practice, in the slide Setting Up Controls in Practice.
 science-education-research.comncela.ed.govbbc.co.uk+22 min
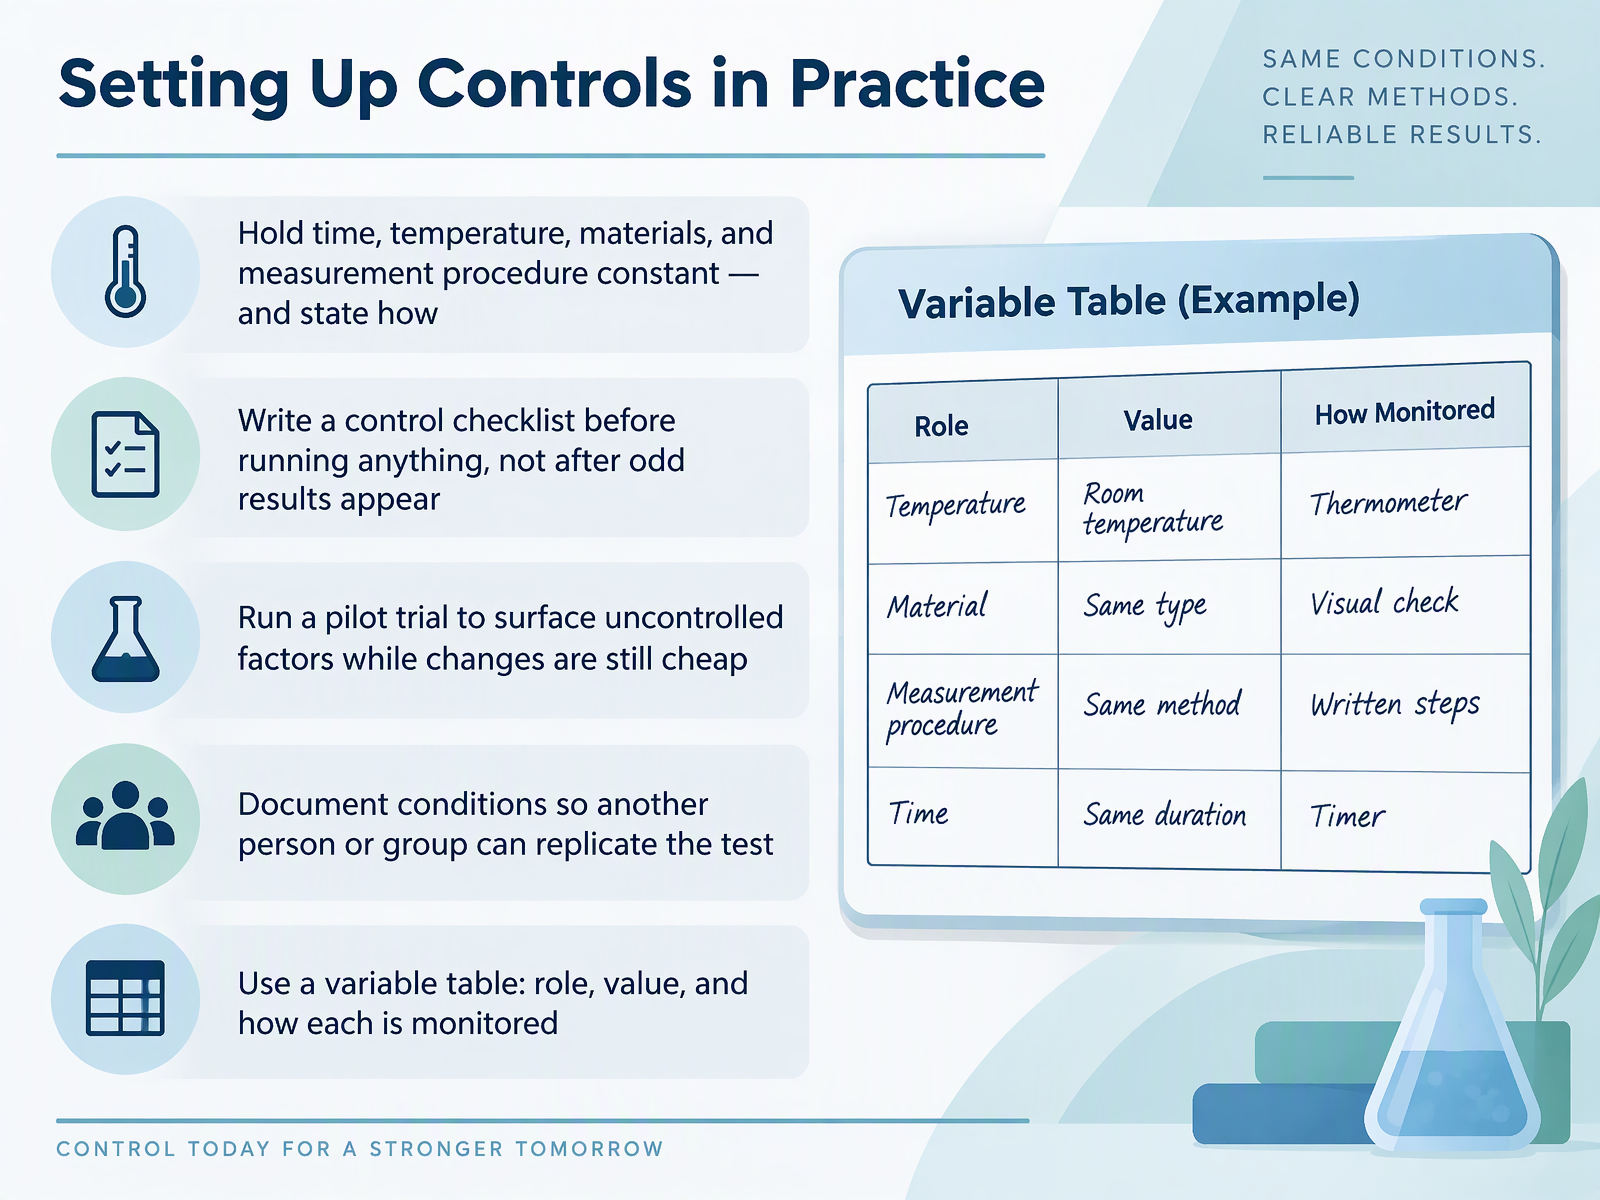
- 06Setting Up Controls in PracticeNow let's turn planning into practice. Controlling variables really means holding things constant and saying how. For example, keep time, temperature, materials, and measurement procedure the same, and write down the exact value, like five grams of sugar, measured on a balance. Write a control checklist before you run anything, not after odd results appear. Then run a short pilot trial to surface uncontrolled factors while changes are still cheap. Document your conditions so another person or group can replicate the test. A variable table helps: list each variable, its role, its value, and how it is monitored. Ask yourself whether only one thing changed. That question is your quickest check. Next, we will look at designing the comparison: groups, trials, and sample size.
 soinc.orgbiolab.vic.edu.ausciencebuddies.org+21 min
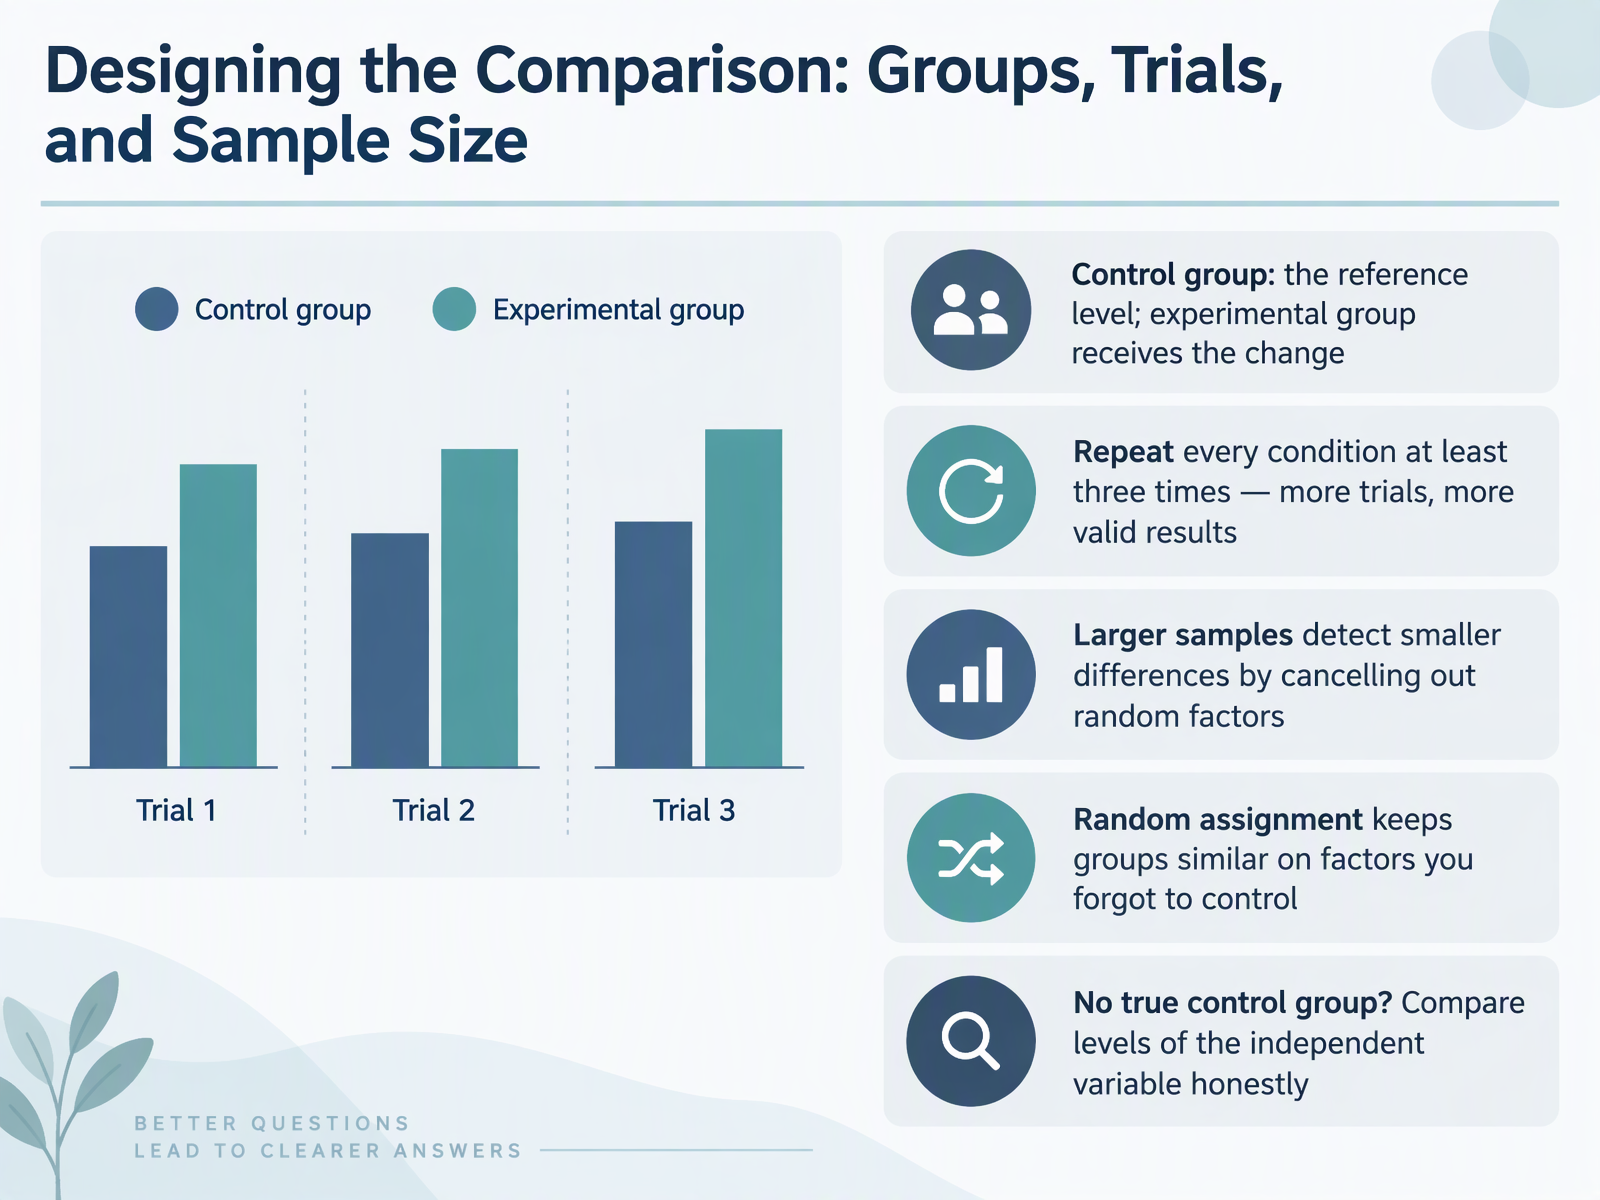
- 07Designing the Comparison: Groups, Trials, and Sample SizeNow let's set up the comparison itself. A control group is your reference level. It stays unchanged. The experimental group receives the change you are testing. For example, plants with no fertilizer are the control, and plants with fertilizer are the experimental group. Next, repeat every condition at least three times. More trials give more valid results. Also, larger samples help you detect smaller differences, because random factors cancel out. Random assignment keeps groups similar on factors you forgot to control. If you have no true control group, compare levels of the independent variable honestly. Ask yourself whether only one thing changed. Next, we will look at measurement and data quality.
 undsci.berkeley.edusciencebuddies.org1 min
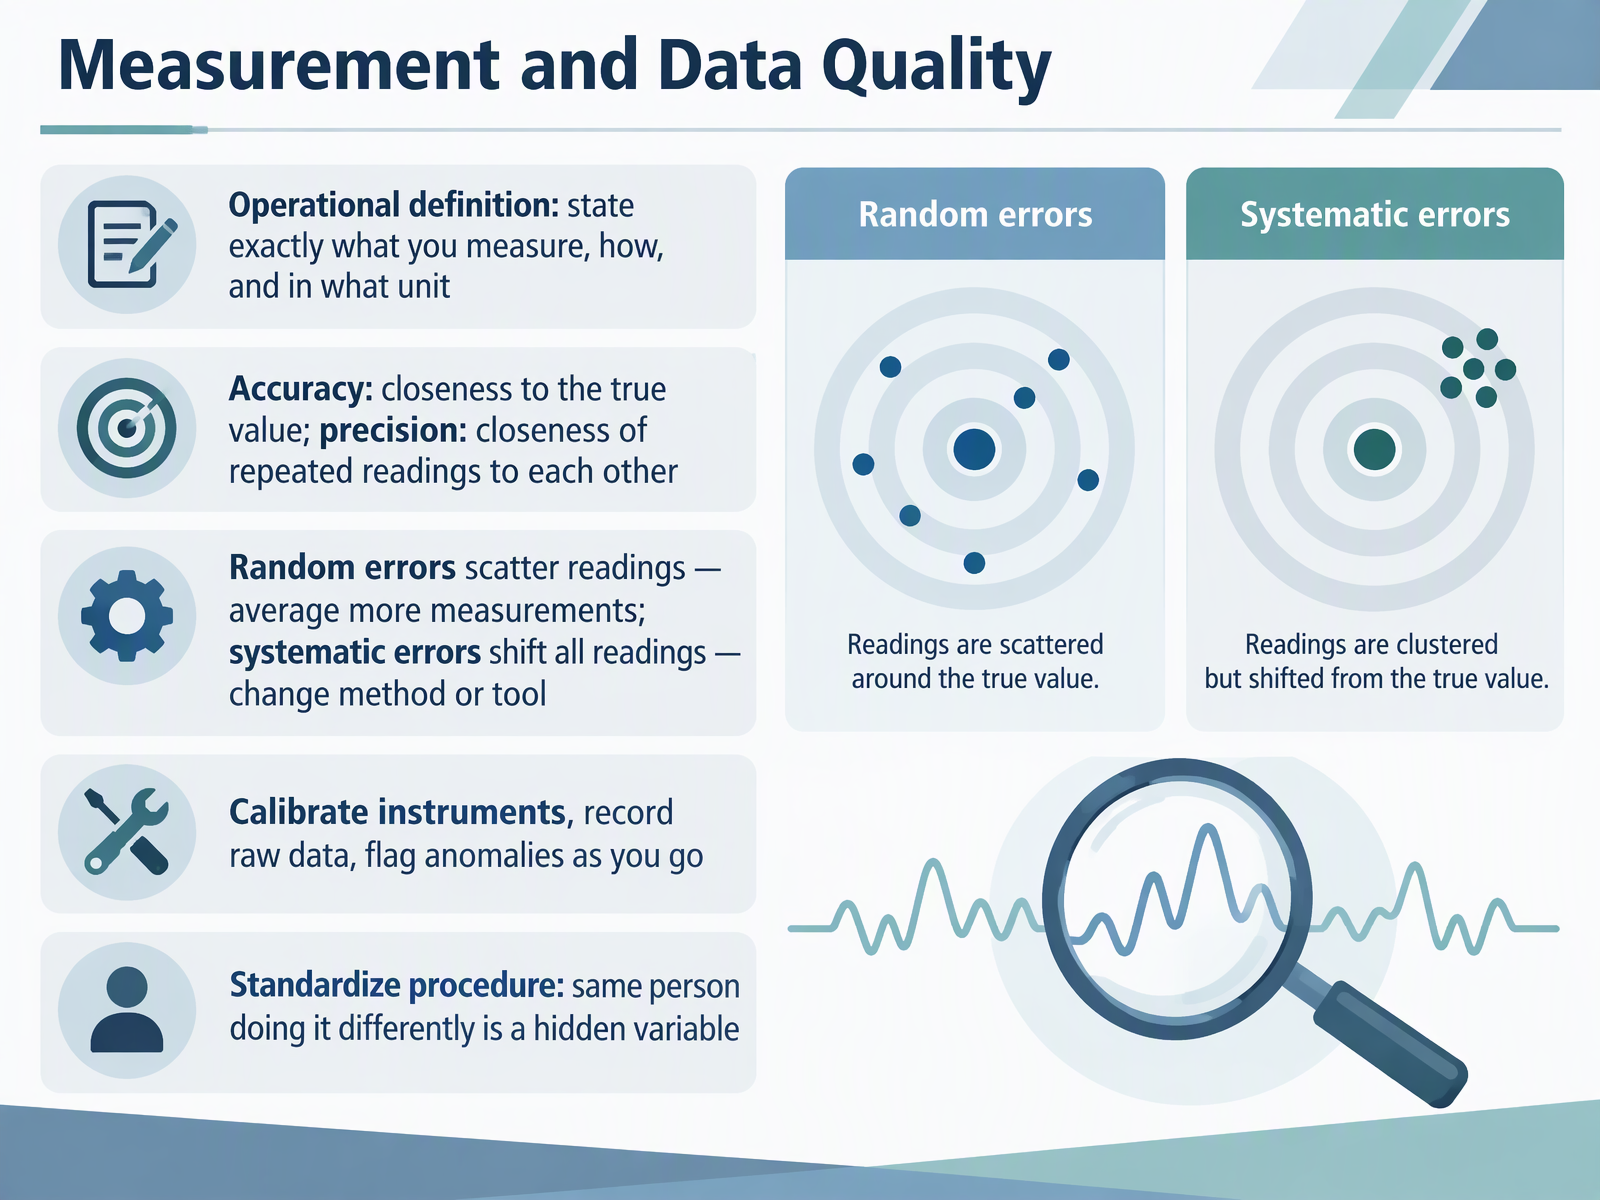
- 08Measurement and Data QualityLet's turn to measurement and data quality. First, write an operational definition. State exactly what you measure, how you measure it, and in what unit. For example, plant height in centimeters, measured with a ruler from soil level to the tallest leaf. Next, distinguish two terms. Accuracy means closeness to the true value. Precision means how close repeated readings are to each other. Random errors scatter readings, so average more measurements. Systematic errors shift all readings in one direction, so change your method or your tool. Calibrate instruments before you start. Record raw data as you collect it. Flag anomalies as you go. And standardize your procedure, because the same person doing it differently each time is a hidden variable. Ask yourself whether every reading was taken the same way. Next, we'll look at common pitfalls and how to fix them.
 2 min
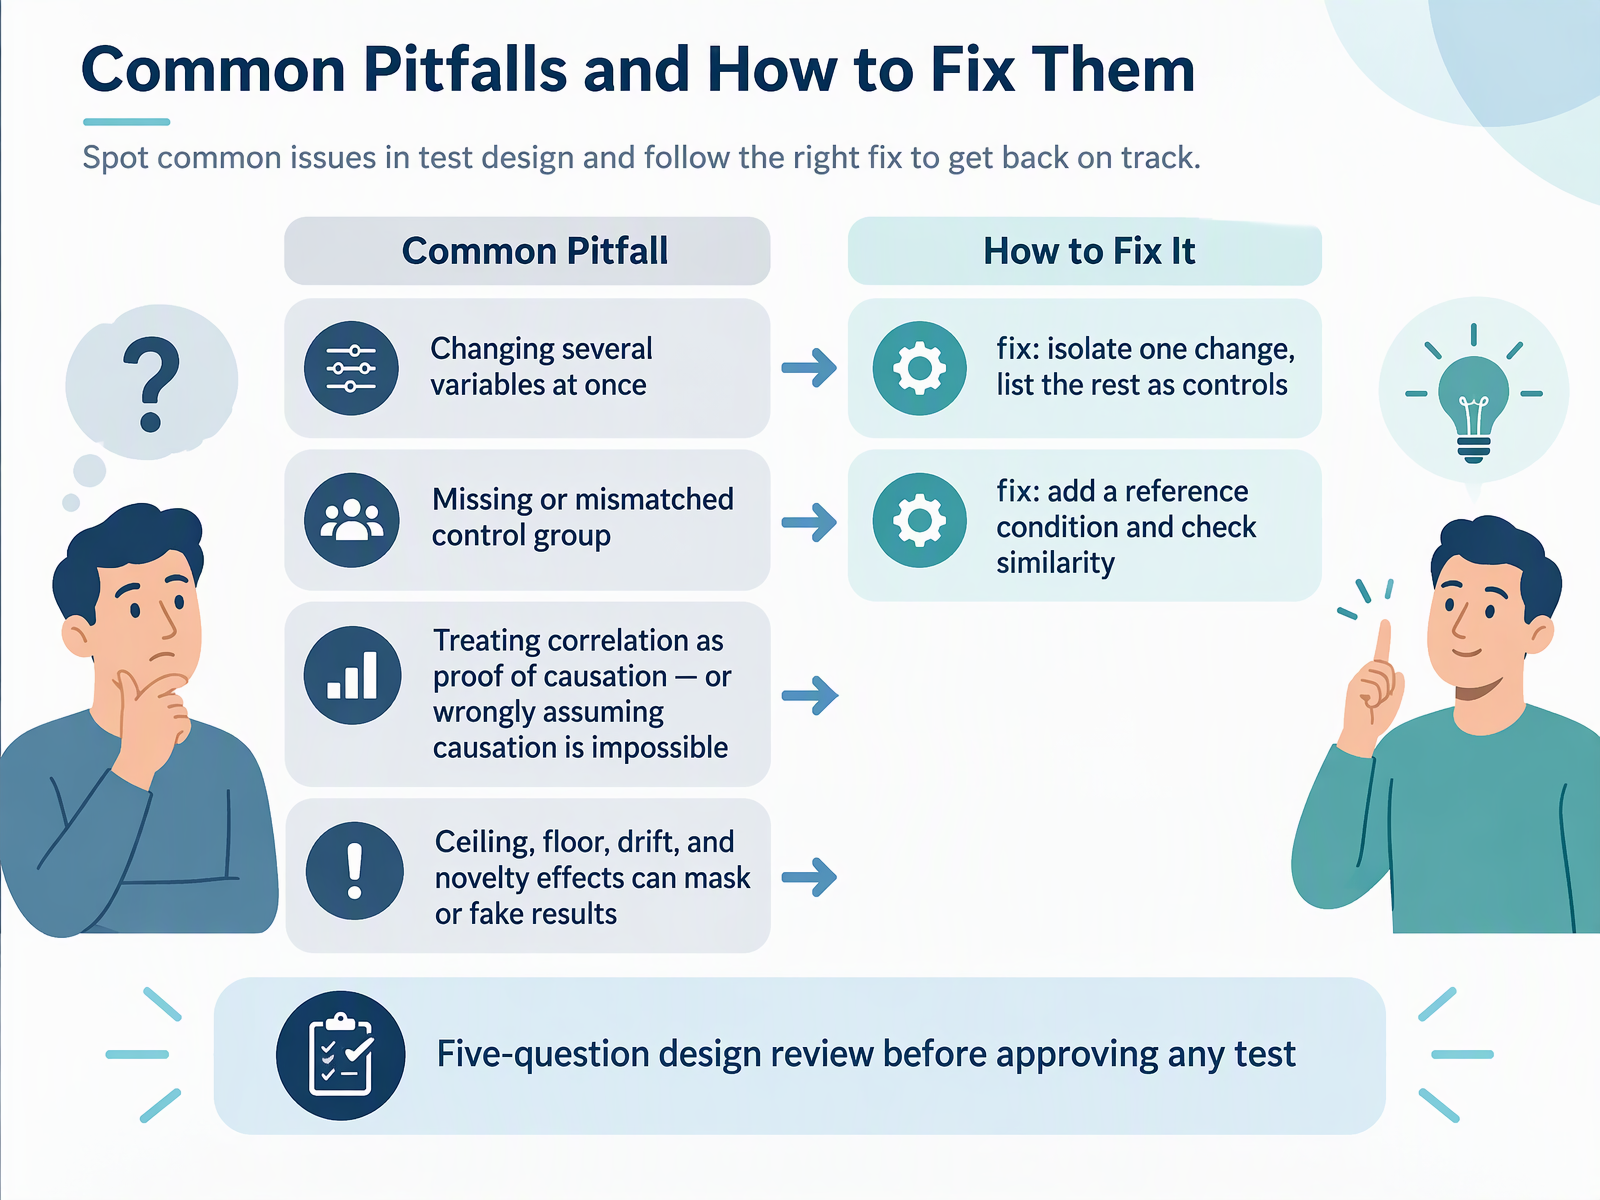
- 09Common Pitfalls and How to Fix ThemLet's look at the most common pitfalls, and how to fix them. First, changing several variables at once. The fix is simple. Isolate one change, and list everything else as a control. Second, a missing or mismatched control group. Add a reference condition, and check that it is truly similar to your test group. Ask yourself whether only one thing changed. Third, treating correlation as proof of causation. A correlation shows two things move together, but a hidden third variable may explain both. And avoid the opposite error, assuming causation is impossible. Fourth, watch for ceiling, floor, drift, and novelty effects. A test that is too easy, too hard, slowly shifting, or simply new can mask or fake results. Before approving any test, run a five-question design review. Worked Case 1: Does a New Study Method Improve Quiz Scores?
 1 min
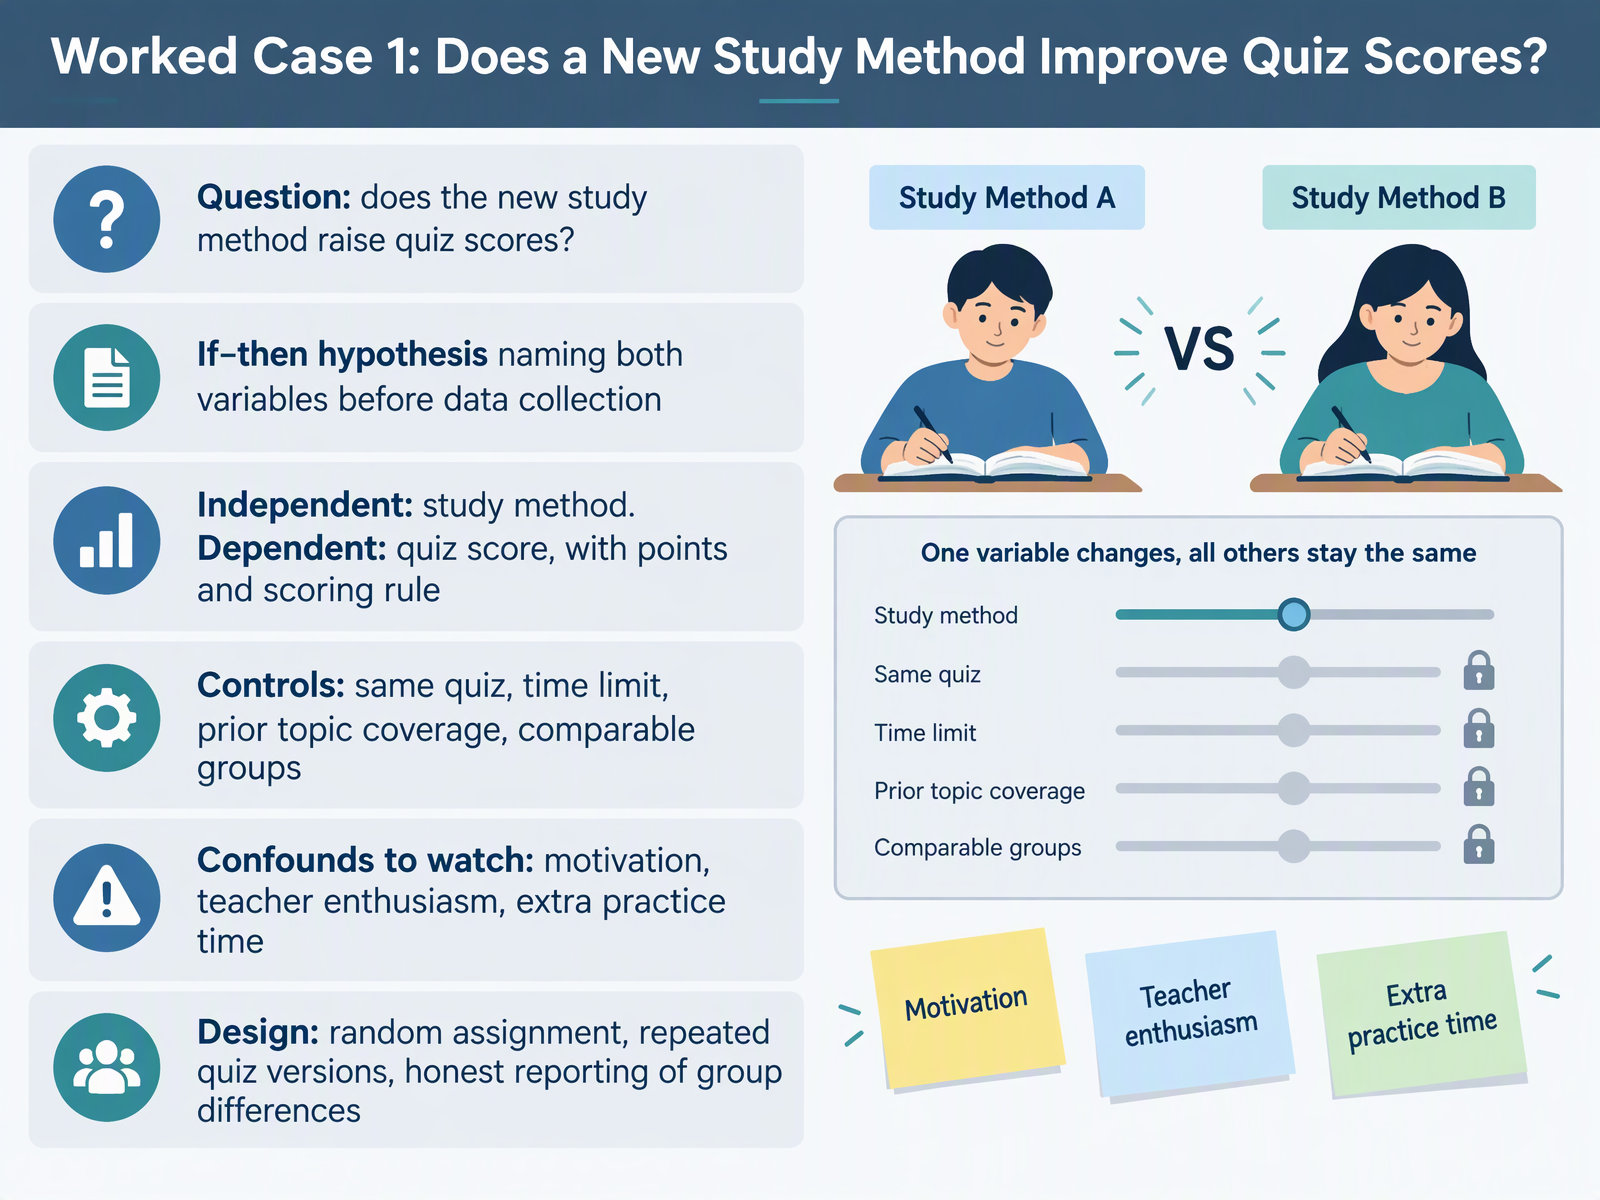
- 10Worked Case 1: Does a New Study Method Improve Quiz Scores?Let's walk through our first worked case to see how this all fits together. Suppose you ask: does a new study method raise quiz scores? Before collecting any data, state an if then hypothesis that names both variables. For example, if students use the new study method, then their quiz scores will be higher. The independent variable is the study method. The dependent variable is the quiz score, measured in points with a clear scoring rule. Now hold everything else constant. Use the same quiz, the same time limit, the same prior topic coverage, and comparable groups. Ask yourself whether only one thing changed. Watch for confounds, such as motivation, teacher enthusiasm, or extra practice time. Reduce them with random assignment, repeated quiz versions, and honest reporting of group differences. That is how a fair test supports a causal claim, rather than just a correlation.
Next, we'll look at a second case: which paper towel absorbs most water?
 1 min
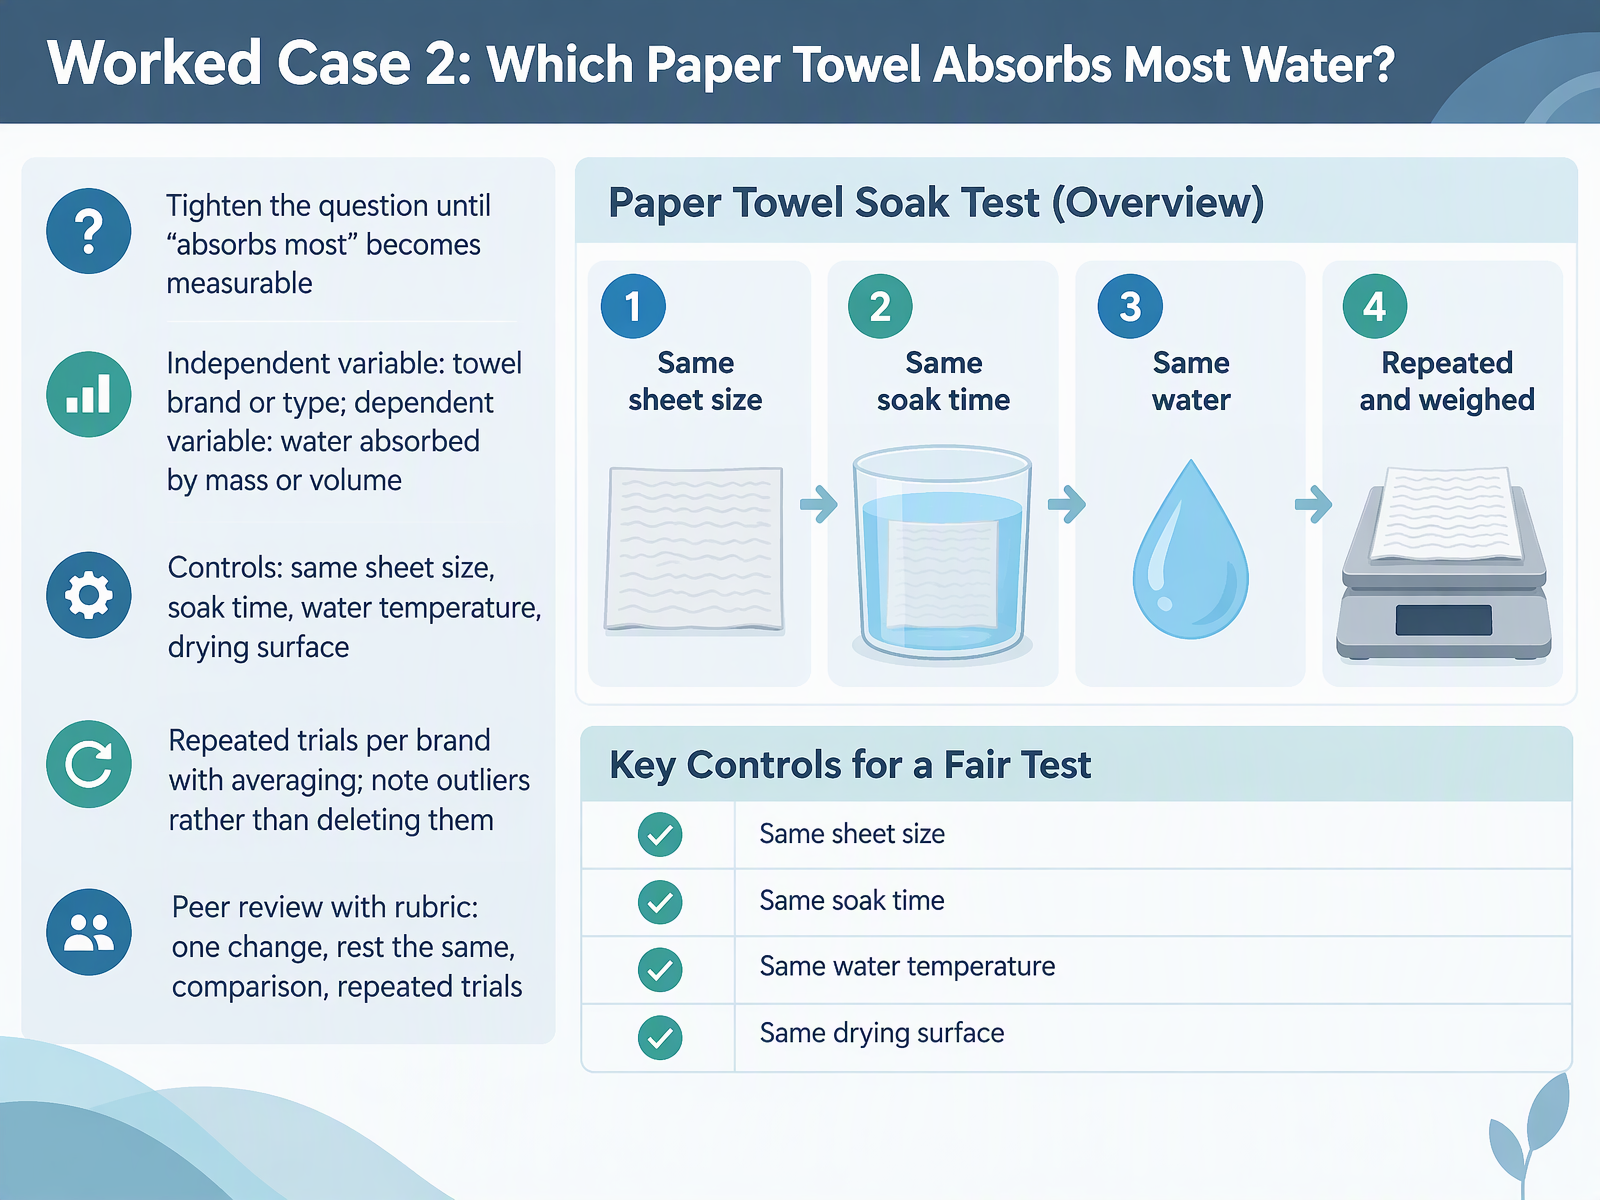
- 11Worked Case 2: Which Paper Towel Absorbs Most Water?Here is our second worked case. The question, which paper towel absorbs most water, is a good start, but it needs tightening. What does absorbs most actually mean? Make it measurable. Say, which brand absorbs the most water by mass, in grams. Now your independent variable is the towel brand or type. Your dependent variable is the water absorbed, measured by mass or volume. Then list your controls. Use the same sheet size for every towel. Keep the soak time the same. Use water at the same temperature. And place each towel on the same drying surface. Ask yourself whether only one thing changed. Run repeated trials per brand, then average the results. If one trial looks unusual, note it as an outlier rather than deleting it. Finally, have a peer review your plan with a rubric. Four checks: one change, the rest the same, a clear comparison, and repeated trials. Next, we will look at assessing fairness with a rubric and self check.
 biolab.vic.edu.au1 min
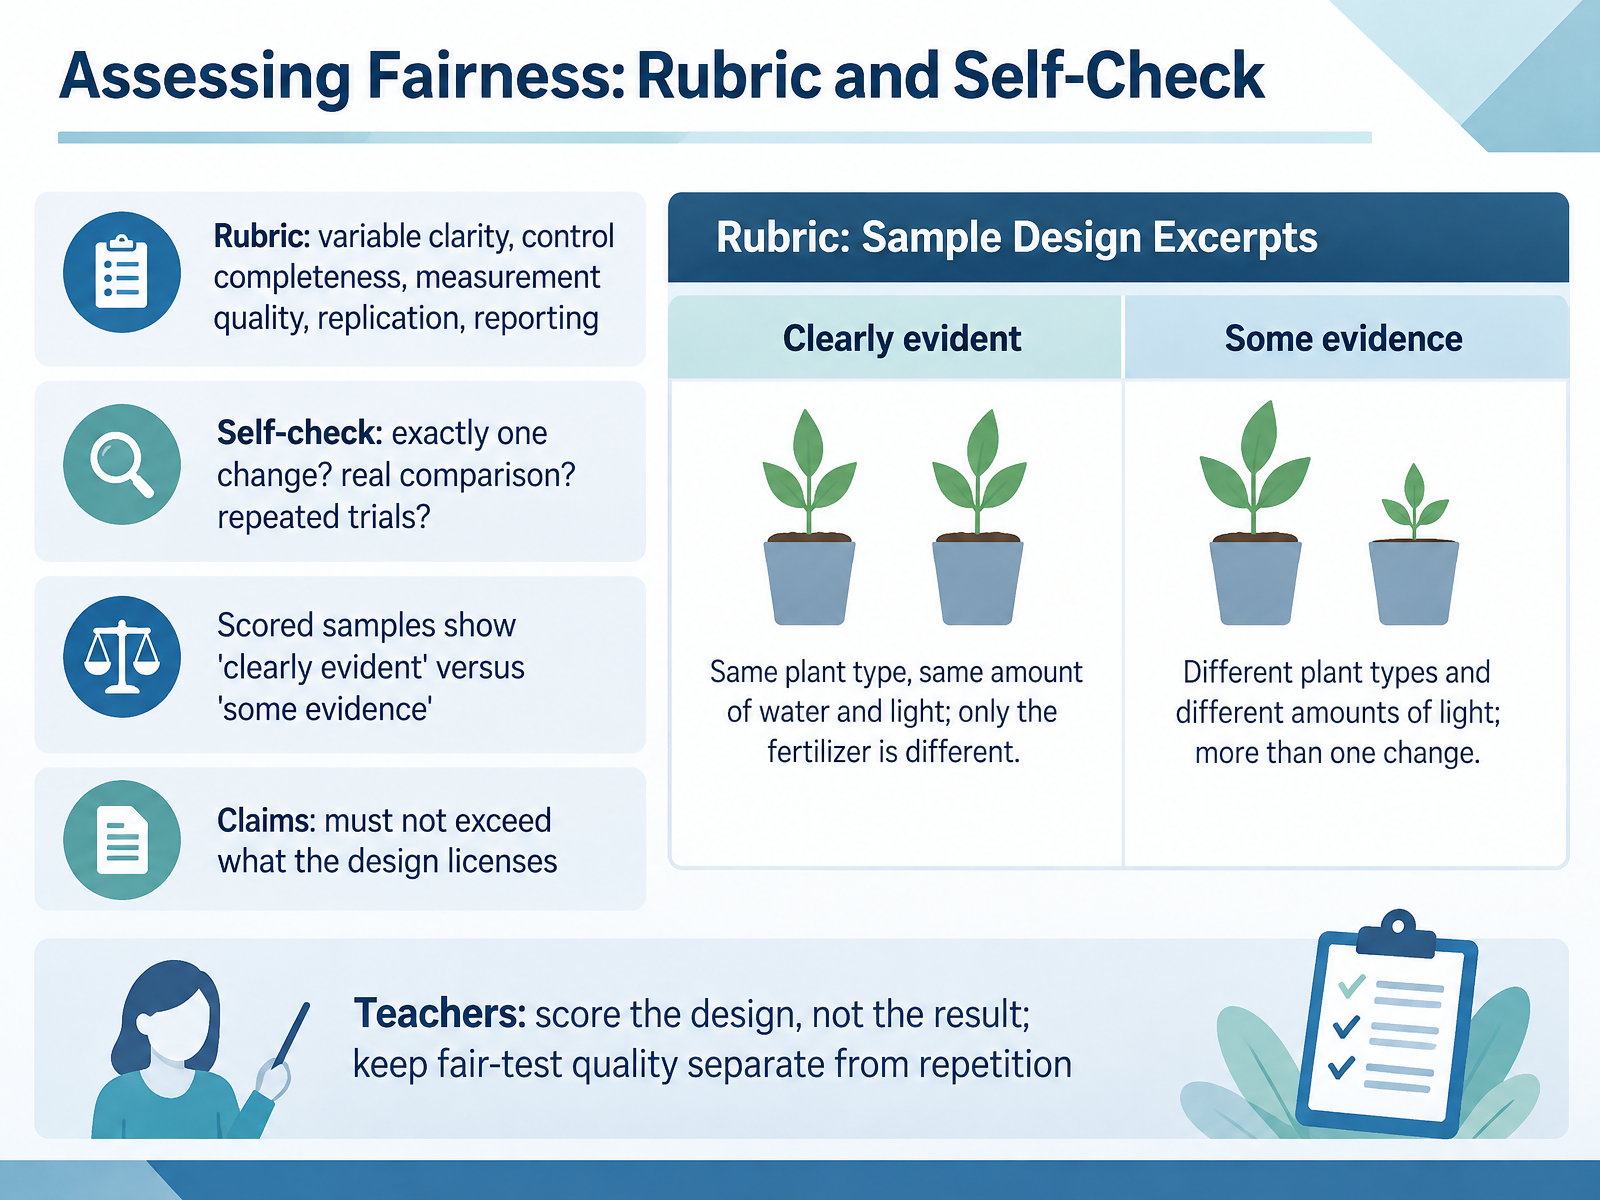
- 12Assessing Fairness: Rubric and Self-CheckNow let's look at how to assess whether a design is actually fair. A good rubric checks five things. Variable clarity: is the independent variable operationally defined, and are the controlled variables named and relevant? Control completeness: are all the important factors held constant? Measurement quality: does the dependent variable have a unit and a clear method? Replication: are there repeated trials? And reporting: could someone else repeat the procedure? Here is a quick self-check. Ask yourself whether only one thing changed. Is there a real comparison, such as a control group or a baseline? And were trials repeated? Scored samples usually run from no evidence, to some evidence, to clearly evident. Compare your work against each level honestly. One more rule: claims must not exceed what the design licenses. If you changed two things, you cannot say which one caused the result. Teachers, score the design, not the result. A well-designed test that gave an unexpected answer still earns credit, and keep fair-test quality separate from repetition, because they are different criteria. Next, we move from classroom to real decisions: A/B tests and field trials.
 biolab.vic.edu.au2 min
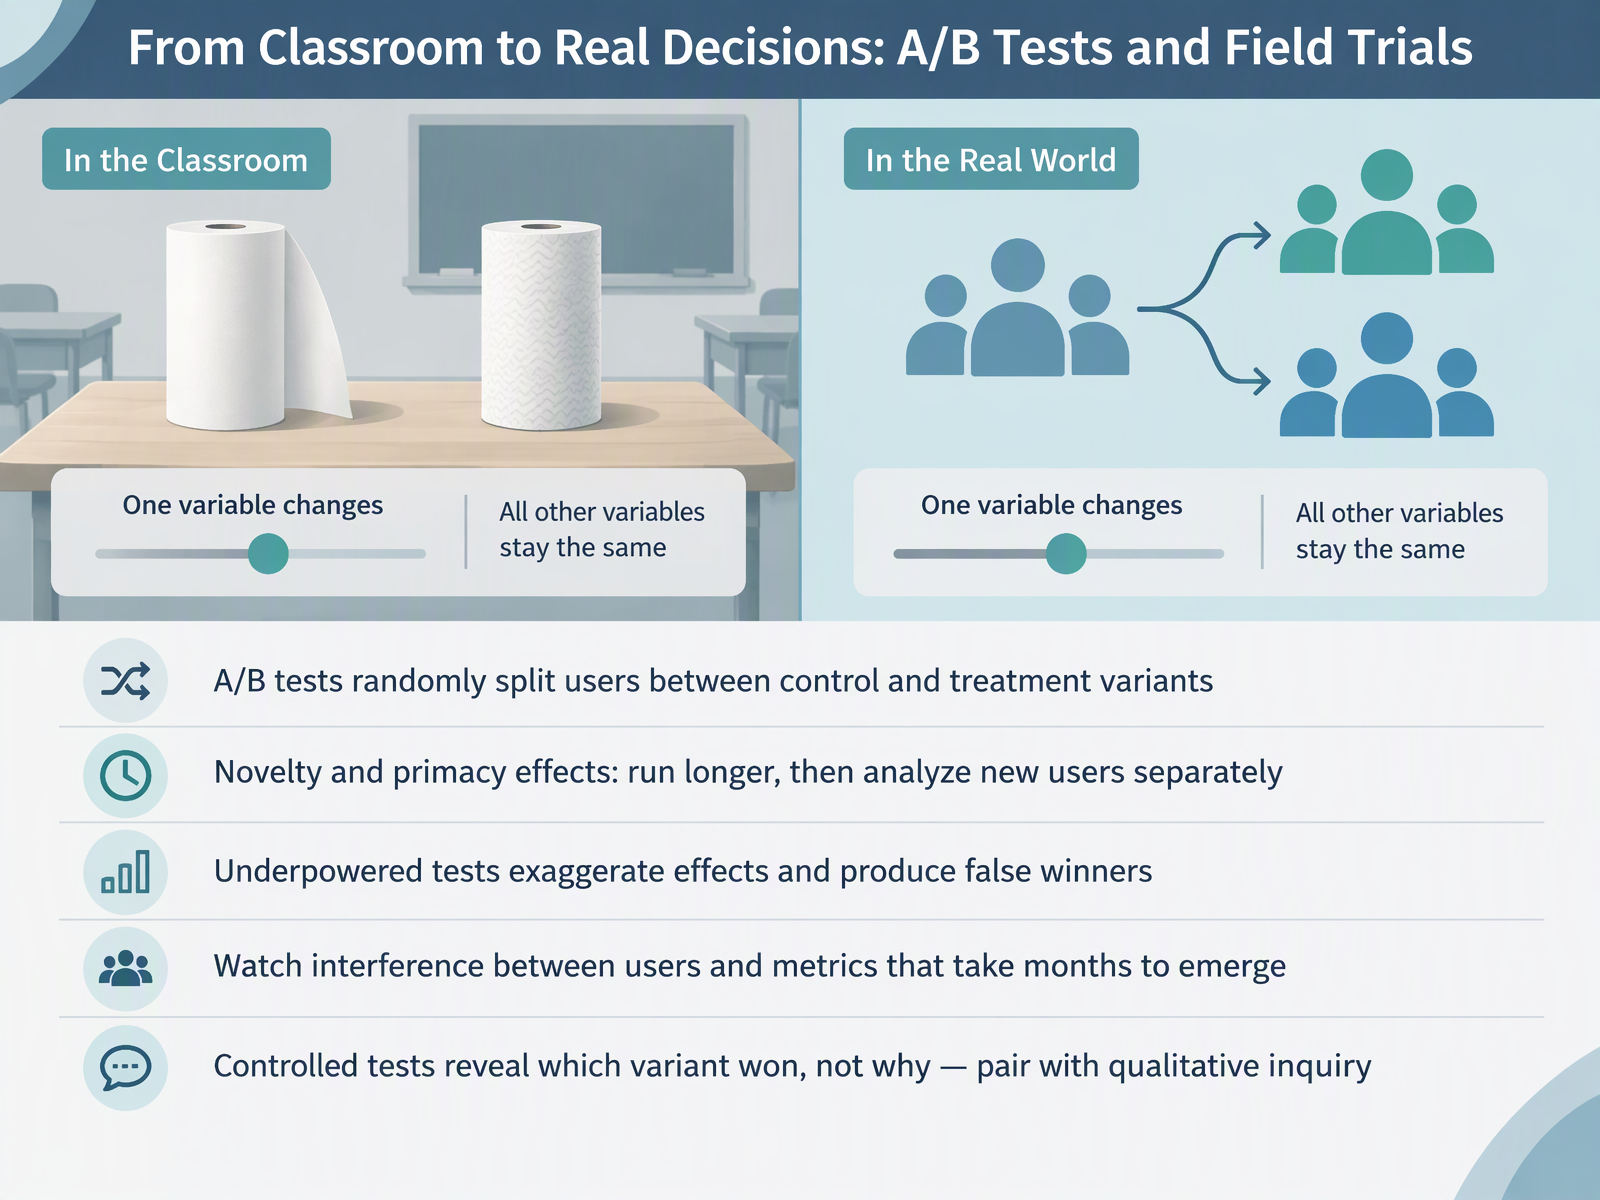
- 13From Classroom to Real Decisions: A/B Tests and Field TrialsNow let's carry these ideas into the real world. In an A B test, users are randomly split between a control version and a treatment version. Random assignment keeps the comparison fair, just like your classroom experiment. But two effects can mislead us. Novelty and primacy effects mean users react to something being new, or to losing a familiar layout. So run the test longer, and analyze new users separately. Next, watch for underpowered tests. When a test has too few users, effects look larger than they are, and you get false winners. Then consider interference. One user's action can affect another user in the control group. And some metrics, like customer satisfaction, take months to emerge, so short tests can miss them. Finally, remember that a controlled test tells you which variant won, not why. So pair it with interviews and observation. Ask yourself whether your test was long enough, powered well enough, and free of interference. Next, we will design and present your own fair test in the capstone: Design, Justify, and Present Your Fair Test.
 2 min
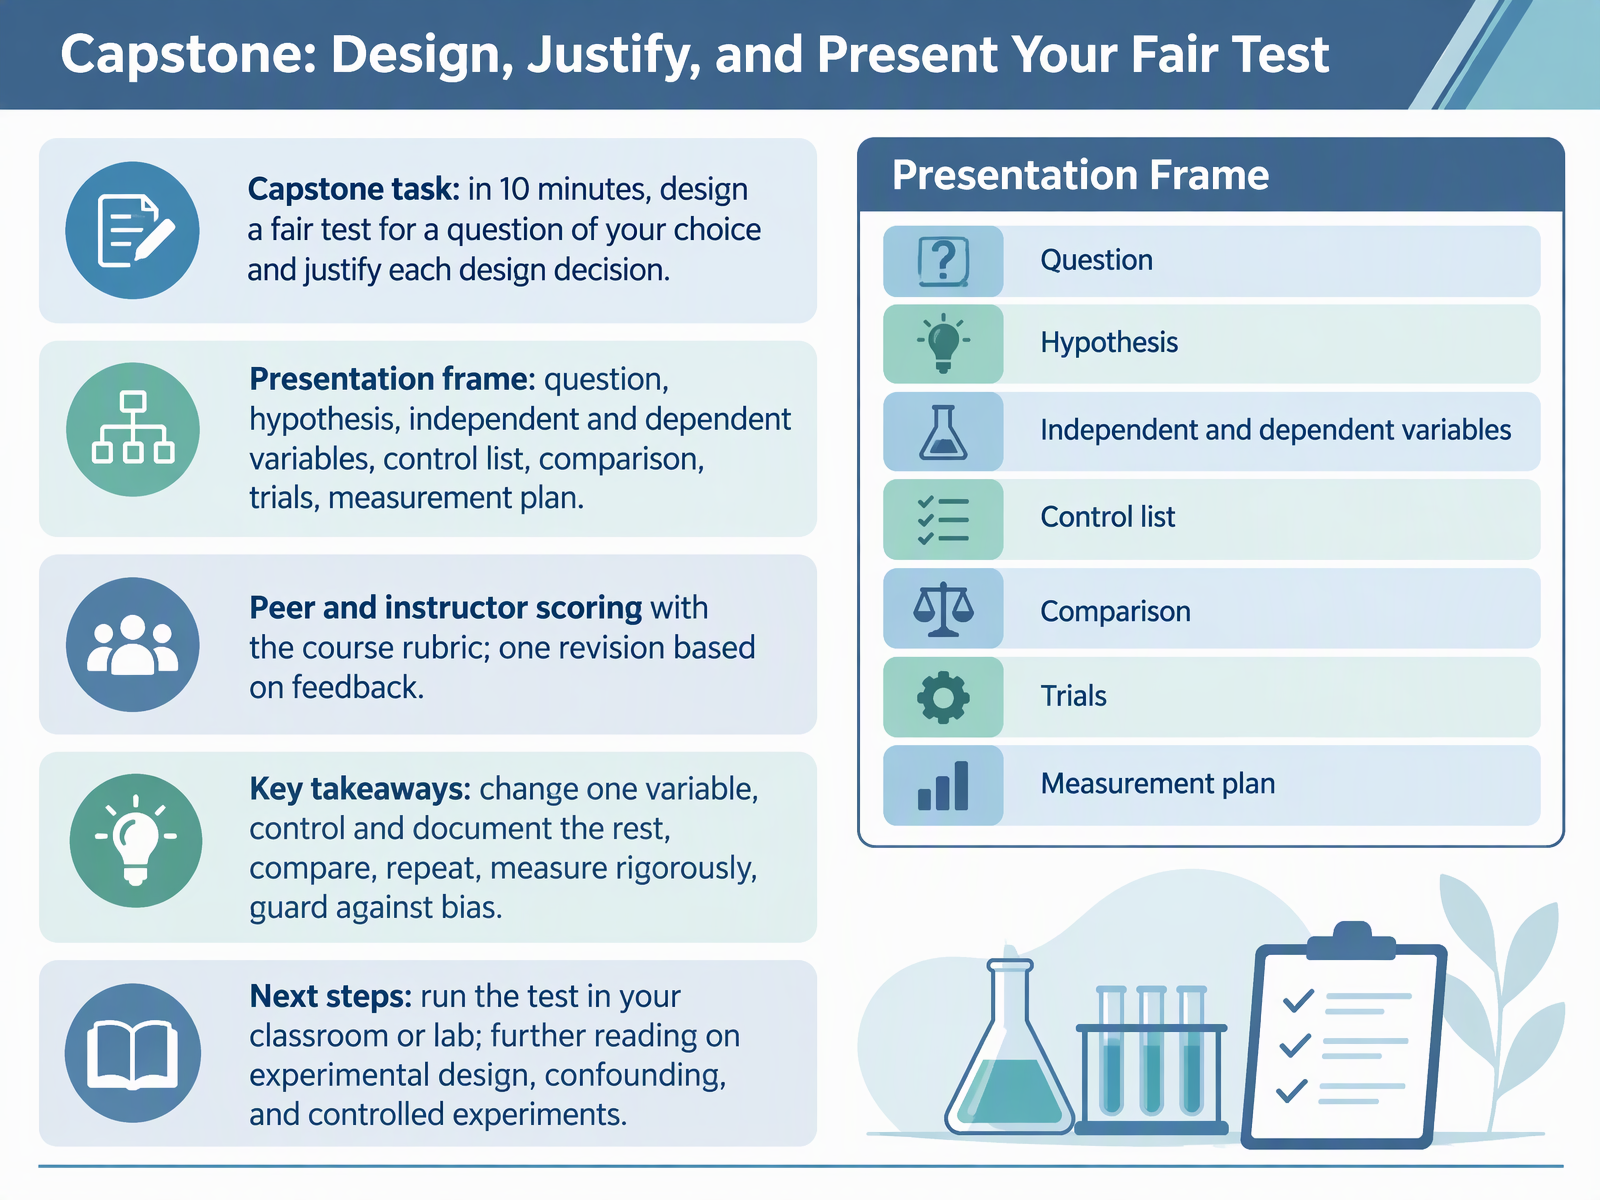
- 14Capstone: Design, Justify, and Present Your Fair TestNow it is your turn. Here is your capstone task. In ten minutes, design a fair test for a question of your choice, and justify each design decision. Present it in this frame. State your question and hypothesis. Name your independent variable, the one thing you change, and your dependent variable, the one thing you measure. Then list your controls, your comparison group, your number of trials, and your measurement plan. Ask yourself whether only one thing changed. Your peers and instructor will score your design with the course rubric, and you will make one revision based on that feedback. Remember the key takeaways. Change one variable. Control and document the rest. Compare groups. Repeat trials. Measure rigorously. And guard against bias. As a next step, run your test in your classroom or lab, and read further on experimental design, confounding, and controlled experiments. You now have a complete, reliable method for asking and answering questions. Thank you for your careful work throughout this course. Keep testing fairly, keep documenting honestly, and trust the evidence you gather.
 soinc.orgbiolab.vic.edu.ausciencebuddies.org+22 min
Take the deck with you
Download this course as a file — free, no sign-up needed.
- PDF handoutEvery slide page, ready to print or share.15 pages · 3.3 MBDownload
- Narrated PowerPointThe deck that presents itself — every slide carries the digital human's narration video.15 pages · 11.9 MBDownload
- PowerPoint slidesThe full deck as a .pptx — open it in PowerPoint, Keynote, or Google Slides.15 pages · 3.2 MBDownload
Free to use in your own training — please keep the PersonWise credit page at the end.
Have your own deck? Turn it into a course
Sources consulted
Web sources consulted while building this course.
- How do you make sure a test is fair? – KS2 Science curriculum - BBC Bitesize — bbc.co.uk
- How do you make sure a test is fair? — bbc.co.uk
- Fair tests: A do-it-yourself guide — undsci.berkeley.edu
- 1.7 A fair test is a controlled experiment — issuu.com
- Setting Up a Fair Test - Let's Talk Science — letstalkscience.ca
- EXPERIMENTAL DESIGN CHECKLIST — soinc.org
- Bounce Engineers — biolab.vic.edu.au
- Preparing Experimental Procedures for a Science Fair Project — sciencebuddies.org
- Variables, Constants, and Controls — static.nsta.org
- Designing a Controlled Experiment — Grade 8 Lesson · Whole Earth Curriculum — wholeearthcurriculum.org
- COGS 230: Human-Computer Interaction - Methodology Matters: How to do Experiments? — cseweb.ucsd.edu
- 2.3 Analyzing Findings - Psychology 2e | OpenStax — openstax.org
- Independent and Dependent Variables - Organizing Your Social Sciences Research Paper - Research Guides at University of Southern California — libguides.usc.edu
- Experimental Variables — nerd.wwnorton.com
- 1.5: Confounding Variables - Statistics LibreTexts — stats.libretexts.org
- Confounding variables – Science-Education-Research — science-education-research.com
- LessonStartersControllingVariablesinExperiments — ncela.ed.gov
- Valid measurements - What needs to be considered when investigating a phenomenon? - GCSE Combined Science Revision - Cambridge OCR 21st Century - BBC Bitesize — bbc.co.uk
- WWC STANDARDS Brief: Confounding Factors — ies.ed.gov
- 7 Internal validity | Scientific Research and Methodology — peterkdunn.github.io