Begin
14 pages · ~28 min
Köppen Climate Zones of the World
This training introduces the Köppen climate classification system, helping learners identify and interpret global climate zones. Ideal for students and professionals in geography, ecology, and environmental science.
A digital instructor presents all 14 pages. Hold “Ask” at any point and ask out loud — the answer comes from this course. No sign-up needed.
What you’ll learn
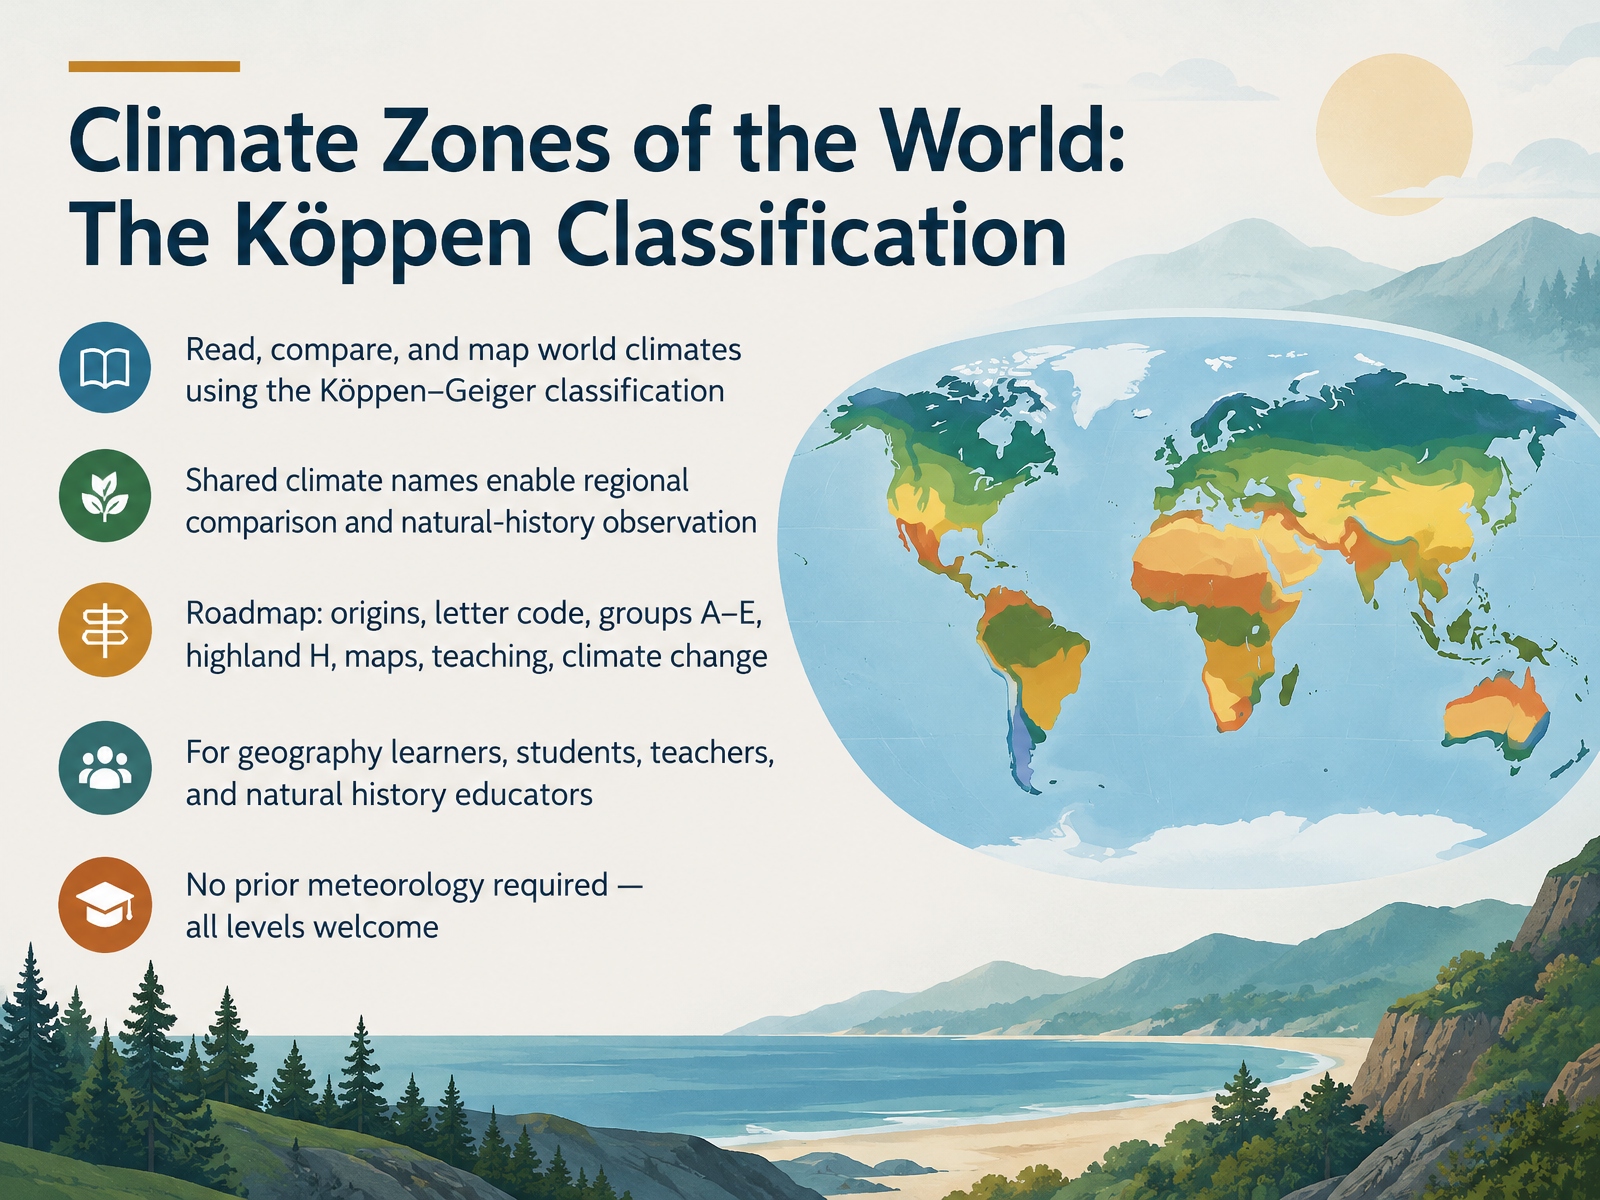
- 01Climate Zones of the World: The Köppen ClassificationWelcome. In this course, we will read, compare, and map the world's climates using the Köppen–Geiger classification. It is the most widely used climate classification system, and its shared names let us compare regions and make natural-history observations across continents. Here is our roadmap: the origins of the system, how its letter codes work, the main groups A through E, the highland H category, reading climate maps, teaching ideas, and climate change. This course is for geography learners, students, teachers, and natural-history educators. No prior meteorology is required. All levels are welcome. Next, we look at the background: why classify climates, and what Köppen built.koppen.earthweather.metoffice.gov.uken.wikipedia.org+21 min
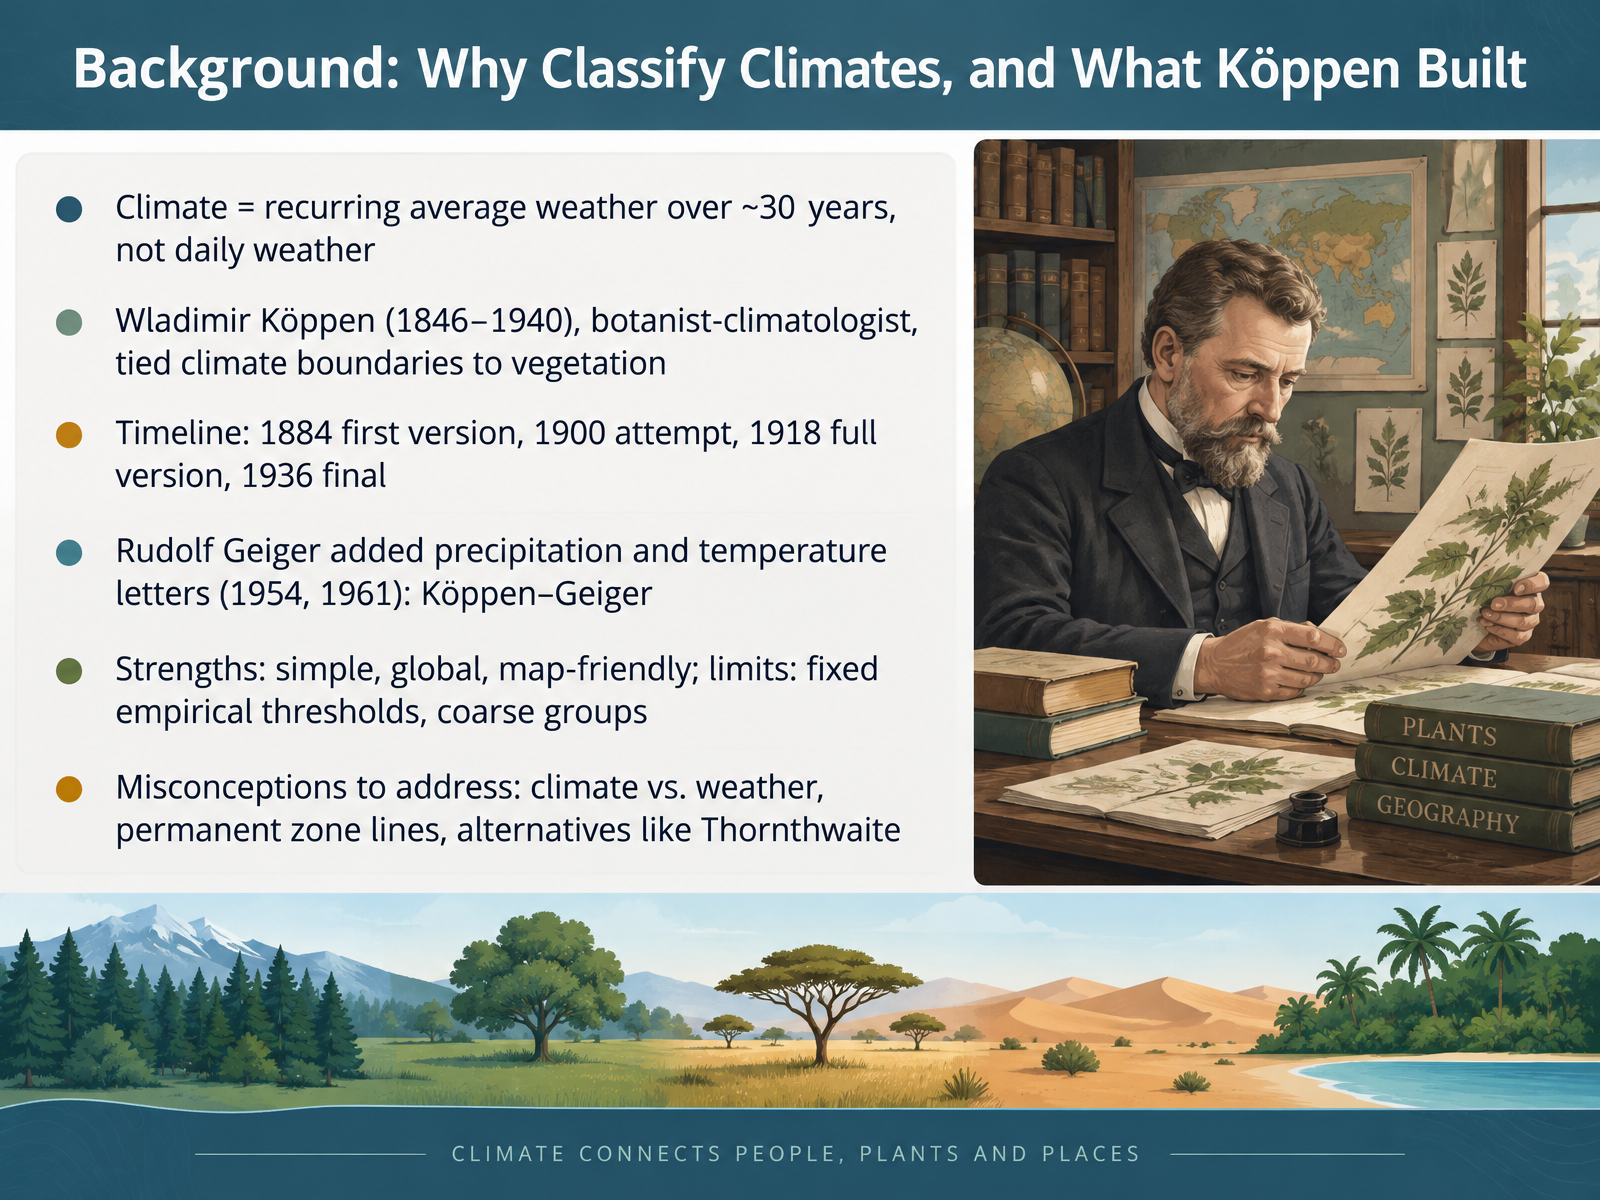
- 02Background: Why Classify Climates, and What Köppen BuiltBefore we read any climate map, let's clarify what a climate actually is, and where this system came from. Climate means the recurring average weather of a place over about thirty years. It is not the weather you see outside today. The most widely used framework is the Köppen classification, built by Wladimir Köppen, a botanist and climatologist who lived from eighteen forty six to nineteen forty. He tied climate boundaries to vegetation, because plant life reflects long-term conditions. The timeline is worth noting. A first version appeared in eighteen eighty four, an attempt in nineteen hundred, a full version in nineteen eighteen, and the final version in nineteen thirty six. Rudolf Geiger later added precipitation and temperature letters, in nineteen fifty four and nineteen sixty one, giving us the Köppen-Geiger system. Its strengths are simplicity, global coverage, and map friendliness. Its limits are fixed empirical thresholds and rather coarse groups. Keep three misconceptions in mind. Climate is not weather. Zone lines are not permanent. And alternatives exist, such as the Thornthwaite classification. Next, we look at how the letter code itself works: three positions, one climate formula.
 en.wikipedia.orgkoeppen-geiger.vu-wien.ac.atkoeppen-geiger.vu-wien.ac.at+22 min
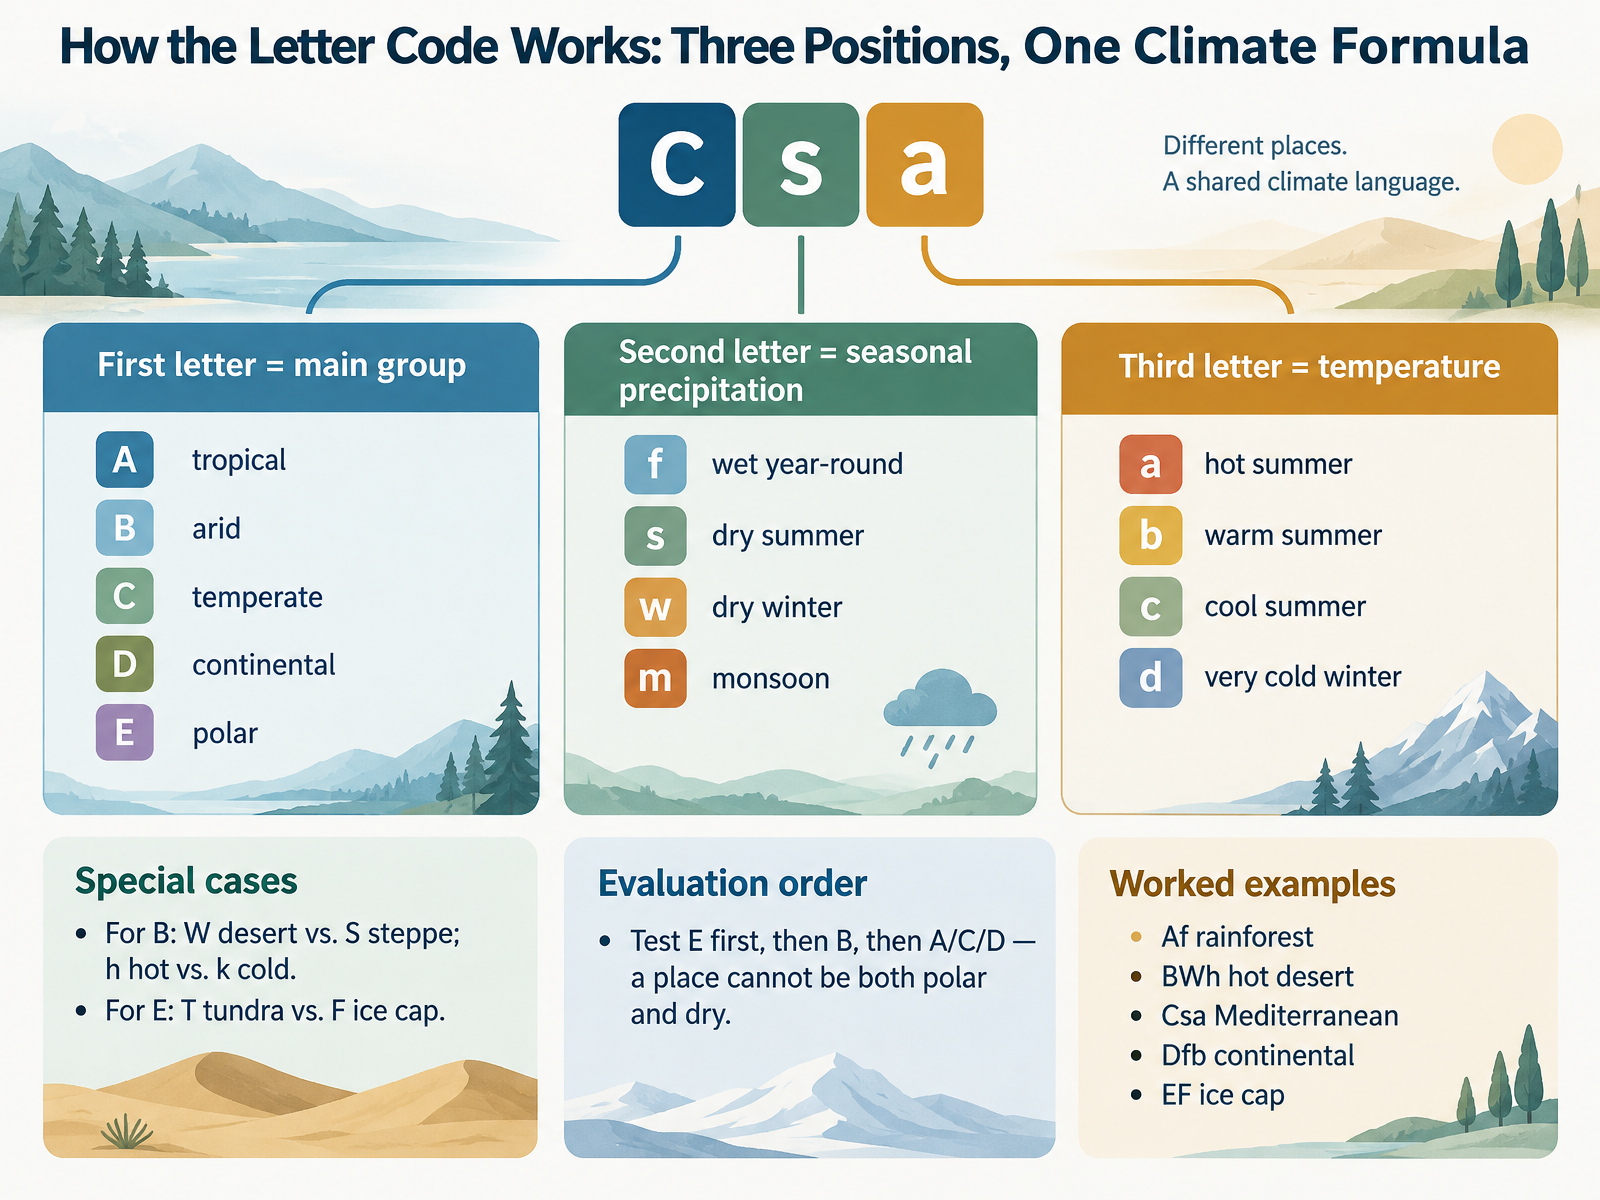
- 03How the Letter Code Works: Three Positions, One Climate FormulaNow let's see how a single letter code becomes a climate formula. Each code reads in three positions. The first letter gives the main group. A is tropical, B is arid, C is temperate, D is continental, and E is polar. The second letter describes seasonal precipitation. f means wet year-round, s a dry summer, w a dry winter, and m a monsoon pattern. The third letter marks temperature. a is a hot summer, b a warm summer, c a cool summer, and d a very cold winter. Group B works differently. There, W means desert and S means steppe, while h is hot and k is cold. For group E, T is tundra and F is ice cap. When you evaluate, test E first, then B, then A, C, or D. A place cannot be both polar and dry. Try these worked examples. Af is a tropical rainforest. BWh is a hot desert. Csa is a Mediterranean climate. Dfb is a continental climate with a warm summer. EF is an ice cap. Next, we look at the five main groups at a glance, with thresholds and world distribution.
 noaa.govglobe.govpressbooks.bccampus.ca+22 min
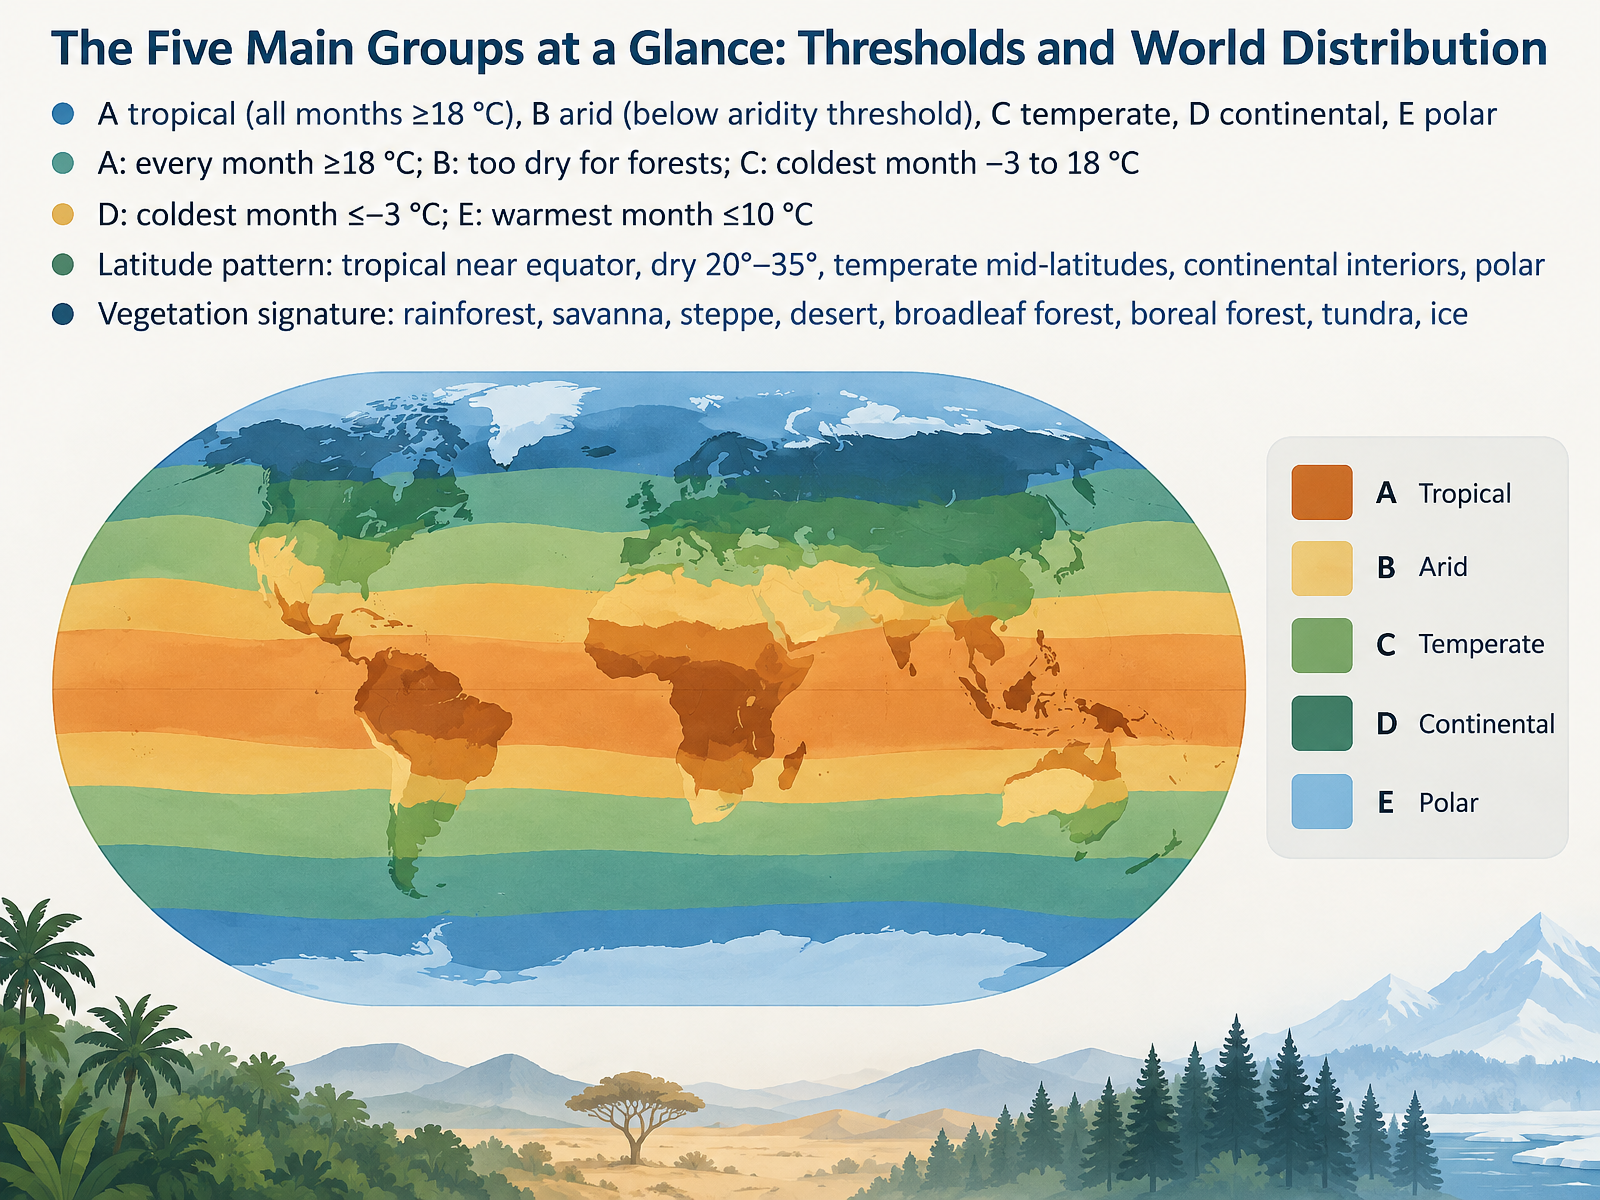
- 04The Five Main Groups at a Glance: Thresholds and World DistributionLet's step back and take in all five groups at once. The Köppen system uses letters A through E. A is tropical, with every month averaging at least eighteen degrees Celsius. B is arid, defined not by a single temperature but by aridity, meaning rainfall is low enough that potential evaporation exceeds precipitation, so forests cannot form. C is temperate, with the coldest month between minus three and eighteen degrees Celsius. D is continental, where the coldest month drops to minus three degrees or below. And E is polar, where even the warmest month stays at or below ten degrees Celsius. Notice the latitude pattern: tropical climates hug the equator, dry climates sit roughly twenty to thirty-five degrees north and south, temperate climates occupy the mid-latitudes, and continental and polar climates lie poleward, often deep inside continents. Each group also carries a vegetation signature: rainforest and savanna in A, steppe and desert in B, broadleaf forest in C, boreal forest in D, and tundra or ice in E. Next, we look closely at tropical climates. Tropical Climates, Group A: Rainforest, Monsoon, Savanna.
 koppen.earthweather.metoffice.gov.uken.wikipedia.org+22 min
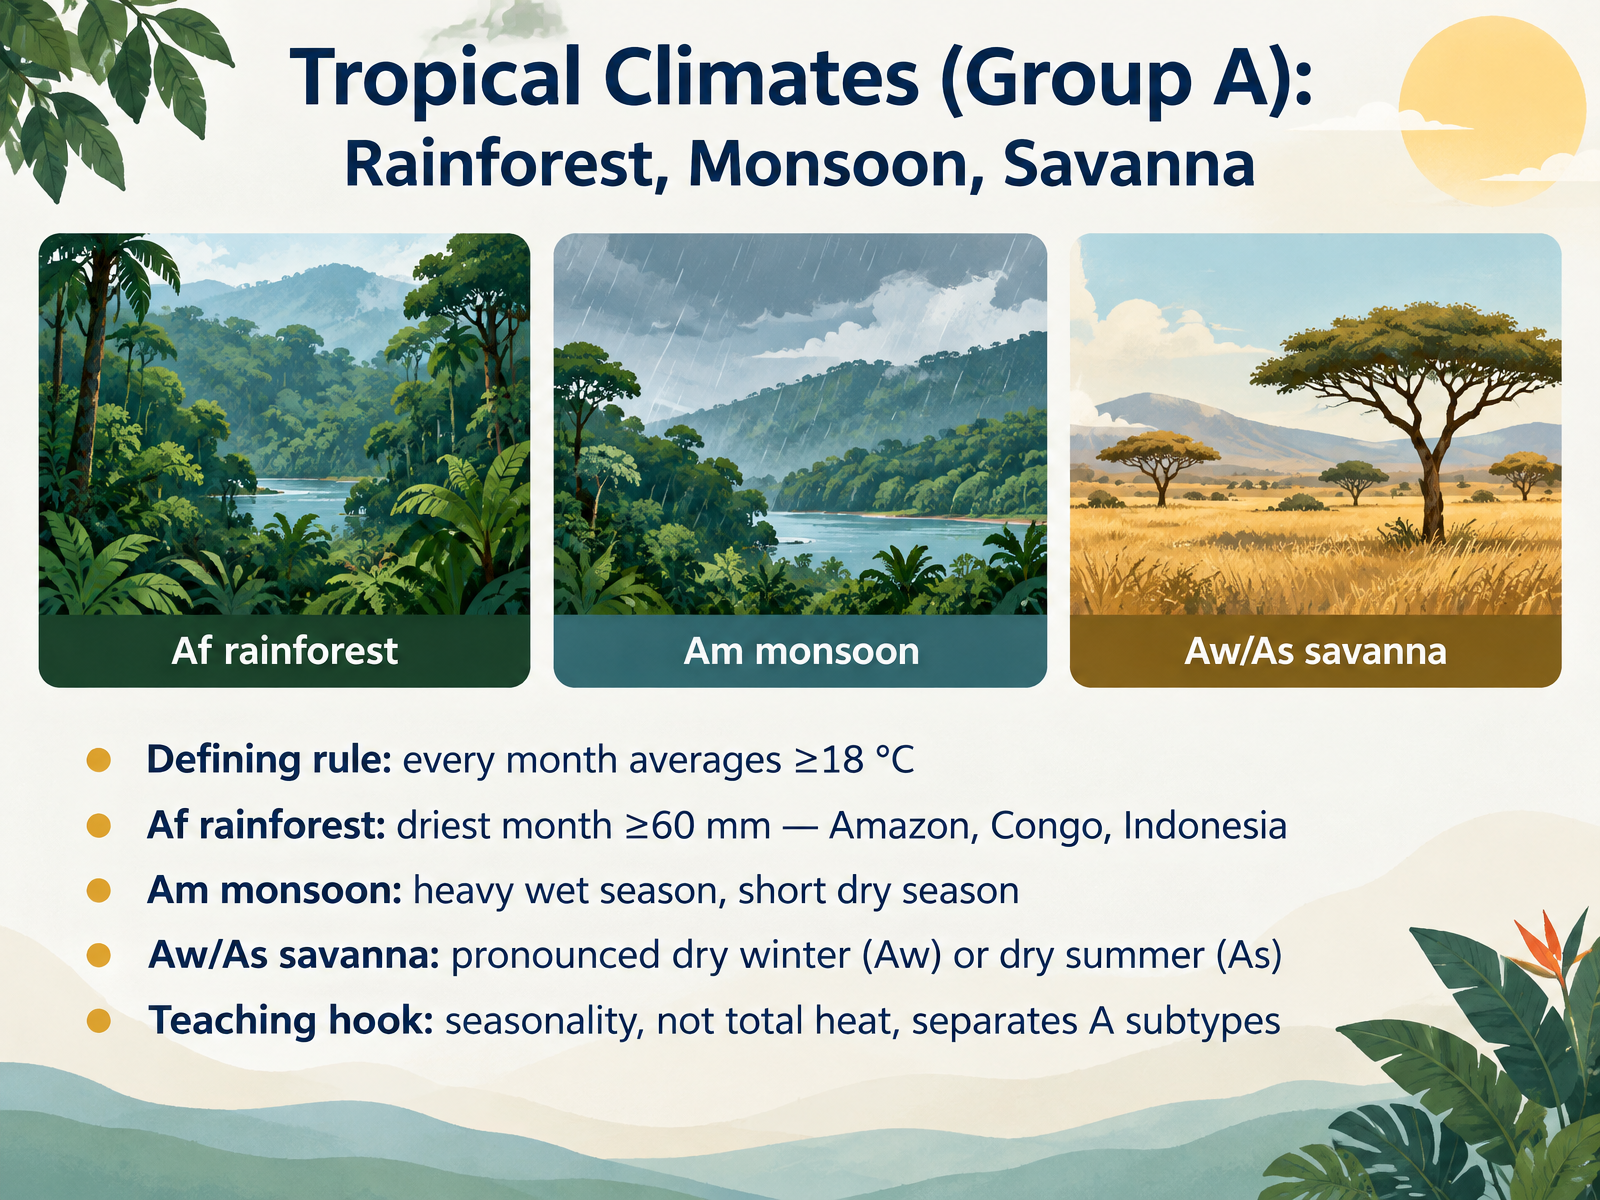
- 05Tropical Climates (Group A): Rainforest, Monsoon, SavannaNow let's move into Group A, the tropical climates. One rule defines the whole group: every month averages eighteen degrees Celsius or warmer. Within that warmth, seasonality of rainfall does the sorting. The rainforest subtype, A f, has no dry season. Its driest month still receives at least sixty millimeters of rain, so rainfall is spread through the year. Picture the Amazon, the Congo Basin, and Indonesia. The monsoon subtype, A m, has a pronounced wet season and only a short dry season. The savanna subtypes, A w and A s, show a clear dry period: a dry winter for A w, or a dry summer for A s. Compare a rainforest month with a savanna dry month, and you can see the difference. Notice the teaching hook here: it is not total heat that separates the A subtypes, but seasonality. Hold that idea as we turn to why aridity is a balance, not a number, in Dry Climates, Group B.
 noaa.govglobe.govpressbooks.bccampus.ca+22 min
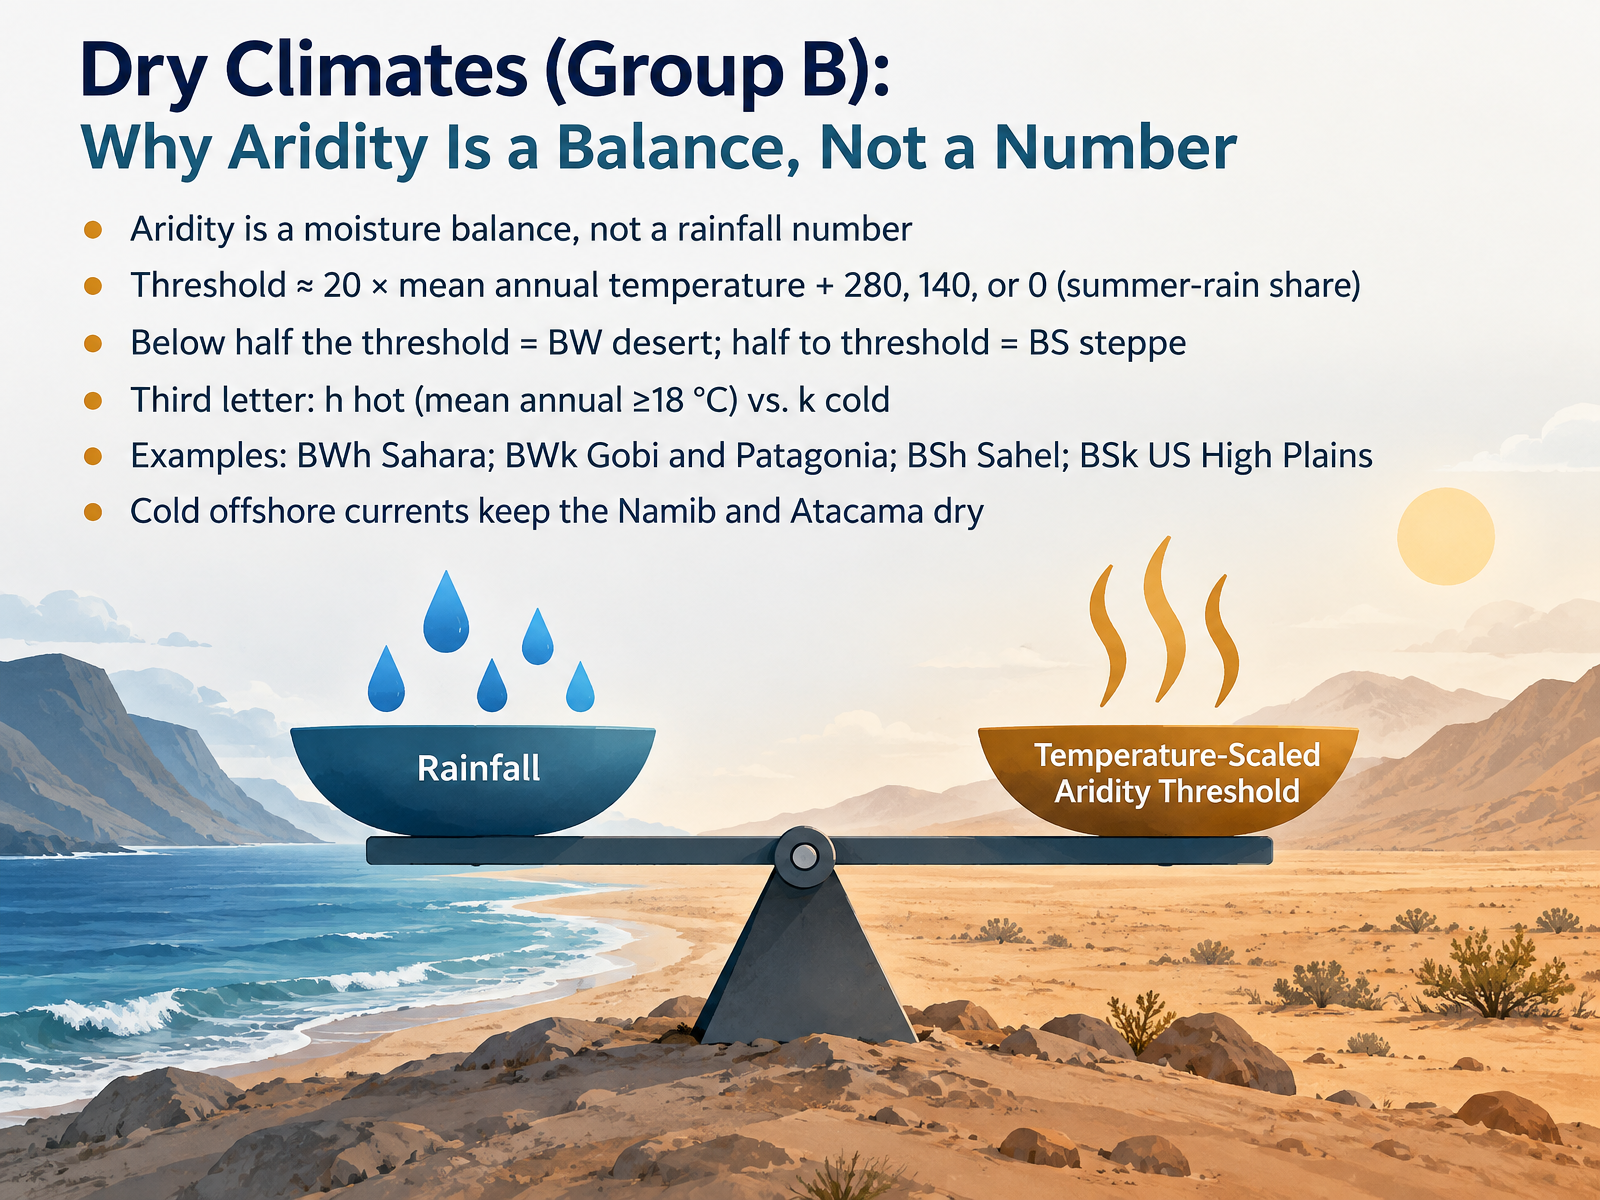
- 06Dry Climates (Group B): Why Aridity Is a Balance, Not a NumberNext, we look at dry climates, Group B. Here is the key idea. Aridity is a moisture balance, not a rainfall number. Köppen compares rain with what the heat can evaporate, so the threshold rises with temperature. It equals twenty times the mean annual temperature, plus two hundred eighty if most rain falls in summer, plus one hundred forty if rain is spread across the year, or plus zero if most rain falls in winter. If rainfall is below half that threshold, the climate is BW, a desert. Between half and the full threshold, it is BS, a steppe. A third letter separates hot from cold. The Sahara is BWh, hot desert. The Gobi and Patagonia are BWk, cold desert. The Sahel is BSh, and the United States High Plains are BSk. Notice that cold offshore currents keep the Namib and Atacama dry. So ask about balance, not just total rain. That balance logic carries into the next group. Temperate and Continental Climates, Groups C and D.
 open.oregonstate.educationjuergen-grieser.deen.wikipedia.org+22 min
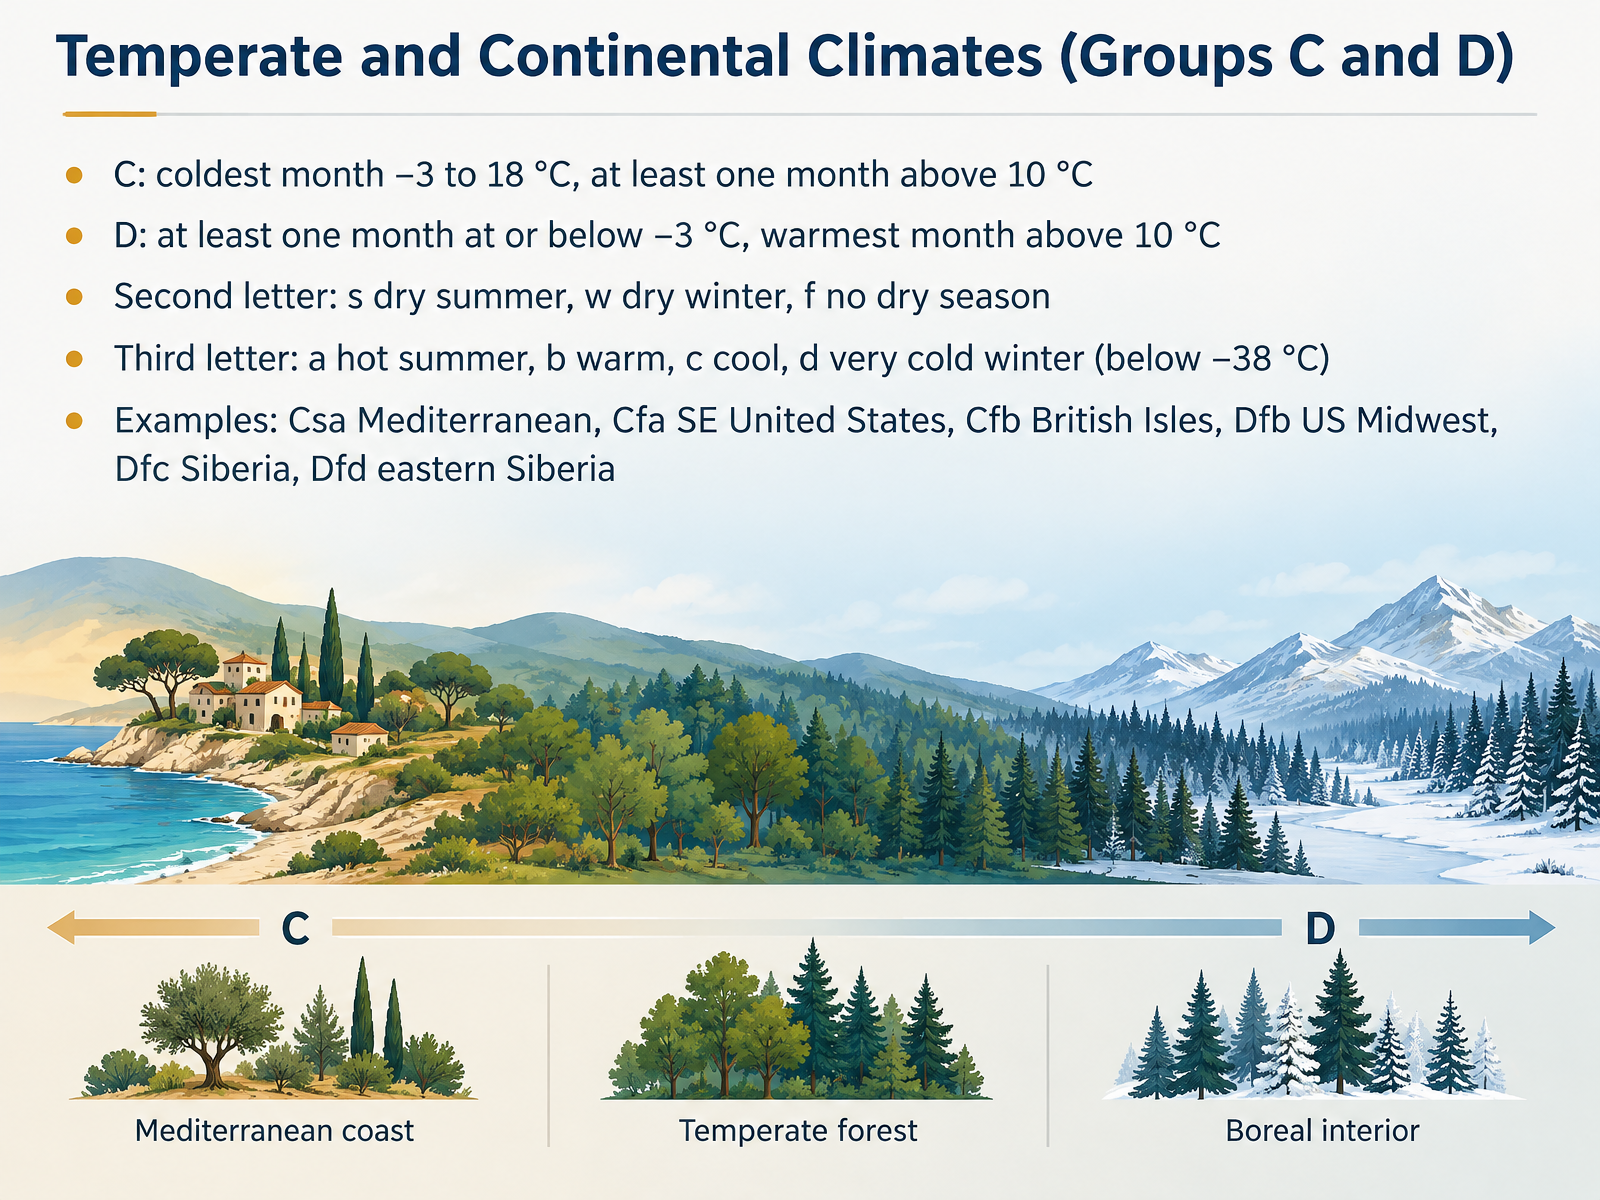
- 07Temperate and Continental Climates (Groups C and D)Now let's look at the temperate and continental climates, Groups C and D. What separates them is winter cold. In Group C, the coldest month stays between minus three and eighteen degrees Celsius, and at least one month rises above ten degrees. In Group D, at least one month falls to minus three degrees or below, while the warmest month still climbs above ten degrees. A second letter describes rainfall seasonality. S means a dry summer, W a dry winter, and F no dry season. A third letter marks summer warmth or winter severity. A means a hot summer, B warm, C cool, and D a very cold winter, with the coldest month below minus thirty-eight degrees. Notice how these letters combine. C s a gives a Mediterranean climate, like around the Mediterranean Sea. C f a describes the southeastern United States. C f b fits the British Isles. D f b matches the US Midwest, D f c Siberia, and D f d eastern Siberia. Next, we move to polar and highland climates, Groups E and H.
 ncert.nic.injuergen-grieser.deen.wikipedia.org2 min
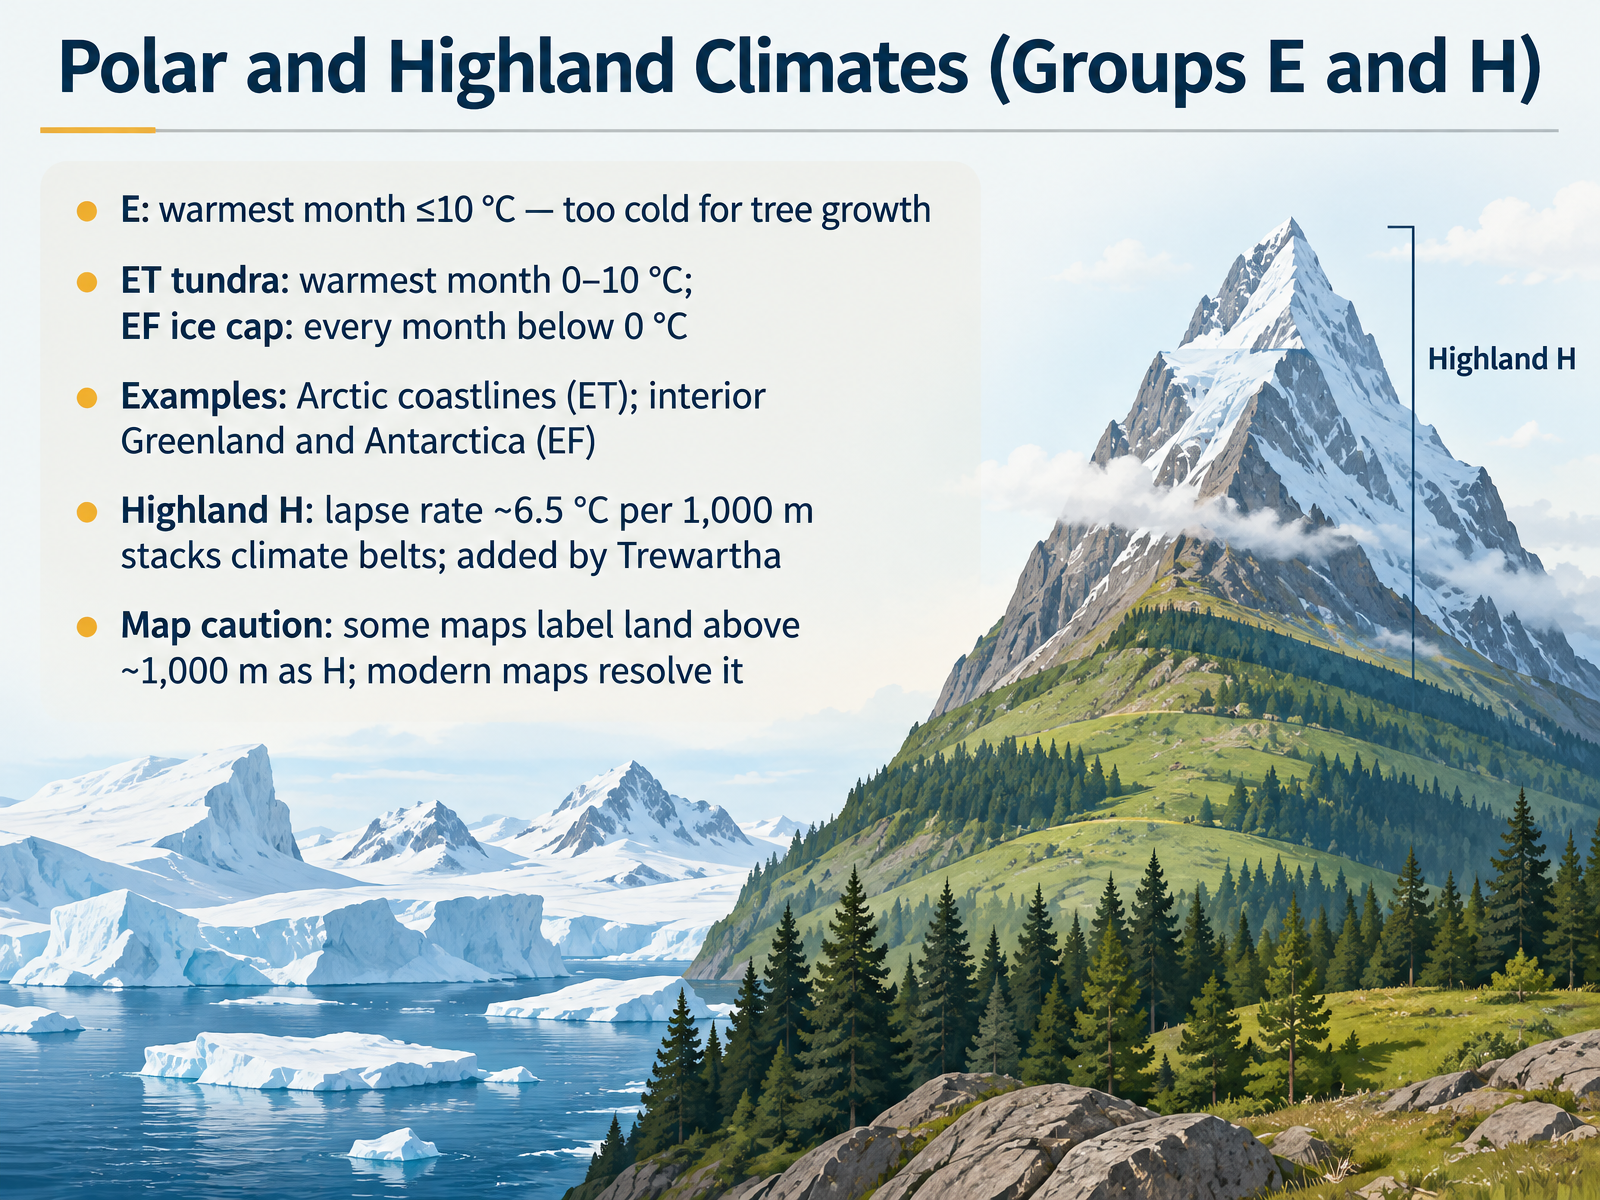
- 08Polar and Highland Climates (Groups E and H)Now we turn to Group E and Group H. A Group E polar climate is one where the warmest month averages no more than ten degrees Celsius. That is too cold for tree growth. Within Group E, the tundra subtype, E T, has a warmest month between zero and ten degrees Celsius. The ice cap subtype, E F, stays below zero degrees in every month. You can picture tundra along Arctic coastlines, and ice cap conditions in the interior of Greenland and Antarctica. Group H, the highland climate, was added by Trewartha. It works because temperature falls with height at the normal lapse rate, about six and a half degrees Celsius per one thousand meters. That stacks climate belts up a mountainside. One map caution: some older maps label any land above roughly one thousand meters as H, while modern maps resolve those areas more carefully. So remember: E is cold enough to exclude trees, and H is about elevation. In the next segment, we will look at reading and interpreting Köppen maps.
 juergen-grieser.denoaa.govnoaa.gov2 min
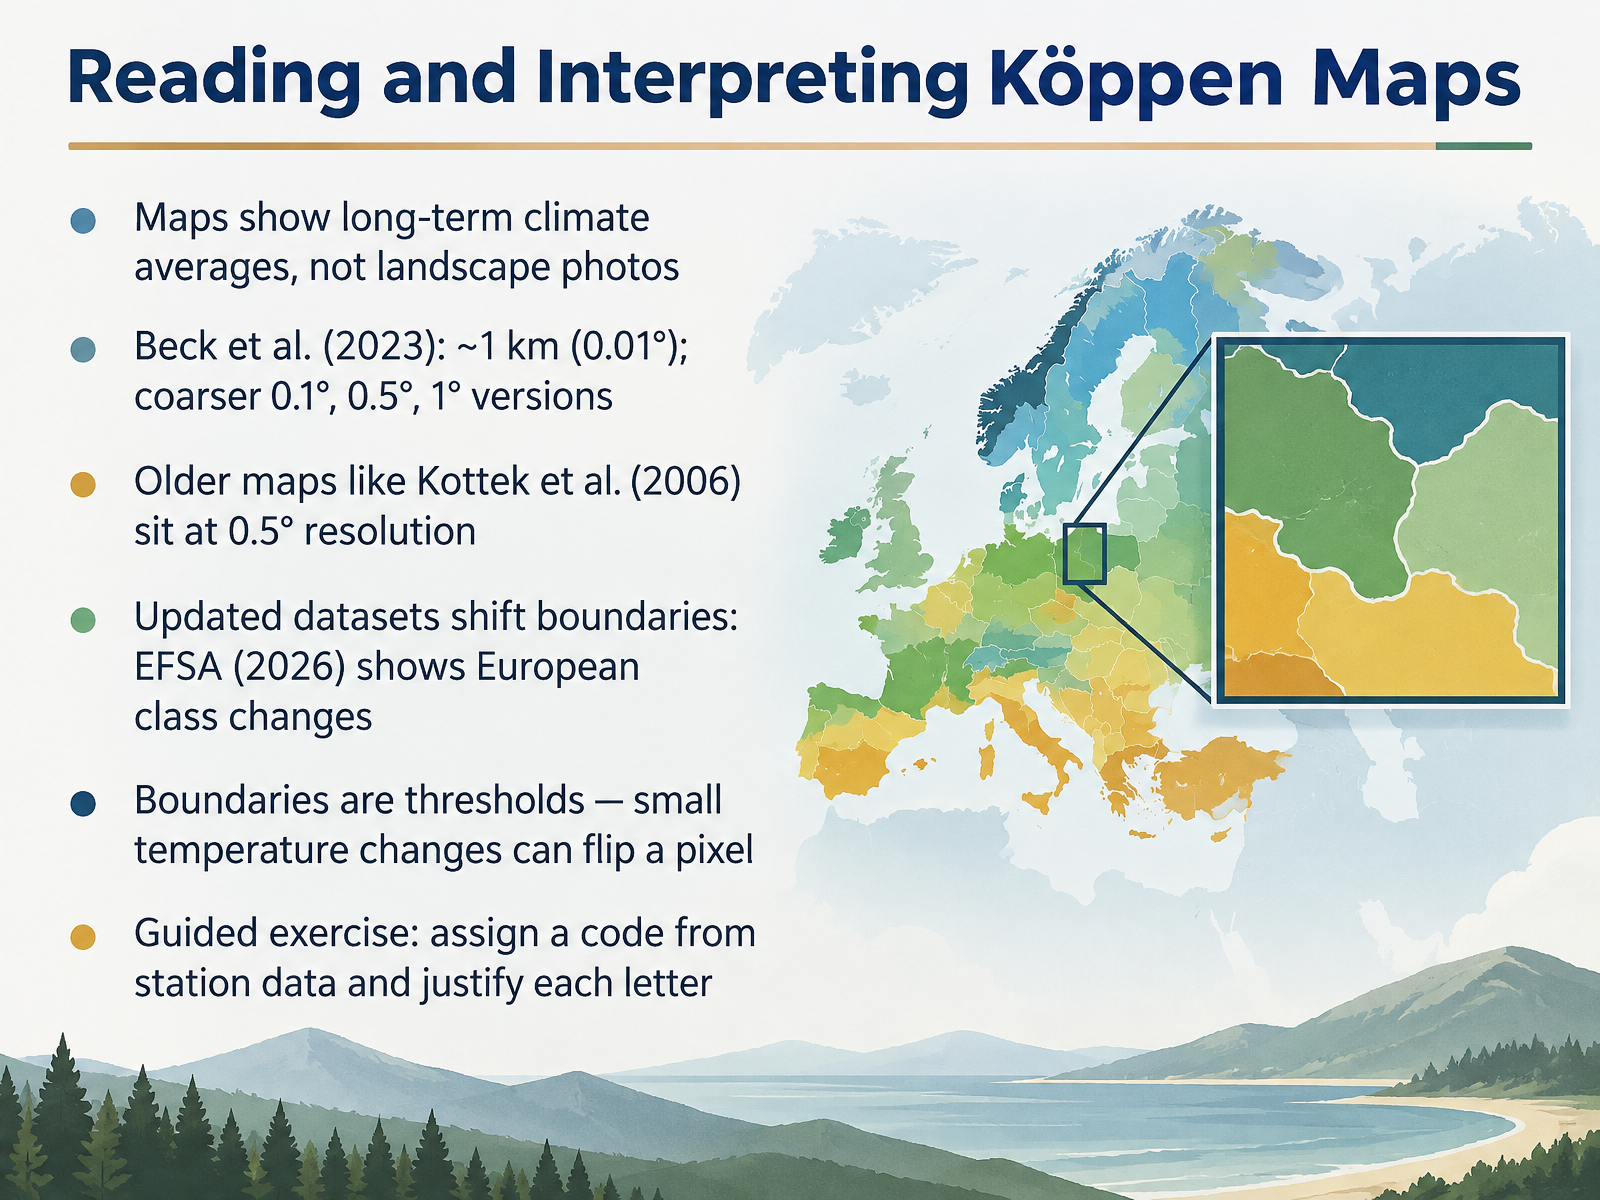
- 09Reading and Interpreting Köppen MapsNow let's look at how to read a Köppen map rather than just look at it. A climate map shows long-term averages of temperature and precipitation, not a landscape photo. The Beck et al. 2023 dataset offers a fine version at about one kilometer, or zero point zero one degrees, plus coarser versions at zero point one, zero point five, and one degree. Older maps, such as Kottek et al. 2006, sit at zero point five degrees, roughly fifty-six kilometers at the equator. Updated datasets can shift boundaries. For example, the 2026 EFSA update shows European class changes. Here is the key idea. Boundaries are thresholds, so a small temperature change can flip a single pixel from one class to another. So practice this: given station data, assign a Köppen code and justify each letter you choose. That exercise builds real map-reading skill, and it leads naturally into the next step, using climographs to verify a location's code.
 koeppen-geiger.vu-wien.ac.at1 min
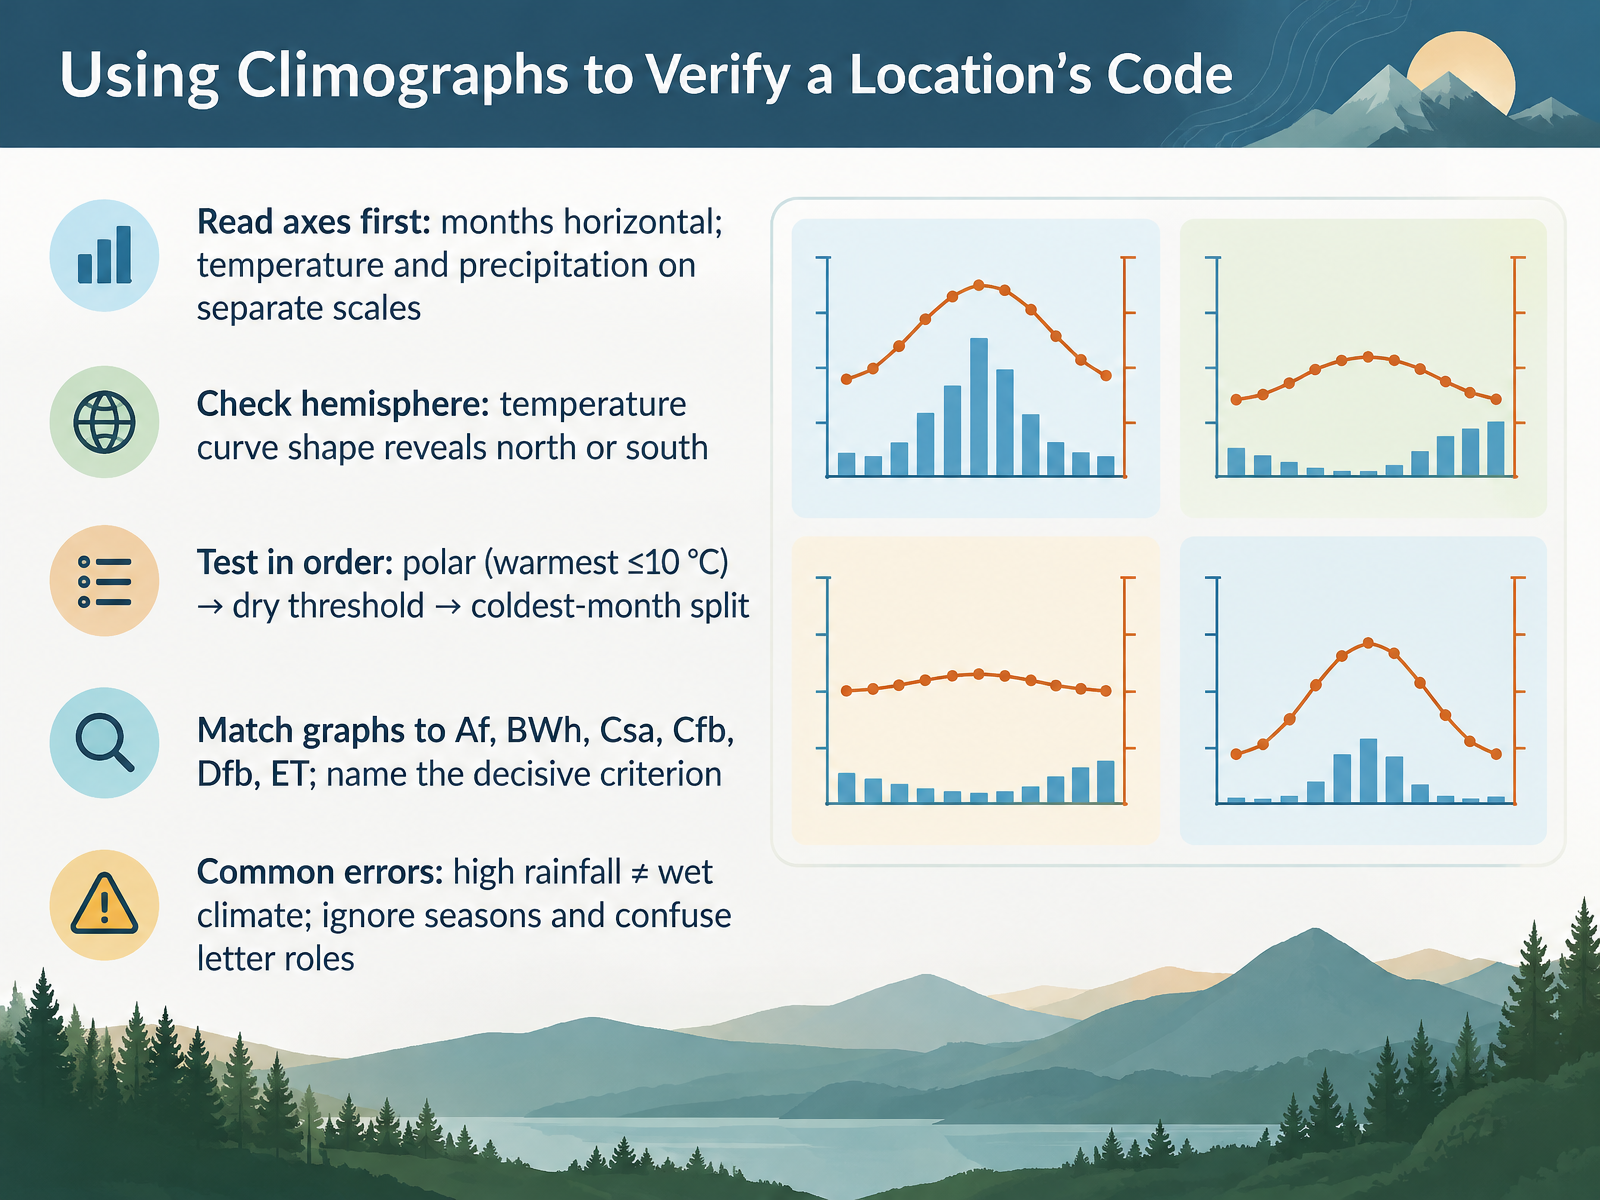
- 10Using Climographs to Verify a Location’s CodeNow let's put those codes to work by reading a climograph, a graph of average monthly temperature and precipitation. Start with the axes. Months run along the horizontal axis, and temperature and precipitation sit on separate scales, so read each curve against its own side. Next, check the hemisphere. The shape of the temperature curve tells you whether you are north or south, because the warm months mark summer. Then test the criteria in order. First, polar: is the warmest month ten degrees Celsius or below? That points to ET, tundra. Second, the dry threshold. Third, the coldest month, which separates C and D climates at minus three degrees. Now match the graph to Af, BWh, Csa, Cfb, Dfb, or ET, and name the decisive criterion out loud. Two warnings. High rainfall does not mean a wet climate, since B group dryness depends on evaporation. And do not ignore seasons or the role of each letter. Let's move on to the teaching sequence for classrooms and nature education.
 noaa.govglobe.govpressbooks.bccampus.ca+22 min
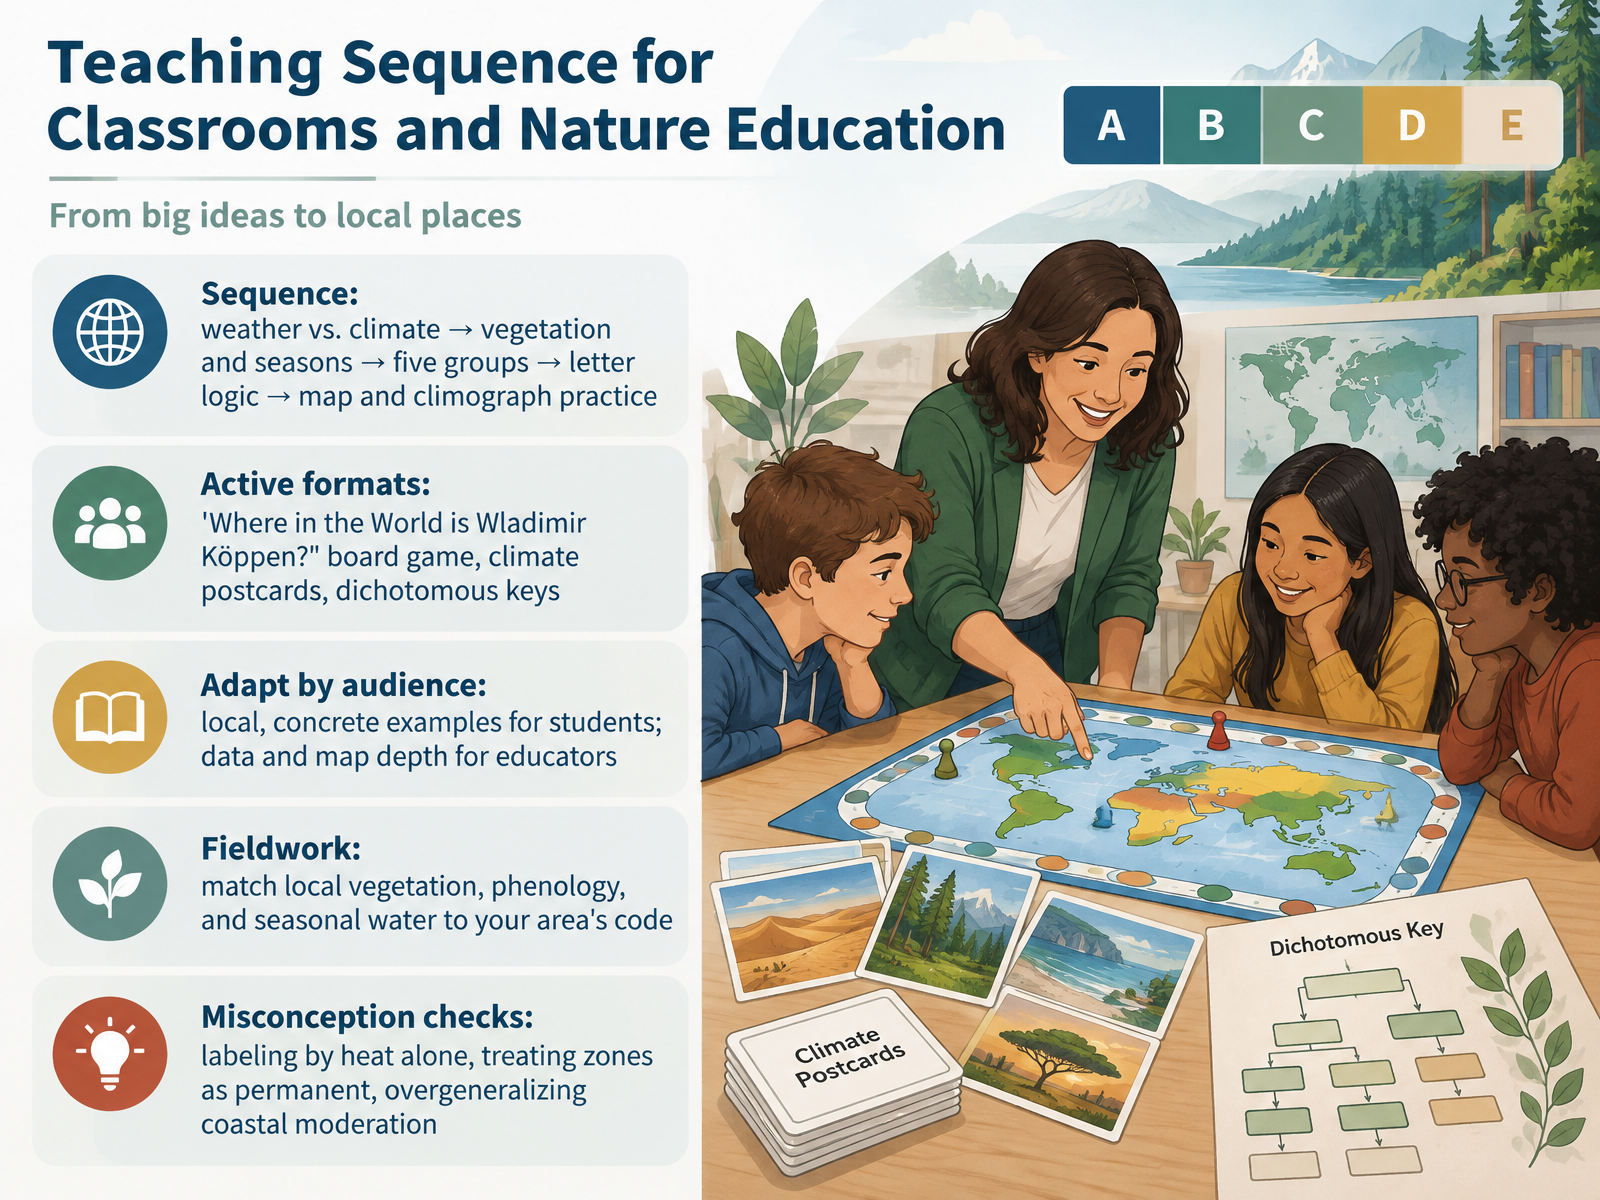
- 11Teaching Sequence for Classrooms and Nature EducationNow let's turn this into a teaching sequence you can actually use. Start with weather versus climate, then vegetation and seasons, then the five main groups, then letter logic, and finally map and climograph practice. For active formats, try the board game Where in the World is Wladimir Köppen, where students read climographs to find clues. Climate postcards work well, too. So do dichotomous keys that walk students through the letters step by step. Adapt by audience. For students, use local, concrete examples. For educators, go deeper into data and map interpretation. In fieldwork, match local vegetation, phenology, and seasonal water to your area's code. And check common misconceptions: labeling by heat alone, treating zones as permanent, and overgeneralizing coastal moderation. That gives you a practical classroom sequence and a fieldwork routine. Next, we look at limitations and a changing climate.
 2 min
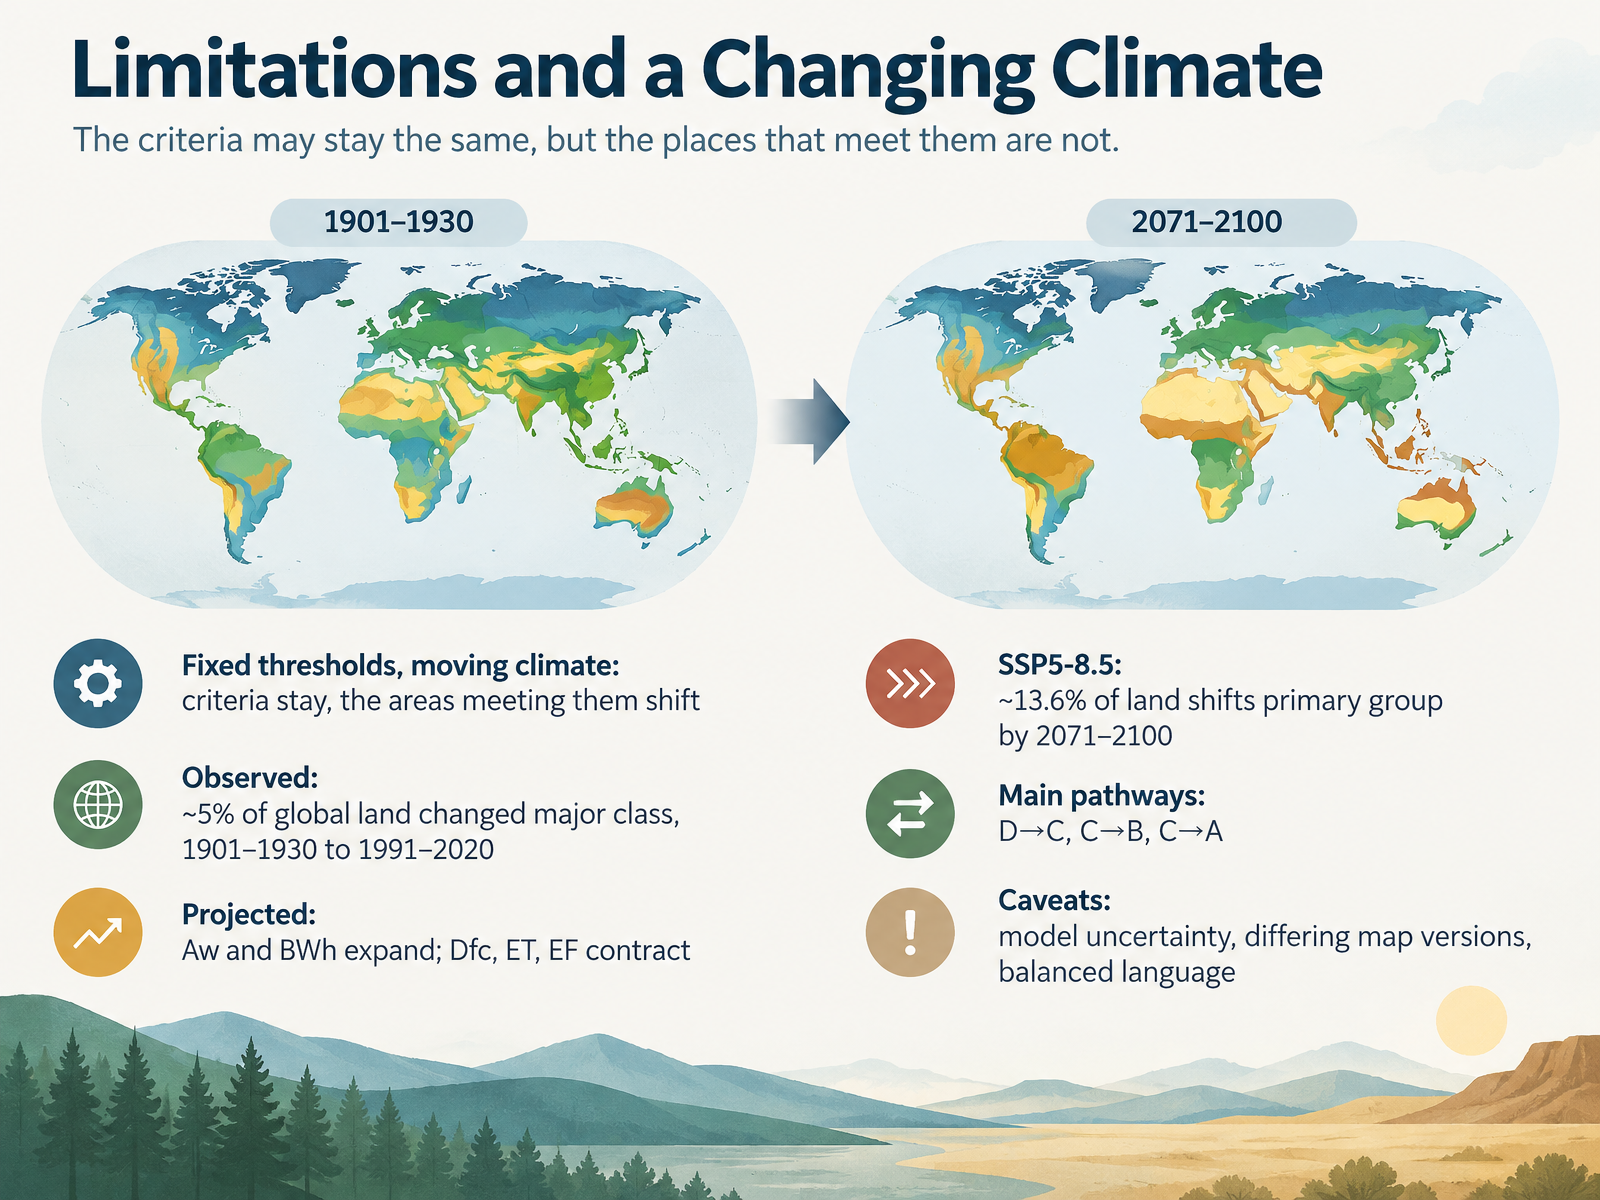
- 12Limitations and a Changing ClimateLet's close with an honest look at the limits of the Köppen system. The criteria themselves stay fixed, but the climates beneath them move. So the thresholds do not change; the places that meet them do. What has actually been observed? Between the early twentieth century and the recent period from 1991 to 2020, roughly five percent of global land shifted to a different major class. Projections extend that trend. Tropical savanna and hot desert climates are expected to expand, while subarctic, tundra, and ice cap climates contract. Under the high-emissions scenario, about 13.6 percent of land shifts primary group by 2071 to 2100. Most of that follows three pathways: continental to temperate, temperate to arid, and temperate to tropical. Now, the caveats. Model uncertainty is real, and different map versions place boundaries differently, so use balanced language. Keep those points in mind as we turn to applying Köppen in conservation, agriculture, and education.
 koppen.earthweather.metoffice.gov.uken.wikipedia.org+22 min
- 13Applying Köppen in Conservation, Agriculture, and EducationLet's turn now to how Köppen classes are actually used. In conservation, climate classes help frame species distribution, vegetation mapping, and habitat suitability. In agriculture, the codes guide crop suitability, growing-season length, and frost risk. In practice, two details are especially useful: the boundary between the temperate C and continental D groups, and the third letter, which describes heat. For education, organize lessons around the codes, and link each letter to something your students can observe, like a warm summer or a dry season. And plan for change. Compare a baseline map with a projected map rather than treating boundaries as fixed. As a case study, choose a local ecosystem and explain what its code tells you about managing it. Next, we'll move into review and assessment.
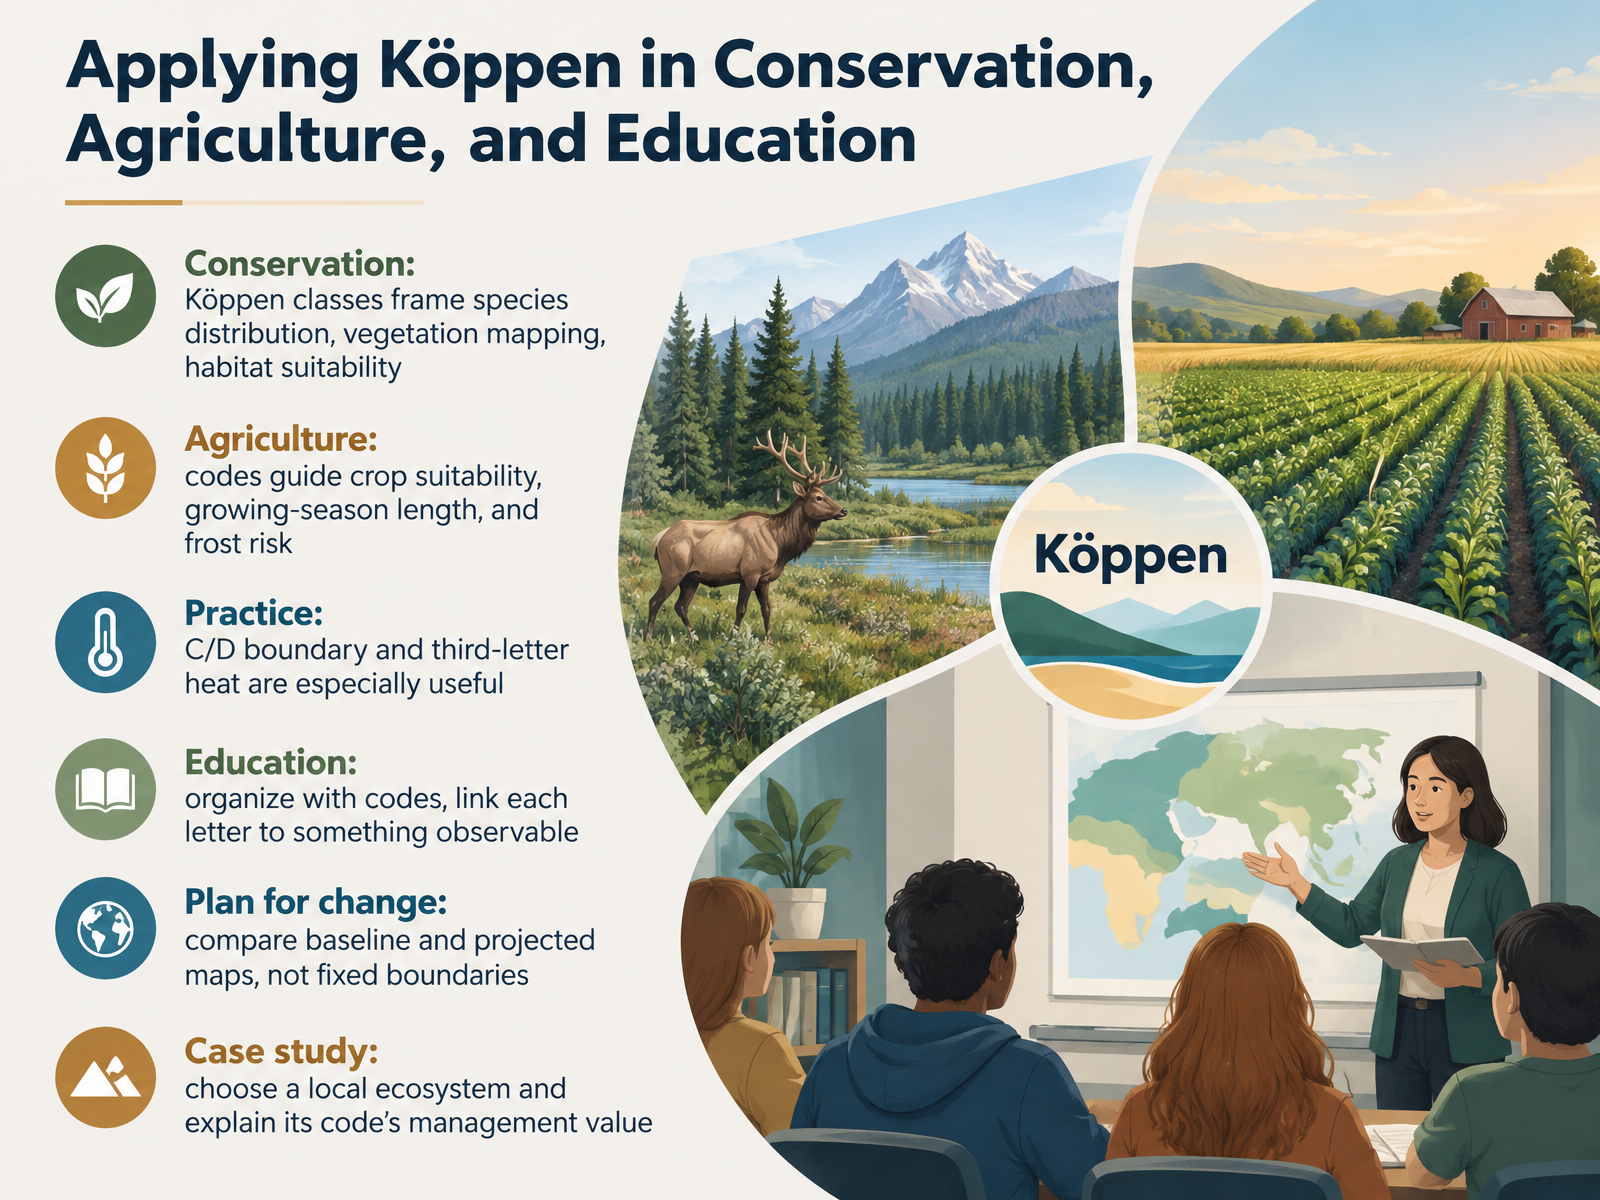 koppen.earthweather.metoffice.gov.uken.wikipedia.org+21 min
- 14Review and AssessmentLet's close by reviewing the arc of this course. We began with the origins of the Köppen system, moved to the three-letter code, then worked through groups A through E, plus the highland H category. Now check yourself: can you decode five codes and justify the decisive criterion behind each one? Can you match codes to stations, regions, and climographs? Then discuss how you would teach one group using a local example. For reference, the GloH2O maps by Beck and colleagues, published in 2023, offer one-kilometer resolution; Kottek and colleagues from 2006 provide an earlier standard; and the Met Office and NOAA both publish clear explainers. Thank you for working through this material with me. Keep observing the climates around you, and keep asking which criterion decides each classification.
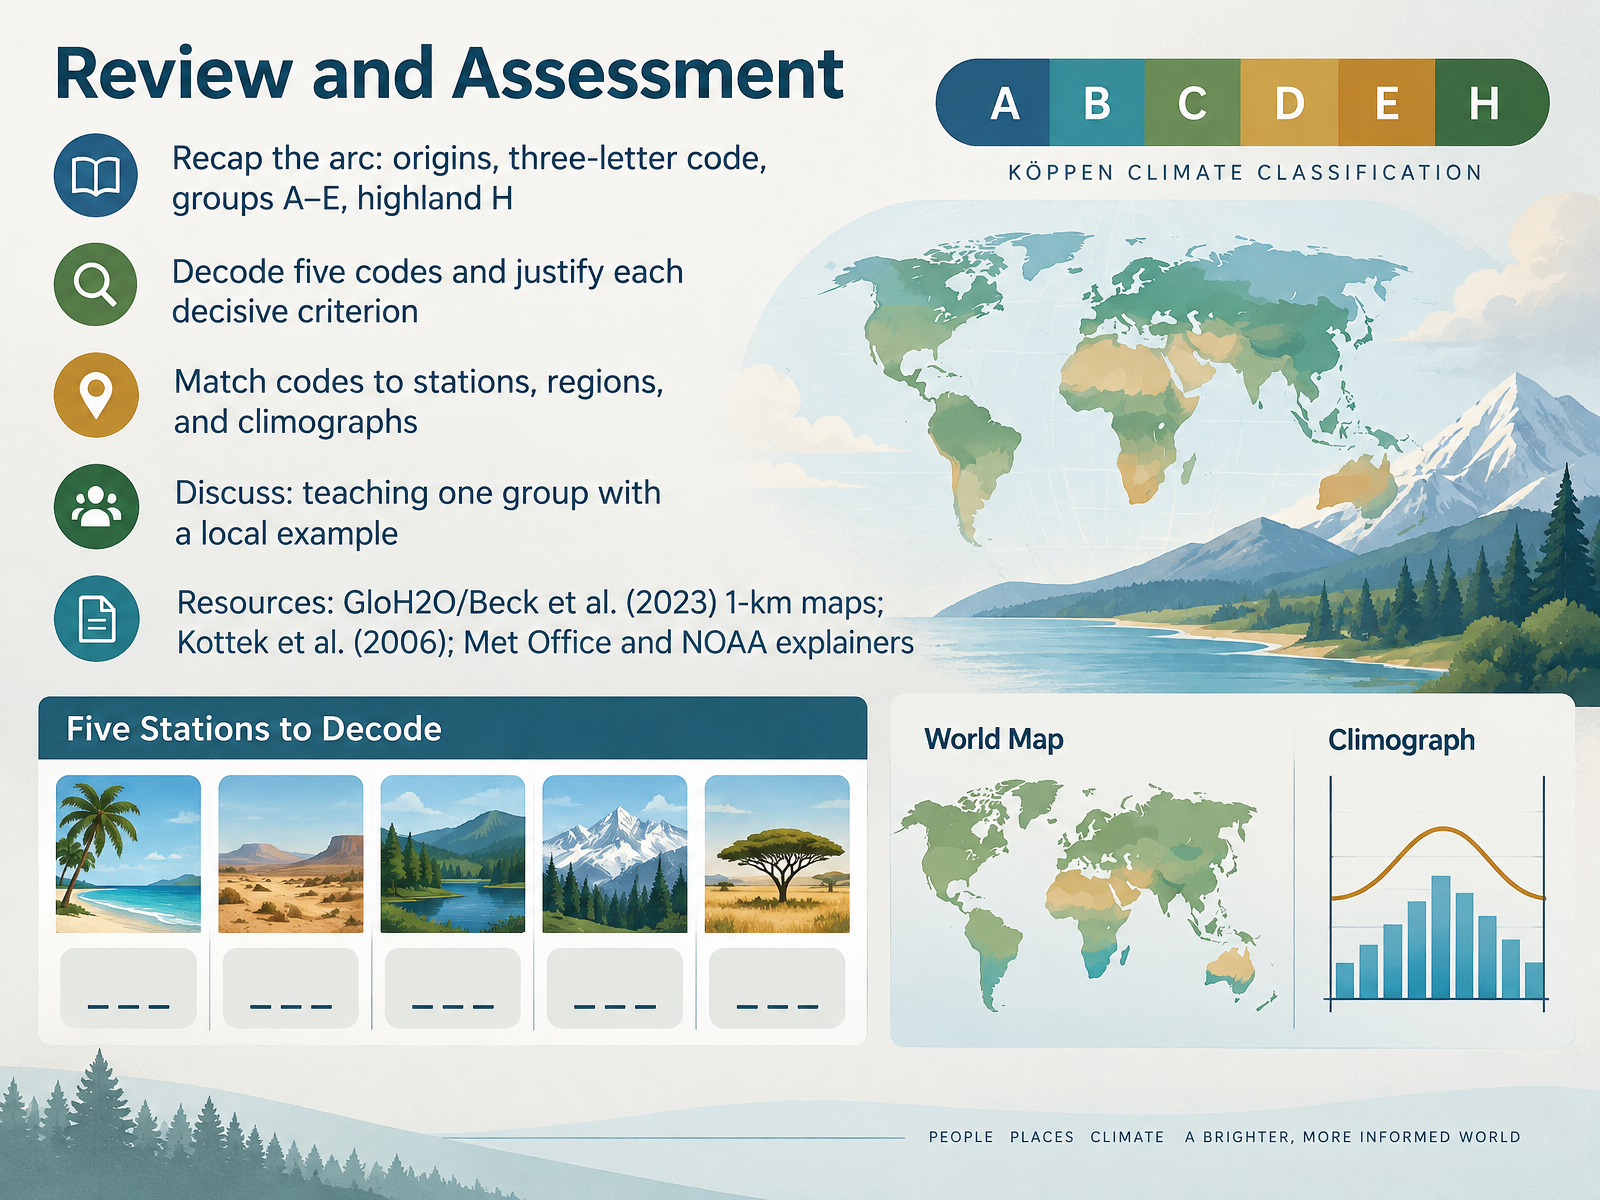 koppen.earthweather.metoffice.gov.uken.wikipedia.org+21 min
Take the deck with you
Download this course as a file — free, no sign-up needed.
- PDF handoutEvery slide page, ready to print or share.15 pages · 4.5 MBDownload
- Narrated PowerPointThe deck that presents itself — every slide carries the digital human's narration video.15 pages · 15.2 MBDownload
- PowerPoint slidesThe full deck as a .pptx — open it in PowerPoint, Keynote, or Google Slides.15 pages · 4.5 MBDownload
Free to use in your own training — please keep the PersonWise credit page at the end.
Have your own deck? Turn it into a course
Sources consulted
Web sources consulted while building this course.
- Köppen Climate Explorer — koppen.earth
- Climate zones - Met Office — weather.metoffice.gov.uk
- Köppen climate classification — en.wikipedia.org
- World Maps of Köppen-Geiger climate classification — koeppen-geiger.vu-wien.ac.at
- Climate Zones | National Oceanic and Atmospheric Administration — noaa.gov
- World Maps of Köppen-Geiger climate classification — koeppen-geiger.vu-wien.ac.at
- Comments on: “The thermal zones of the Earth” by Wladimir Koppen (1884) ¨ — koeppen-geiger.vu-wien.ac.at
- KOPPEN’S CLIMATIC CLASSIFICATION – Climatology — ebooks.inflibnet.ac.in
- World Maps of Köppen-Geiger climate classification — koeppen-geiger.vu-wien.ac.at
- JetStream Max: Addition Köppen-Geiger Climate Subdivisions | National Oceanic and Atmospheric Administration — noaa.gov
- Köppen-Geiger Climate Classification — globe.gov
- Lab 5 Koppen Classification Guide — pressbooks.bccampus.ca
- Appendix 1 — fs.usda.gov
- Köppen Climate Classification - FLUXNET — fluxnet.org
- Appendix C: Koppen Geiger Classification Descriptions – Permaculture Design: Tools for Climate Resilience — open.oregonstate.education
- Short Tabular Presentation of Koeppen Classes — juergen-grieser.de
- Semi-arid climate — en.wikipedia.org
- Table 1 Overview of the Köppen-Geiger climate classes including the defining criteria. — npg.nature.com
- A note on the classification of dry climates in the Koppen system — scholarworks.calstate.edu
- E:\Textbook\12 Rationalised Textbook\11092 — Fundamental of Physical Geography\1 Source Files\01 Chapters\Chapter-11\chapter-12.pmd — ncert.nic.in