Consumer Analytics Marketing Strategy
Begin
15 pages · ~30 min
Consumer Analytics Marketing Strategy
Learn to leverage consumer analytics to set marketing goals, make strategic choices, and navigate tradeoffs for effective, data-driven decision-making.
What you’ll learn
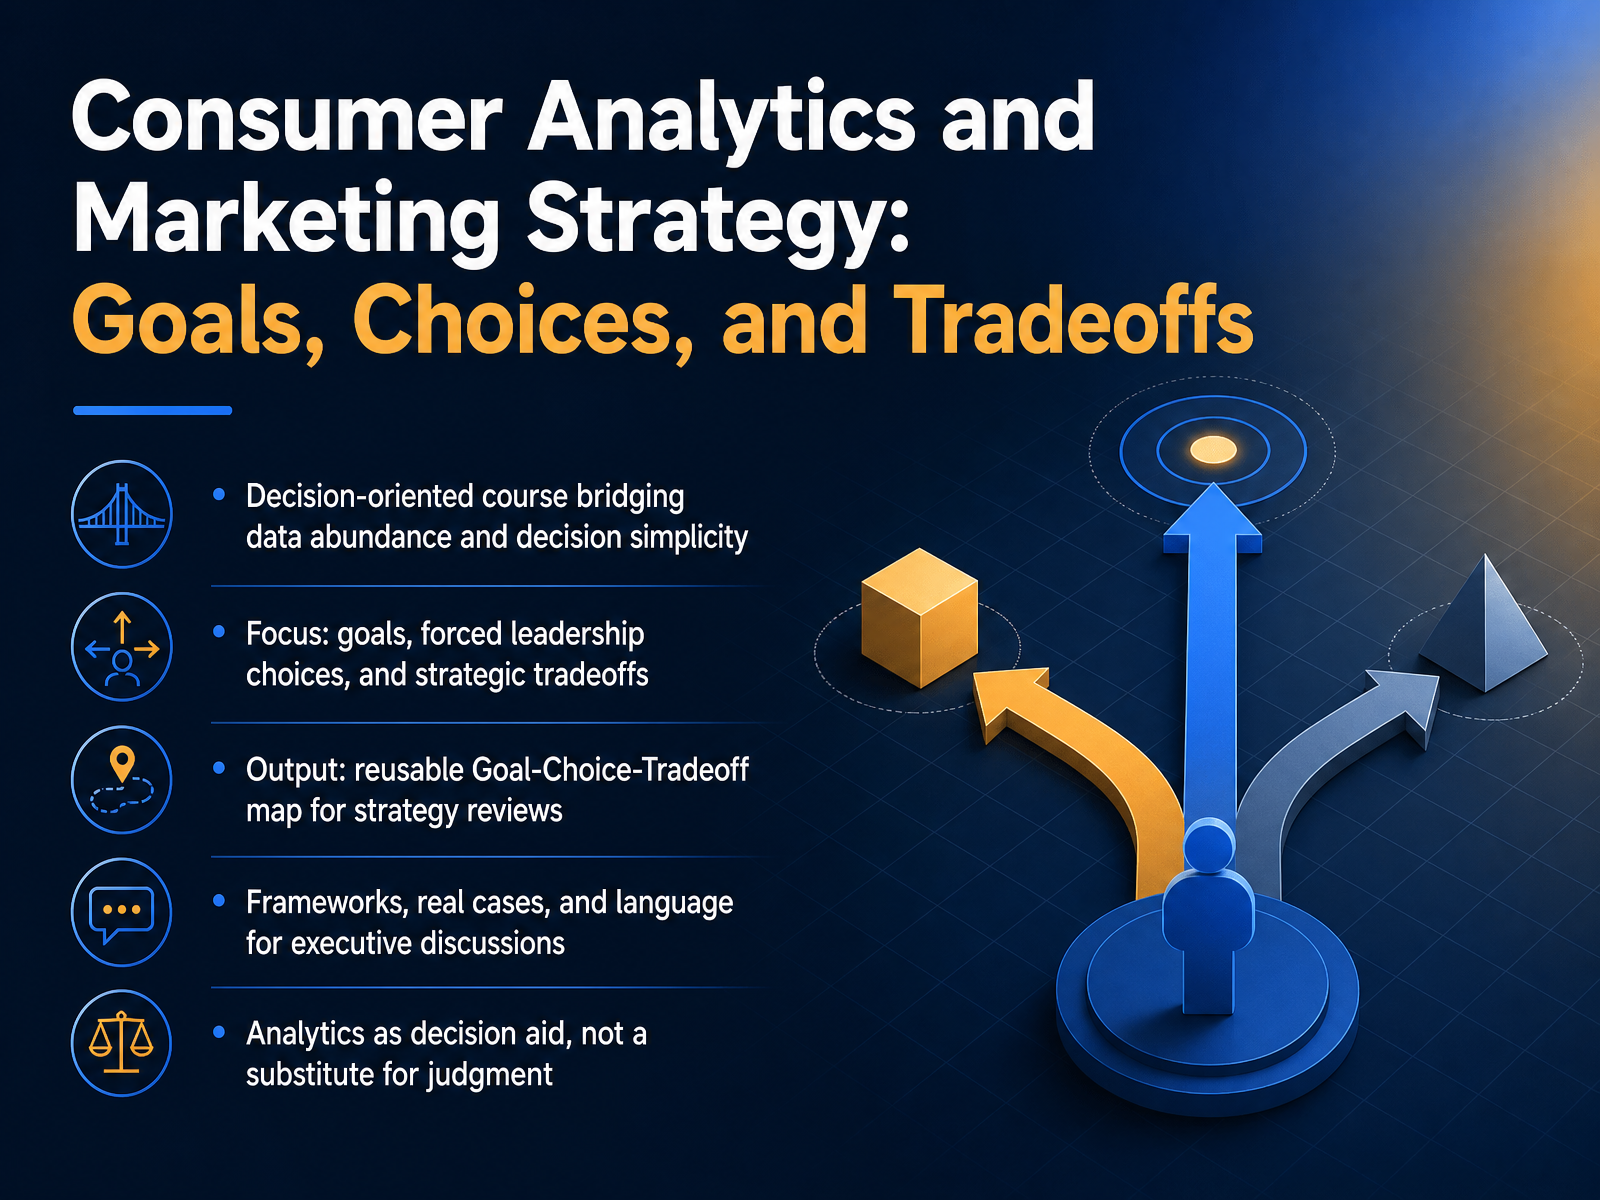
- 01Consumer Analytics and Marketing Strategy: Goals, Choices, and TradeoffsWelcome. In this course, we're going to build a practical bridge between the data your systems already generate and the strategy decisions you and your leadership team have to make. The goal isn't more dashboards. The goal is decision simplicity. We'll work through three things that sit at the center of every serious marketing conversation. First, how to set goals that tie directly to growth, retention, and unit economics like LTV and CAC. Second, how to make forced leadership choices when the data points in more than one direction. And third, how to name the tradeoffs you're accepting when you make those choices. By the end, you'll have a reusable Goal Choice Tradeoff map that you can bring into your own strategy reviews. We'll use real cases, executive-level language, and frameworks you can defend with finance. One thing to be clear about up front: analytics supports judgment. It does not replace it. Next, we'll talk about what analytics can and cannot do.orbitdeck.coorbitdeck.cogaconnector.com+22 min
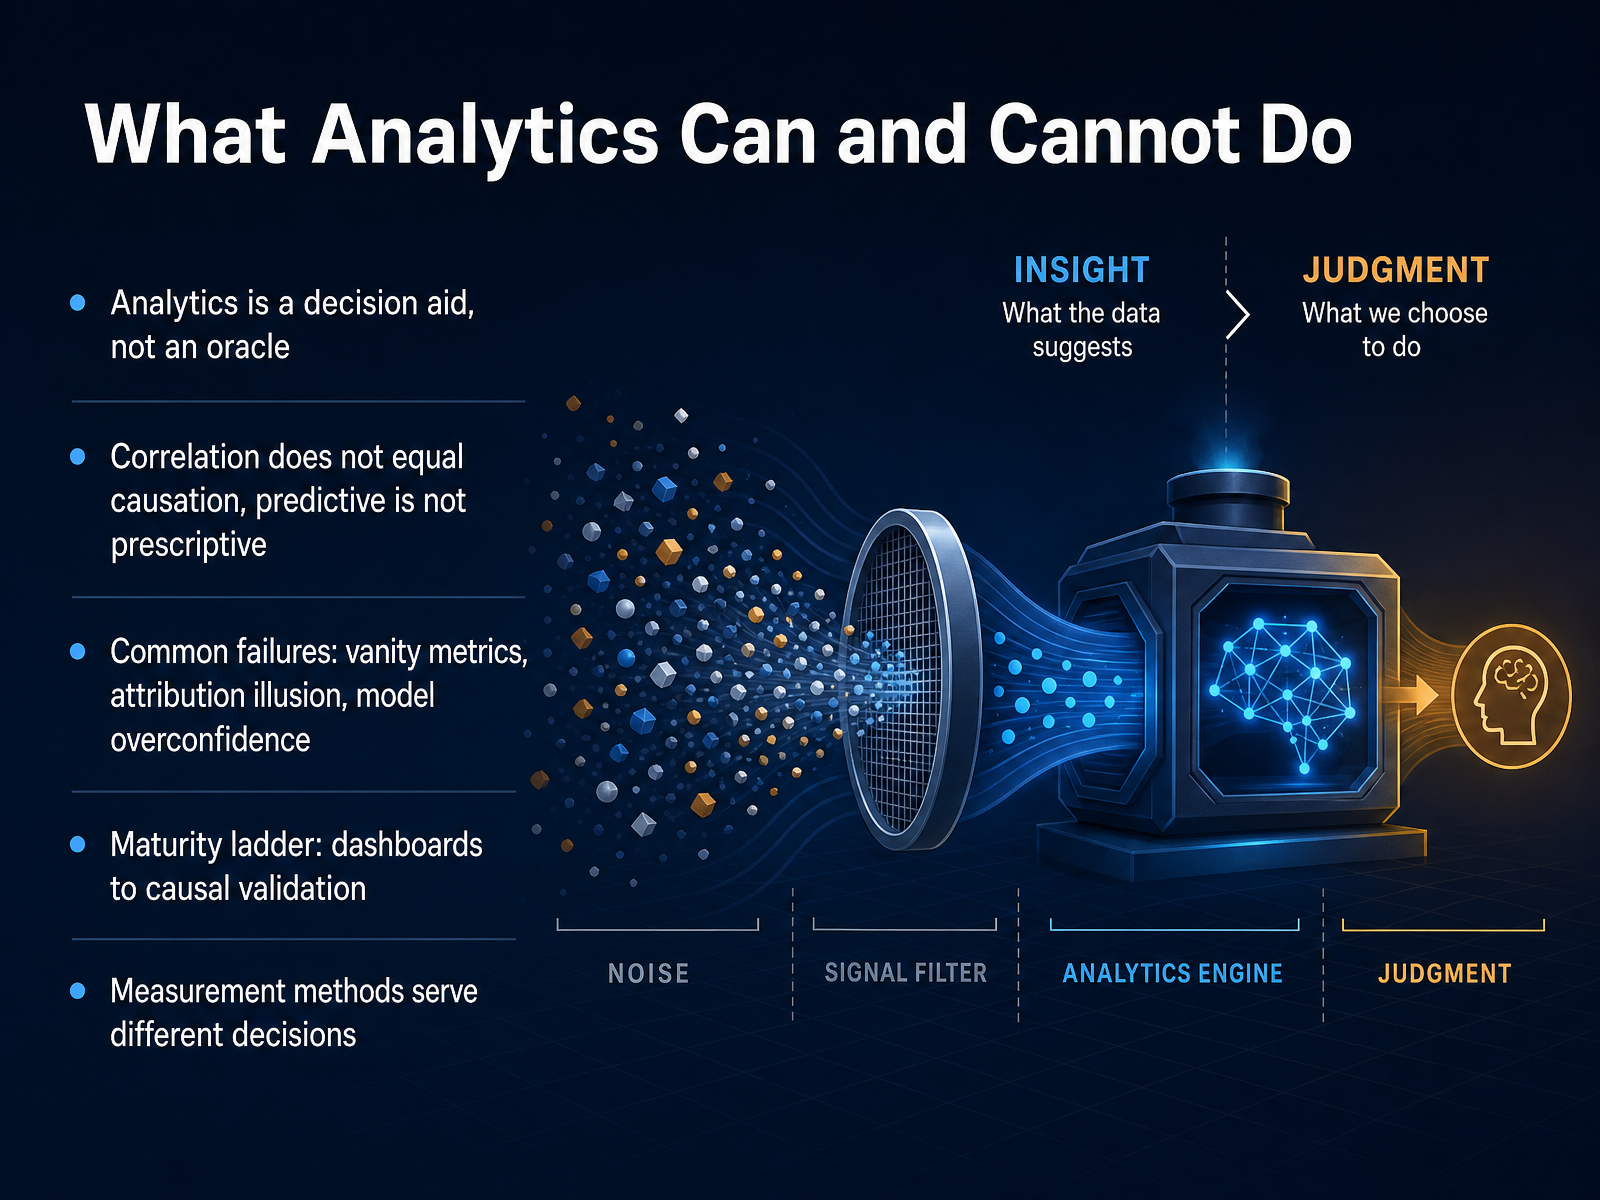
- 02What Analytics Can and Cannot DoSo let's get specific about what analytics can and cannot do for us. Think of it as a decision aid, not an oracle. It narrows uncertainty, but it never removes the need for judgment. The biggest trap is confusing correlation with causation. A data-driven attribution model might tell you a retargeting ad touched nearly every sale. That is a pattern, not proof. Those customers may have bought anyway. Predictive models show what could happen. Prescriptive moves require a causal test. We also need to watch for common failures: vanity metrics that feel good but steer budget poorly, attribution models that over-credit the last click, and overconfidence in models that fit history but fail in market. The maturity path is real. We move from simple dashboards toward causal validation, using tools like geo-holdouts or incrementality tests. Different decisions need different evidence. Attribution helps daily steering. Media mix modeling frames the quarterly budget. Incrementality tests prove whether a channel truly creates demand. Knowing which tool serves which decision is the skill that separates mature teams. So let's build on that and turn to choosing the right goals for growth.
 deepmarketing.itblog.joelrubinson.netpresenc.ai+21 min
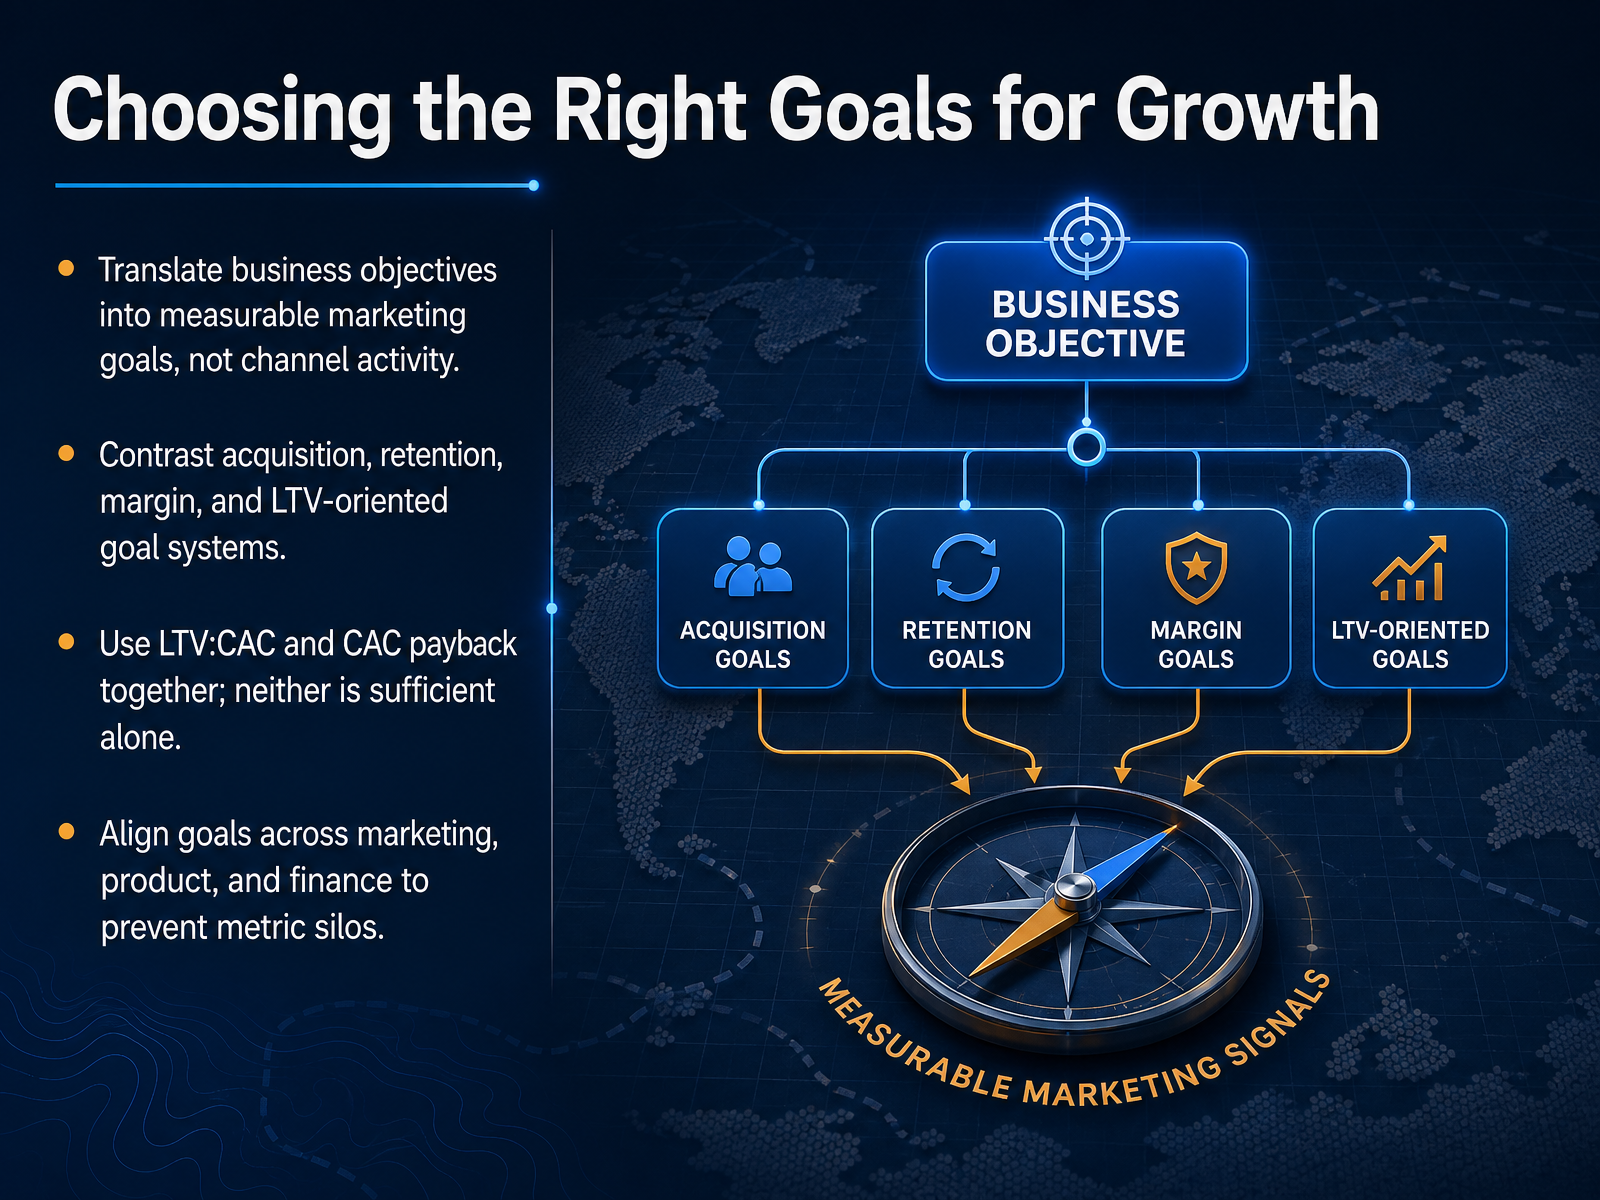
 - 03Choosing the Right Goals for GrowthNow let's turn to choosing the right goals for growth. The first move is to translate your business objective into a measurable marketing goal, not a channel activity count. For example, a goal to increase market share should become a target for new customer acquisition at a specific cost, not just a plan to post more videos. Next, contrast different goal systems. An acquisition-focused system prioritizes volume and cost per new customer. A retention-focused system prioritizes repeat purchase rate or net revenue retention. A margin-focused system prioritizes contribution profit after acquisition costs. And an LTV-oriented system prioritizes the long-term value created per customer. These are not interchangeable, and the right one depends on your current business constraint. When you do use LTV to CAC, never use it alone. Always pair it with CAC payback. A ratio of five to one with a twenty-four month payback is fragile. A ratio of three to one with a six month payback is robust. The joint reading tells a more complete story. Finally, align goals across marketing, product, and finance. If marketing targets acquisition volume but finance holds a strict payback window, you create metric silos. Alignment prevents that friction. That leads us directly to the tradeoff embedded in every metric.
 orbitdeck.coorbitdeck.cogaconnector.com+21 min
 - 04The Tradeoff Embedded in Every MetricLet's get practical about something most dashboards hide. Every metric you report carries a silent cost or an ignored outcome. The number itself is never the full decision. Take LTV to CAC against growth rate. A high ratio says your unit economics are efficient. But if it climbs too high, you are usually underinvesting in scale. You are optimizing for efficiency while sacrificing speed. The pair is what tells you that. Now consider ROAS against incremental profit. Platform reported ROAS often looks strong, but a holdout test may show many of those conversions would have happened anyway. Reported return and actual return are different numbers. One feeds the dashboard, the other feeds the P and L. So when you select metrics, keep a simple tradeoff map next to them. For every metric, ask what it rewards and what it ignores. That one habit prevents most of the bad budget decisions I see. Next, we will move from choosing metrics to choosing data, specifically what to collect and what to ignore.
 orbitdeck.coorbitdeck.cogaconnector.com+21 min
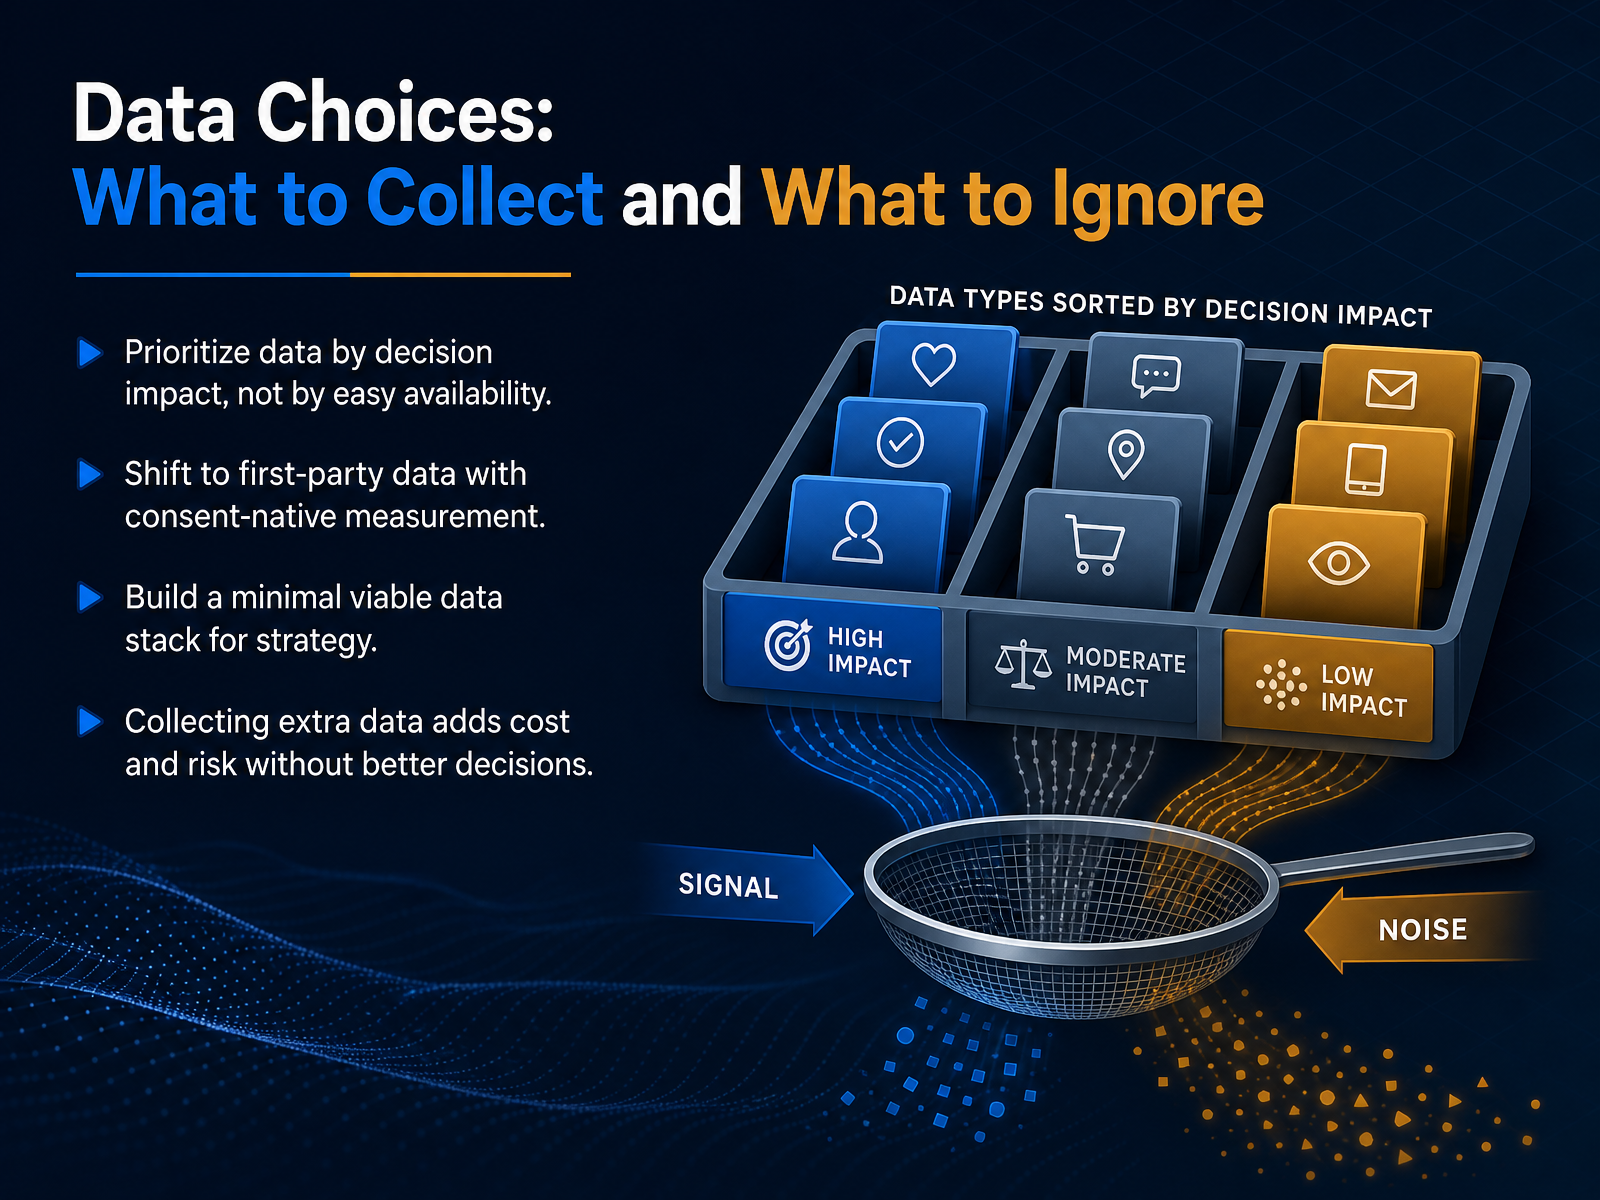
 - 05Data Choices: What to Collect and What to IgnoreLet's talk about data choices, specifically what to collect and what to ignore. The core principle is this: prioritize data by its decision impact, not by how easy it is to get. Every additional field you collect adds cost, storage burden, and legal risk without necessarily leading to a better decision. So, we need to be explicit about the tradeoff. Instead of chasing volume, we should shift our focus to first-party data. This means building a measurement approach that is consent-native from the start. We collect directly from customers through interactions like purchases or account sign-ups, which gives us higher-quality, durable signals that third-party cookies simply can't provide anymore. Practically, that means building what we call a minimal viable data stack. We don't need every tool in the market. We need just enough infrastructure to capture identity, consent, and the specific behavioral events that inform our strategy. This keeps us agile and prevents us from drowning in noise. So, the takeaway is simple: collecting extra data is a liability. The goal isn't to have the most data; it's to have the minimum data necessary to make the right choice. Now, once we have the right signals, we need to turn them into something meaningful. Let's move on to how we progress from consumer signals to strategy hypotheses.
 paypal.comstackmatix.comiabtechlab.com+21 min
 - 06From Consumer Signals to Strategy HypothesesLet's turn raw consumer signals into strategy hypotheses we can actually defend. The core discipline here is separating what we're seeing from what we can act on. A behavioral spike is correlation. A lever we can control is cause. Ask yourself, if we see a rise in engagement from a new segment, do we know what would change if we invested behind it? If not, it is not a strategy yet. Use segmentation and cohort analysis to convert signals into moves. Look at acquisition month, channel, and first product. That is where the real signal lives. Before acting, judge three things. Signal strength, meaning confidence in the pattern. Recency, meaning whether the context still holds. And actionability, meaning whether we can operationalize it without breaking unit economics. Weak, stale, or non-actionable signals should be parked, not scaled. Parking is a decision, not a delay. That brings us to the next tradeoff: growth, profit, and brand, and how the core portfolio choices interact.
 orbitdeck.coorbitdeck.cogaconnector.com+21 min
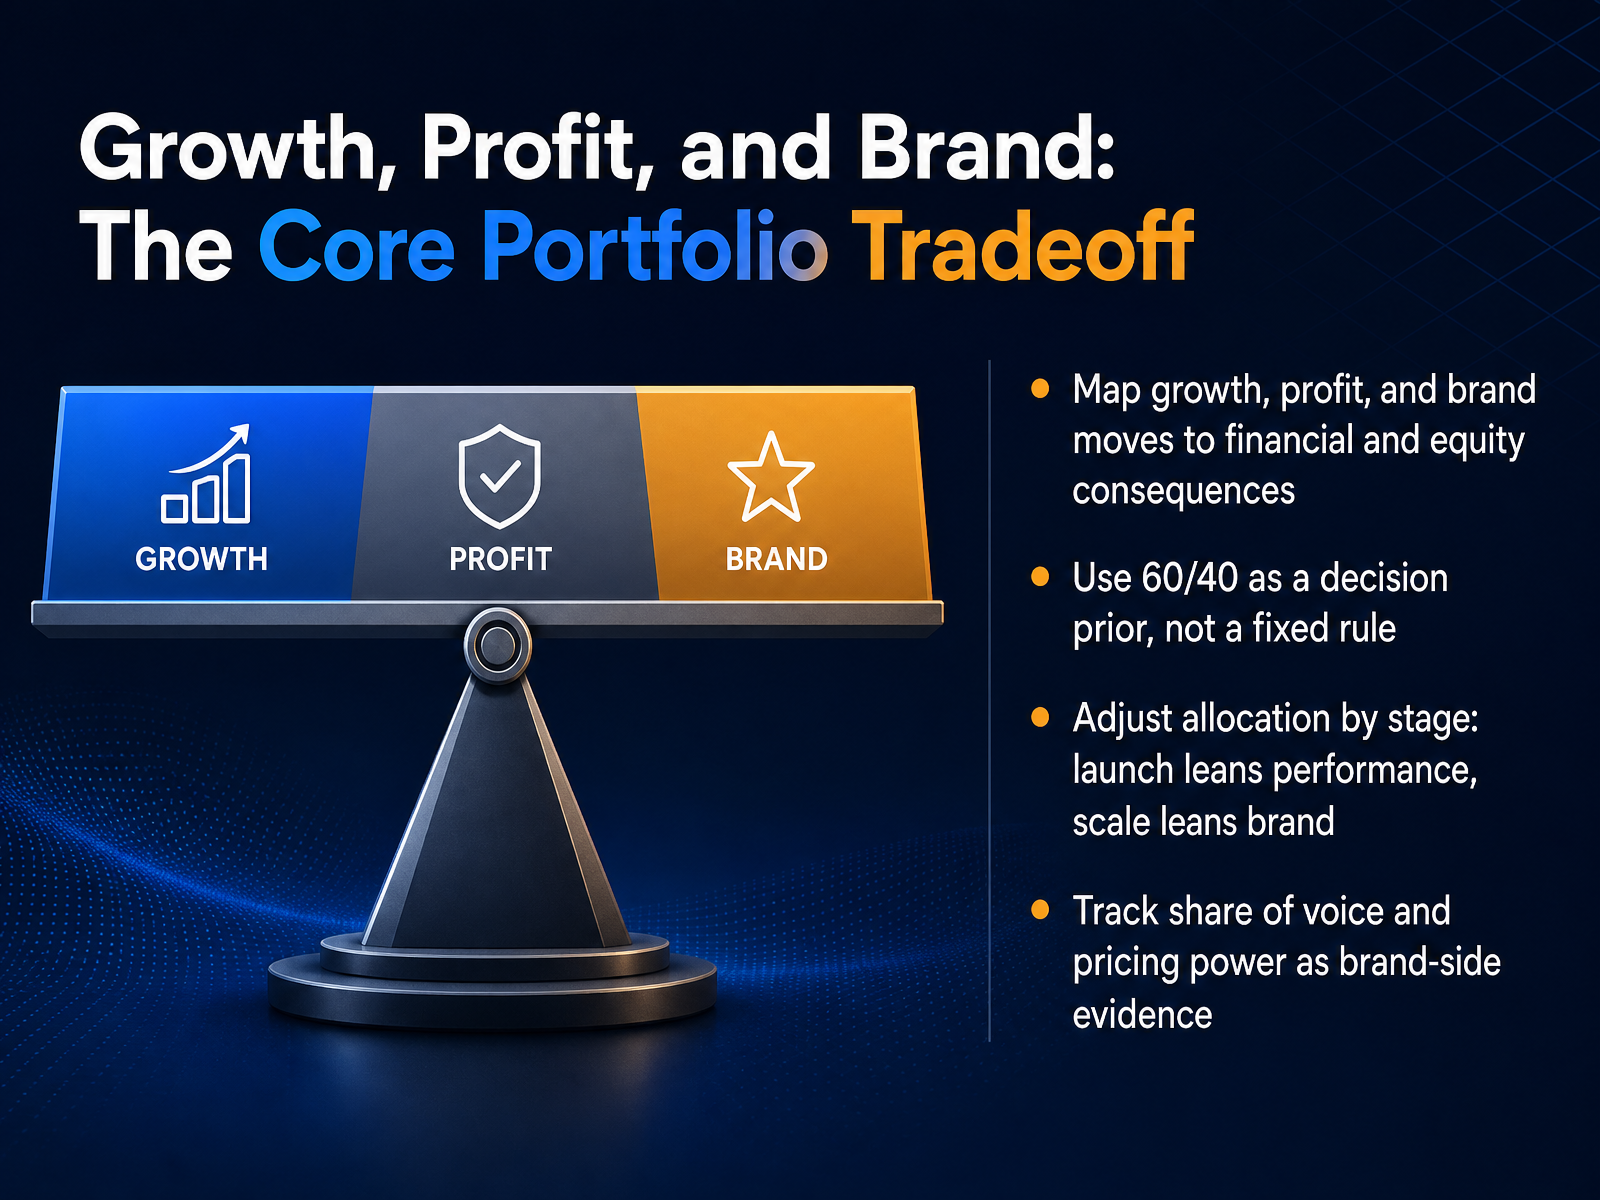
 - 07Growth, Profit, and Brand: The Core Portfolio TradeoffLet's map this directly to the portfolio you manage. Growth, profit, and brand aren't separate strategies; they are competing claims on the same budget, and each move creates a different financial consequence. Performance spend captures demand that already exists. It funds this quarter's revenue, but it rarely builds pricing power. Brand spend creates future demand. It trades near-term attribution for lower acquisition cost and stronger margin over time. The classic sixty forty split is a useful starting prior, but it is not a fixed rule. During launch, you may justifiably run eighty twenty in favor of performance because you need volume and learning now. But as you scale, that ratio should shift toward brand building, or you end up paying more to harvest an audience that is not growing. The two metrics I want you watching on the brand side are share of voice and pricing power. If your share of voice is positive relative to market share, you are investing in growth. If your pricing power improves, your brand equity is doing its job. Let's look next at how we measure those choices when the data is less certain.
 brandfinance.comdeepmarketing.itemarketer.com+21 min
 - 08Measurement Choices Under UncertaintyHere's the core shift. We're not choosing one measurement method. We're choosing the right instrument for the decision in front of us. If we're steering day to day, attribution gives us speed. It's biased, but it's the only thing fast enough to feed platform optimization. So we use it, and we discount it. If we're validating whether a channel actually causes lift, attribution cannot answer that. We need incrementality testing. A clean holdout tells us what would have happened anyway. That's our referee. And if we're setting portfolio boundaries, how much total spend, how to split across channels, that's MMM. It's slower and coarser, but it sees brand and offline effects that attribution misses. The real discipline is calibration. We let fresh incrementality results reweight attribution and MMM. We also weigh model complexity against whether stakeholders can explain it. A sophisticated black box no one trusts is useless. Finally, accept uncertainty. We act on confidence ranges and guardrails, not false precision. That's the setup for the next part: reading metrics in pairs, as a decision workshop.
 deepmarketing.itblog.joelrubinson.netpresenc.ai+22 min
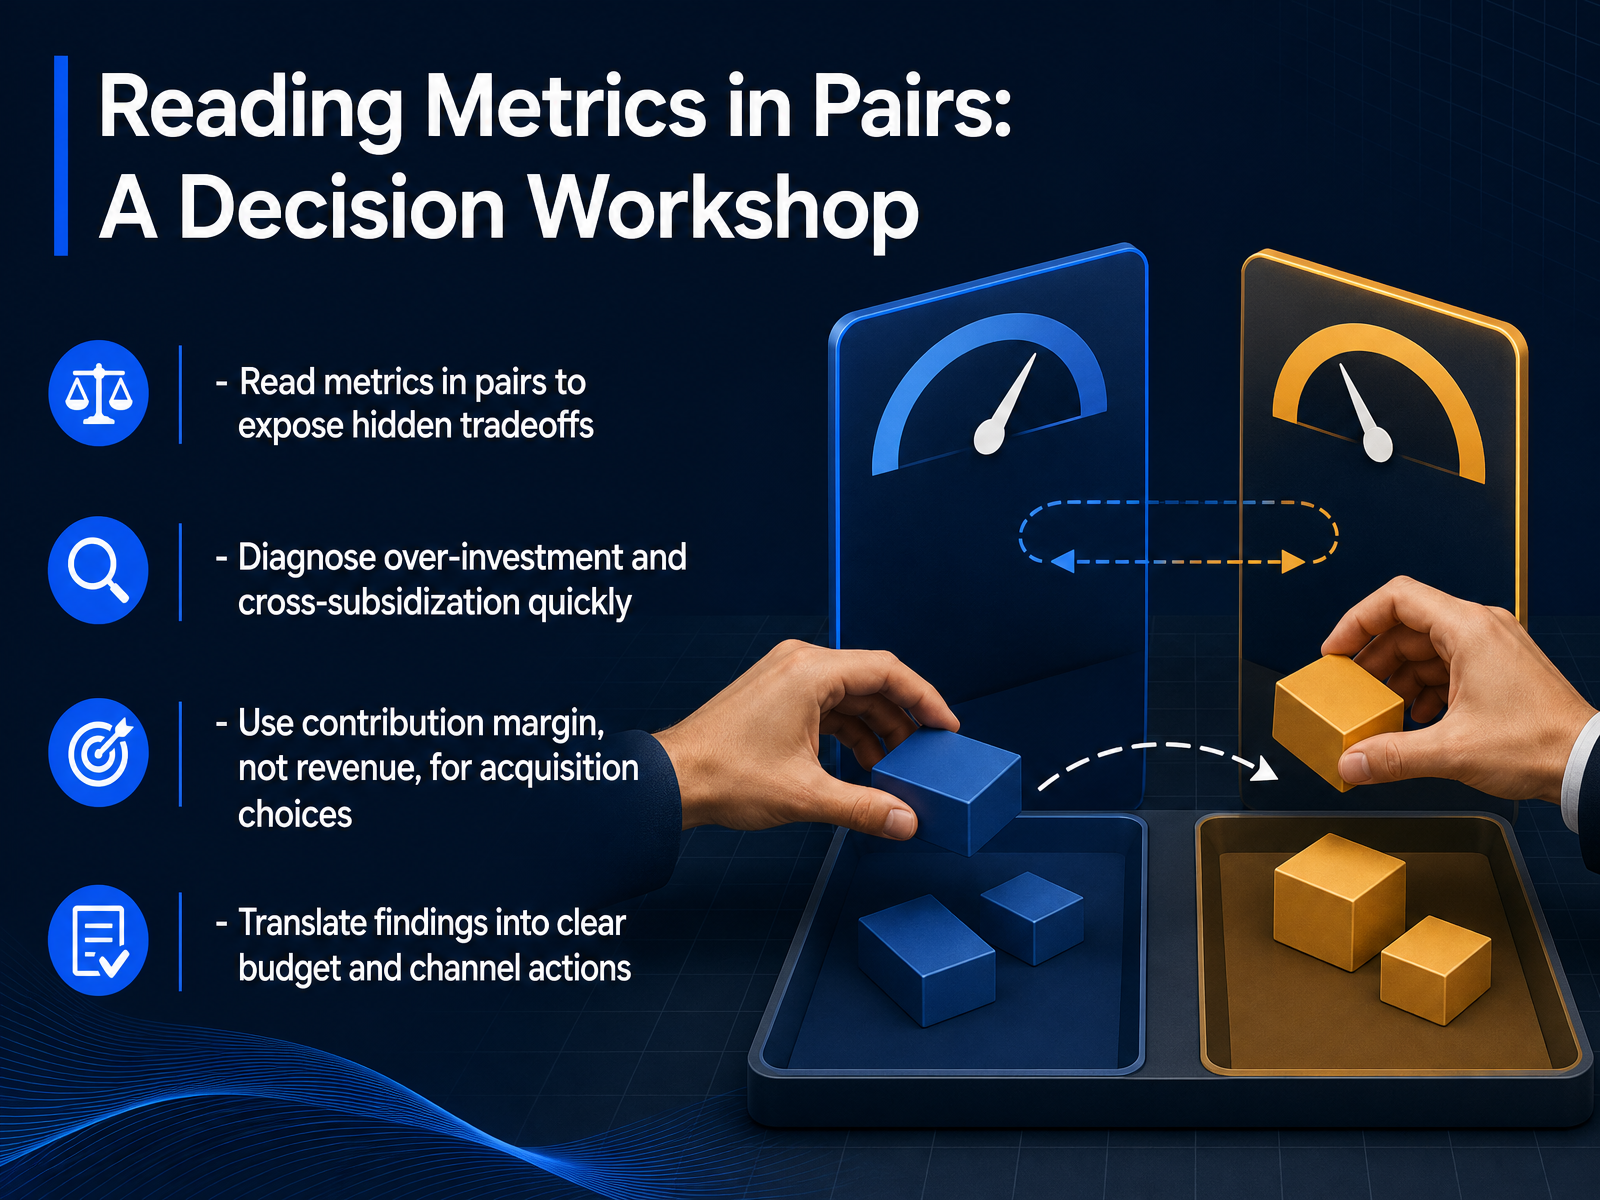
 - 09Reading Metrics in Pairs: A Decision WorkshopNow let's turn this into a working decision exercise. When we read metrics in pairs, we stop asking whether a number is good in isolation. Instead, we ask two questions at once. What did this cost, and what did it actually return in contribution? That is how hidden tradeoffs surface. You may see a channel with low CAC that looks efficient, but the retained contribution may be weak. Or a high CAC channel that carries a loyal, high-margin cohort. One funds the other, and without pair reading, that cross-subsidization stays invisible. For acquisition choices, use contribution margin, not top-line revenue. Two channels can report the same revenue while generating very different profit. If you brief against revenue, you will keep funding the wrong one. The output here is not another dashboard. It is a set of budget and channel actions. Move spend toward the pair that clears your payback and margin threshold. Pause the pair that depends on hidden subsidy. That is the practical translation. Next, we move into causal thinking for strategy teams.
 orbitdeck.coorbitdeck.cogaconnector.com+21 min
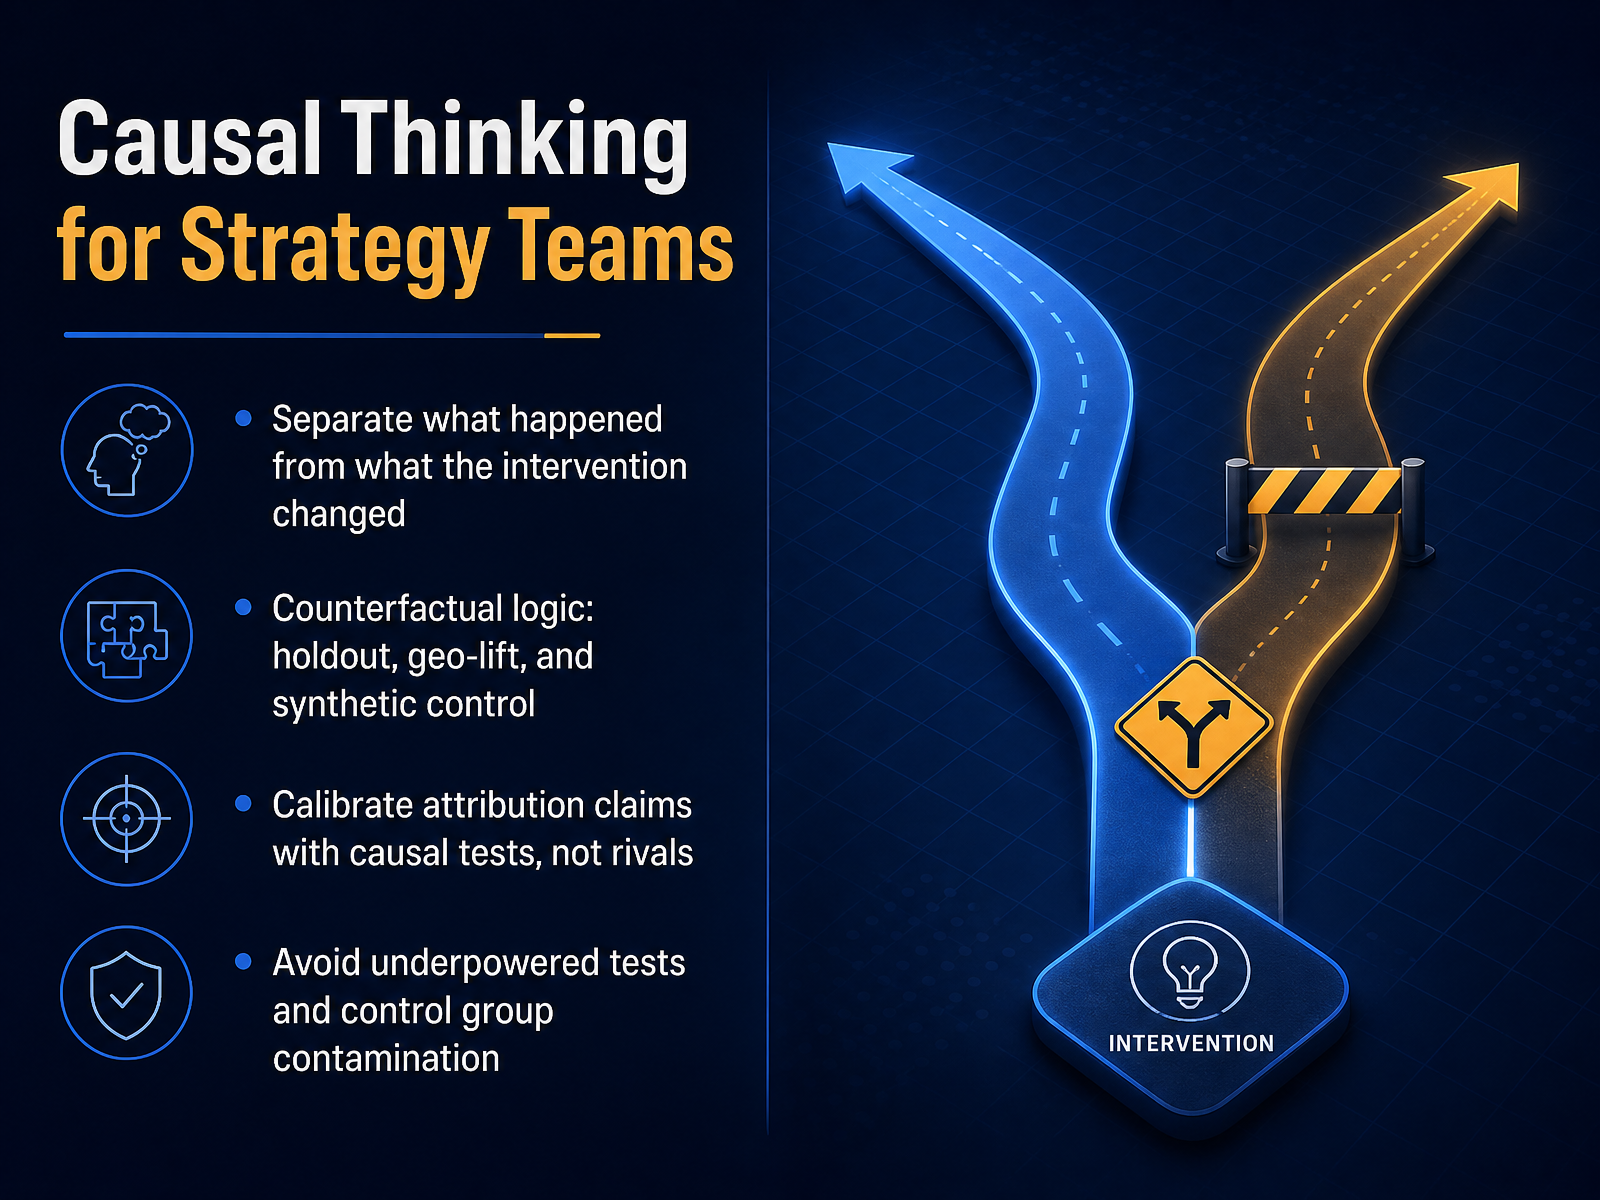
 - 10Causal Thinking for Strategy TeamsNow let's bring causal thinking directly into the strategy room. Our first job is to separate what happened from what the intervention actually changed. A conversion that would have occurred anyway is not incremental, and paying for it again is not strategy, it's waste. Counterfactual logic is the discipline here. Holdout groups, geo-lift tests, and synthetic controls give us a credible version of the world without our campaign. That is the baseline we measure against. We also need to calibrate our attribution claims against these causal tests, not against what rival platforms report. A platform's number is a claim, not evidence. And a causal test is only as good as its design. Underpowered tests waste time because they return noise that gets misread as a verdict. Contamination in the control group, whether from overlapping audiences or neighboring geographies, quietly destroys the comparison. So before we launch a test, we agree on the power calculation and the holdout design. That is the only way the result earns a seat at the budget table. Next, we look at the data foundation underneath all of this, first-party data and privacy as strategy inputs.
 deepmarketing.itblog.joelrubinson.netpresenc.ai+21 min
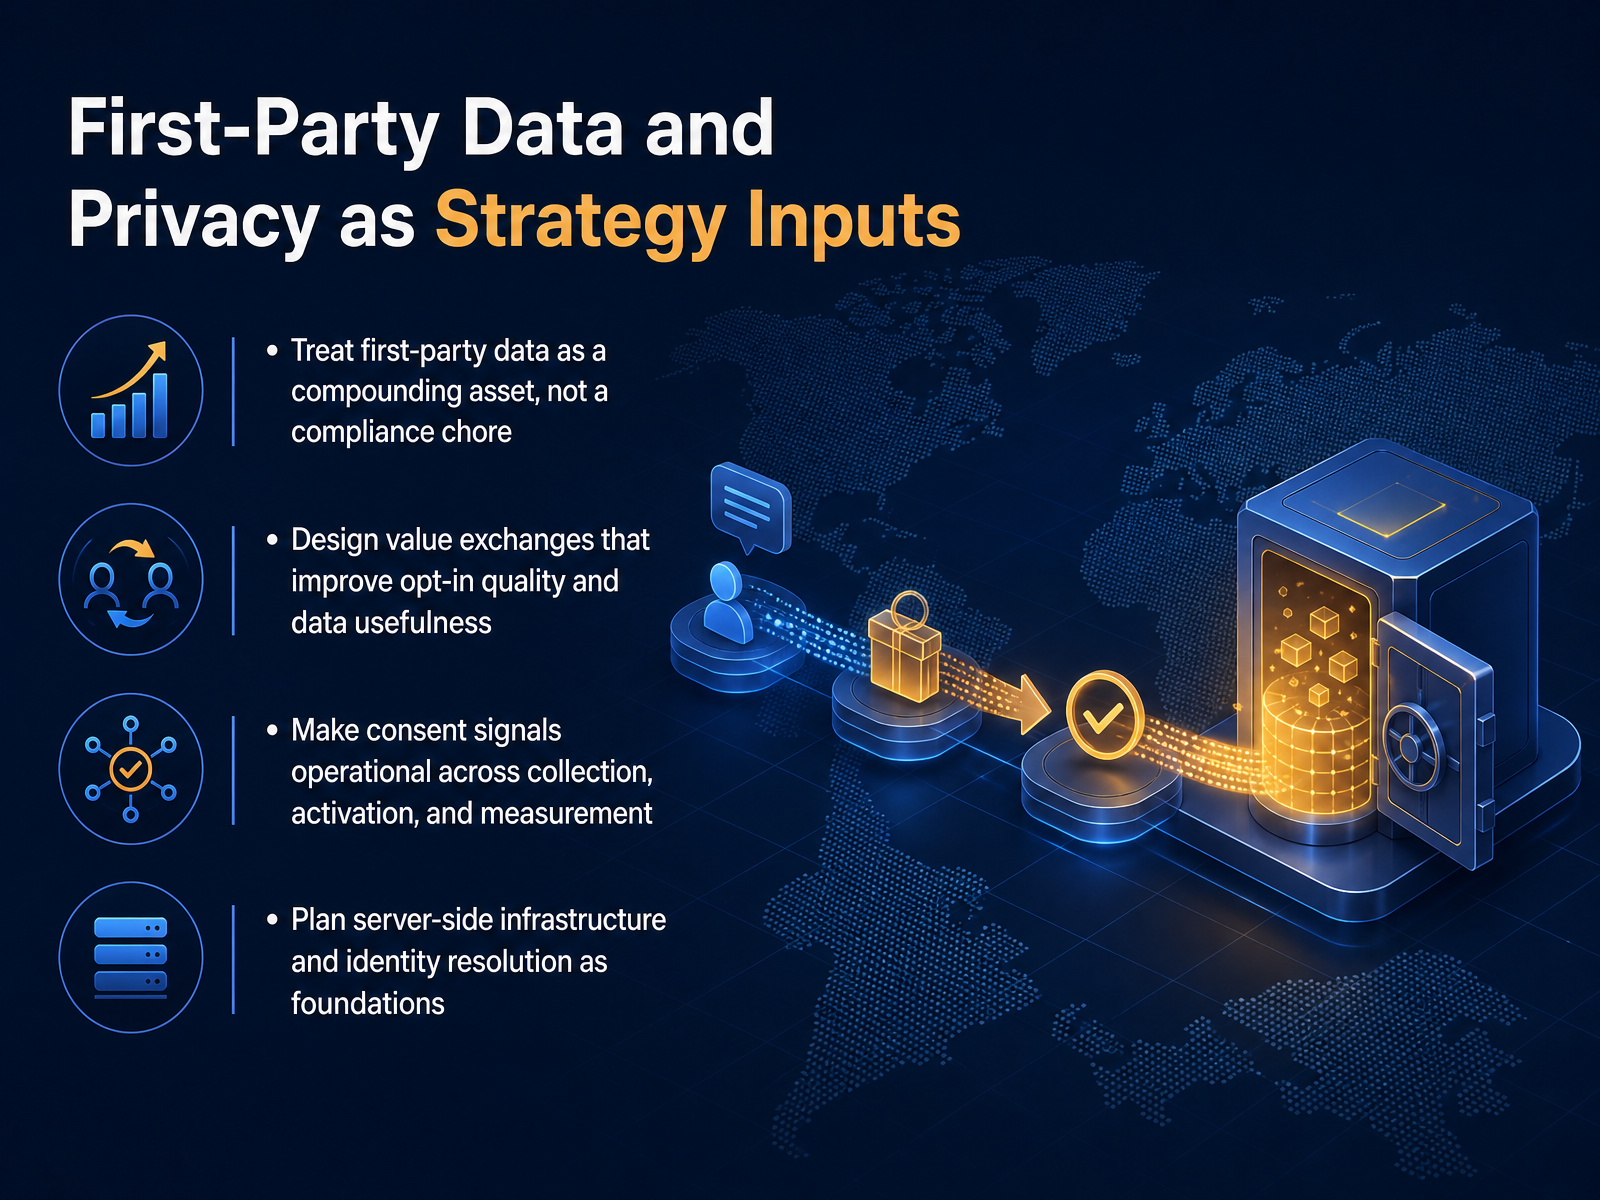
 - 11First-Party Data and Privacy as Strategy InputsLet's shift from strategy framing to one of the biggest operational inputs: first-party data. Think of it as a compounding asset, not a compliance chore. Every opt-in, purchase, or support interaction you own becomes fuel for targeting and measurement that third-party signals simply cannot replace. The hard part is designing the value exchange. If you want high-quality opt-ins, you need to offer something real, like better personalization or exclusive access, rather than just requesting data. And consent cannot just live in a banner. Those signals must travel with the customer profile across activation and measurement. Otherwise, your downstream audiences degrade and your attribution becomes indefensible. Operationally, this means building on server-side infrastructure and identity resolution. Without that foundation, you end up with messy event streams and fragmented profiles that limit every campaign you run. Let's look at how to turn this foundation into a repeatable analytics workflow.
 paypal.comstackmatix.comiabtechlab.com+21 min
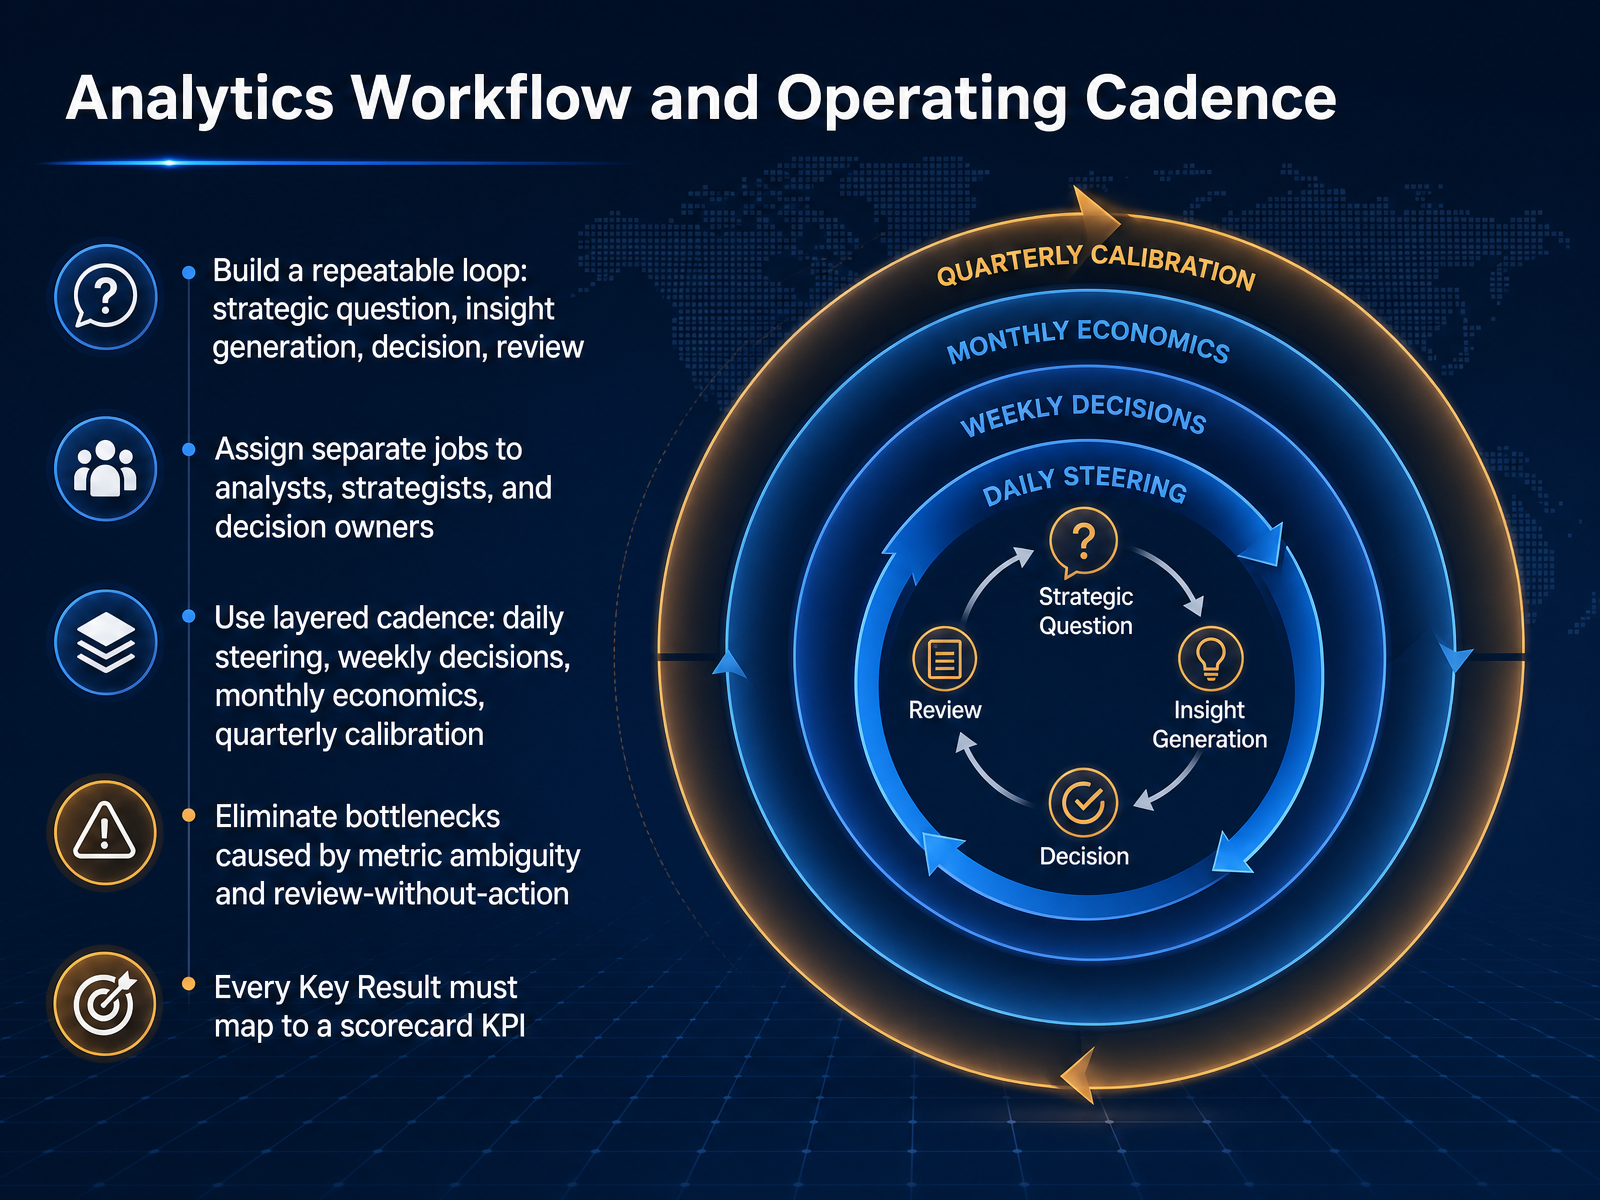
 - 12Analytics Workflow and Operating CadenceNow let’s make the measurement system operational. A strong analytics workflow is a repeatable loop, not a one-off report: strategic question, insight generation, decision, and review. That loop should have clear owners. Analysts answer the question, strategists translate it into options, and decision owners commit to a choice. Without that separation, the same person tries to do all three, and the loop stalls. Cadence matters as much as structure. Daily steering handles pacing and anomalies. Weekly decisions adjust spend and creative. Monthly economics look at cohort quality and payback. Quarterly calibration resets the budget envelope and revalidates assumptions. Two bottlenecks kill this rhythm: metric ambiguity and review without action. If people still debate what CAC includes, fix the definition before the next meeting. If a review produces no decision, remove it from the calendar. And every key result must trace to a scorecard KPI. If you cannot draw that line, the goal is too abstract to drive weekly behavior. That scorecard becomes the operational layer where strategy meets daily action. Next, we will look at how to communicate these insights for executive decisions.
 orbitdeck.coorbitdeck.cogaconnector.com+22 min
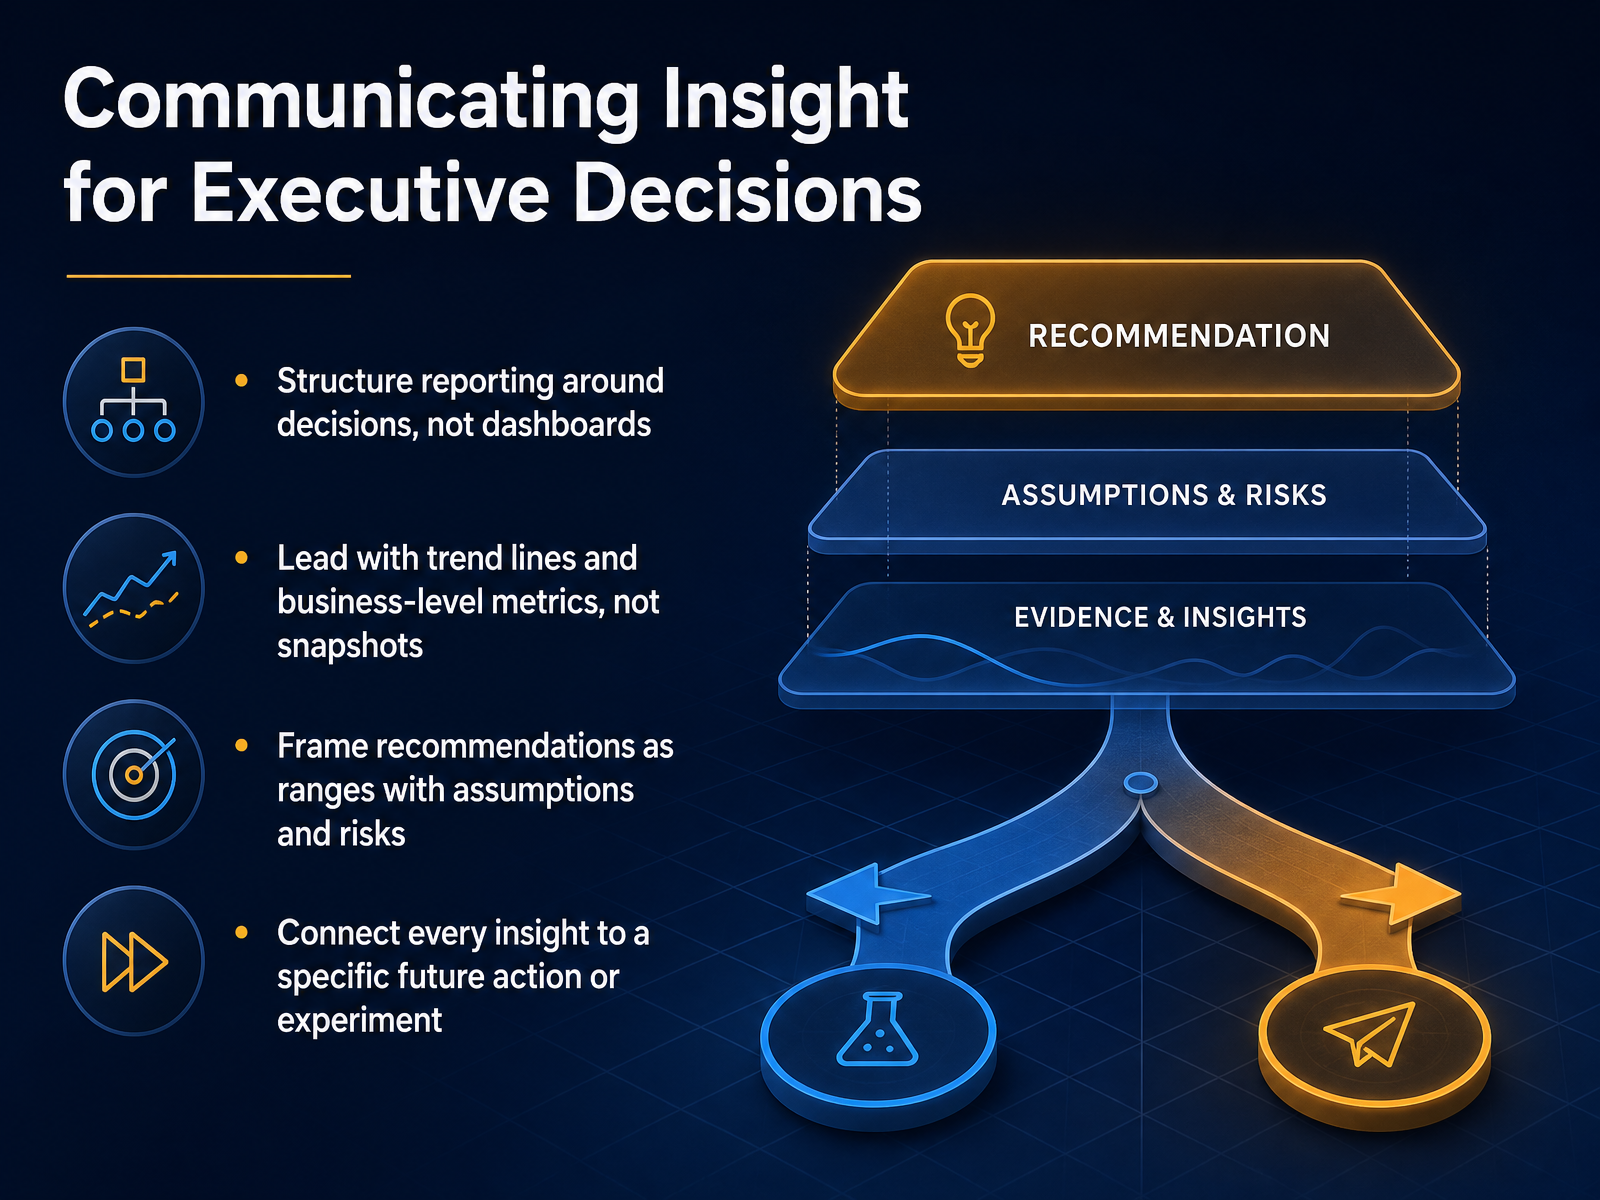
 - 13Communicating Insight for Executive DecisionsLet's shift from producing analysis to enabling decisions. When we report to leadership, the first move is structure. Build the conversation around the decision on the table, not around a dashboard. If the choice is whether to raise the CAC ceiling on a channel, that is the frame. Everything else supports that question. Lead with trend lines and business-level metrics like MER, CAC payback, and contribution margin. A point-in-time snapshot invites debate about the number. A trend invites debate about the action. When we make a recommendation, frame it as a range with assumptions and risks. For example, recommend increasing investment by fifteen to twenty-five percent, not a single point. State what has to hold true, and what would cause us to reverse. Finally, close every insight with a specific next action or experiment. If a channel shows strong incrementality, the action might be a geo expansion test. That turns reporting into a forcing function for progress. Next, we will look at aligning marketing, finance, and product around these choices.
 orbitdeck.coorbitdeck.cogaconnector.com+22 min
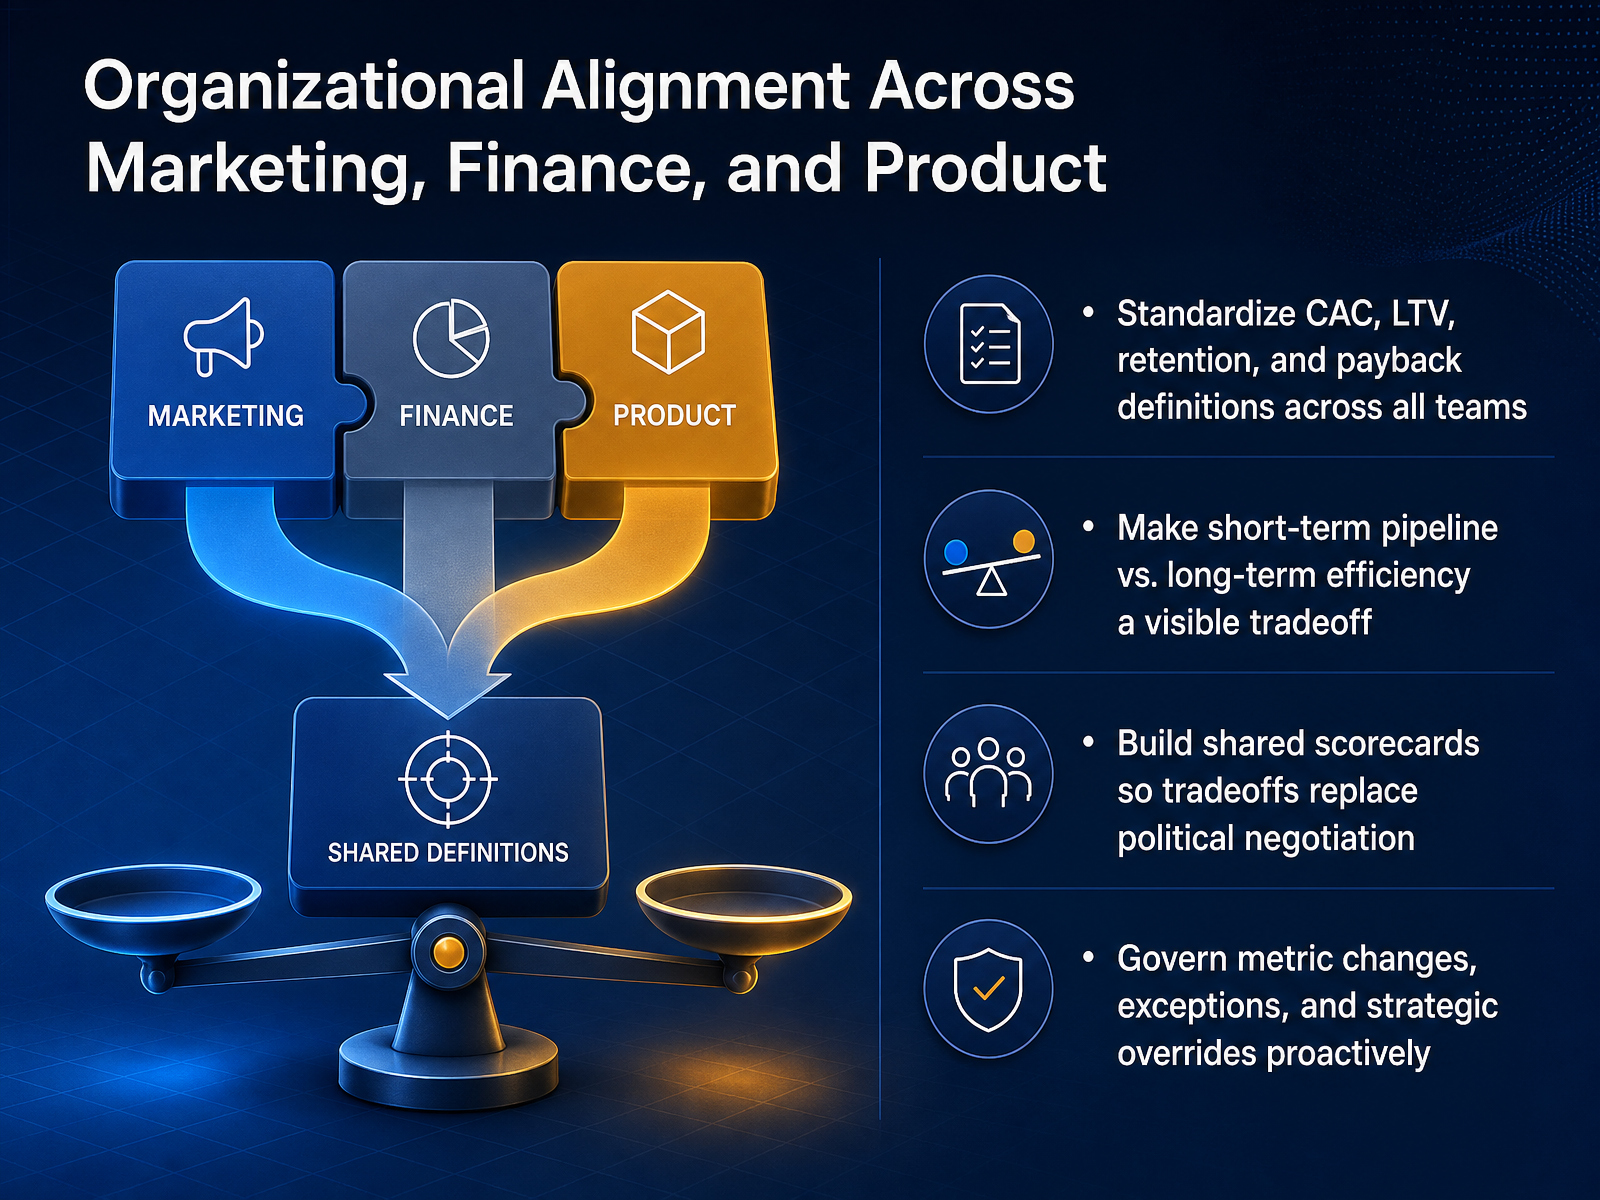
 - 14Organizational Alignment Across Marketing, Finance, and ProductAlignment is where good unit economics either hold or quietly fail. So let's talk about making the tradeoffs visible across marketing, finance, and product. First, standardize the definitions. CAC, LTV, retention, and payback need to mean the same thing to every team. The moment marketing counts paid media only while finance counts fully loaded cost, you are arguing about two different numbers. Next, make the core tension explicit. Short term pipeline versus long term efficiency is not a problem to hide, it is the decision you should be making on purpose each quarter. Then, build shared scorecards. When finance sees the same cohort table as growth and product, tradeoffs replace political negotiation, because the discussion shifts from opinions to evidence. Finally, govern exceptions proactively. If a channel is allowed to breach its payback threshold for strategic reasons, document who approved it, why, and for how long. Otherwise, every exception becomes a silent precedent. These four moves turn alignment from an aspiration into an operating cadence. Next, let's bring all of this together into a reusable goal, choice, and tradeoff map.
 orbitdeck.coorbitdeck.cogaconnector.com+21 min
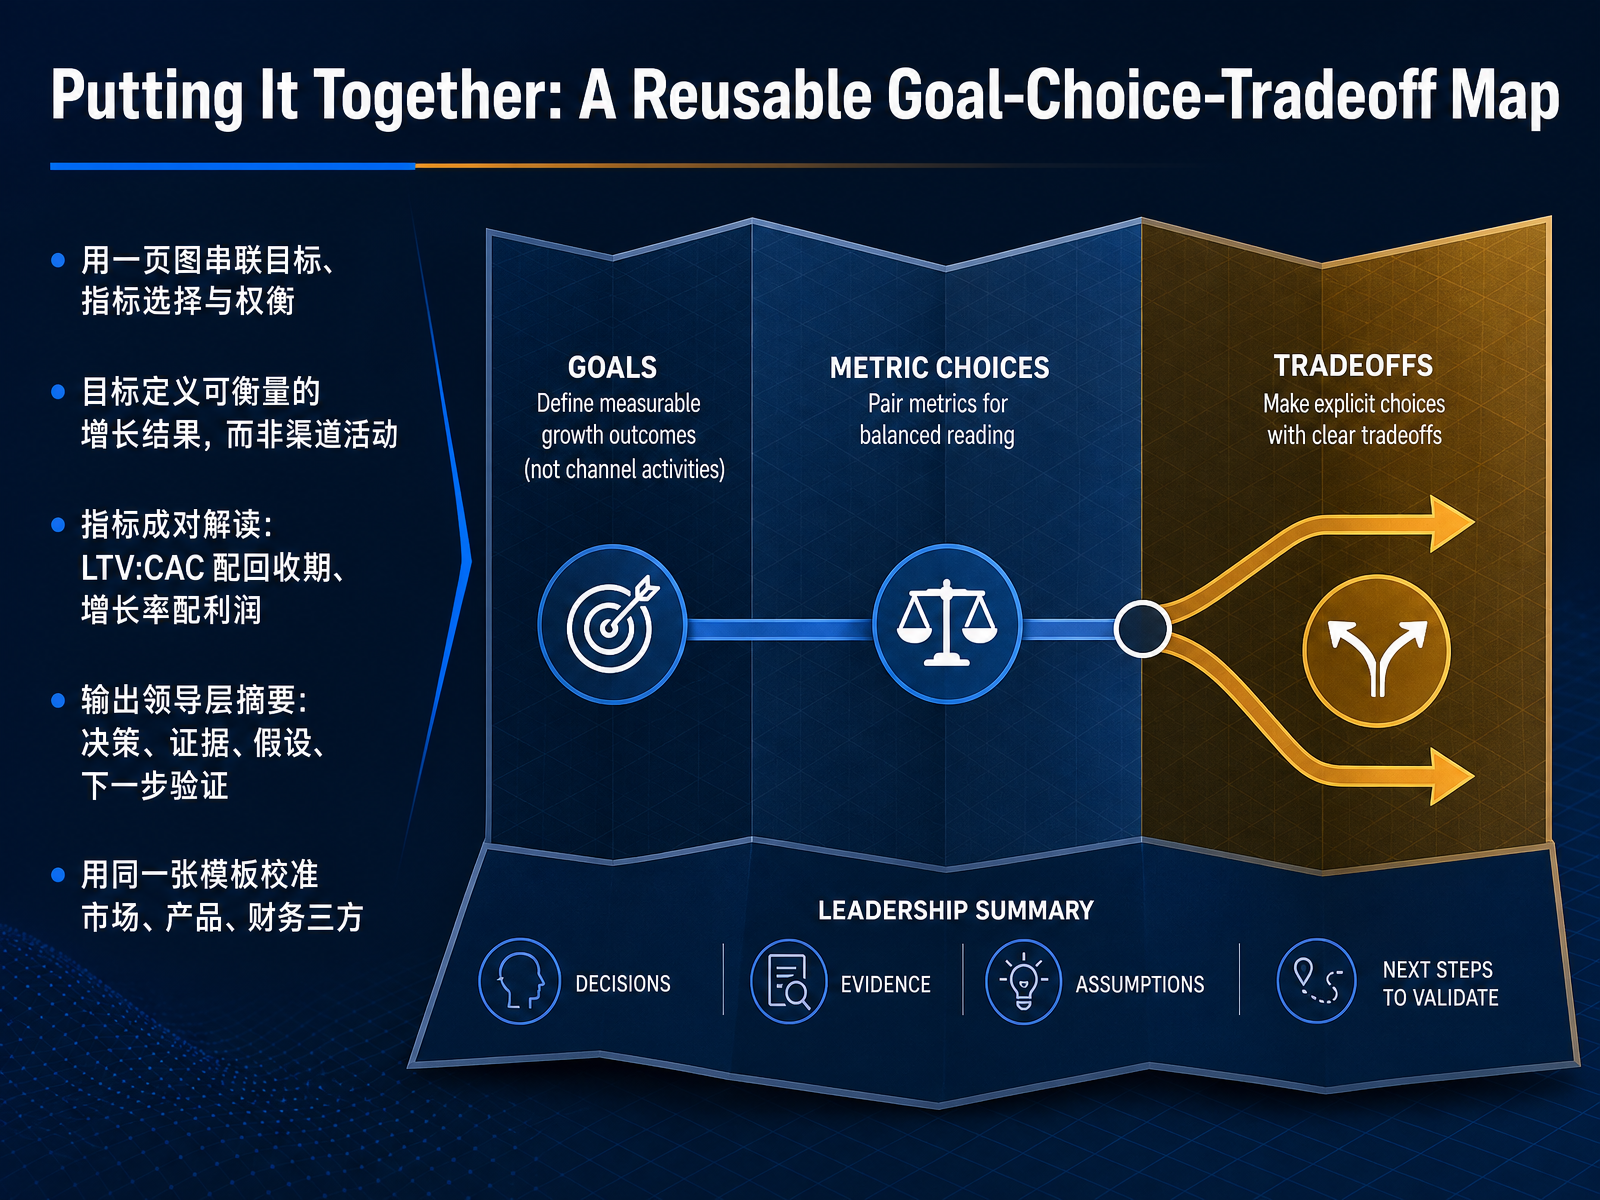
 - 15Putting It Together: A Reusable Goal-Choice-Tradeoff MapLet's consolidate everything into one reusable map. Here's the core discipline. Define goals as measurable growth outcomes, not channel activity. Then treat every metric as a paired reading, because a single ratio will mislead you. LTV to CAC only means something alongside payback period, and growth rate only makes sense next to profit contribution. When you get this right, the output isn't another dashboard. It's a leadership summary with four parts: the decision, the evidence, the assumptions, and the next validation step. Practically, use this same template to align marketing, product, and finance. Each function sees the same tradeoff structure, which reduces the usual zero-sum budget fight. The map itself is not the deliverable. The deliverable is faster, more defensible decisions that survive scrutiny. Thank you for working through this framework. The next step is to apply it to your own largest campaign, then calibrate one assumption with a real incrementality test.
 orbitdeck.coorbitdeck.cogaconnector.com+22 min
Take the deck with you
Download this course as a file — free, no sign-up needed.
- PDF handoutEvery slide page, ready to print or share.16 pages · 4.0 MBDownload
- Narrated PowerPointThe deck that presents itself — every slide carries the digital human's narration video.16 pages · 16.7 MBDownload
- PowerPoint slidesThe full deck as a .pptx — open it in PowerPoint, Keynote, or Google Slides.16 pages · 4.0 MBDownload
Free to use in your own training — please keep the PersonWise credit page at the end.
Have your own deck? Turn it into a course
Sources consulted
Web sources consulted while building this course.
- Marketing OKRs 2026: Framework + Templates by Business Type — orbitdeck.co
- LTV:CAC Ratio Guide 2026: Formula, Benchmarks & Calculator — orbitdeck.co
- Measuring Marketing Performance in 2026 [Frameworks + 90-Day Plan] — gaconnector.com
- Cac and Ltv Optimization — a Practitioner's No-fluff Breakdown — agenticmarketingpro.com
- How to Build a Profitable LTV/CAC Framework From Scratch – D2C Times — d2c-times.com
- Marketing Attribution: 62% Get It Wrong (Nielsen) | Deep Marketing — deepmarketing.it
- Joel Rubinson on Marketing Research » How ad measurement can go very wrong and what to do about it — blog.joelrubinson.net
- Causal Inference for Marketing Measurement | Presenc AI — presenc.ai
- Attribution Modeling Limitations: 2026 Guide for Marketers — cometly.com
- AI Attribution Is Making You Worse at Marketing – Sagum — sagum.com
- How To Build a First-Party Data Strategy | PayPal US — paypal.com
- First-Party Data Strategy: Collect, Unify, Activate (2026) — stackmatix.com
- First-party Data Begins with Consent - IAB Tech Lab — iabtechlab.com
- First-Party Data Strategy: 2026 Playbook | Abmatic AI — abmatic.ai
- What Is A First-Party Data Strategy? Balancing Privacy & Insight — cxtoday.com
- Bridging the gap between marketing and finance: Making the case for brand investment | Brand Finance — brandfinance.com
- 60/40 Rule 2026: Brand vs Performance Budget Split (IPA 996 Studies) | Deep Marketing — deepmarketing.it
- FAQ on brand marketing: Measuring what matters as C-Suites demand proof — emarketer.com
- Brand vs performance: the 60/40 balance, explained — leadersloop.com
- Branding vs performance budget: finding the right mix in 2026 — addict-mobile.com