Begin
14 pages · ~28 min
Change Management Metrics
This course helps change leaders and managers select, track, and interpret change management metrics to evaluate initiative progress and business impact.
A digital instructor presents all 14 pages. Hold “Ask” at any point and ask out loud — the answer comes from this course. No sign-up needed.
What you’ll learn
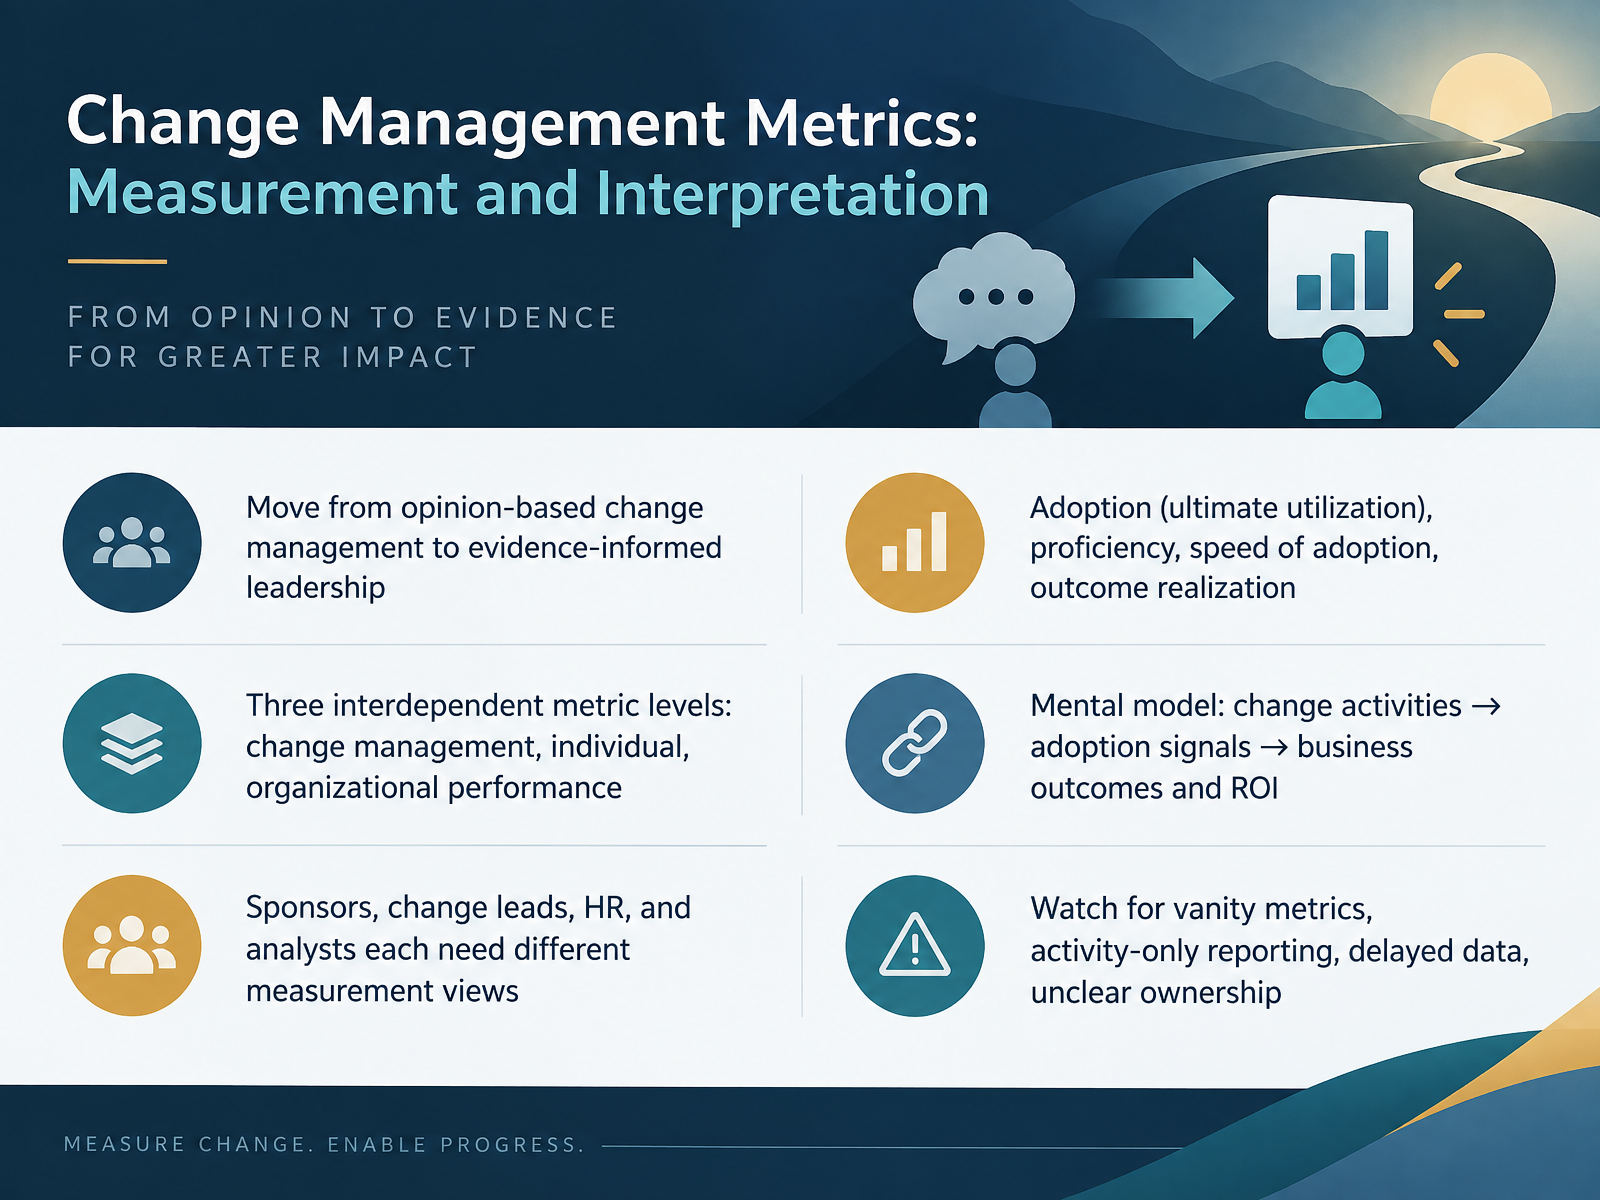
- 01Change Management Metrics: Measurement and InterpretationWelcome. This course is about change management metrics, and how to measure and interpret them well.
Our goal is simple. We want to move from opinion-based change management to evidence-informed leadership. That means you stop asking whether change feels like it is working, and start showing whether it is.
At the heart of this are four measures. Adoption, also called ultimate utilization. Proficiency. Speed of adoption. And outcome realization. What this means in practice is how many people use the change, how well they use it, how quickly they get there, and whether the business results actually follow.
We will work across three interdependent levels: change management performance, individual performance, and organizational performance. The mental model is a chain. Change activities create adoption signals, and adoption signals drive business outcomes and return on investment.
One caution before we go further. Sponsors, change leads, HR, and analysts each need different measurement views. Where teams often misread this is treating one dashboard as universal. Watch for vanity metrics, activity-only reporting, delayed data, and unclear ownership.
Let us start with the evidence base, and why measurement correlates with change success.prosci.comempower.prosci.comprosci.com+22 min
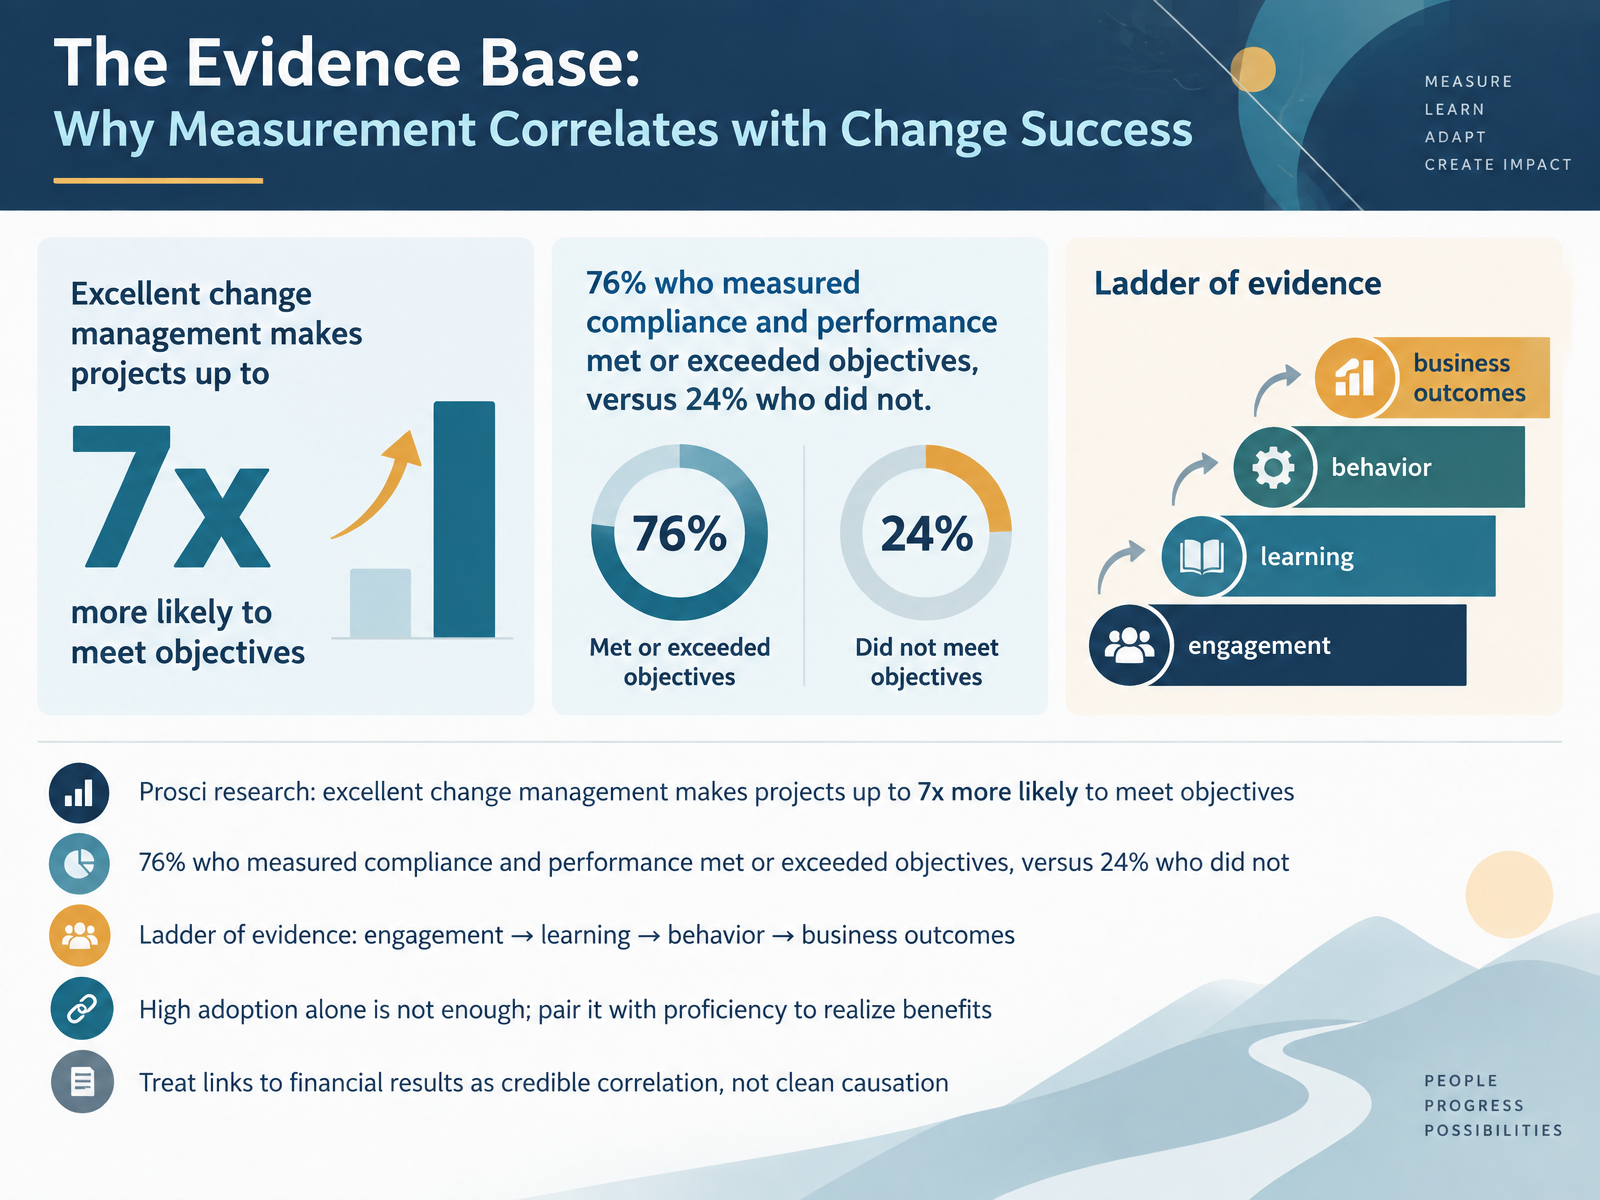
- 02The Evidence Base: Why Measurement Correlates with Change SuccessLet's look at why measurement itself correlates with change success. Prosci's research is clear. Projects with excellent change management are up to seven times more likely to meet objectives. And when organizations measured compliance and performance, seventy-six percent met or exceeded objectives. Of those who did not measure, only twenty-four percent did. That gap is the strongest argument you have for tracking adoption. Think of it as a ladder of evidence. Engagement comes first. Then learning. Then behavior. Then business outcomes. Each rung supports the next. But here is where teams often misread the data. High adoption alone is not enough. If people use a new system without proficiency, benefits stay unrealized. So pair adoption with proficiency. Finally, treat links to financial results as credible correlation, not clean causation. That keeps your interpretation honest. Next, the Measurement Landscape: Five Metric Families and How to Choose Them.
 prosci.comempower.prosci.comprosci.com+22 min
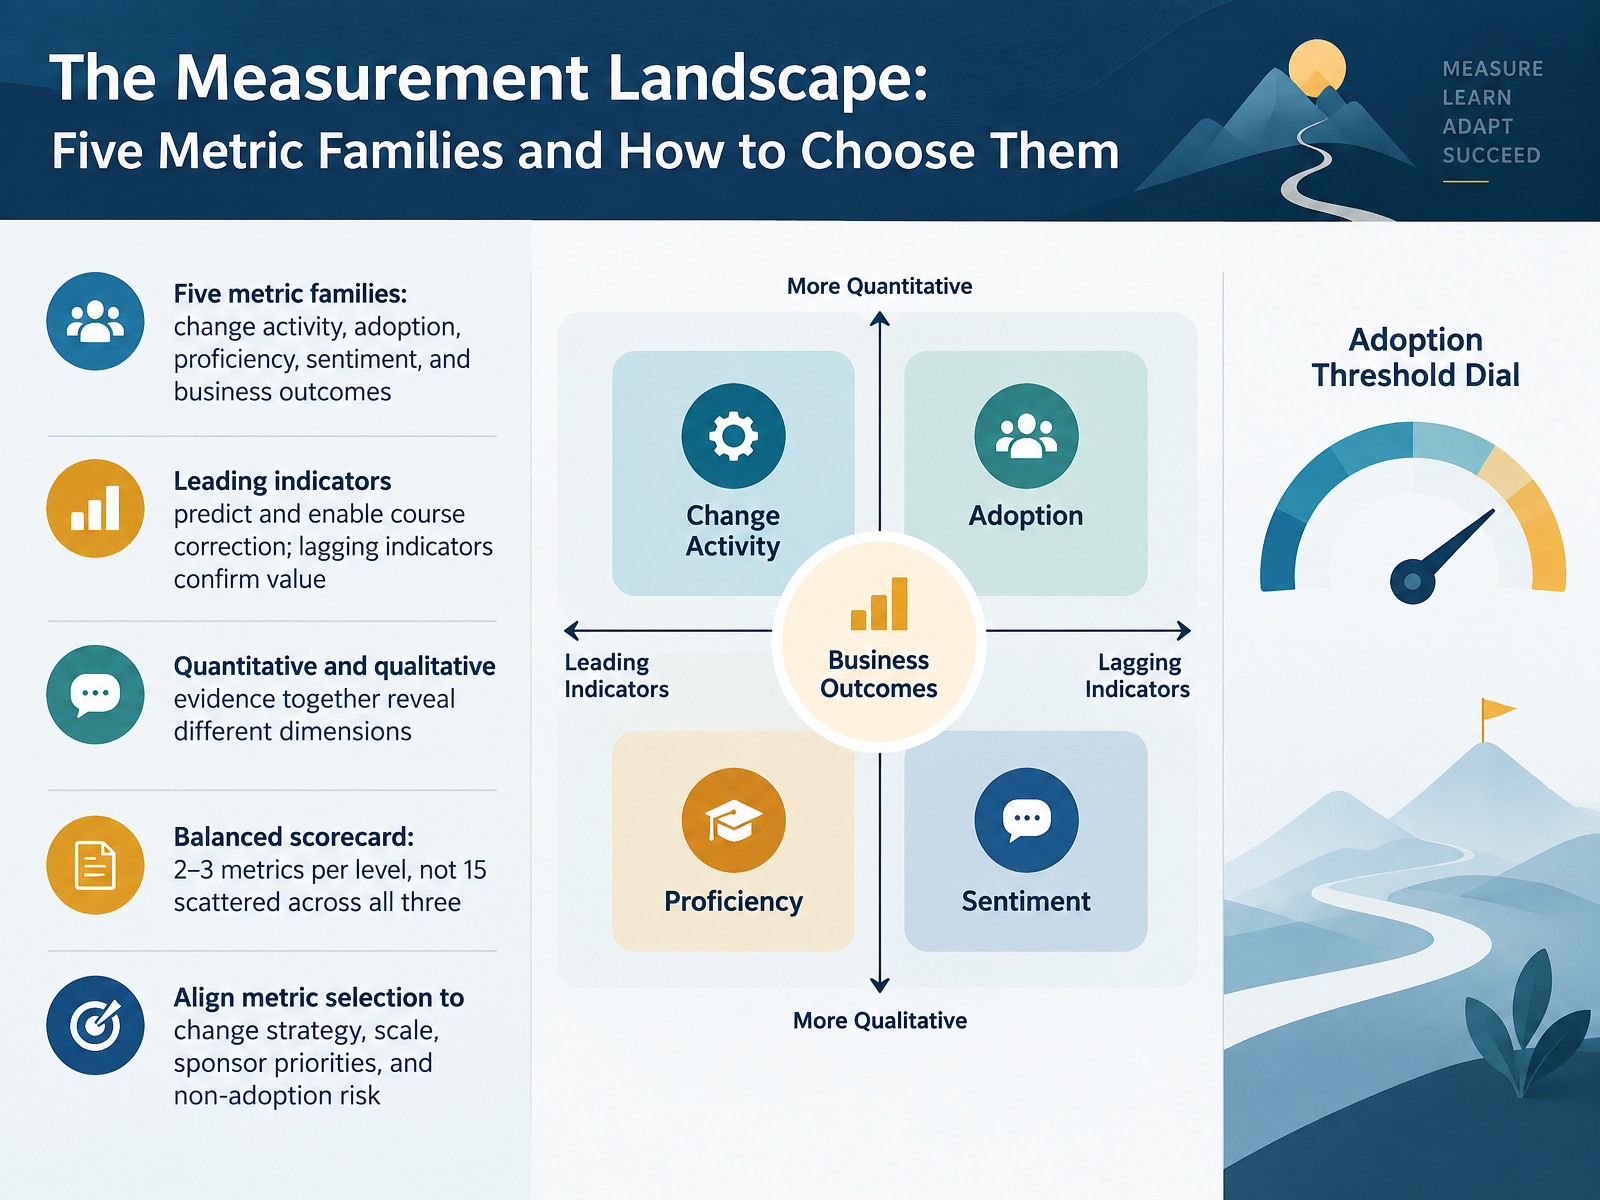
 - 03The Measurement Landscape: Five Metric Families and How to Choose ThemLet's look at the measurement landscape, and how to choose metrics that actually help you. There are five metric families to work with: change activity, adoption, proficiency, sentiment, and business outcomes. Think of them as layers, not alternatives. Activity tells you what you delivered. Adoption tells you who is using the new way of working. Proficiency tells you how well. Sentiment tells you how people feel. Outcomes tell you whether value arrived. What this means in practice: leading indicators, like training completion or manager readiness, predict trouble early, so you can correct course. Lagging indicators, like adoption rates or productivity gains, confirm value after the fact. Combine quantitative and qualitative evidence, because they reveal different dimensions. Where teams often misread this: they overfill one level. Aim for two to three metrics per level, not fifteen scattered across a scorecard. Finally, align your selection to strategy, scale, sponsor priorities, and the risk of non-adoption. Next, we'll move into defining success and building the measurement plan.
 docs.aws.amazon.comexec.comtd.org+22 min
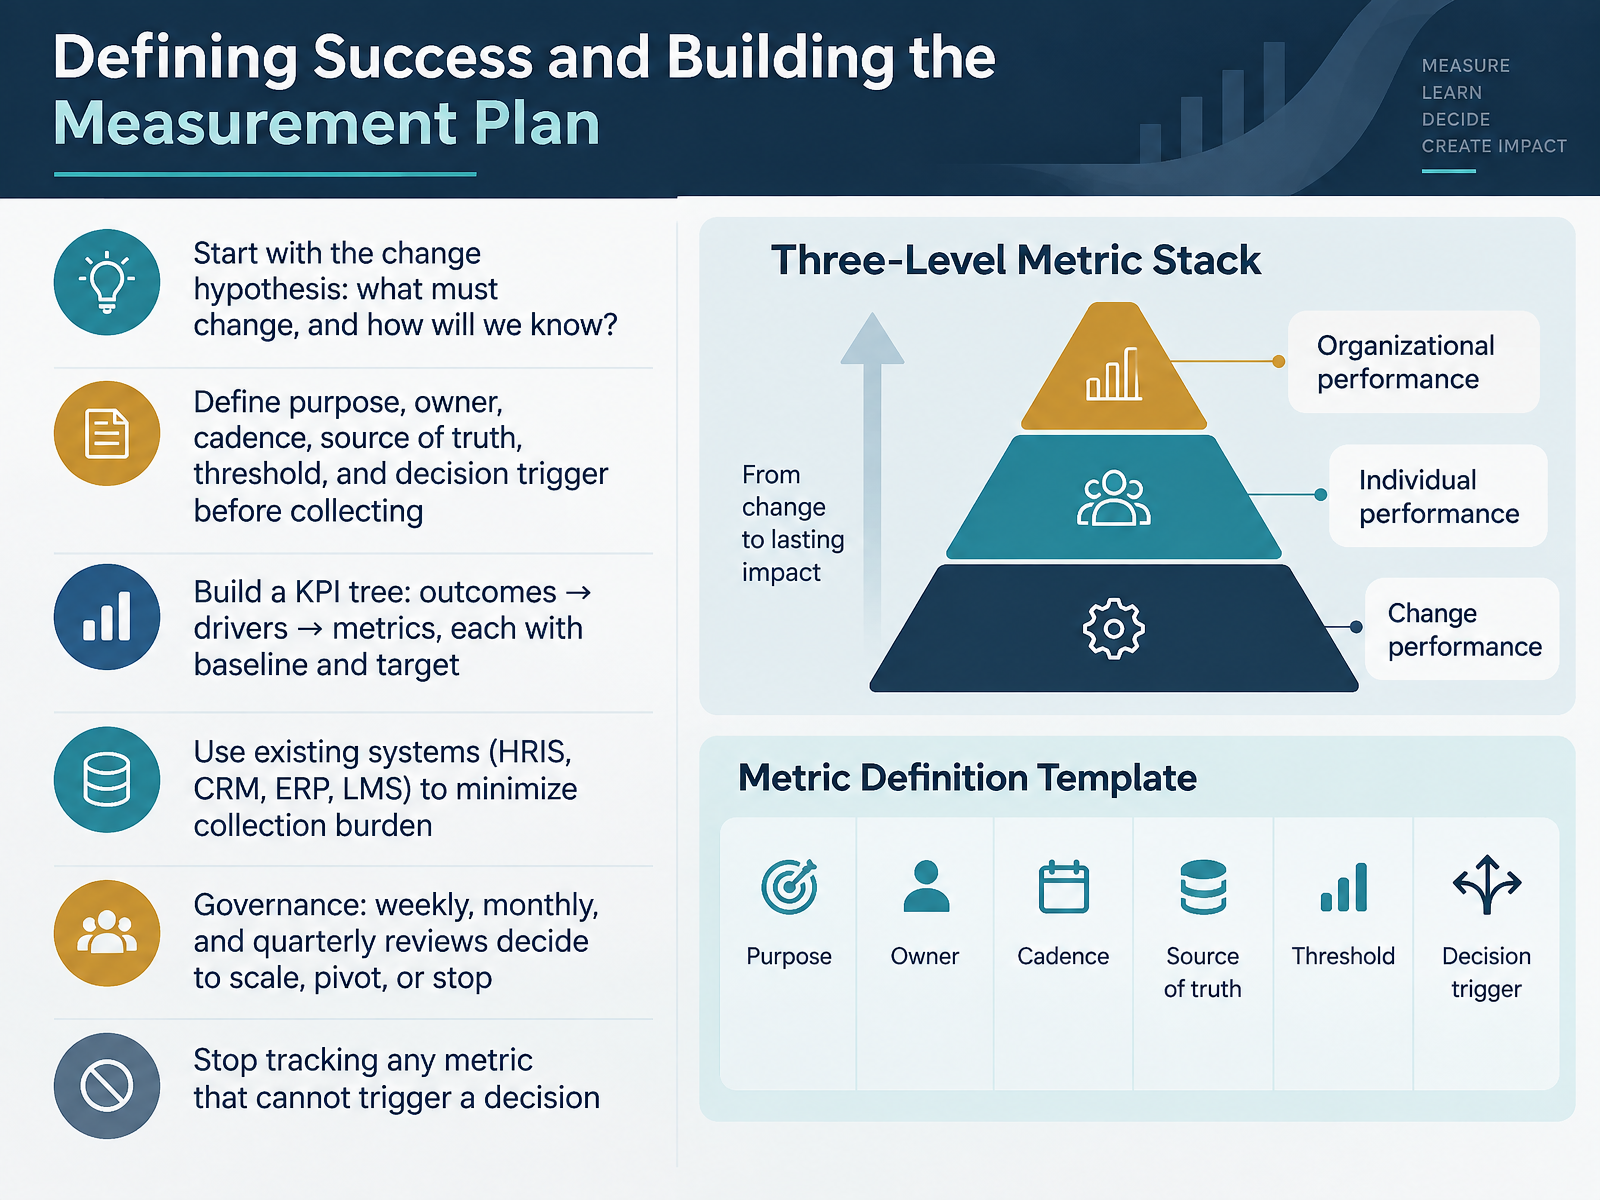
 - 04Defining Success and Building the Measurement PlanLet's talk about defining success and building the measurement plan. Start with the change hypothesis. What must change, and how will we know? Before you collect a single data point, define six things: purpose, owner, cadence, source of truth, threshold, and decision trigger. Next, build a KPI tree. Outcomes sit at the top. Drivers sit beneath them. Metrics sit at the base. Give each one a baseline and a target. Where you can, pull data from systems you already have, like your HRIS, CRM, ERP, or LMS. That keeps the collection burden low. Then set your governance rhythm. Weekly, monthly, and quarterly reviews decide whether to scale, pivot, or stop. And one hard rule: stop tracking any metric that cannot trigger a decision. This is where teams often misread things. More metrics do not mean better insight. Fewer, decision-linked measures carry more weight. Next, we look at collecting reliable evidence through surveys, operational data, and observation.
 wendyhirsch.comsorenkaplan.comcompelframework.org+22 min
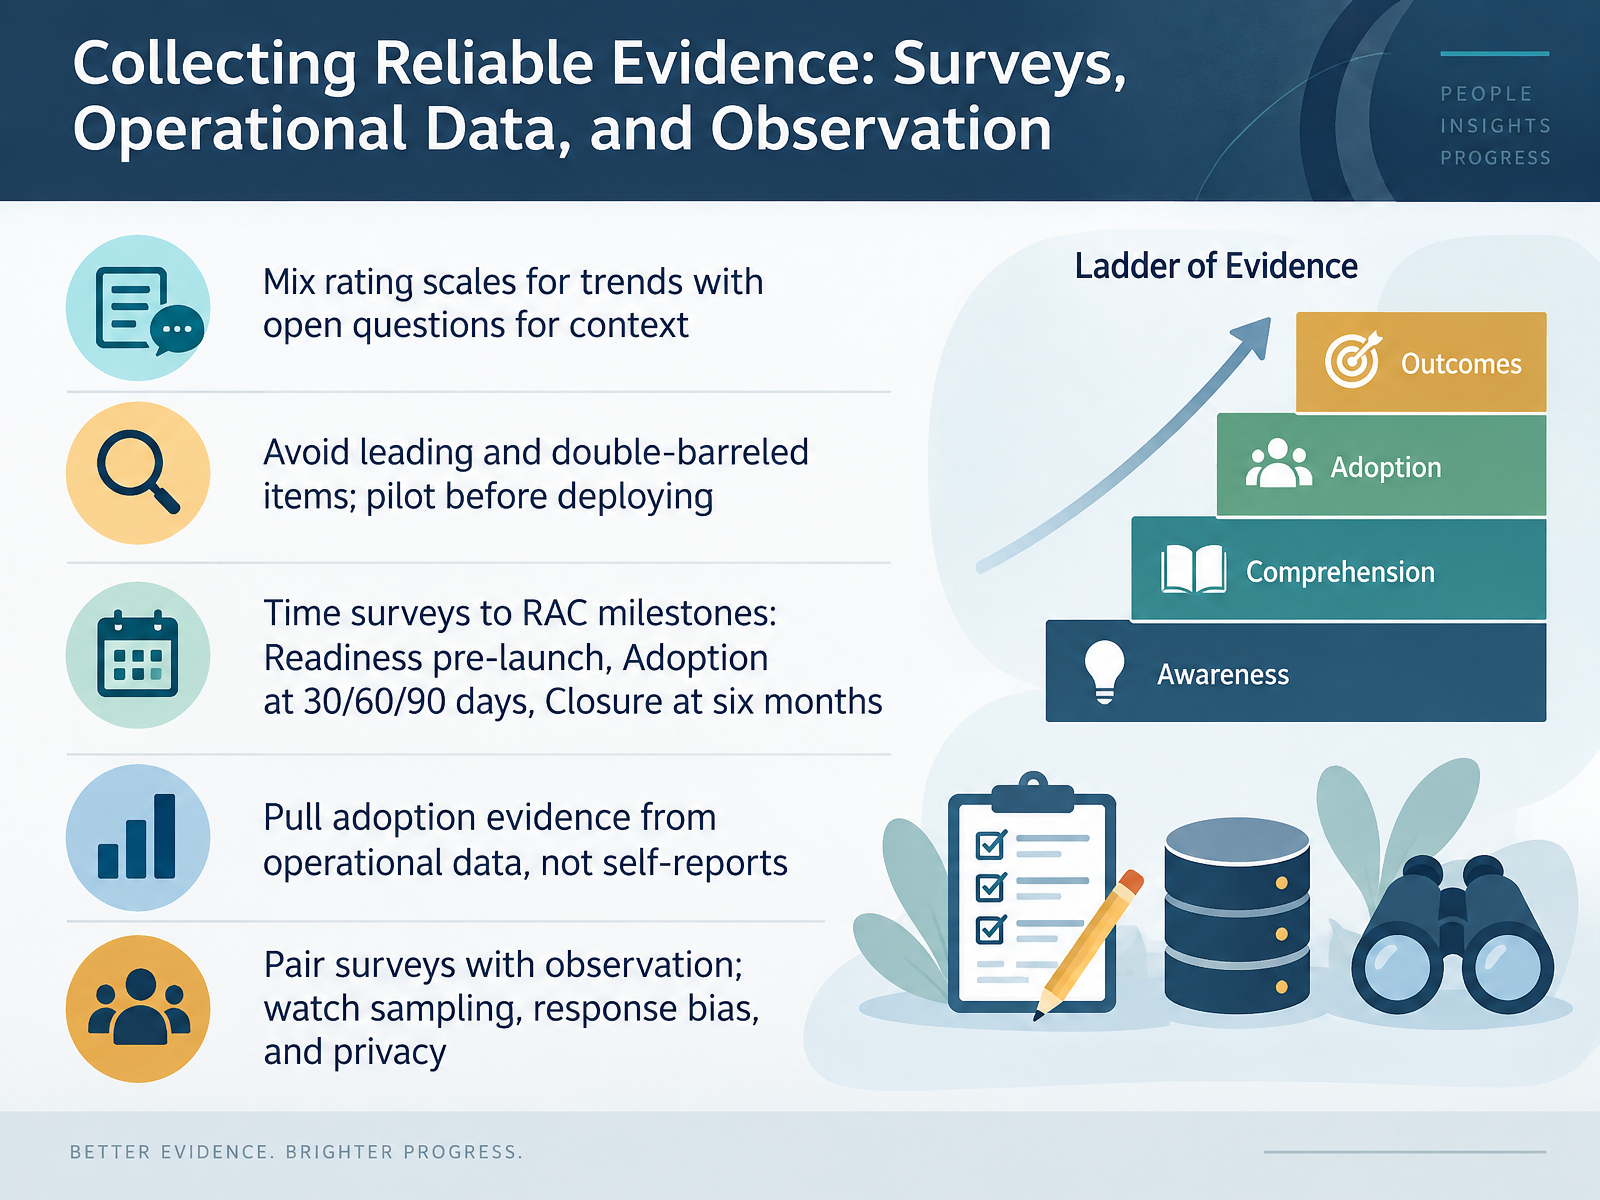
 - 05Collecting Reliable Evidence: Surveys, Operational Data, and ObservationLet's look at how you collect reliable evidence. The quality of your interpretation is only as good as the quality of the data underneath it. So start with survey design. Mix rating scales, which let you track trends across cycles, with open questions, which explain the why behind the numbers. Avoid leading items and double-barreled items that ask two things at once. Pilot any new survey with a small group before you deploy it widely. Timing matters just as much. Align surveys to R A C milestones: Readiness before launch, Adoption at thirty, sixty, and ninety days, and Closure at six months. What this means in practice: calendar-based scheduling misses the moments that matter. And here's the point teams often misread. Pull adoption evidence from operational data, not self-reports. People tend to overstate compliance. Logins, process completion rates, and error rates tell you what actually happened. Finally, pair surveys with observation. Watch for sampling problems, response bias, and privacy. Combine breadth from surveys with depth from interviews and direct observation. That gives you evidence you can defend. Next, we look at reading adoption and proficiency signals correctly.
 culturemonkey.ioadopt-it.aikoji.so+22 min
 - 06Reading Adoption and Proficiency Signals CorrectlyNow let's look at how to read adoption and proficiency signals correctly.
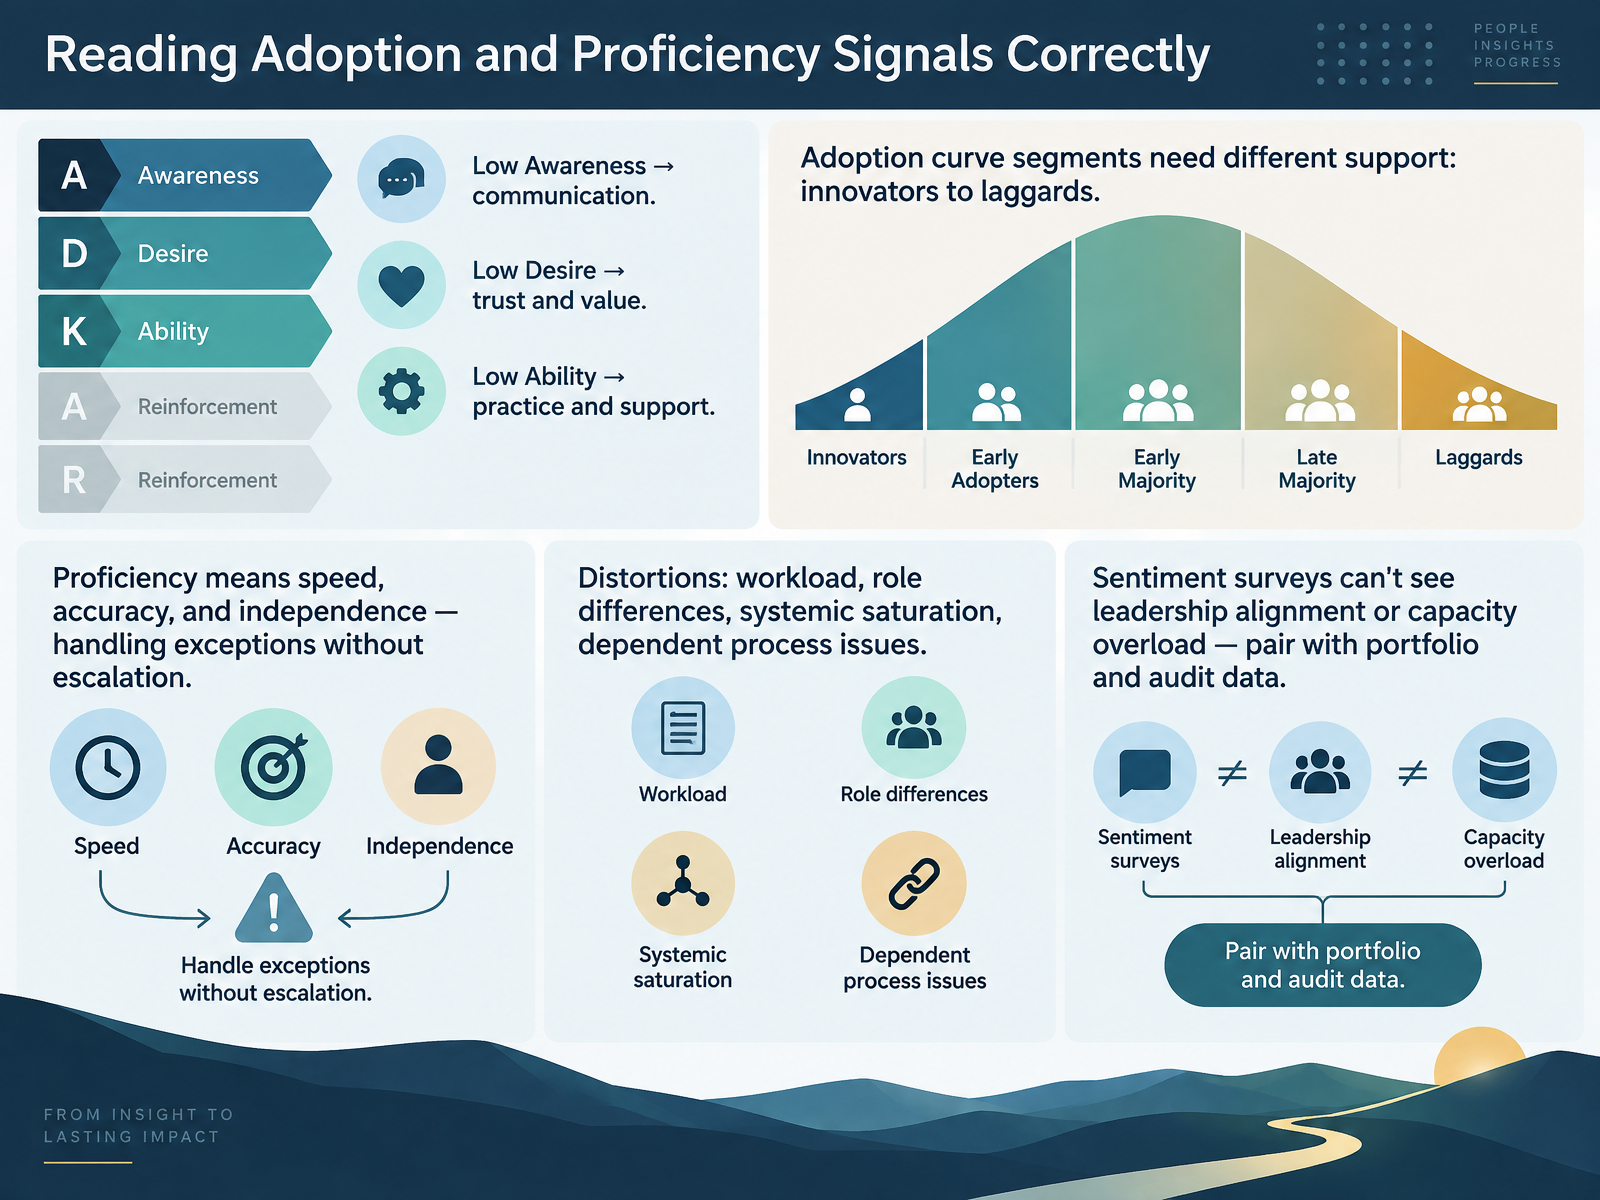
The first thing to separate is the type of signal. Low awareness usually points to a communication gap. Low desire points to trust and value, and training alone will not fix it. Low ability, by contrast, points to practice and support.
Next, remember that the adoption curve is not uniform. Innovators, early adopters, the early and late majority, and laggards all need different levels of support. Treating them as one group hides where adoption is actually stalling.
Proficiency is more than using the tool. It means speed, accuracy, and independence. The clearest sign of proficiency is when people handle exceptions without escalating them.
Where teams often misread this: workload, role differences, systemic saturation, and dependent process issues all distort the numbers. So keep one caution in mind. Sentiment surveys cannot see leadership alignment or capacity overload. Always pair them with portfolio and audit data.
Next, we move from metrics to insight, looking at cohort, segmentation, and trend analysis.
 adopt-it.aiprosci.comthechangecompass.com+22 min
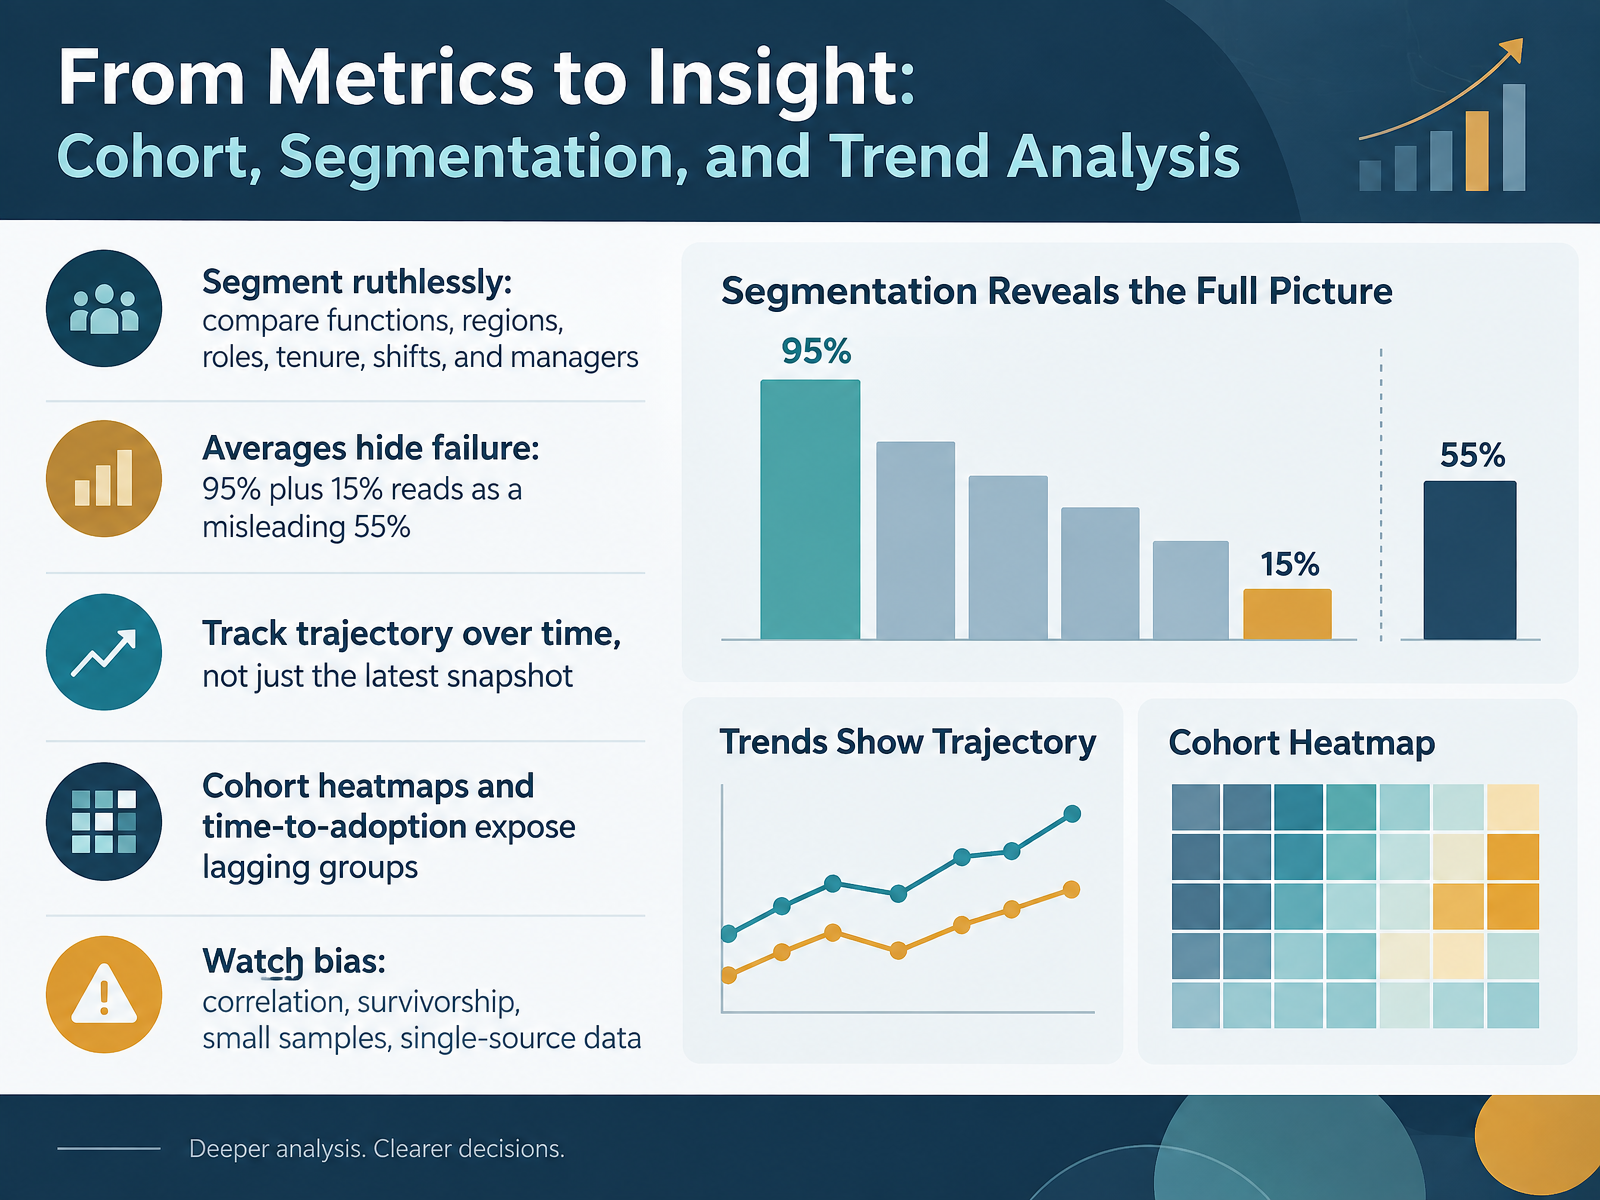
 - 07From Metrics to Insight: Cohort, Segmentation, and Trend AnalysisLet's move from raw metrics to actual insight. A single number rarely tells you what is happening. Three moves change that. First, segment ruthlessly. Compare functions, regions, roles, tenure, shifts, and individual managers. Averages hide failure. If one team is at ninety-five percent adoption and another is at fifteen, the average reads as a misleading fifty-five. In practice, that is one success and one collapse. Second, track trajectory over time, not just the latest snapshot. Cohort heatmaps and time-to-adoption curves expose lagging groups early, while you can still act. Third, watch your bias. Correlation is not causation. Survivorship bias hides the people who quietly disengaged. Small samples mislead. And single-source data gives you false confidence. So pull evidence from more than one place. What this means in practice: segment, watch the trend, and question the source before you draw a conclusion. Next, we look at designing dashboards for decision makers.
 adopt-it.aiprosci.com2 min
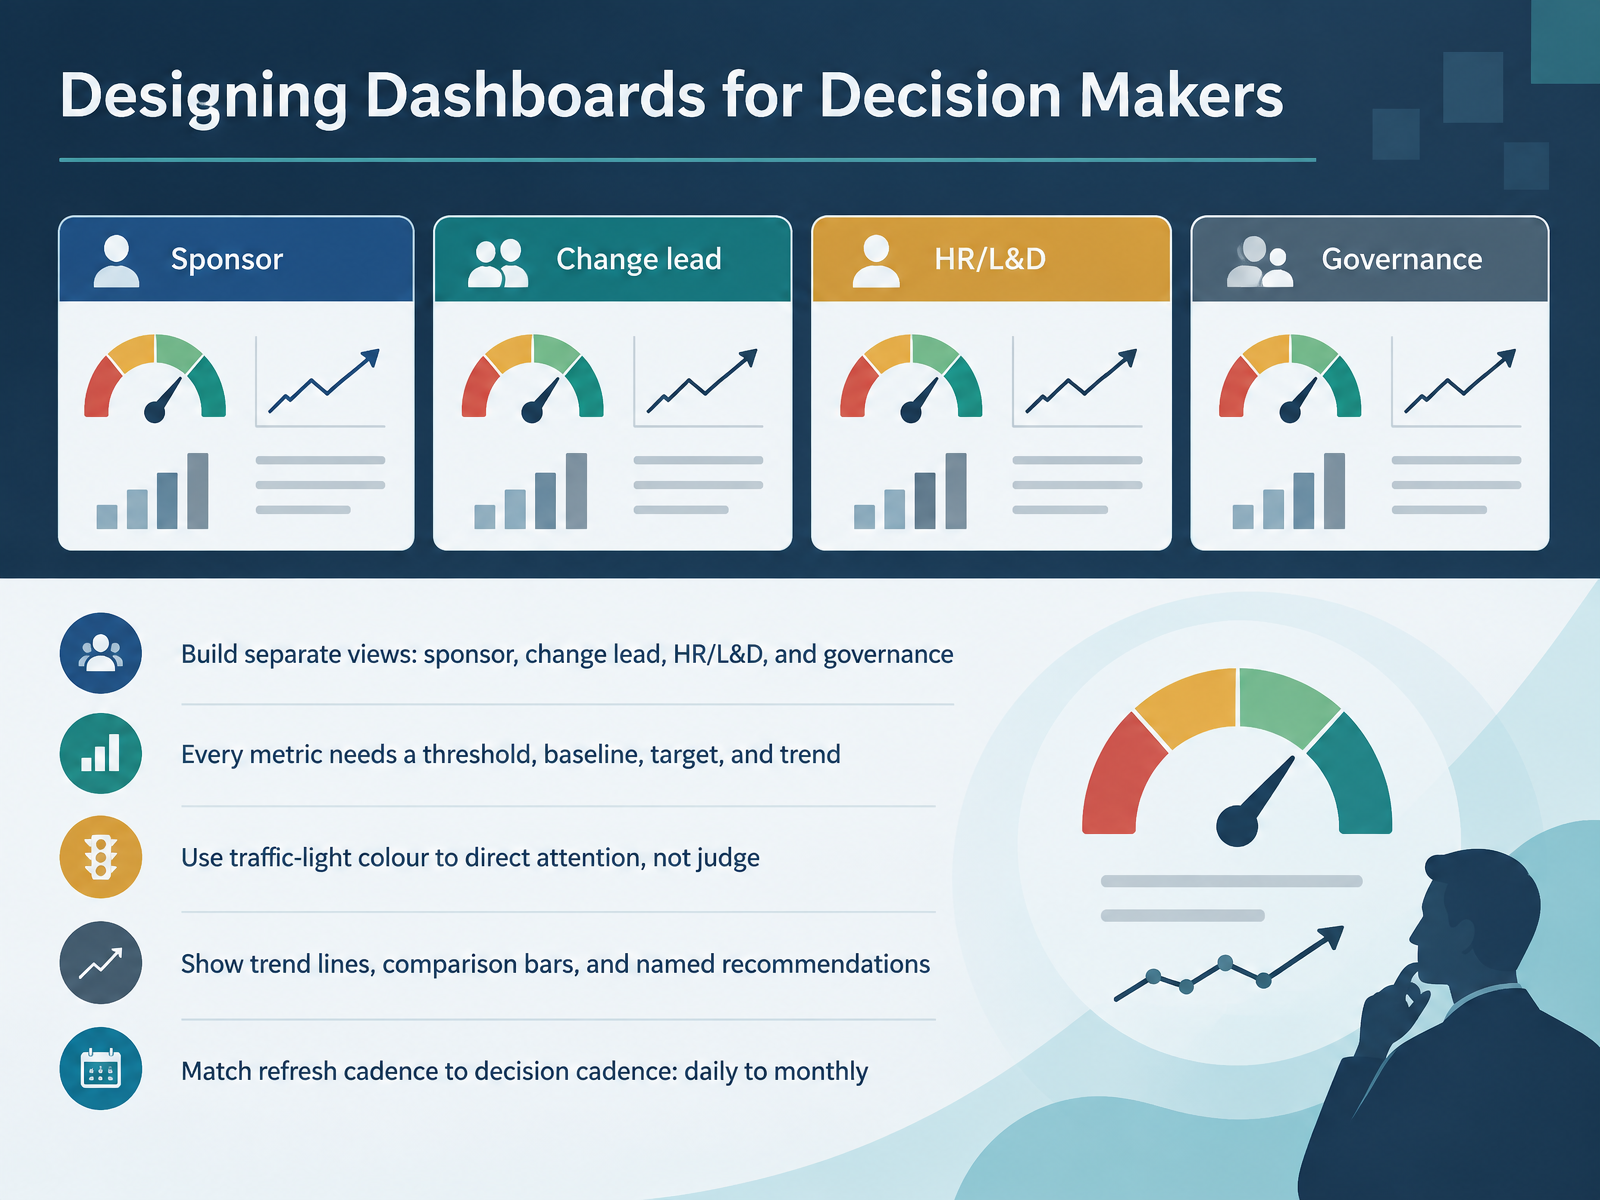
 - 08Designing Dashboards for Decision MakersLet's look at how to design dashboards that actually support decisions. The first principle is separation. Sponsors, change leads, HR and L and D, and governance each need their own view. A sponsor wants five headline cards. A change lead needs cohort-level resistance and sentiment. Same data, different questions. Next, every metric needs four things: a threshold, a baseline, a target, and a trend. Without a baseline, movement is meaningless. Without a threshold, there is no trigger for action. On colour, use traffic lights to direct attention, not to judge. Red means focus here, not failure. It may simply signal high impact. Green still requires monitoring. Where teams often misread this, they treat green as permission to stop watching. So pair colour with trend lines, comparison bars, and named recommendations. Finally, match refresh cadence to decision cadence. Daily for sentiment and resistance signals. Weekly for adoption and training. Monthly for benefit realisation. If the data is older than the decision, the dashboard fails its purpose. Reporting and storytelling with change data is where we go next.
 thechangecompass.comtd.orgprosci.com2 min
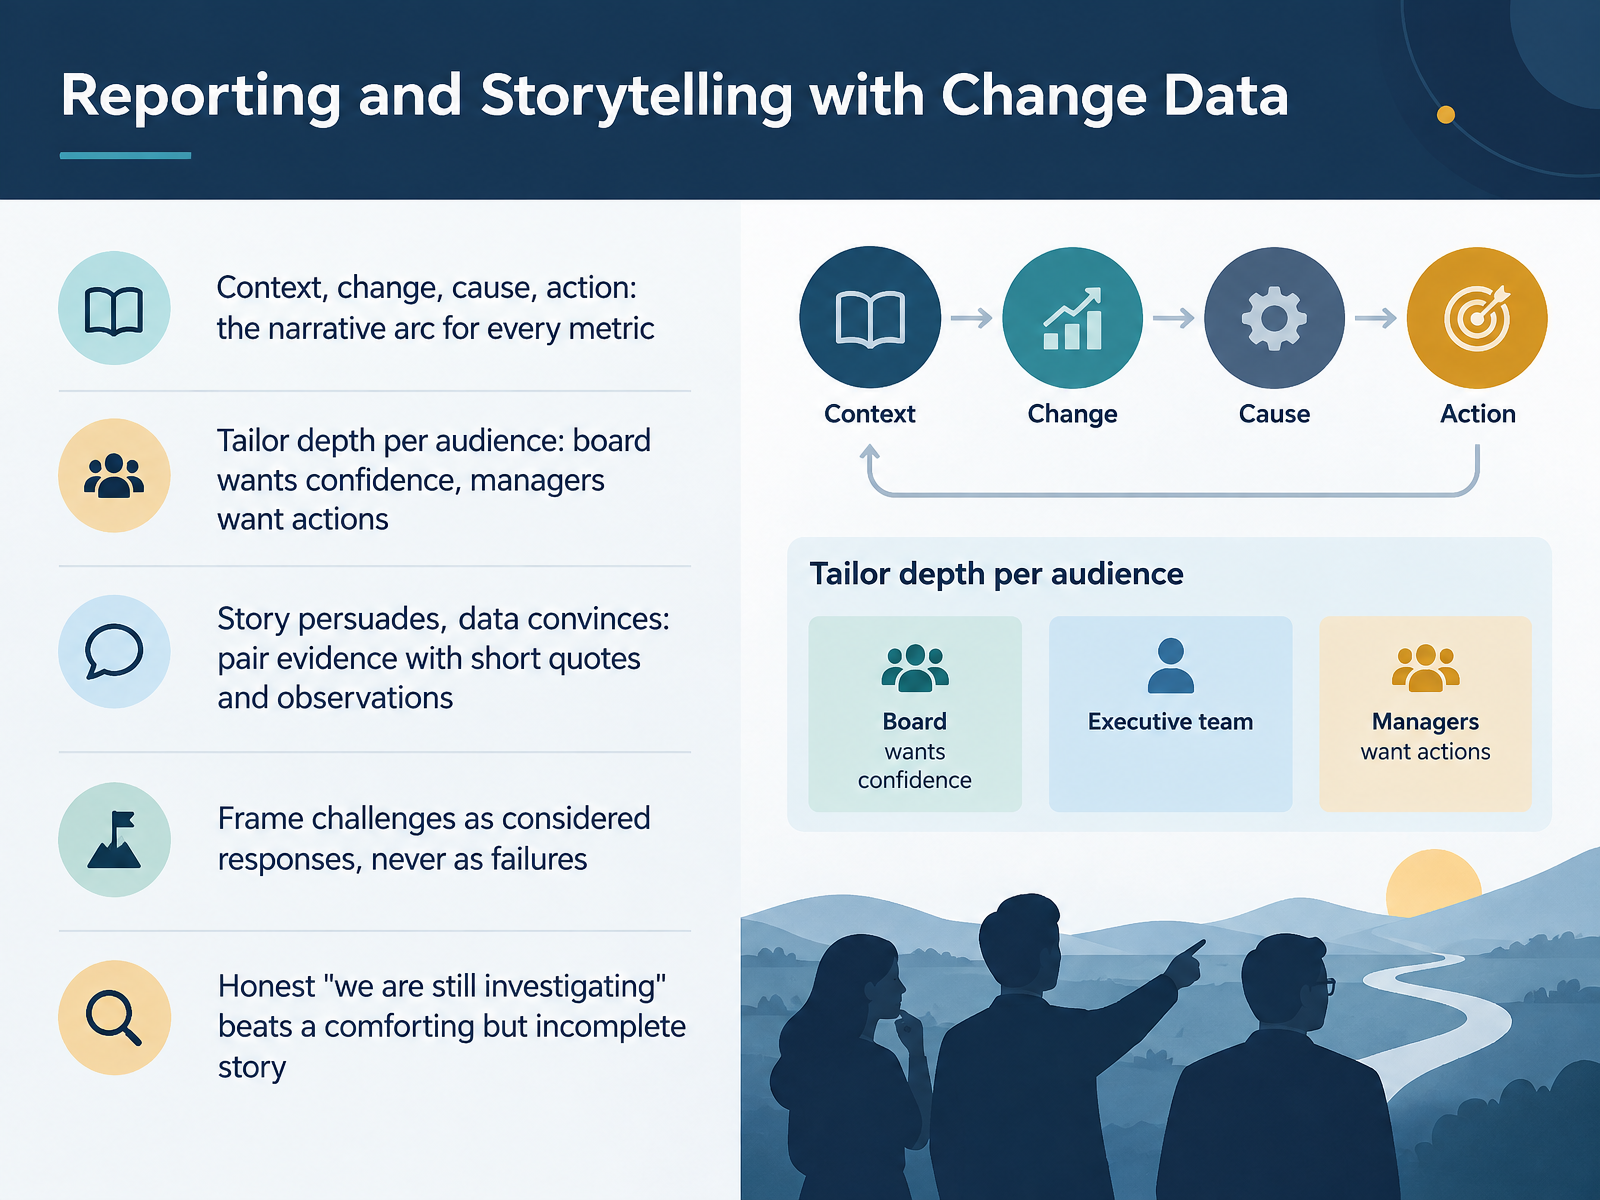
 - 09Reporting and Storytelling with Change DataLet's look at reporting and storytelling with change data. A number on its own rarely moves anyone. Every metric you present should follow one arc: context, what changed, the likely cause, and the action. For example, training completion fell short in Finance, engagement dipped during month end, so sessions are being rescheduled. That is a story, not a data dump. Next, tailor the depth to your audience. Boards want confidence and early warning. Managers want specific actions and owners. Now, story persuades, data convinces. Pair your evidence with short quotes and direct observations. And frame challenges as considered responses, not failures. Saying you extended testing to protect launch quality lands very differently from saying the timeline slipped. When the cause is unclear, say so plainly. An honest we are still investigating beats a comforting but incomplete story. In practice, write one sentence for context, change, cause, and action before you present any metric. Next, we turn to common traps and failure modes in change metrics.
 thechangecompass.comtd.orgprosci.com1 min
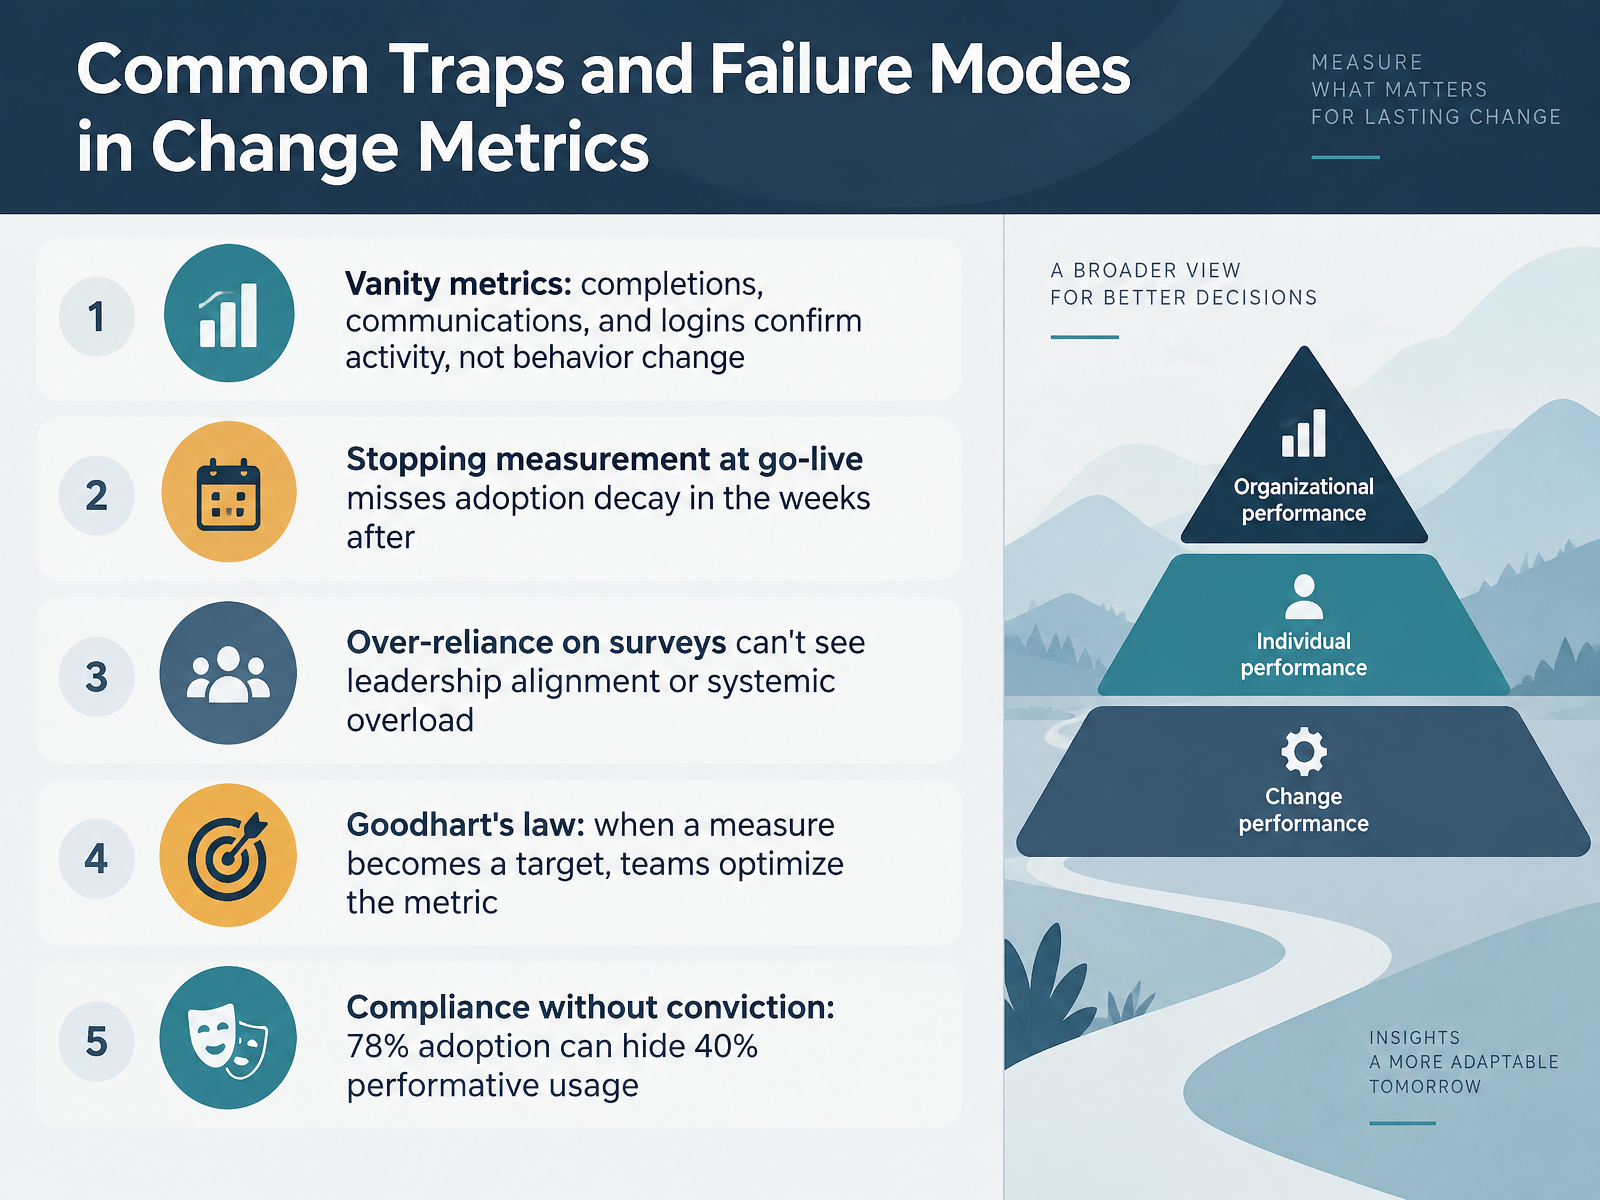
 - 10Common Traps and Failure Modes in Change MetricsLet us look at the common traps that distort change metrics. First, vanity metrics. Completions, communications, and logins confirm activity, not behaviour change. Second, stopping measurement at go-live. Adoption often decays in the weeks after launch, so keep tracking. Third, over-reliance on surveys. Surveys cannot see leadership alignment or systemic overload. Fourth, Goodhart's law. When a measure becomes a target, teams optimise the metric, not the outcome. And fifth, compliance without conviction. Seventy eight percent adoption can hide forty percent performative usage. Where teams often misread this is treating activity as evidence of change. So check the behaviour behind the number. Next, we move from thresholds to action in Closing the Loop: From Metric Threshold to Action.
 docs.aws.amazon.comexec.comtd.org+21 min
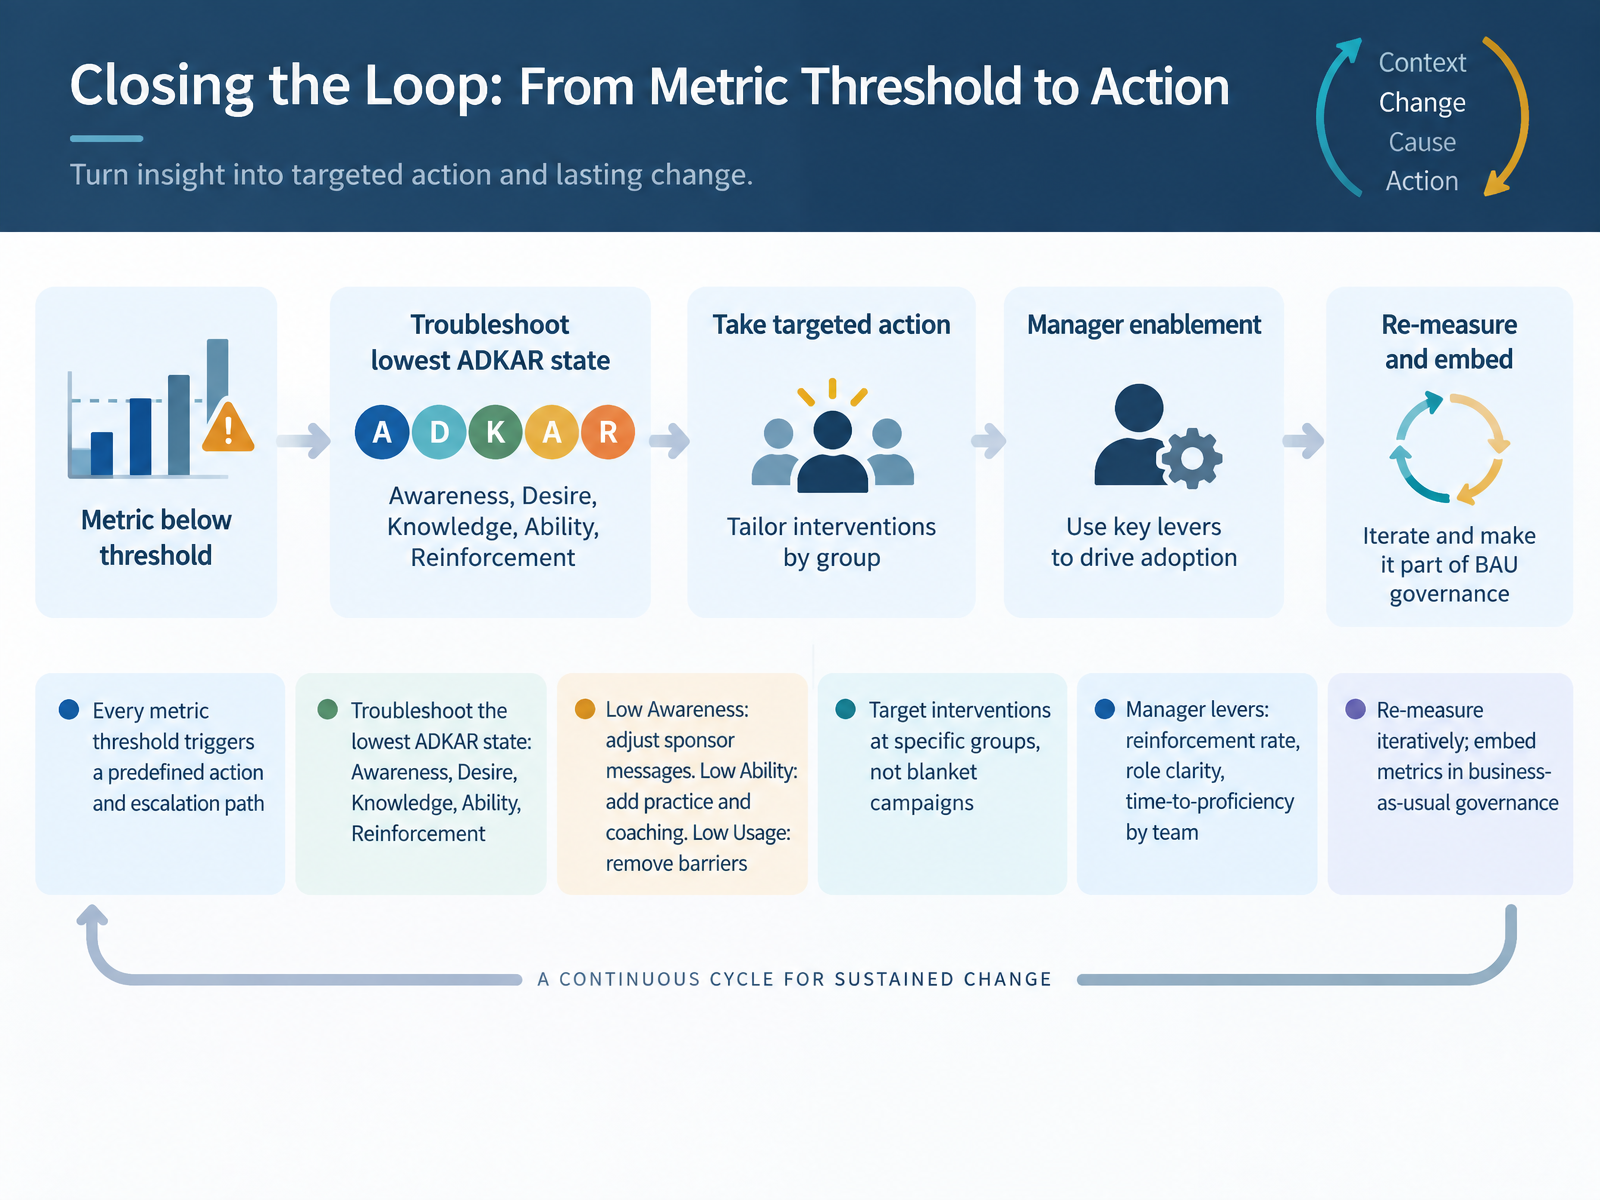
 - 11Closing the Loop: From Metric Threshold to ActionNow let's talk about closing the loop, moving from a metric threshold to a defined action. Every metric threshold you set should trigger a predefined action and escalation path. If a number moves and nobody knows what happens next, it is reporting noise, not a key performance indicator.
The practical starting point is to troubleshoot the lowest ADKAR state: Awareness, Desire, Knowledge, Ability, or Reinforcement. The weakest state is your bottleneck, so address it first.
What this means in practice. Low Awareness calls for adjusting sponsor messages. Low Ability calls for more practice and coaching. Low Usage usually means you should remove barriers, not push harder.
Aim interventions at specific groups, not blanket campaigns. And give managers clear levers: reinforcement rate, role clarity, and time-to-proficiency by team.
Then re-measure iteratively, and embed these metrics in business-as-usual governance so the loop keeps turning. Next, we explore sustaining adoption, proficiency, reinforcement, and regression risk.
 thechangecompass.comtd.orgprosci.com+22 min
 - 12Sustaining Adoption: Proficiency, Reinforcement, and Regression RiskLet's talk about sustaining adoption, because the period after go-live is where many benefits quietly slip away.
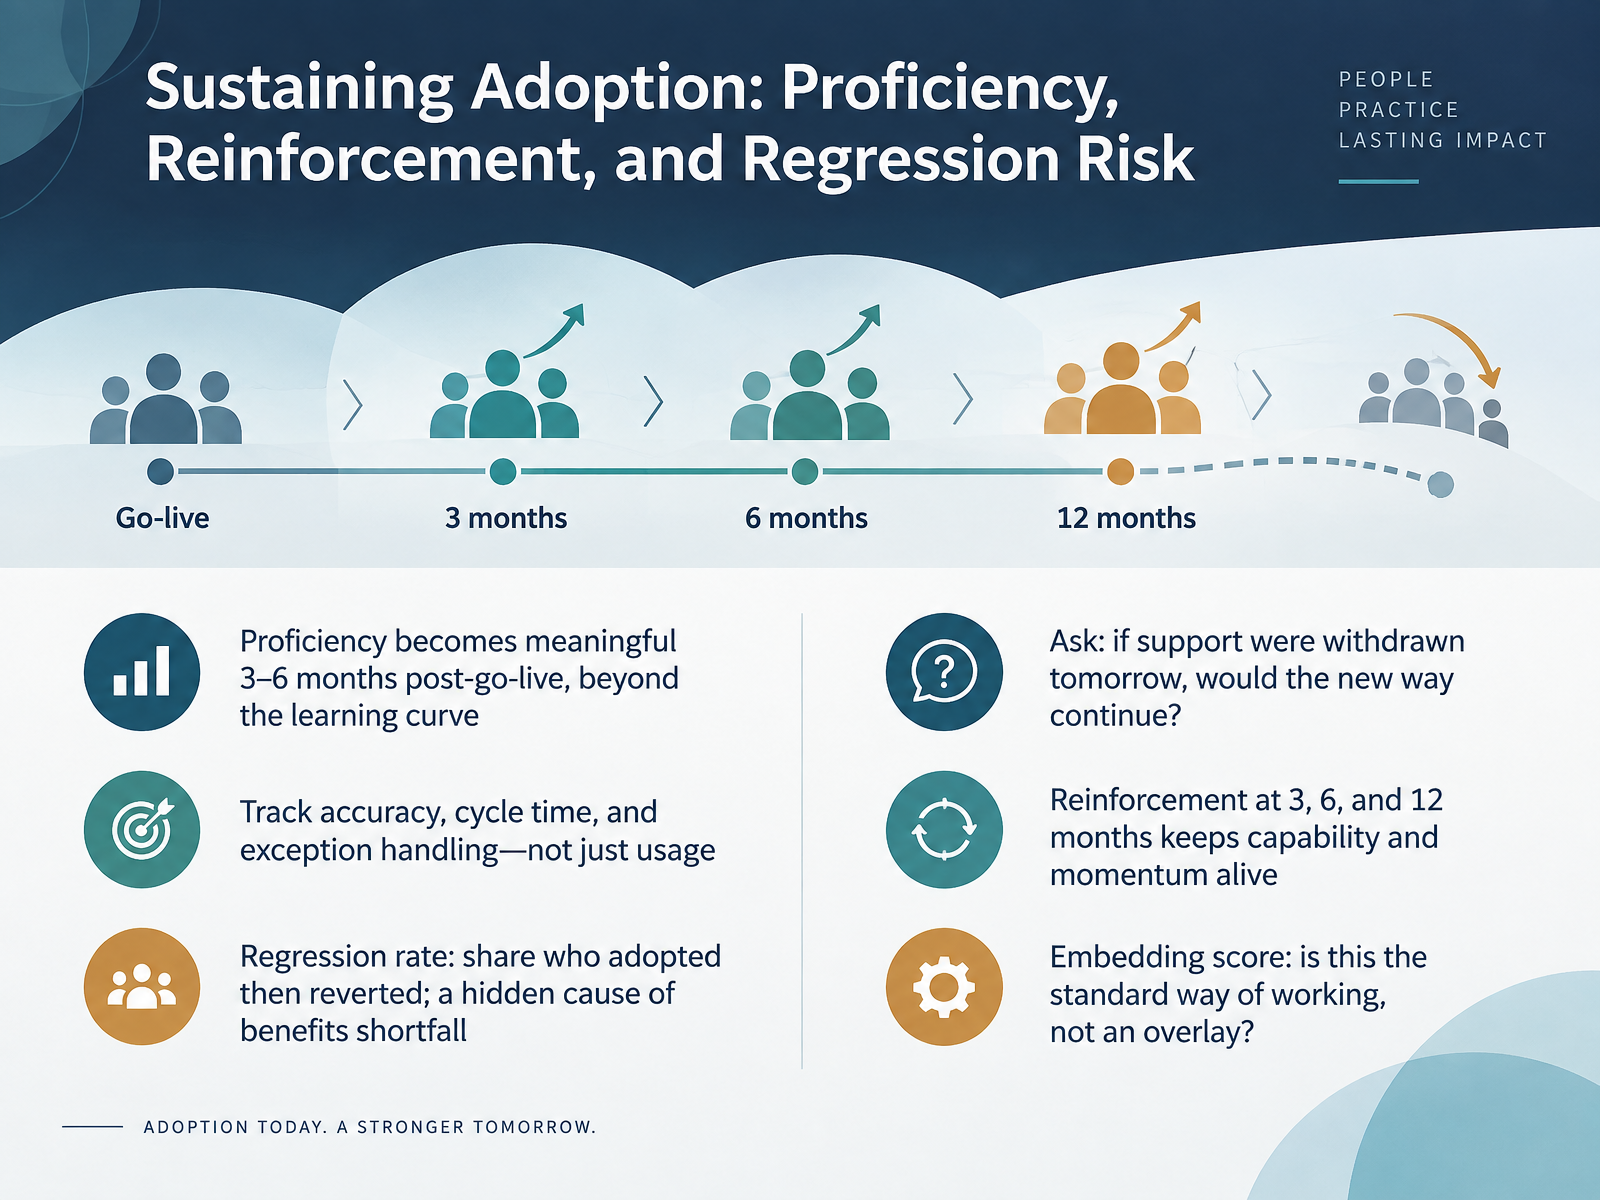
Proficiency becomes meaningful three to six months after go-live, once the learning curve has passed. So don't track usage alone. Track accuracy, cycle time, and exception handling. What this means in practice: a team can log in every day and still work around the new process.
Watch your regression rate, the share of people who adopted and then reverted. It is a hidden cause of benefits shortfall, and it is usually invisible without deliberate measurement.
Here is a useful test. If support were withdrawn tomorrow, would the new way continue? Reinforcement at three, six, and twelve months keeps capability and momentum alive.
Finally, ask whether this is now the standard way of working, not an overlay on old habits. That is your embedding score.
Next, we'll apply this. Practical Application: Interpreting a Sample Adoption Dataset.
 docs.aws.amazon.comexec.comtd.org+22 min
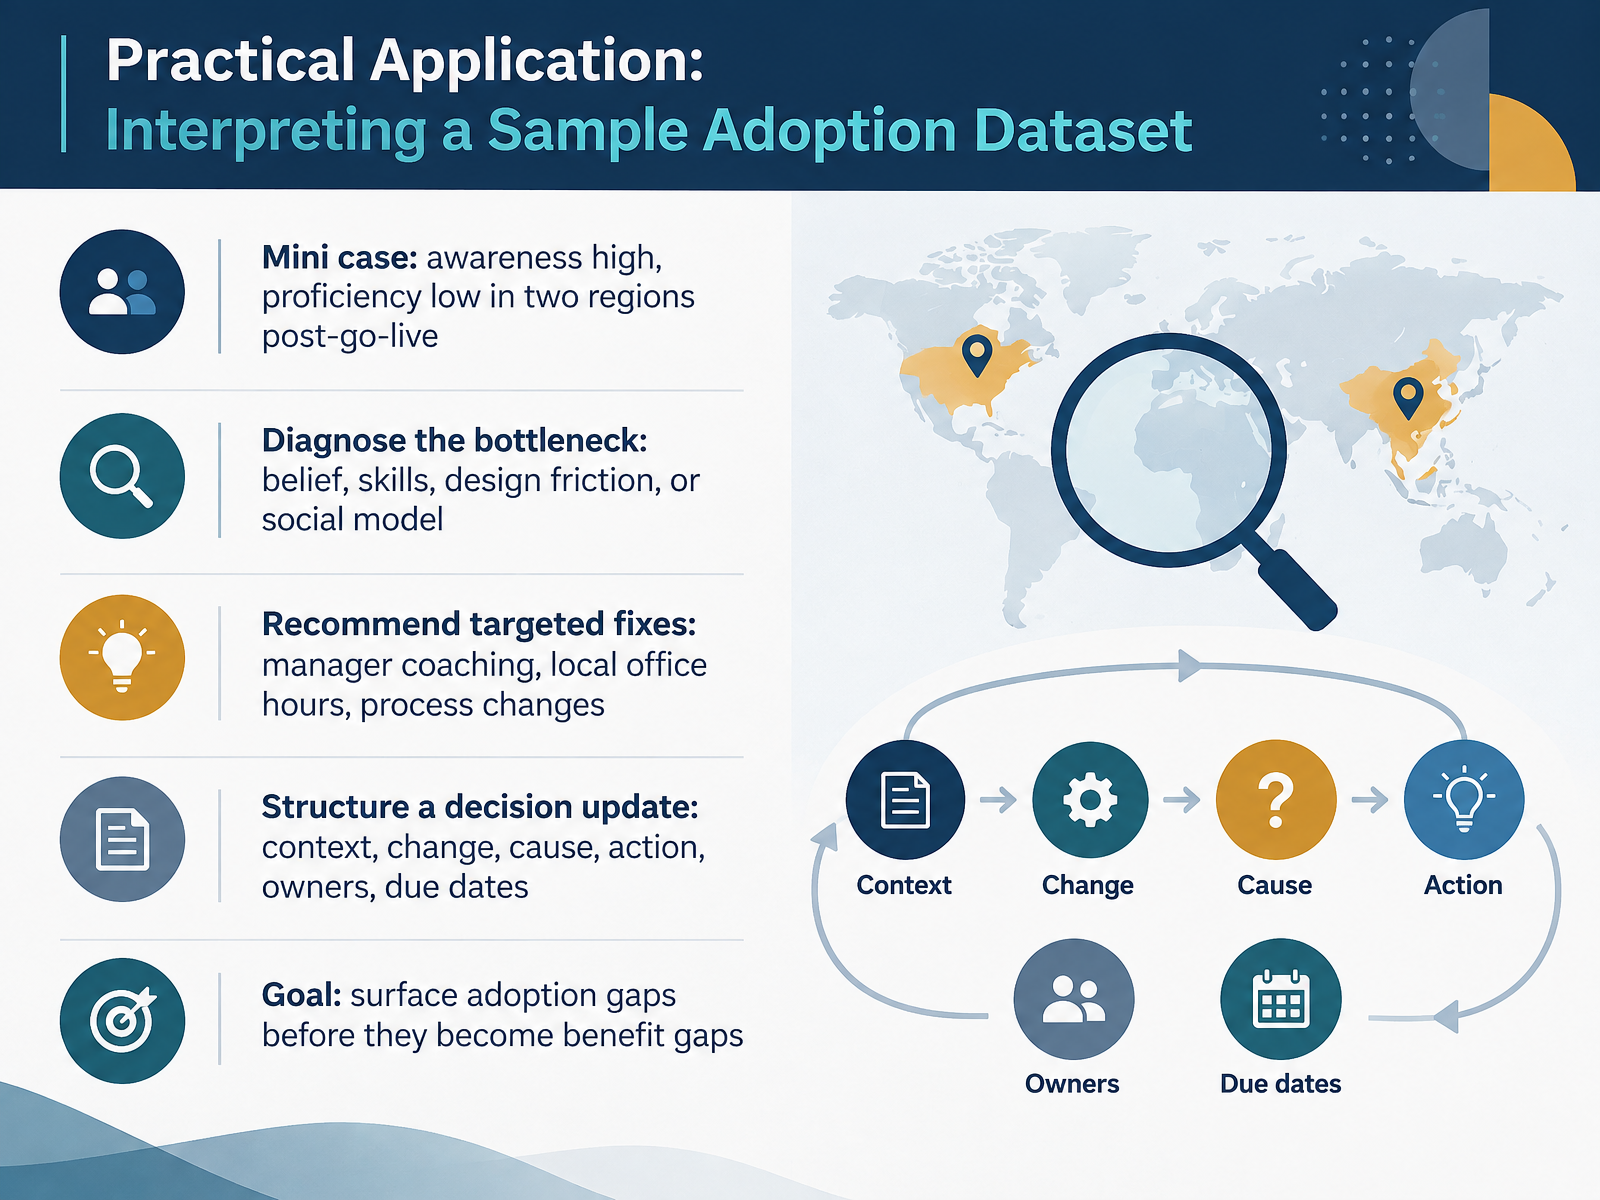
 - 13Practical Application: Interpreting a Sample Adoption DatasetLet's put this into practice with a short case. After go live, awareness is high, but proficiency is low in two regions. People know the change happened. They simply cannot yet perform it well. What this means in practice is that the bottleneck is not communication. It is likely belief, skills, design friction, or the social model in those teams. So how do you diagnose it? Ask what is actually blocking quality. Where teams often misread this is assuming low proficiency means low motivation. Often it is missing manager coaching, unclear steps, or practical barriers. Your fixes should be targeted. Add manager coaching, run local office hours, and adjust process steps that create friction. Then structure a short decision update: context, the change you observed, the likely cause, the action, owners, and due dates. The goal is simple. Surface adoption gaps before they become benefit gaps. Next, let's turn this into your own action plan, with a checklist and a thirty day commitment.
 adopt-it.aiprosci.comdocs.aws.amazon.com+21 min
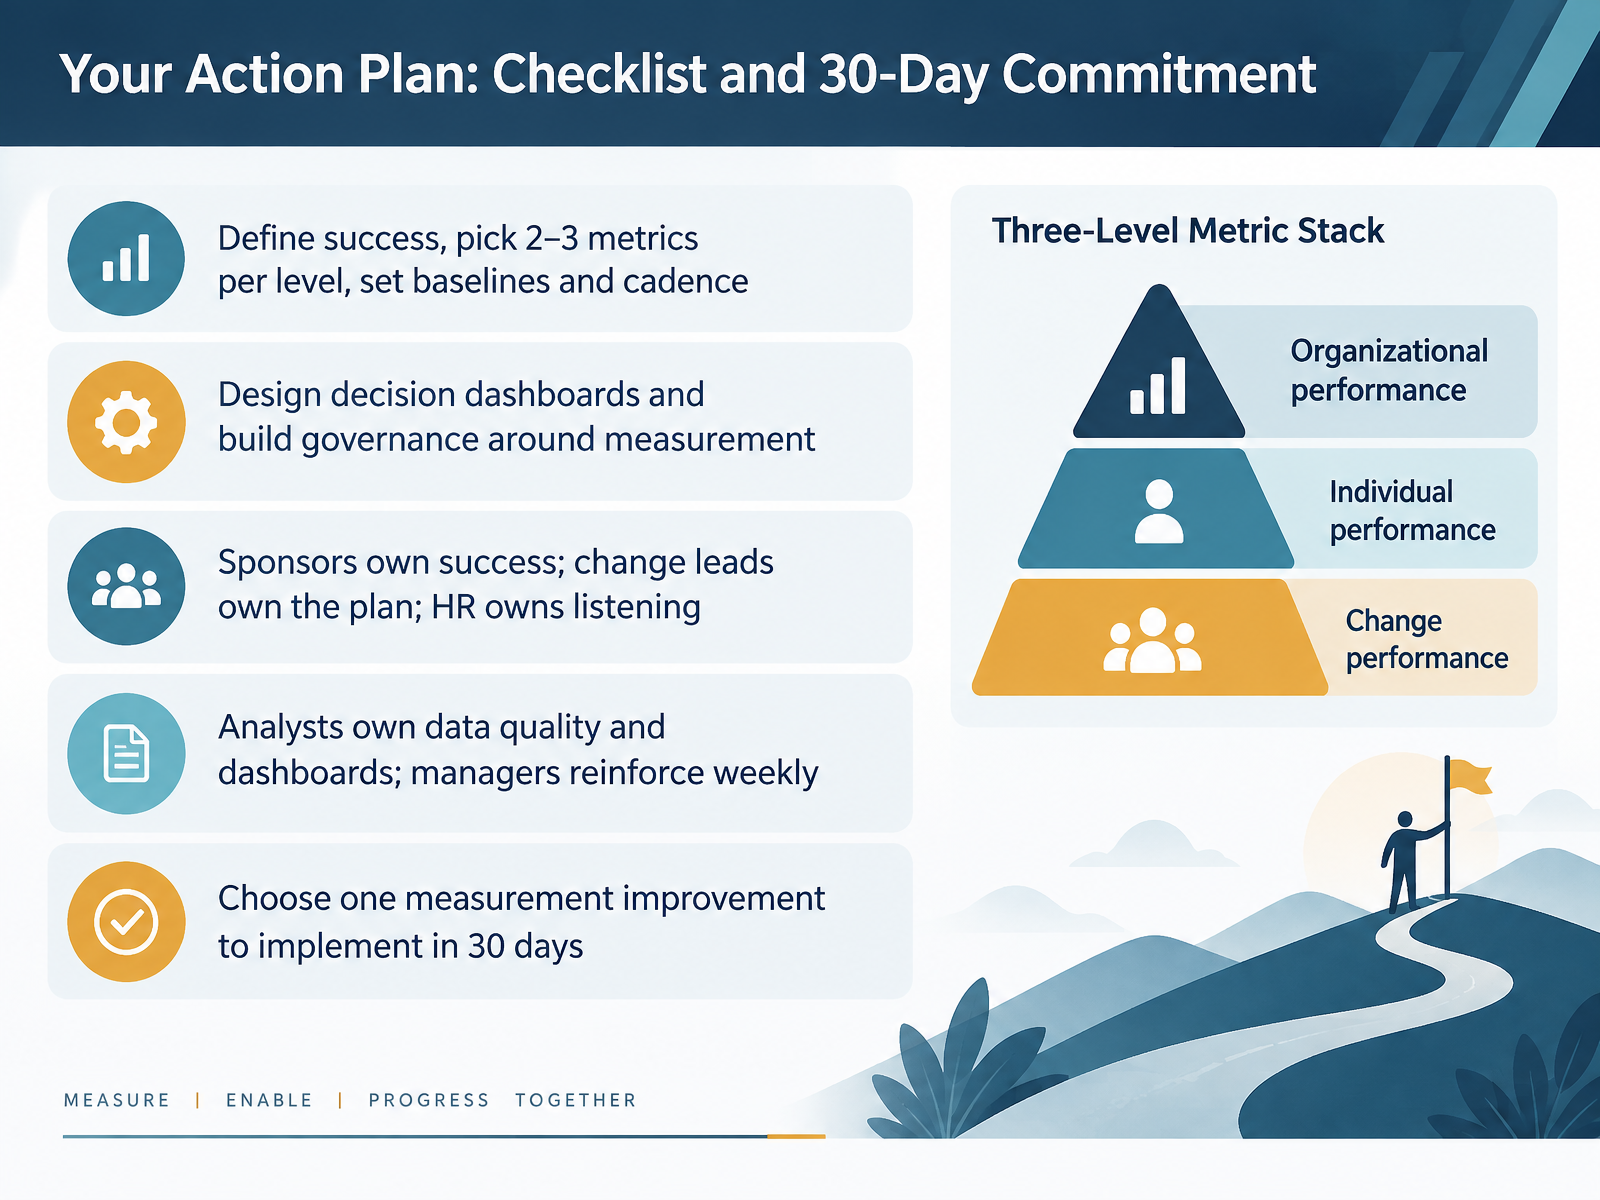
 - 14Your Action Plan: Checklist and 30-Day CommitmentLet's bring it together with a practical action plan. First, define what success looks like, then pick just two or three metrics per level. That means leading indicators, adoption indicators, and impact indicators. Set a baseline for each one and agree on a reporting cadence. Next, design dashboards that drive decisions, not just display data, and build governance around your measurement. Ownership matters here. Sponsors own success. Change leads own the plan. Human resources owns listening. Analysts own data quality and dashboards, and managers reinforce the new standard every week. Finally, choose just one measurement improvement to implement in the next thirty days. Keep it small and specific. For example, add a weekly friction review, or define a single source of truth for one key metric. Thank you for working through this course. Start with one change, make it visible, and let the evidence guide your next step. You are ready for this.
 thechangecompass.comculturemonkey.ioprosci.com+22 min
Take the deck with you
Download this course as a file — free, no sign-up needed.
- PDF handoutEvery slide page, ready to print or share.15 pages · 3.4 MBDownload
- Narrated PowerPointThe deck that presents itself — every slide carries the digital human's narration video.15 pages · 14.6 MBDownload
- PowerPoint slidesThe full deck as a .pptx — open it in PowerPoint, Keynote, or Google Slides.15 pages · 3.3 MBDownload
Free to use in your own training — please keep the PersonWise credit page at the end.
Have your own deck? Turn it into a course
Sources consulted
Web sources consulted while building this course.
- Best Practices in — prosci.com
- Explore the Best Practices in Change Management - 12th Edition Customizable Comparative Report — empower.prosci.com
- Change Management Success - Prosci — prosci.com
- Metrics for Measuring Change Management - Prosci — prosci.com
- https://www.prosci.com/blog/change-management-best-practices — prosci.com
- 1.7 Change adoption metrics — docs.aws.amazon.com
- 15 Essential Change Management Metrics | Implementation Guide | Exec Learn — exec.com
- A Laddered Approach to Measuring Change — td.org
- How to measure change management success — thechangecompass.com
- The ultimate guide to measuring change management outcomes in 2026 - The Change Compass — thechangecompass.com
- How to create a change measurement plan [Examples] — wendyhirsch.com
- Change Success Metrics Template — sorenkaplan.com
- Template 5 — People and Change KPI Tree | COMPEL Framework — compelframework.org
- 18. Change Measurement | Change Blueprint | University of Exeter — exeter.ac.uk
- 40+ Change Management Survey Questions (2026) — culturemonkey.io
- Collect Employee Feedback That Improves Change Adoption and Reduces Resistance | Adopt It Help Center — adopt-it.ai
- Change Management Survey Guide: Measure Readiness & Adoption | Koji — koji.so
- Change Management Survey Questions: 30 Questions for Every Phase of Change — vantagecircle.com
- Pre-change baselines predict adoption better than post-change surveys: a listening-first approach to change management — employee-feedback.net
- Adoption Assessments in Change Management | Adopt It Help Center — adopt-it.ai