Earthquakes: Faults, Plates, and Waves
Begin
16 pages · ~32 min
Earthquakes: Faults, Plates, and Waves
This training explains the science of earthquakes, including fault types, plate tectonics, and seismic waves, for learners seeking foundational geoscience knowledge.
What you’ll learn
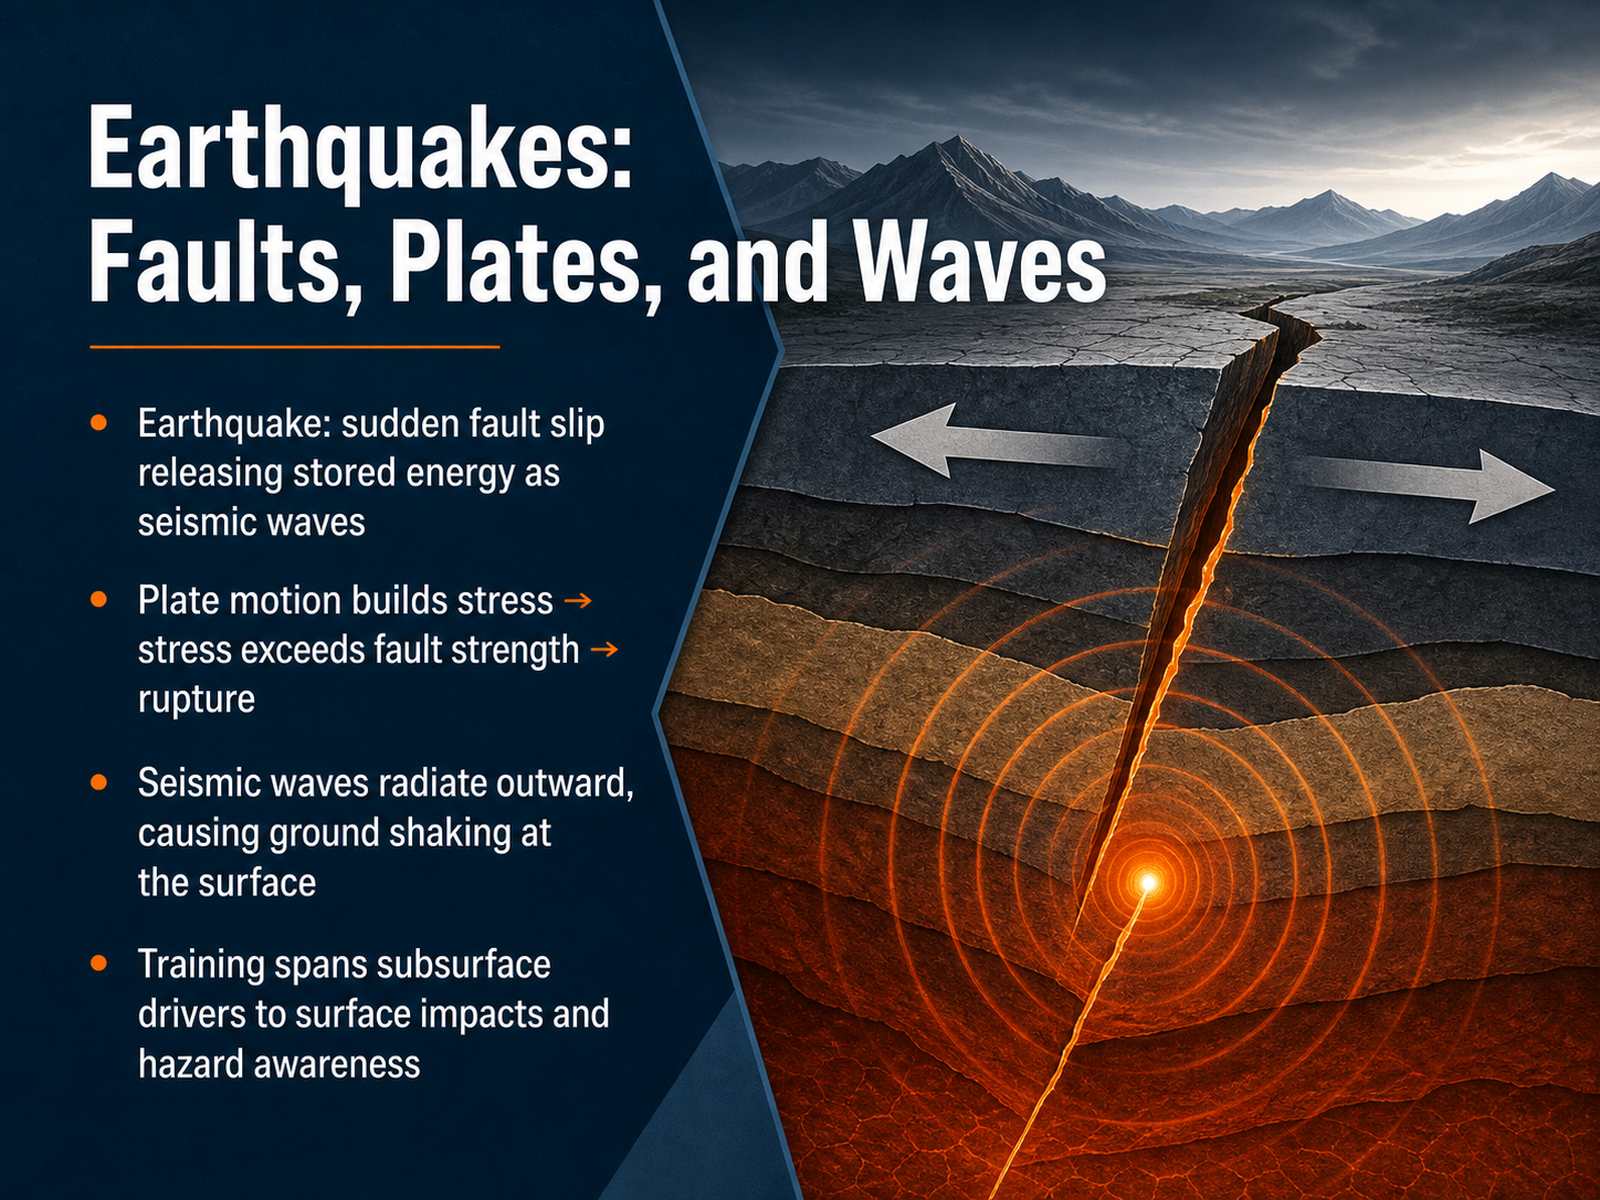
- 01Earthquakes: Faults, Plates, and WavesWelcome. In this training, we’re going to explore how earthquakes happen, starting deep underground and following the energy all the way to the ground beneath our feet. The title of this module is Earthquakes: Faults, Plates, and Waves. Let’s frame what that means. An earthquake is a sudden slip on a fault that releases stored energy in the form of seismic waves. The process begins with plate motion. As tectonic plates move, stress slowly builds up on a fault. Eventually the stress exceeds the strength of the fault, and it ruptures. That rupture sends seismic waves radiating outward in all directions, and when those waves reach the surface, they cause the shaking we feel. Over this training, we’ll connect these subsurface drivers, the fault slip and the waves, to the surface impacts and, importantly, to hazard awareness. Up next, we’ll step back and look at Earth’s interior and the foundation of plate tectonics.2 min
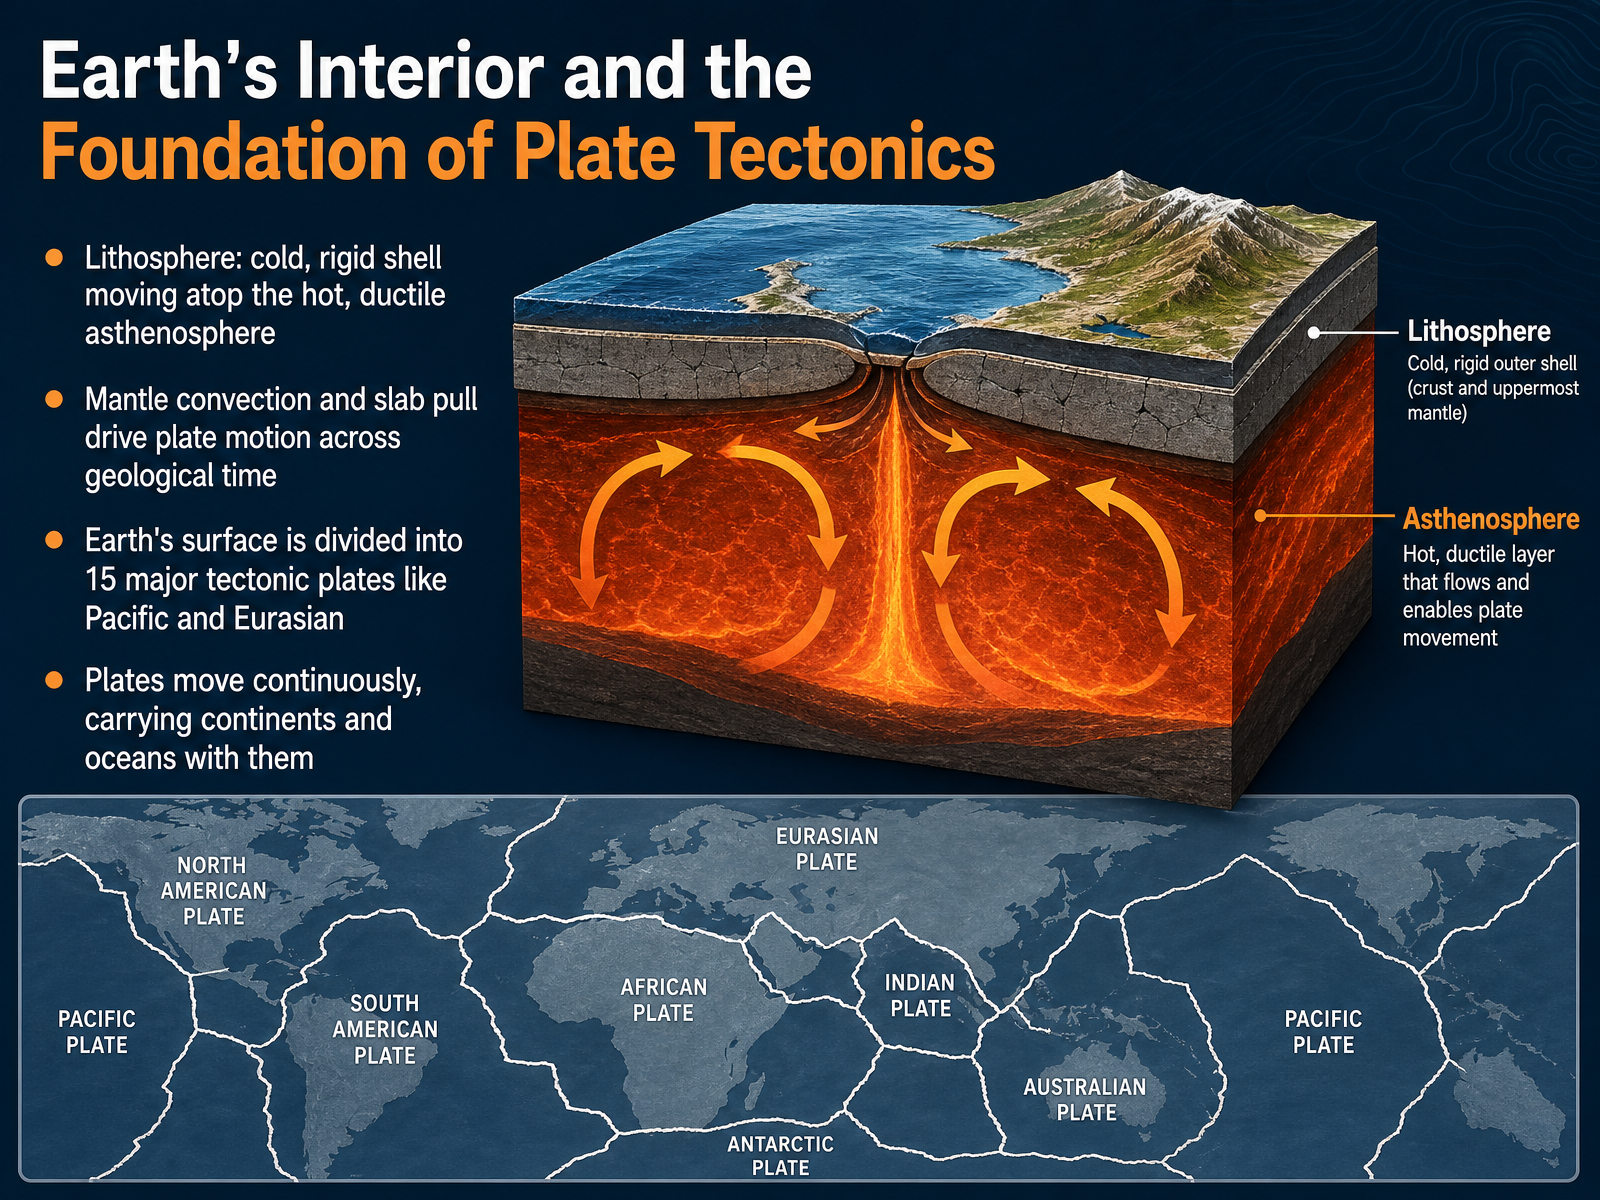
- 02Earth's Interior and the Foundation of Plate TectonicsMoving from the big picture, let's now explore the engine that drives everything: Earth's interior. We begin with the lithosphere. Think of it as a cold, rigid shell, broken into pieces that sit atop a hotter, more ductile layer called the asthenosphere. The asthenosphere flows very slowly, like warm tar. This contrast between a brittle shell and a flowing layer is the foundation of plate tectonics. So what actually moves these plates? Two main forces are at work. Mantle convection, where heat from the core rises and cooler material sinks, creates a slow churning motion. This works alongside slab pull, where the dense edge of a plate sinks into the mantle, dragging the rest of the plate with it. These forces split Earth's surface into about fifteen major tectonic plates. You'll recognize names like the Pacific Plate and the Eurasian Plate. These rigid pieces are in continuous motion, carrying entire continents and ocean basins with them across geological time. Now that we understand the plates and what moves them, let's look at where they meet. The next slide covers plate boundaries, where the real action happens.
 iasnova.comwww-udc.ig.utexas.edugeology.com+22 min
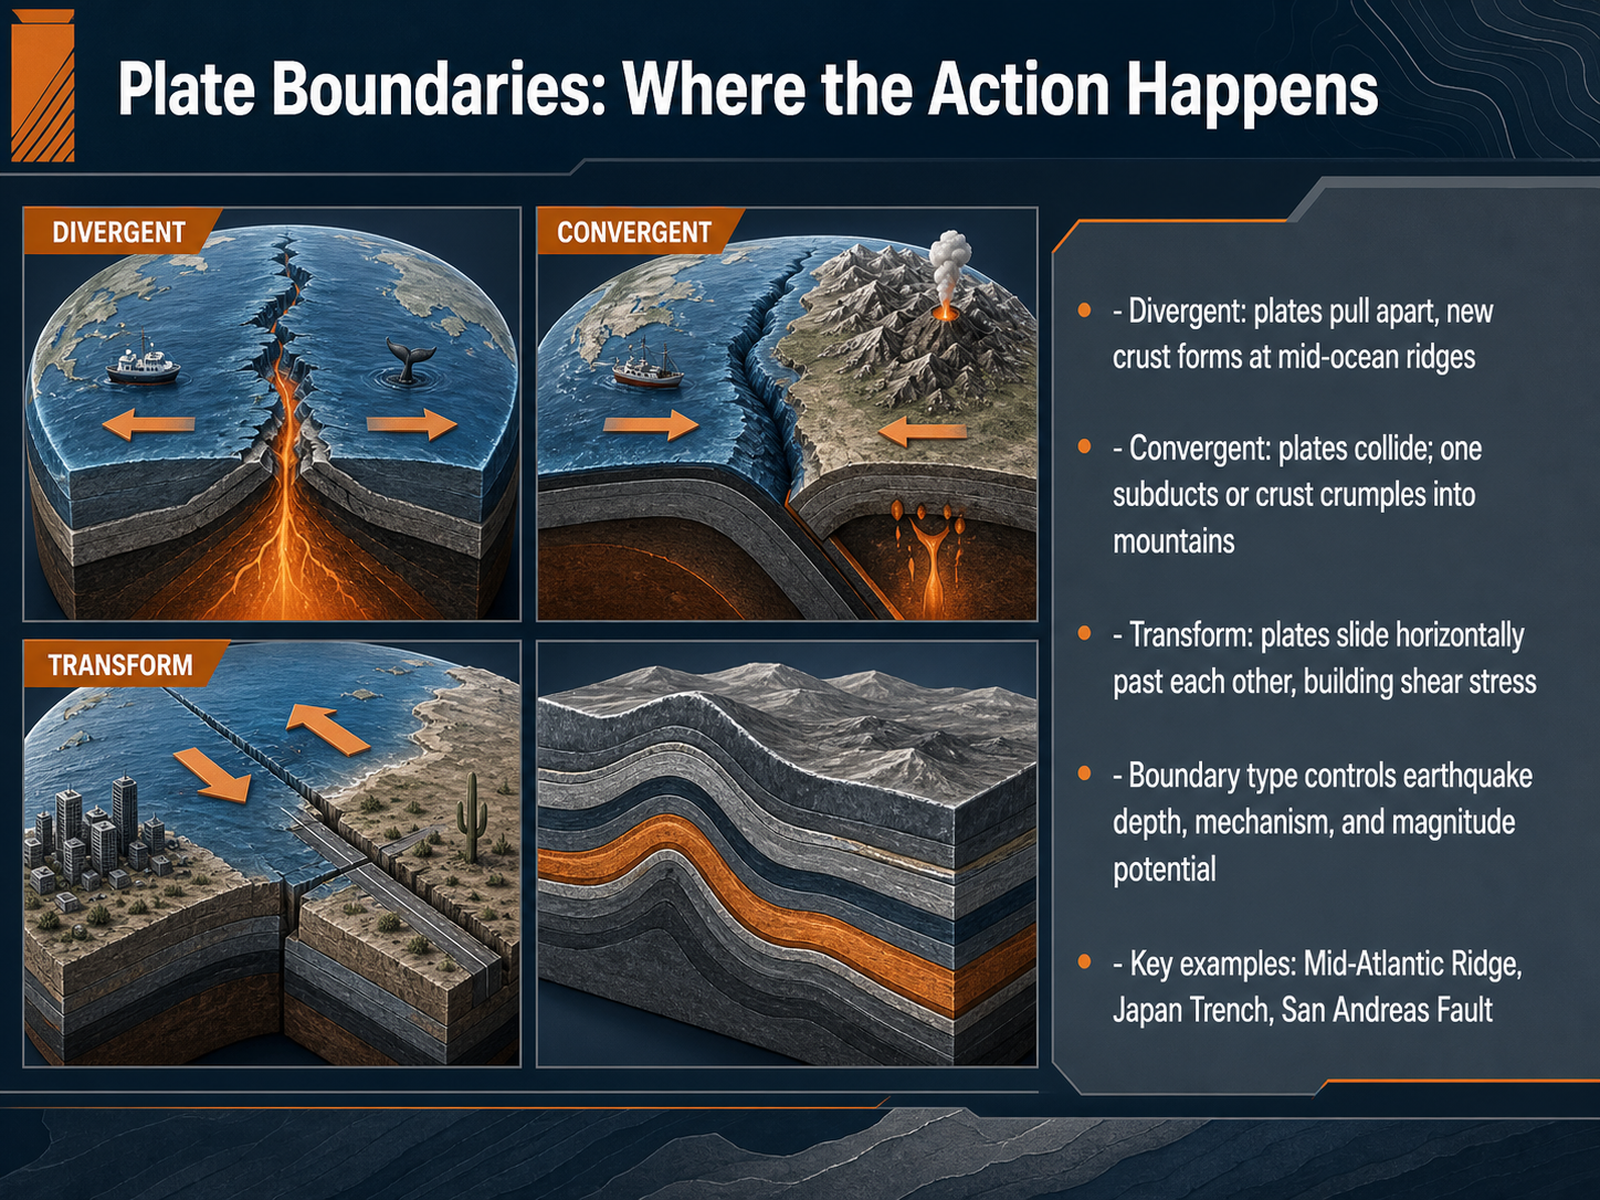
 - 03Plate Boundaries: Where the Action HappensNow we arrive at plate boundaries, which are truly where the action happens. The type of boundary between two plates directly controls the earthquakes we feel. Let’s look at the three main types. First, divergent boundaries. Here, plates pull apart, and new crust forms as magma rises, like at the Mid-Atlantic Ridge. Second, convergent boundaries. Plates collide, and one may be forced down in a process called subduction, or the crust crumples to build mountains. The Japan Trench is a classic example. Third, transform boundaries. Here, plates slide horizontally past each other, building intense shear stress until they slip. The San Andreas Fault is the most famous example of this. Ultimately, the boundary type dictates an earthquake’s depth, its mechanism, and its maximum potential magnitude. Up next, we will examine the actual fractures where this energy is released, in our discussion of faults.
 iasnova.comwww-udc.ig.utexas.edugeology.com+21 min
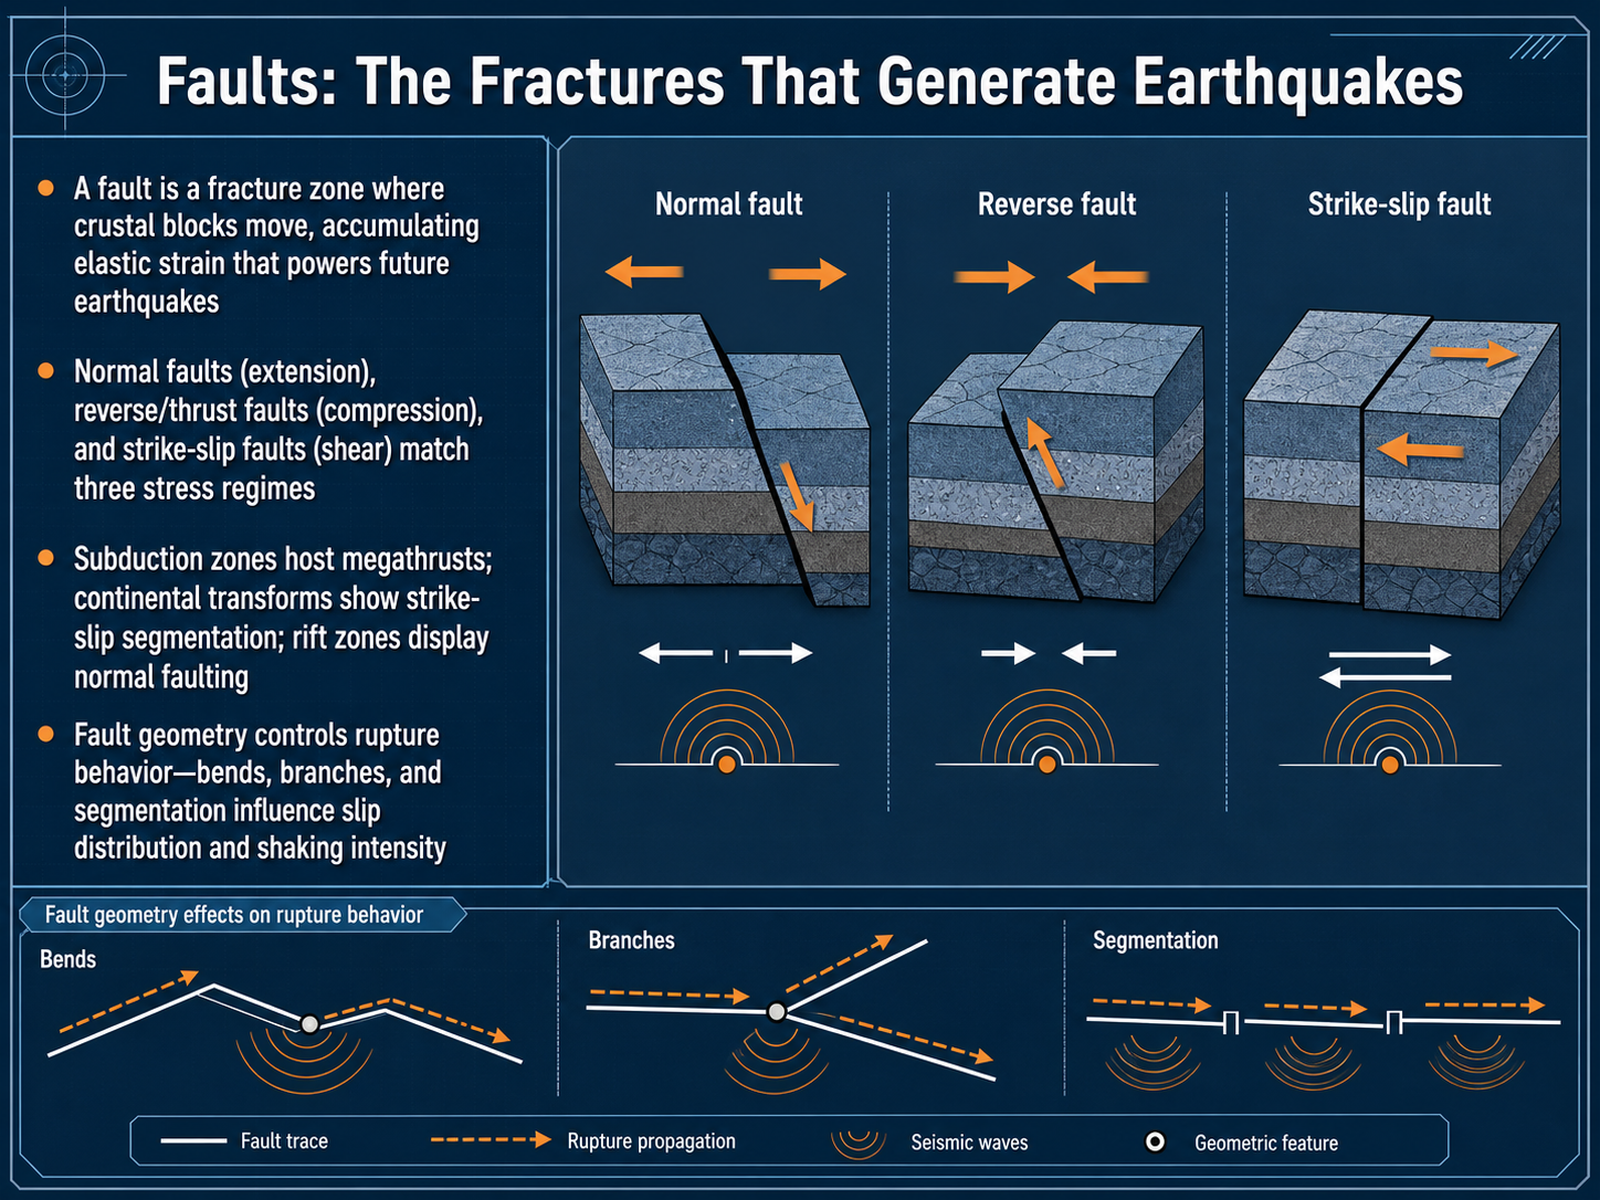
 - 04Faults: The Fractures That Generate EarthquakesNow let's focus on faults themselves, the actual fractures where earthquakes are born. A fault is a zone of broken rock where two crustal blocks have moved past each other. Over time, this motion locks the blocks together, causing elastic strain to build up, which powers future earthquakes. We classify faults by the stress regime that creates them. Normal faults form under extension, reverse or thrust faults under compression, and strike-slip faults under shearing. You can see these regimes play out in specific tectonic settings. Subduction zones, like Japan or Sumatra, host massive thrust faults called megathrusts. Continental transforms, such as Turkey's East Anatolian Fault, show segmented strike-slip systems, while rift zones in East Africa display networks of normal faults. Fault geometry is critical because it controls how rupture behaves. Bends, branches, and segment boundaries directly influence where slip concentrates and how intense the shaking becomes. For example, during the 2023 Turkey earthquake doublet, a rupture that began on a small splay fault cascaded onto the main fault strand, with rupture speed and shaking intensity changing dramatically at each geometric complexity. So, the shape of a fault is not just a map pattern, it fundamentally governs the earthquake's violence. Next, we will explore how this stored strain transforms into rupture, looking at the elastic rebound theory.
 science.orgnature.comnature.com+22 min
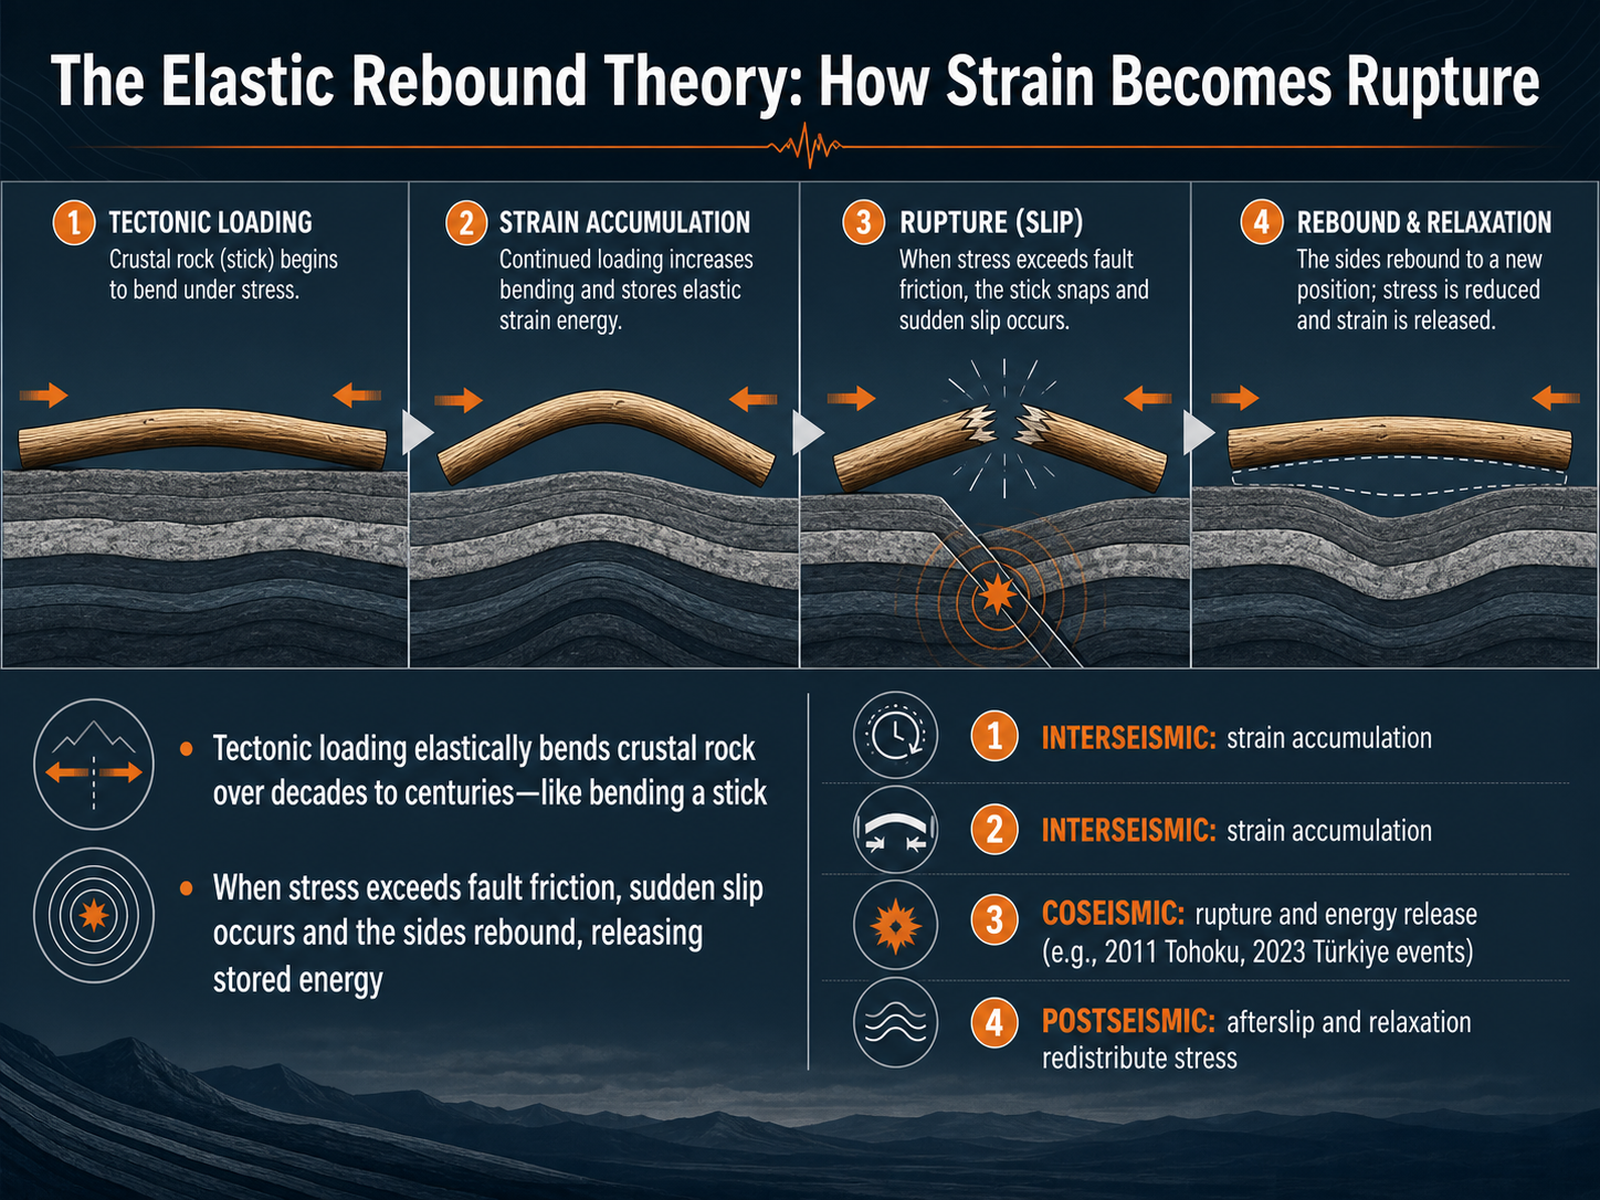
 - 05The Elastic Rebound Theory: How Strain Becomes RuptureNow let's explore the Elastic Rebound Theory, which explains how strain ultimately becomes rupture. Imagine bending a green stick. Over decades to centuries, tectonic loading similarly bends crustal rock, storing elastic strain energy. This long buildup phase is called the interseismic period. When accumulated stress finally exceeds the friction locking a fault, the rock breaks. The two sides suddenly slip past each other and rebound, releasing the stored energy all at once. This is the coseismic phase. The 2011 Tohoku earthquake off Japan is a powerful example: decades of plate convergence loaded the subduction zone until it ruptured, producing up to sixty meters of slip near the trench. The 2023 earthquake doublet in Türkiye shows even more complexity. The first magnitude 7.8 event started on a small splay fault, then cascaded bilaterally along the East Anatolian Fault with rupture speeds that at times exceeded the shear wave velocity. This is known as supershear rupture. After the main energy release, the postseismic phase begins. Slip continues more slowly, and stress redistributes around the fault zone through afterslip and relaxation. Next, we will look at the birth of seismic waves at the earthquake source.
 science.orgnature.comnature.com+22 min
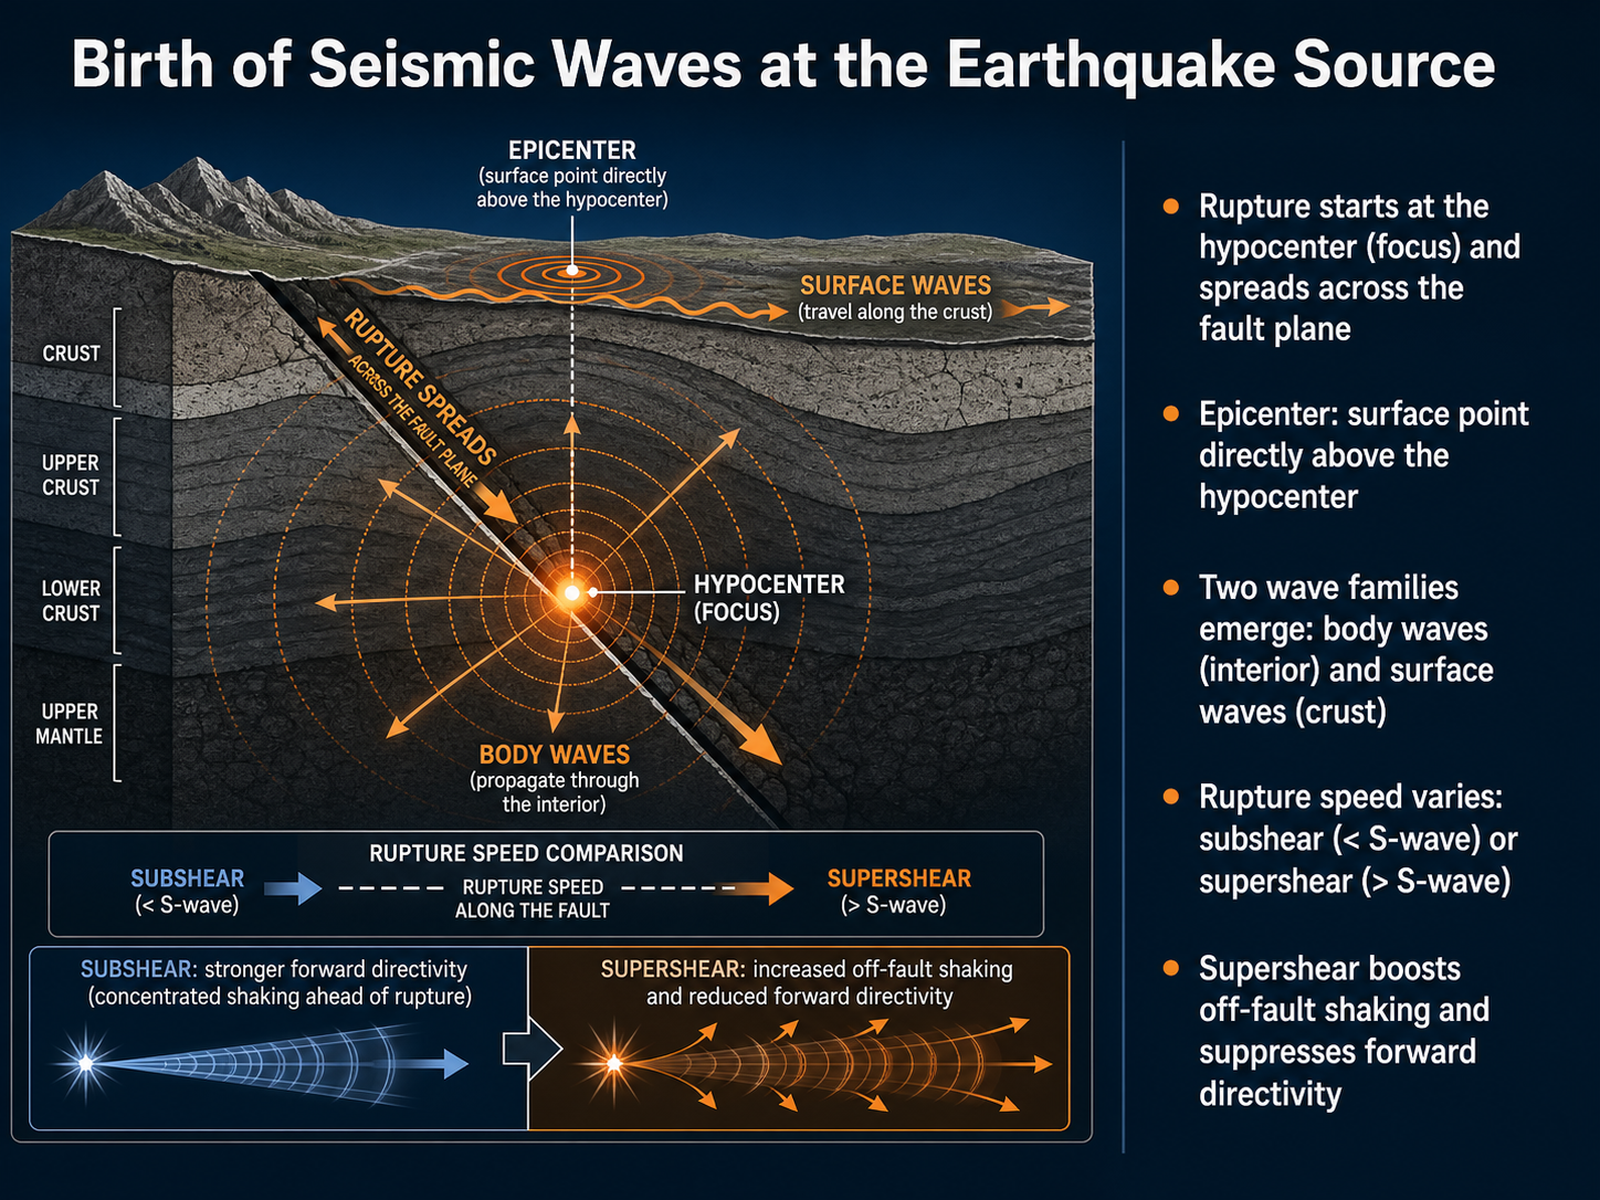
 - 06Birth of Seismic Waves at the Earthquake SourceNow let's focus on the very moment seismic energy is born. When an earthquake begins, rupture starts at a single point underground called the hypocenter, or focus. From there it spreads rapidly across the fault plane. The point on the Earth's surface directly above the hypocenter is the epicenter. As the rupture expands, it generates two main wave families: body waves, which travel through the Earth's interior, and surface waves, which are trapped in the crust. One fascinating variable is rupture speed. Often the rupture moves slower than the shear wave velocity of the rock, a condition we call subshear. But sometimes it can outpace the shear waves themselves, becoming what we call supershear. Supershear rupture changes the pattern of shaking significantly. It tends to boost ground motion off the fault line while suppressing the forward-directed energy pulse typical of subshear events. A powerful modern example comes from the 2023 Turkey earthquake doublet. Both magnitude 7.8 and 7.6 events showed segments of supershear rupture cascading across complex fault branches. Now that we've seen how waves emerge at the source, let's move into the two body waves themselves: primary P-waves and secondary S-waves.
 science.orgnature.comnature.com+22 min
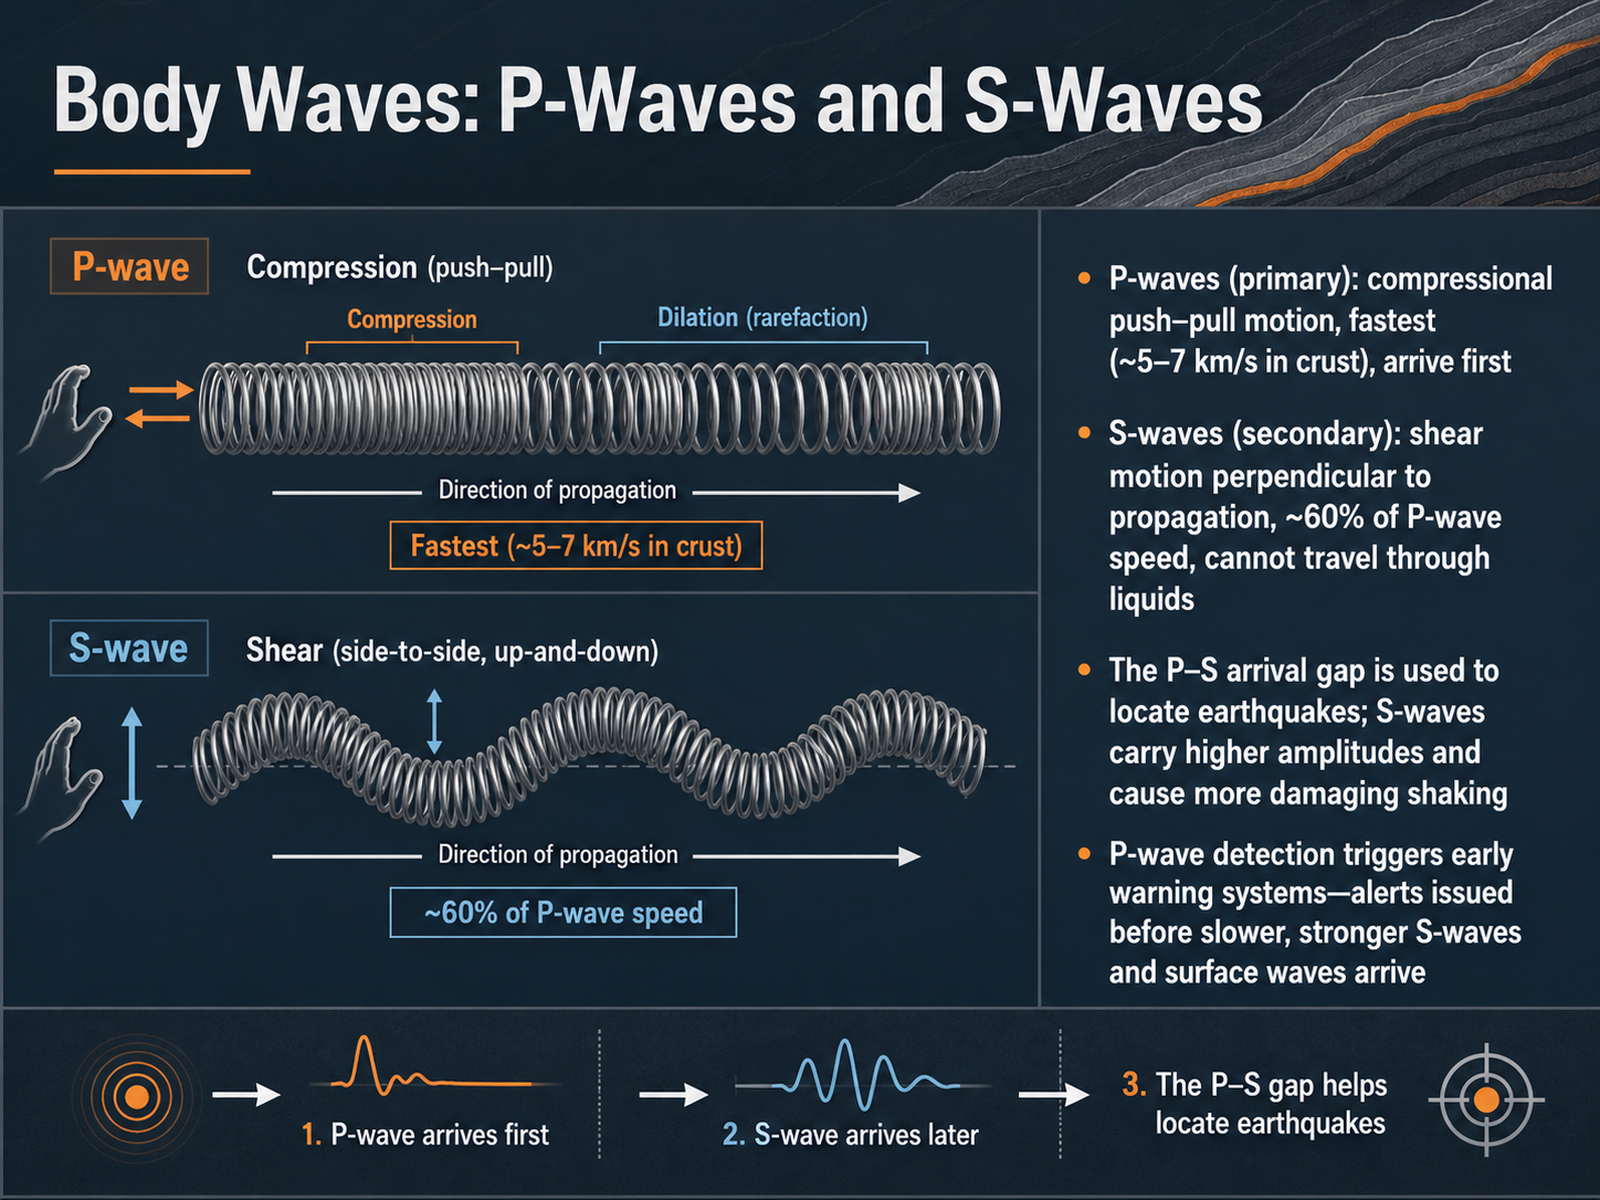
 - 07Body Waves: P-Waves and S-WavesNow we turn to the main types of body waves: P-waves and S-waves. Think of P-waves, the primary waves, as a push–pull motion, like a train car bumping into the next one. They compress and expand the rock in the direction they are traveling. Because of this, P-waves are the fastest seismic waves, moving through the crust at roughly five to seven kilometers per second, so they always arrive first. S-waves, or secondary waves, behave differently. They shear the rock, shaking it perpendicular to the direction of travel, like flicking a rope up and down. They travel at about sixty percent of P-wave speed and, crucially, cannot pass through liquid. This P-wave and S-wave speed difference gives us one of our most powerful tools: the time gap between their arrivals helps calculate how far away the earthquake is. In terms of impact, S-waves typically carry higher amplitudes, which is why the strongest shaking we feel often comes after the initial jolt. This sequence also makes modern early warning possible. When sensors detect the fast but weaker P-wave, automated systems can instantly process that signal and send out alerts before the more damaging S-waves and surface waves arrive. Now, body waves move through the Earth, but shaking at the surface also involves a different type of wave. Next, we will look at surface waves, specifically Love waves and Rayleigh waves.
 preview-nature.comarxiv.deeppaper.ainature.com+22 min
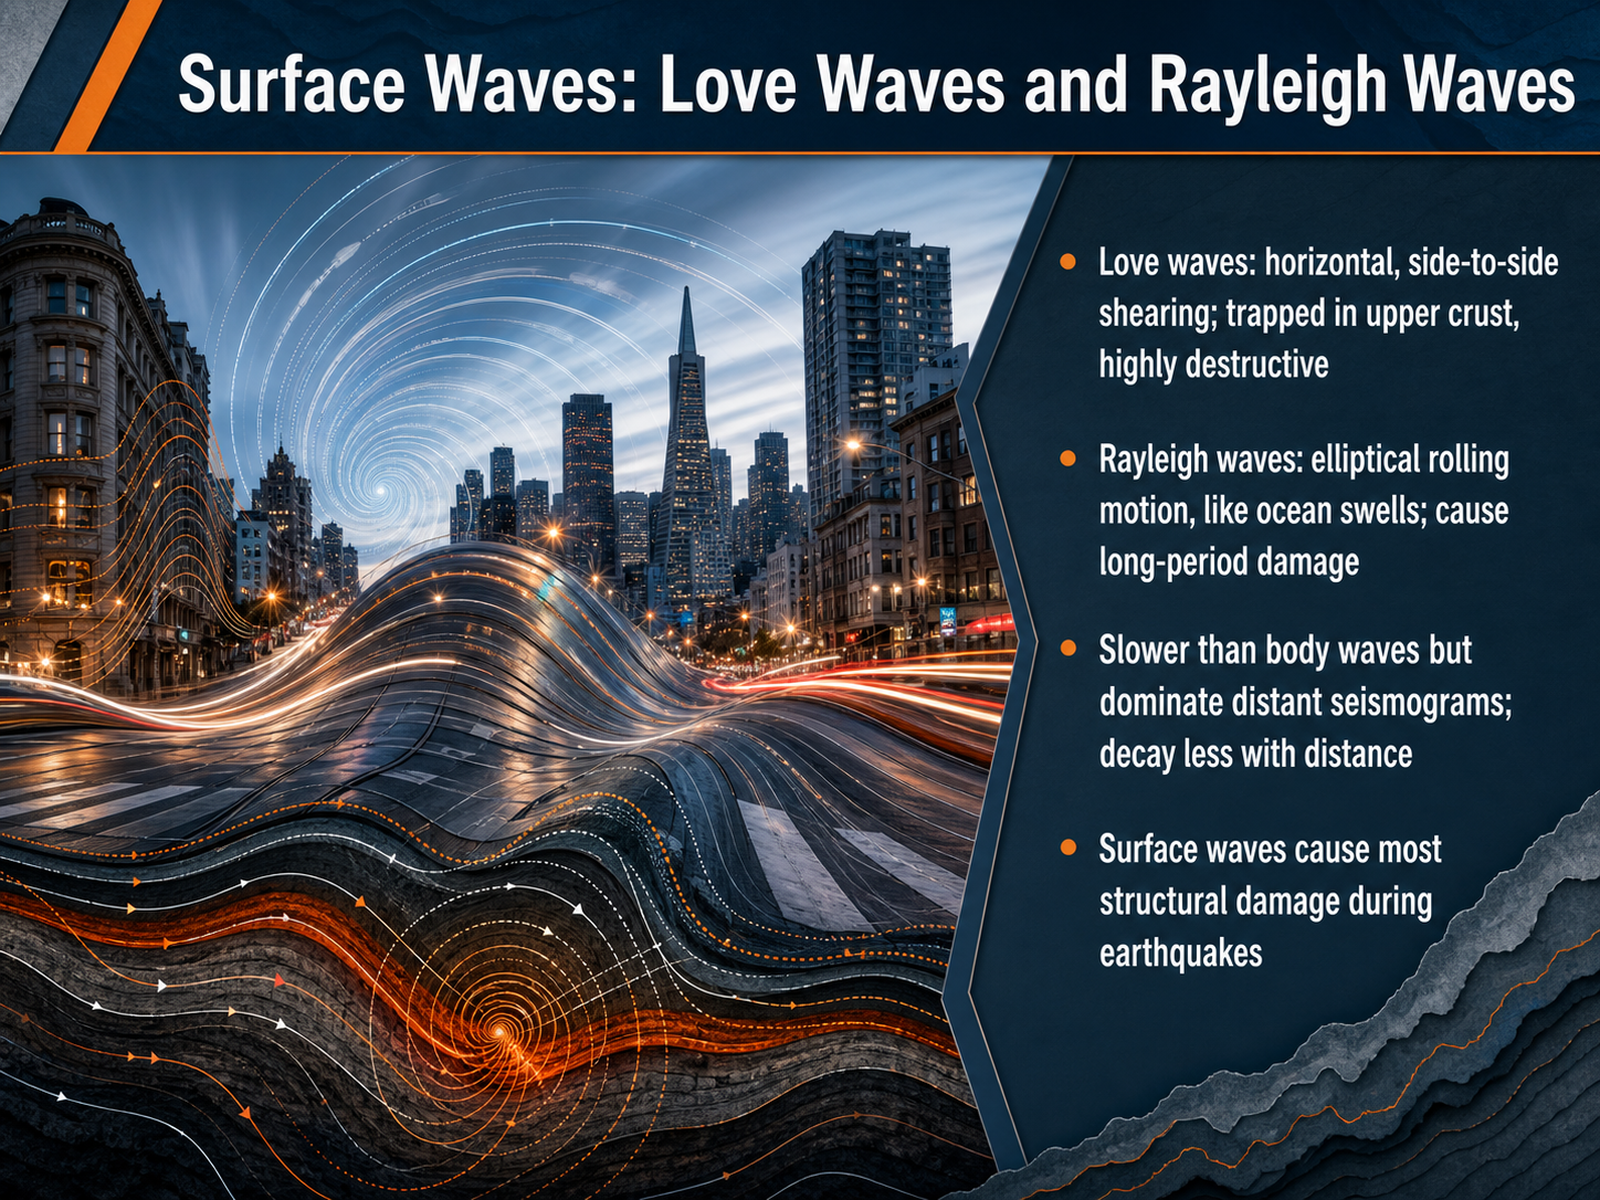
 - 08Surface Waves: Love Waves and Rayleigh WavesNow let's turn to the waves that actually cause the destruction we feel at the surface. When body waves reach the ground, much of their energy transforms into two types of surface waves. The first type is called Love waves. Think of these as a horizontal, side-to-side shearing motion. They shake the ground perpendicular to the direction the wave is traveling, and they are trapped in the upper crust. Because this motion is so effective at damaging building foundations, Love waves are highly destructive. The second type is Rayleigh waves. These move with an elliptical rolling motion, much like an ocean swell passing across the land. Rayleigh waves are slower than Love waves, but they cause significant long-period damage to tall structures. Both love and rayleigh waves are slower than body waves. However, they dominate distant seismograms because their amplitude decays far less with distance than the faster p and s waves. Most importantly, it is these surface waves that are responsible for the majority of structural damage during an earthquake. With that clear connection between wave type and destruction, let's step back and look at the complete rupture scenario, moving next to plates, faults, and waves together.
 preview-nature.comarxiv.deeppaper.ainature.com+22 min
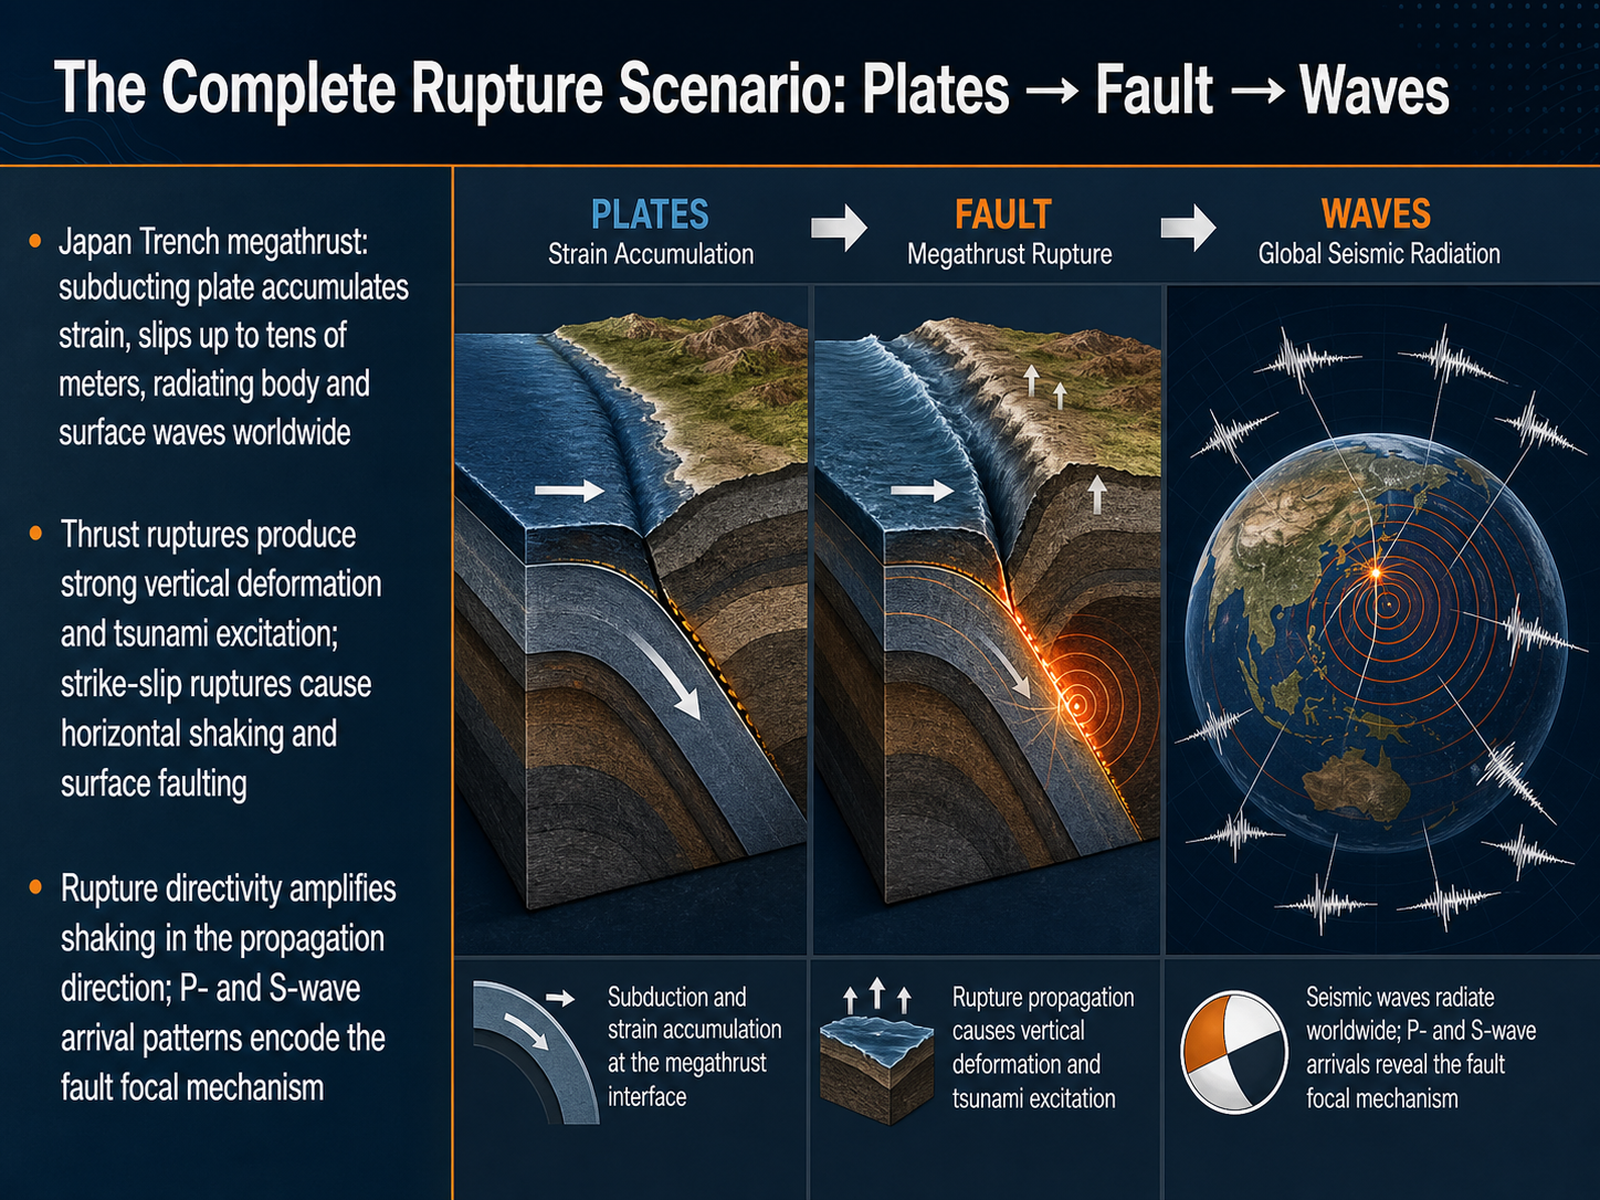
 - 09The Complete Rupture Scenario: Plates → Fault → WavesMoving from individual concepts to the big picture, let's look at the complete rupture scenario, tracing the chain reaction from plates, to faults, and finally to waves. Take the Japan Trench megathrust as an example. Here, the subducting Pacific plate slowly accumulates strain over centuries. When that strain is released, the fault can slip up to tens of meters in a single event, radiating body waves and surface waves that travel across the entire planet. The type of faulting shapes the kind of destruction that follows. Thrust ruptures, with their strong vertical deformation of the seafloor, are particularly efficient at exciting tsunamis. In contrast, strike-slip ruptures primarily produce horizontal shaking and visible surface faulting, as we saw in the 2023 Turkey earthquake doublet. Additionally, rupture directivity plays a critical role. The shaking is amplified in the direction the rupture propagates, much like the Doppler effect concentrates sound forward. And the specific pattern in which P- and S-waves arrive at seismic stations encodes the fault's focal mechanism, allowing us to work backward to understand exactly how the earth moved. Next, we'll build on these wave observations to explore how we measure the size of these events in the presentation on 'Measuring Earthquakes: Magnitude and Intensity'.
 science.orgnature.comnature.com+22 min
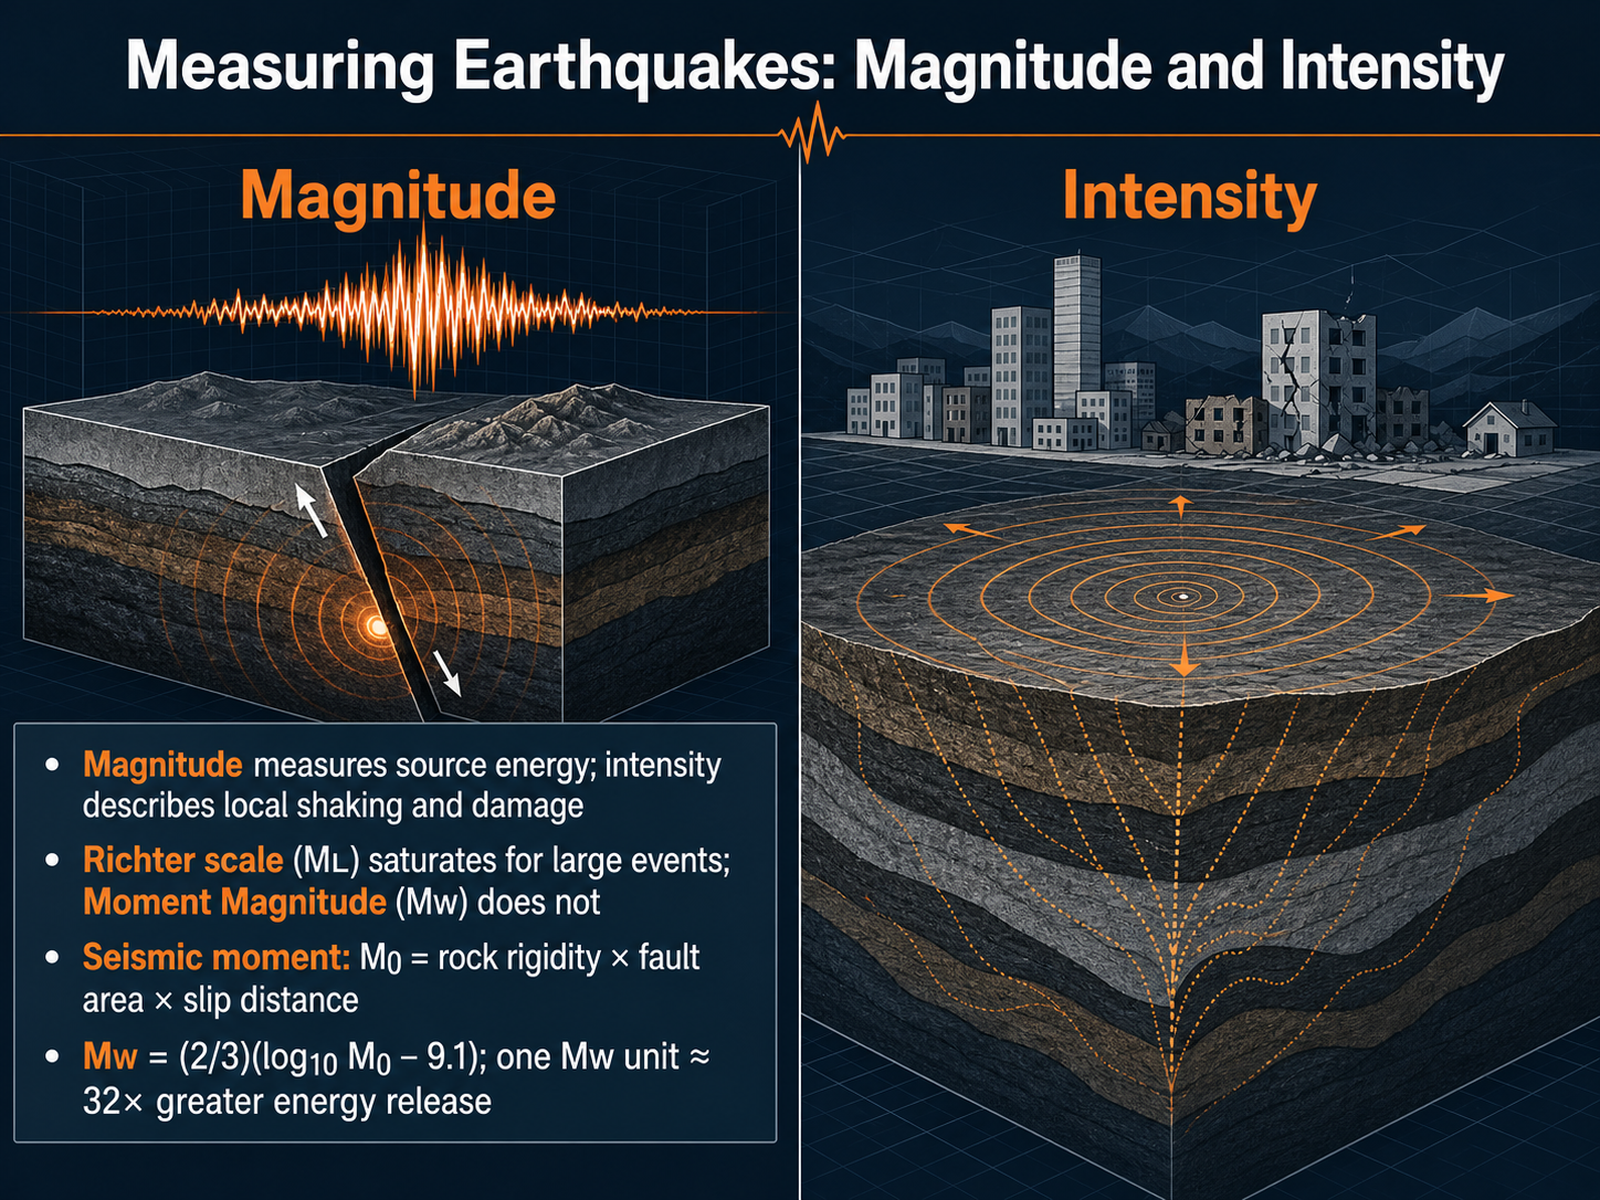
 - 10Measuring Earthquakes: Magnitude and IntensityNow let's talk about how we actually measure earthquakes, by looking at magnitude and intensity. Magnitude measures the energy released at the earthquake source, while intensity describes the local shaking and damage you would feel at a specific location. You have probably heard of the Richter scale. It works well for small, local events, but it saturates for very large earthquakes. That means it can't distinguish between a magnitude 7.5 and a magnitude 8.5. To solve this, we now use the Moment Magnitude scale, or Mw. It is based on seismic moment, which we calculate as rock rigidity times the fault area that slipped, times the slip distance. We then convert that seismic moment to magnitude using the formula two-thirds times the log base ten of the moment minus nine point one. Because this scale is logarithmic, one full unit increase in moment magnitude means about 32 times more energy is released. Up next, we will apply these concepts by reading seismograms in 'Reading Seismograms: The Fingerprint of Faulting.'
 usgs.goviris.eduen.wikipedia.org+22 min
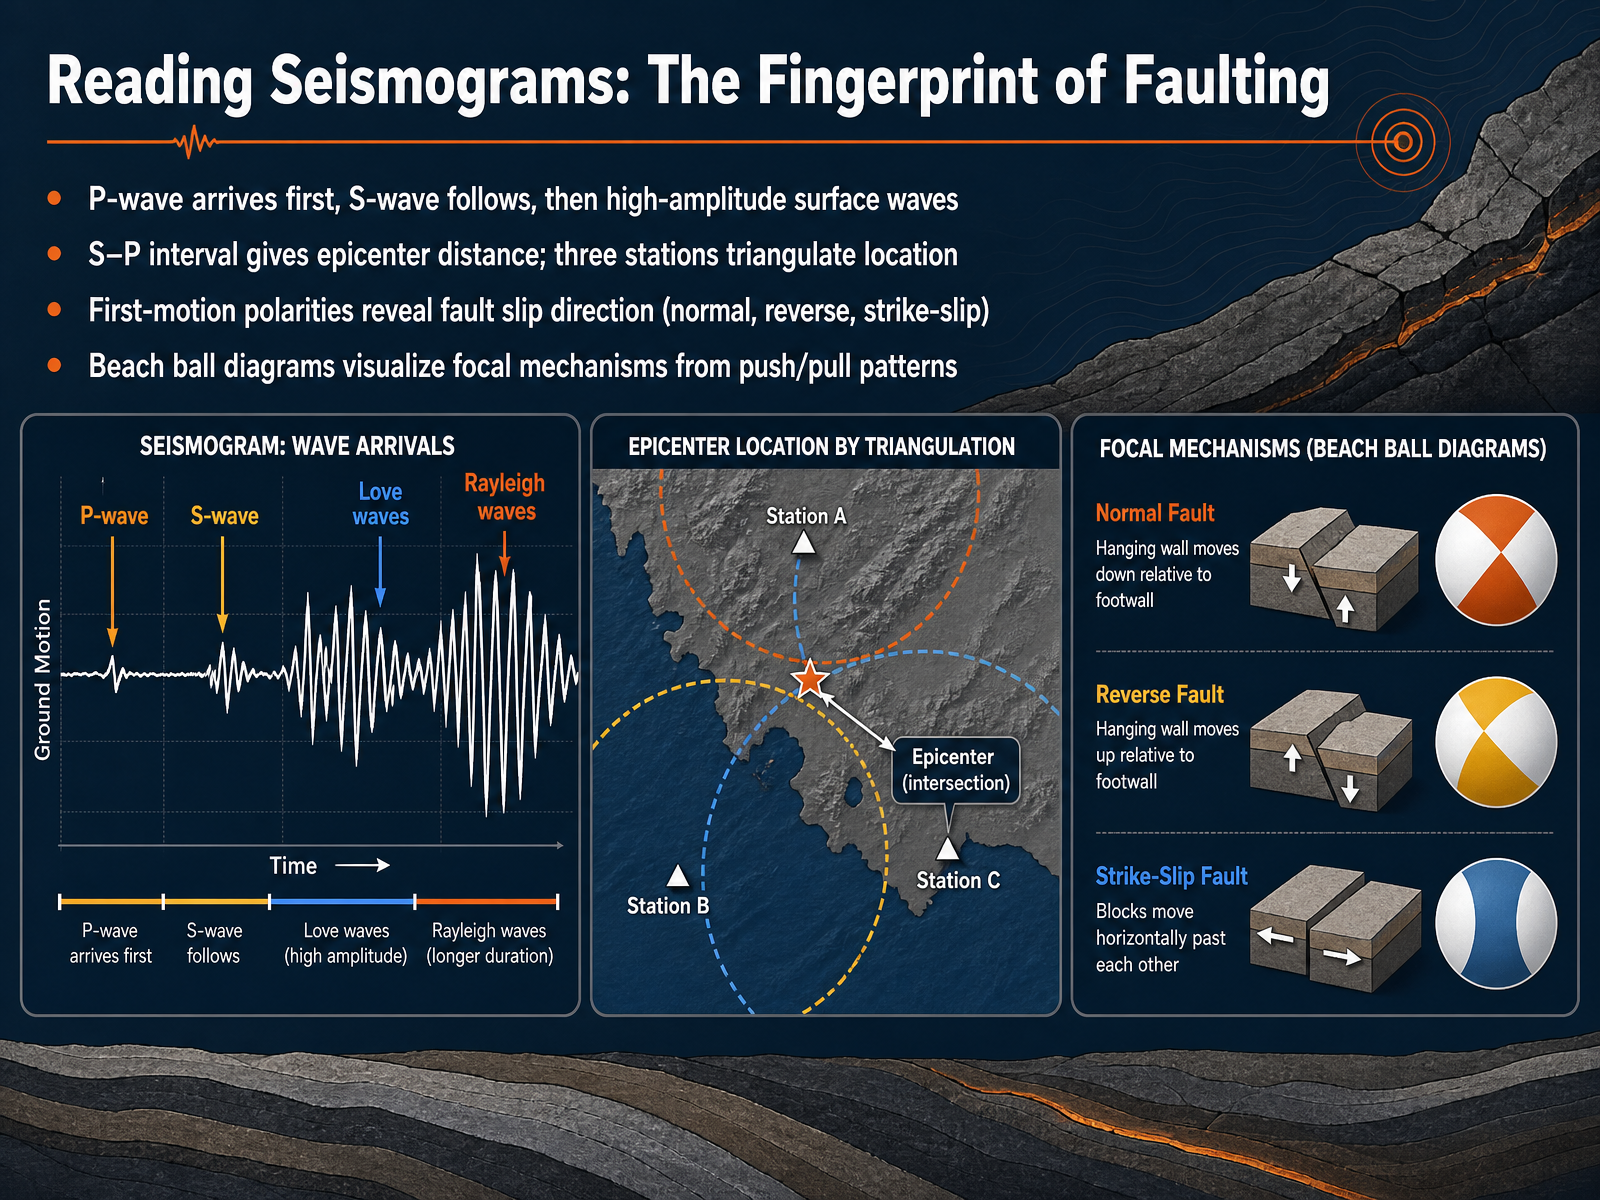
 - 11Reading Seismograms: The Fingerprint of FaultingNow let's look at how to read a seismogram, which is essentially the fingerprint of faulting. When an earthquake occurs, the recording shows a distinct sequence. The P wave arrives first, followed by the S wave, and then the high-amplitude surface waves roll in. The time gap between the P and S wave arrivals is called the S minus P interval, and it tells us the distance to the epicenter. When you combine these distance measurements from at least three seismic stations, you can triangulate the exact source location. Beyond just finding the location, we can look at the very first motion of the P wave. If it pushes upward, the ground moved toward the station; if it pulls downward, it moved away. These first-motion polarities reveal the fault slip direction, telling us if the event was normal, reverse, or strike-slip. Scientists visualize this complex push and pull pattern using a focal mechanism plot, often called a beach ball diagram, which provides a quick way to see the type of faulting that occurred. Next, we will apply these concepts to a real-world case: the 2011 Tohoku megathrust in Japan.
 preview-nature.comarxiv.deeppaper.ainature.com+22 min
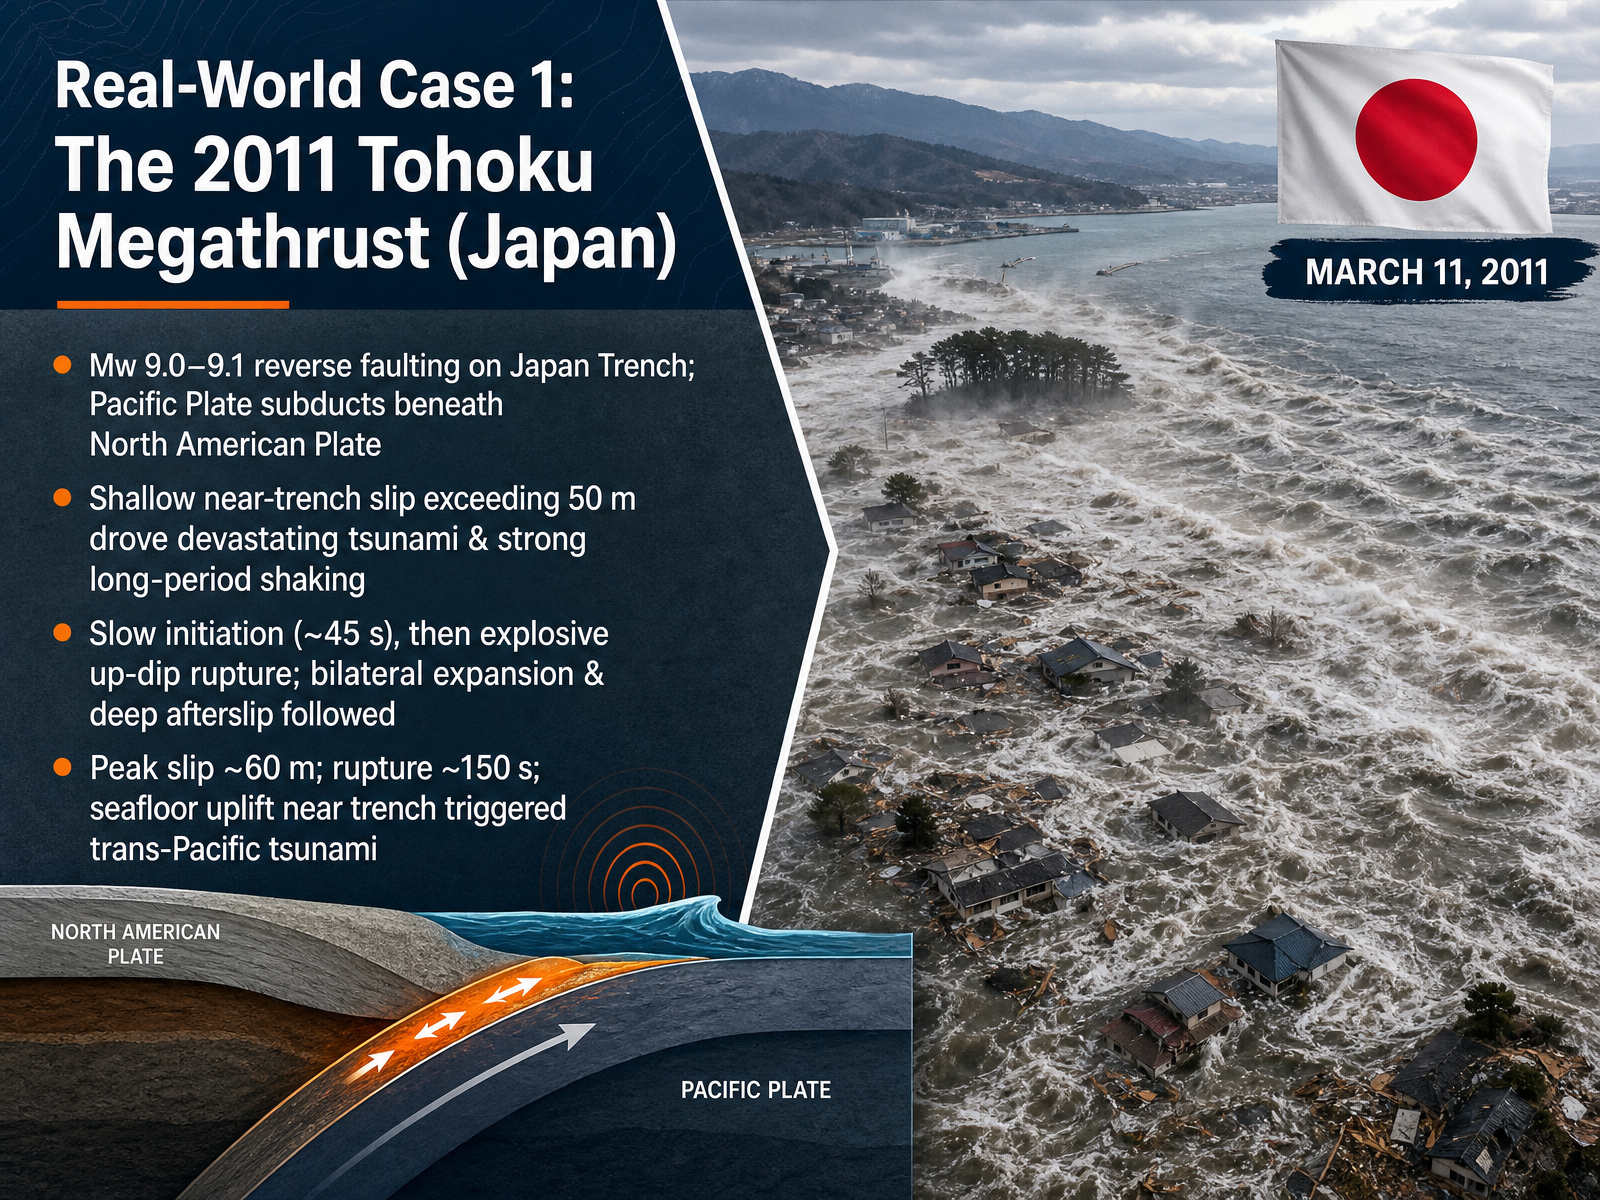
 - 12Real-World Case 1: The 2011 Tohoku Megathrust (Japan)Now let’s turn to a landmark case: the 2011 Tohoku megathrust earthquake. This magnitude 9.0 to 9.1 event occurred on the Japan Trench, where the Pacific Plate subducts beneath the North American Plate. It was a reverse-faulting earthquake with extremely shallow near-trench slip that exceeded 50 meters. The rupture began slowly, taking about 45 seconds to build, then exploded upward in an up-dip direction. Bilateral expansion followed, along with deep afterslip. Peak slip reached roughly 60 meters, and the total rupture lasted about 150 seconds. The enormous seafloor uplift near the trench displaced the ocean, generating the devastating trans-Pacific tsunami. This case shows how shallow fault slip, plate convergence, and long-period seismic energy combine to produce both strong shaking and tsunami hazards. Let’s continue with our second case: the 2023 Türkiye earthquake doublet, a powerful example of strike-slip faulting.
 1 min
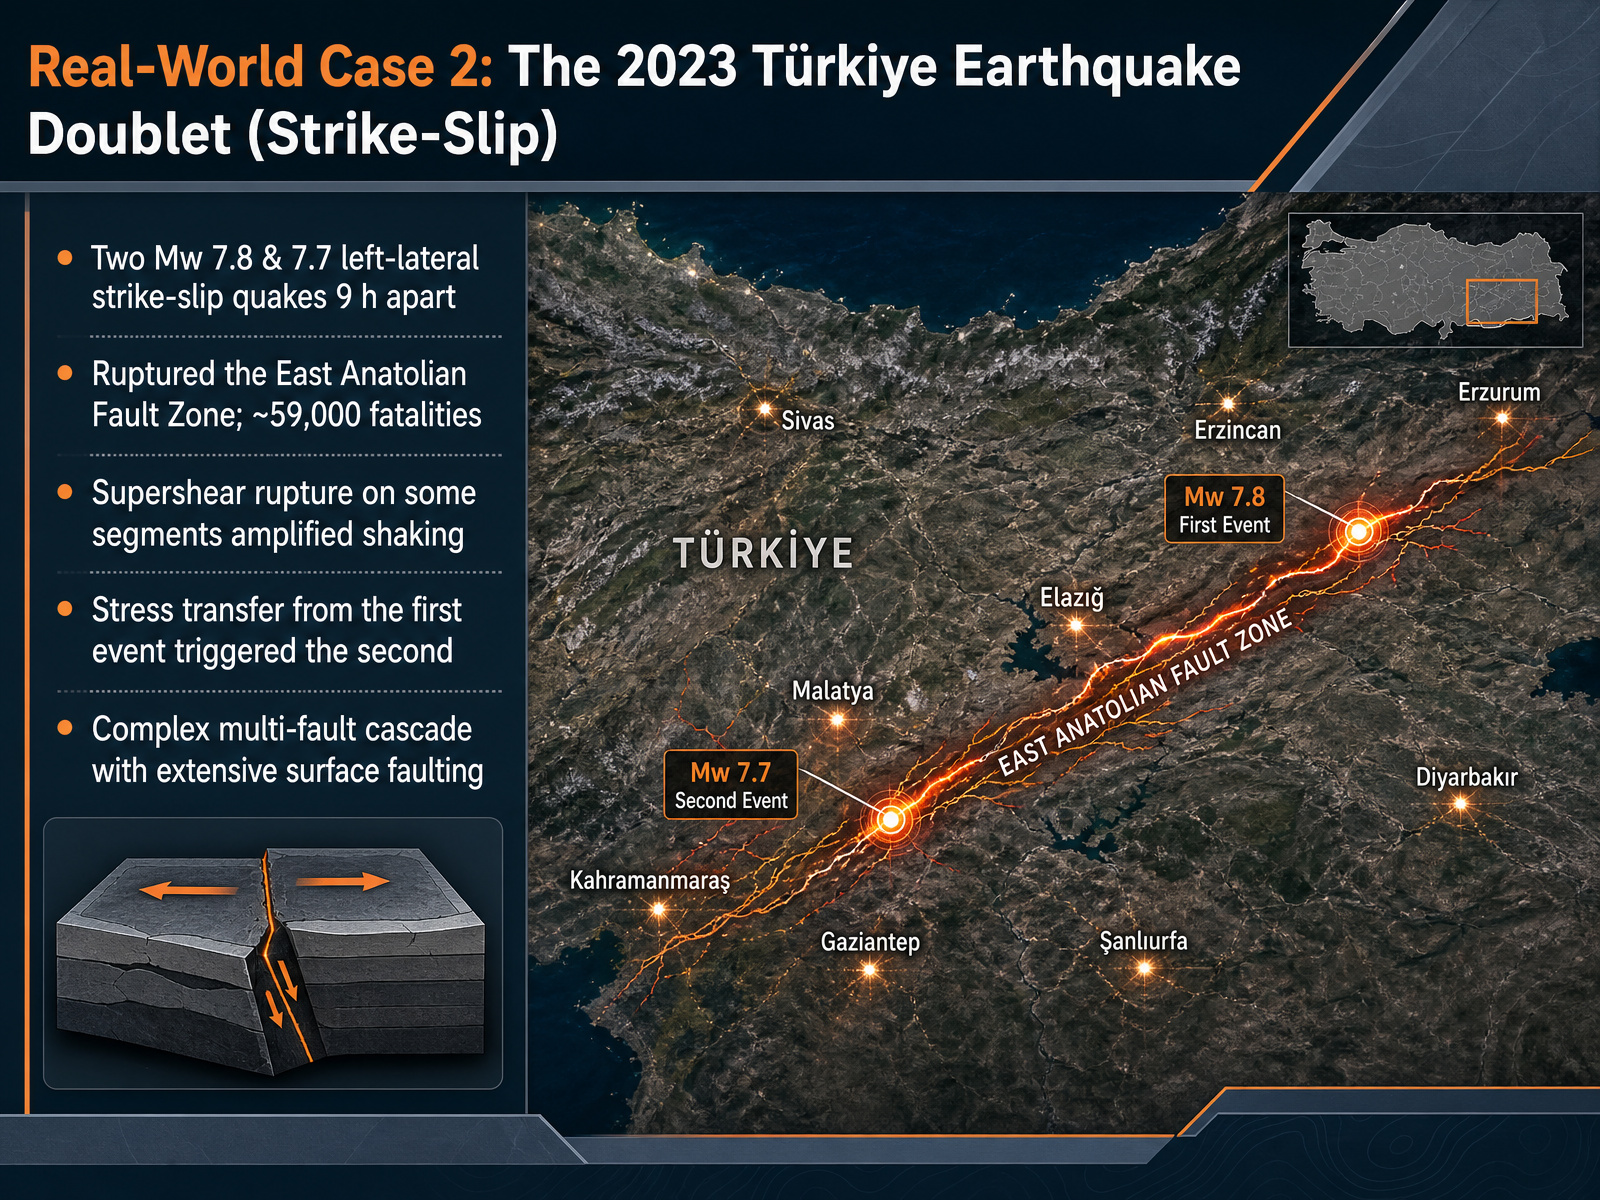
1 min - 13Real-World Case 2: The 2023 Türkiye Earthquake Doublet (Strike-Slip)Now let's examine another powerful case: the 2023 Türkiye earthquake doublet. On February sixth, two major left-lateral strike-slip earthquakes struck southeastern Türkiye just nine hours apart. The first registered moment magnitude 7.8, the second 7.7. Together they ruptured multiple segments of the East Anatolian Fault Zone and caused nearly fifty-nine thousand fatalities. The first event began on a small splay fault, then jumped to the main fault strand and propagated bilaterally over about 350 kilometers. Some segments experienced supershear rupture, where the rupture front moved faster than the shear wave velocity. This amplified shaking and concentrated damage. Stress transfer from the first earthquake increased Coulomb failure stress on a nearby fault system, directly triggering the second large event. This complex multi-fault cascade produced extensive surface faulting and disrupted standard aftershock patterns. The doublet shows how geometry, prestress, and fault interactions drive cascading ruptures. Next, we will move from these conceptual links to seismic hazard assessment.
 science.orgnature.comnature.com+22 min
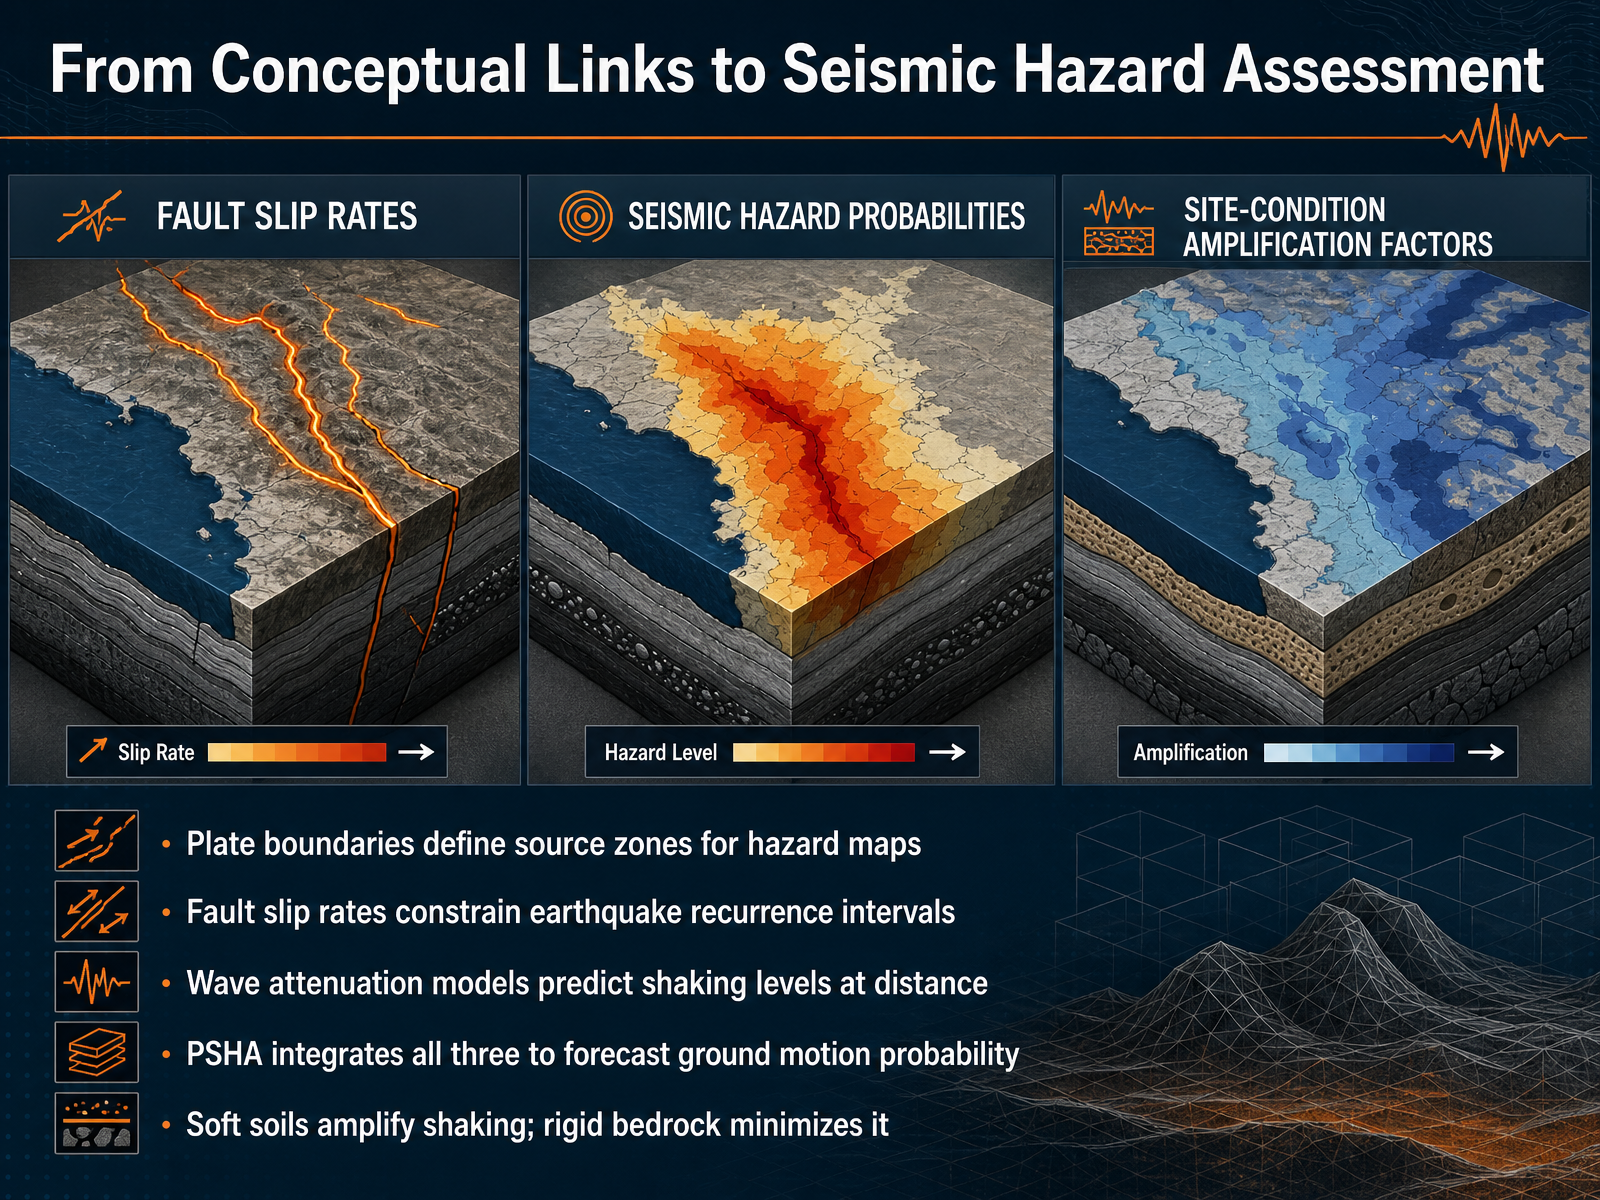
 - 14From Conceptual Links to Seismic Hazard AssessmentNow let’s move from conceptual links to seismic hazard assessment. Plate boundaries define the source zones for hazard maps. Where plates meet, we know earthquakes are possible, so those areas become the starting point for any forecast. Once we have those zones, fault slip rates help constrain recurrence intervals. By measuring how fast a fault moves over many years, we can estimate how often it might produce a large earthquake. Wave attenuation models then predict shaking levels at distance. For example, the 2011 Tohoku earthquake showed strong shaking near the trench that decreased with distance, but soft soils amplified that motion far from the source. Probabilistic seismic hazard assessment, or PSHA, integrates all three: source zones, recurrence, and attenuation. Together they forecast the probability of strong ground motion. And site conditions matter greatly. Soft soils amplify shaking, while rigid bedrock usually minimizes it. With that framework in mind, our next slide explores earthquake early warning and how we exploit the P–S time window.
 science.orgnature.comnature.com+22 min
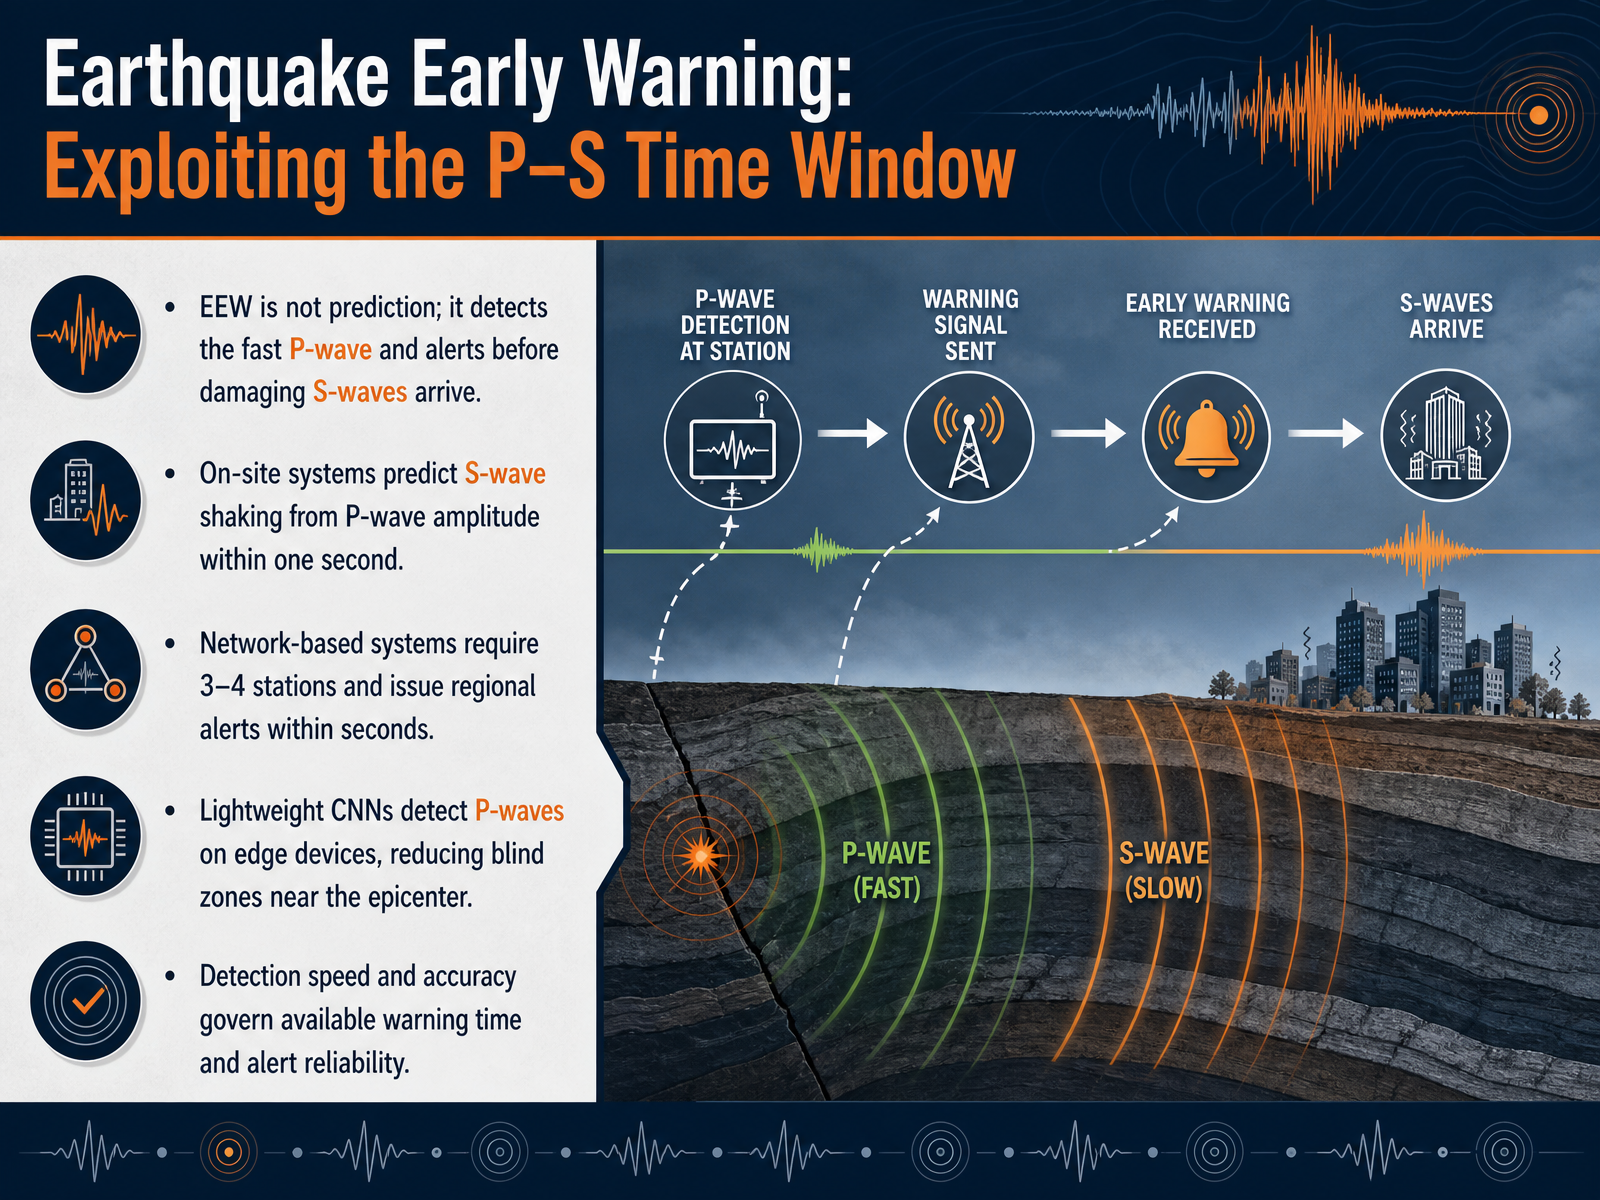
 - 15Earthquake Early Warning: Exploiting the P–S Time WindowNow let's explore how Earthquake Early Warning systems actually turn a P‑wave detection into a life‑saving alert. The key is what we call the P–S time window. Earthquake early warning is not prediction. It exploits the simple fact that the fast, nondestructive P‑wave arrives before the slower, damaging S‑waves and surface waves. When sensors detect the P‑wave, they rapidly estimate the coming shaking and trigger an alert. On‑site systems can do this within one second by predicting S‑wave strength directly from the P‑wave amplitude, without waiting for a full location fix. Network‑based systems need three to four stations to issue regional alerts, which takes a few extra seconds but covers a wider area. A powerful new direction is running lightweight convolutional neural networks right on edge devices, like a Raspberry Pi, achieving sub‑seven‑millisecond inference. This edge‑processing approach shrinks the blind zones near the epicenter where traditional alerts arrive too late. In every approach, detection speed and accuracy determine the warning time you get and the reliability of the alert.
 preview-nature.comarxiv.deeppaper.ainature.com+22 min
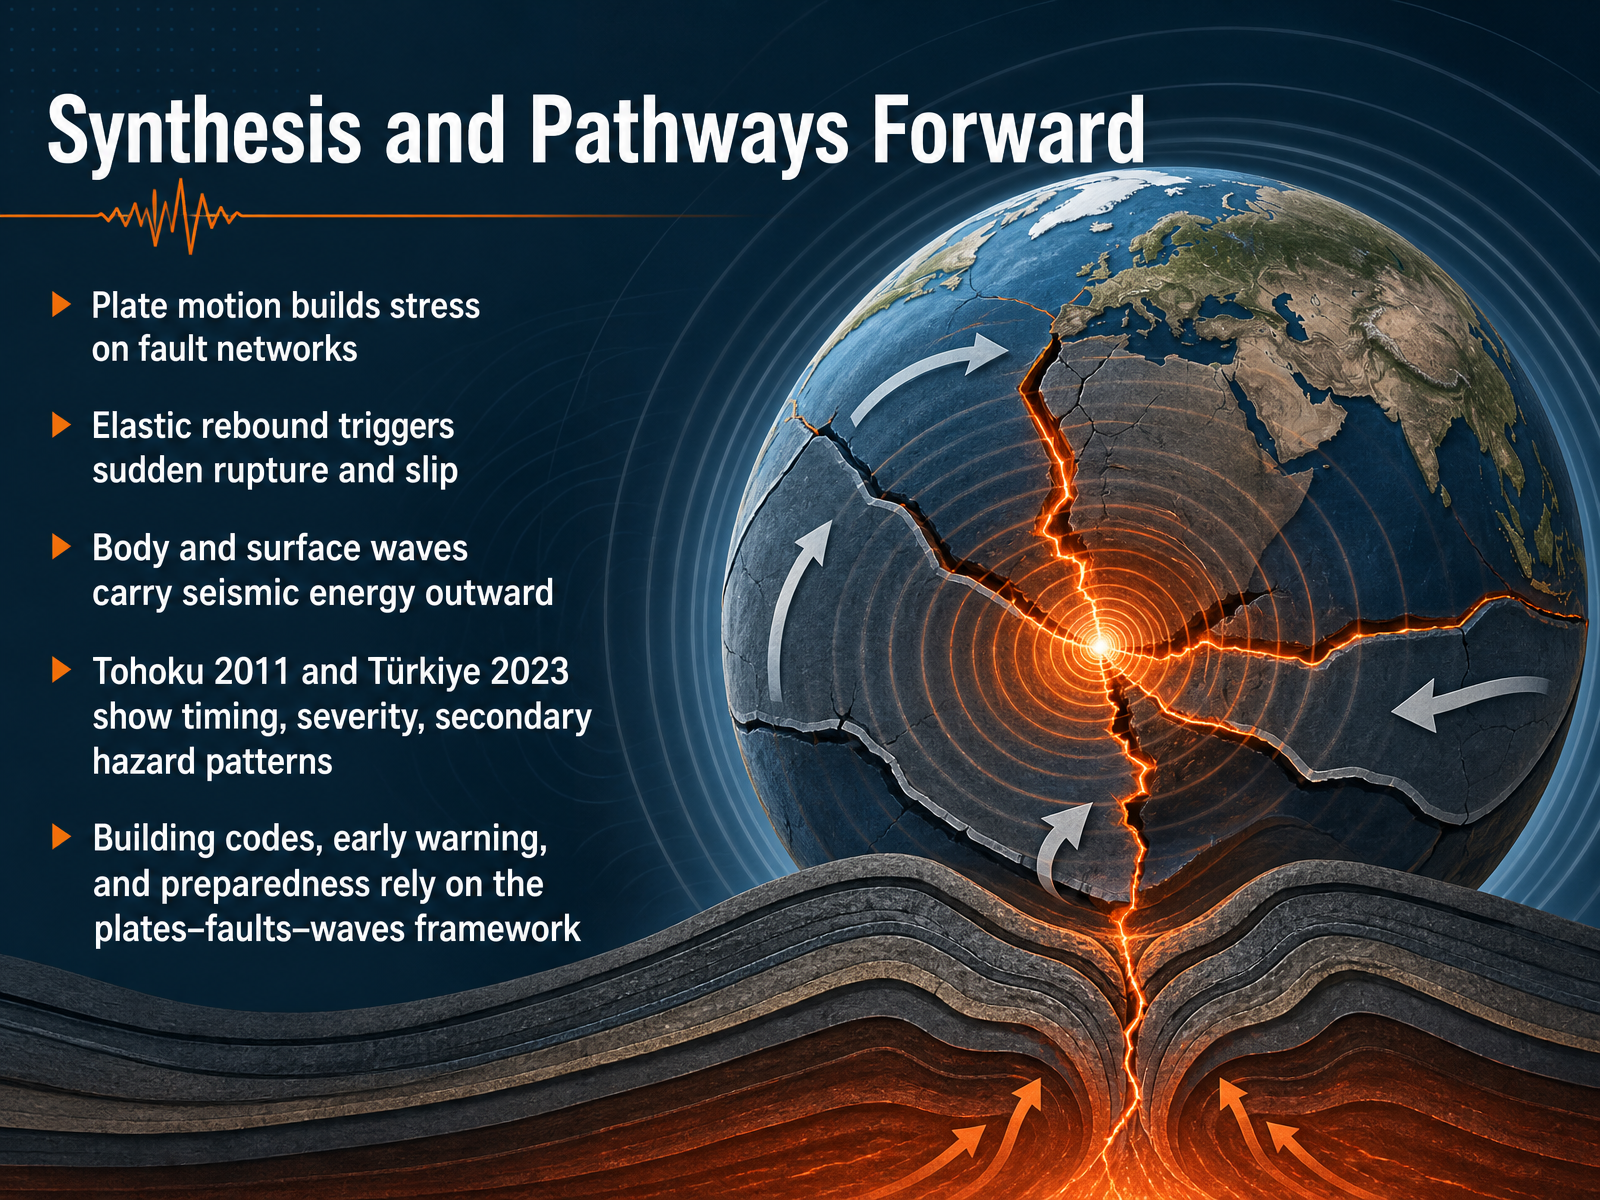
 - 16Synthesis and Pathways ForwardWe have reached the final synthesis of our journey through earthquake science. Across this course, we have seen how the relentless motion of tectonic plates steadily builds stress along fault networks. When that stress surpasses the strength of the surrounding rock, elastic rebound triggers a sudden rupture and fault slip. This rapid slip generates both body waves and surface waves, which carry seismic energy outward and cause the shaking we feel at the surface. The 2011 Tohoku earthquake and the 2023 Türkiye doublet are powerful modern examples that illustrate the critical importance of timing, rupture severity, and cascading secondary hazards such as tsunami and widespread structural collapse. Understanding the physical connection between plates, faults, and waves forms the foundation of our entire mitigation strategy. It directly informs modern building codes, drives the development of earthquake early warning systems that rely on rapid P-wave detection, and strengthens community preparedness efforts worldwide. Thank you for engaging with these concepts. As you move forward, remember that every step in hazard readiness rests on this interconnected framework, and your knowledge is an essential part of building a more resilient future.
 science.orgnature.comnature.com+22 min
Take the deck with you
Download this course as a file — free, no sign-up needed.
- PDF handoutEvery slide page, ready to print or share.17 pages · 6.6 MBDownload
- Narrated PowerPointThe deck that presents itself — every slide carries the digital human's narration video.17 pages · 20.3 MBDownload
- PowerPoint slidesThe full deck as a .pptx — open it in PowerPoint, Keynote, or Google Slides.17 pages · 6.5 MBDownload
Free to use in your own training — please keep the PersonWise credit page at the end.
Have your own deck? Turn it into a course
Sources consulted
Web sources consulted while building this course.
- Tectonic Plates, Earthquakes, Volcanoes: Visual Stuy | IASNOVA — iasnova.com
- Thorsten Becker - Distinguished Chair in Geophysics, UT Austin: Global plate tectonic maps — www-udc.ig.utexas.edu
- Plate Tectonics Map - Plate Boundary Map — geology.com
- TECTONIC PLATES TECTONIC PLATES — tectonics.caltech.edu
- Interactives . Dynamic Earth . Plates & Boundaries — learner.org
- Supershear triggering and cascading fault ruptures of the 2023 ... — science.org
- Complex multi-fault rupture and triggering during the 2023 ... — nature.com
- Rupture dynamics and velocity structure effects on ground motion during the 2023 Türkiye earthquake doublet | Communications Earth & Environment — nature.com
- Complex triggering and rupture dynamics of the 2023 Turkey Mw7.8-7.7 earthquake doublet from space geodetic and seismic imaging Yuri Fialko 1, Zhe Jia 1, Zeyu Jin 1, Xiaoyu Zou 1, Alice Gabriel 1, Wenyuan Fan 1, Peter Shearer 1, Fatih Bulut 2, Asli Garagon 2, James Biemiller 3, Mathilde Marchandon 4 — earthscope.org
- The complex dynamics of the 2023 Kahramanmaraş, Turkey,Mw7.8-7.7 earth... — bishtref.com
- Lightweight convolutional neural network for real-time earthquake P-wave detection on edge devices in New Zealand | Scientific Reports — preview-nature.com
- Variational Autoencoders for P-wave Detection on Strong Motion Earthquake Spectrograms | Arxiv - DeepPaper — arxiv.deeppaper.ai
- Stable operation of a network-based multi-algorithm earthquake early warning system: the Korea meteorological administration platform | Scientific Reports — nature.com
- How It Works – California Earthquake Early Warning — earthquake.ca.gov
- <b>Immediacy and Accuracy of the Earthquake Early Warning Method Based on the P-wave Threshold Exceedance: Application to the 2016 Kumamoto Earthquake Sequence</b> — doi.org
- Earthquake Magnitude, Energy Release, and Shaking Intensity — usgs.gov
- Magnitude Explained: Moment Magnitude vs. Richter Scale - IRIS — iris.edu
- Moment magnitude scale — en.wikipedia.org
- How Do We Measure Earthquake Magnitude? | UPSeis — mtu.edu
- Moment Magnitude Explained—What Happened to the Richter Scale? — youtube.com