Content Marketing Metrics Mastery
Begin
14 pages · ~28 min
Content Marketing Metrics Mastery
Learn to measure and interpret key content marketing metrics to optimize performance and drive data-informed strategy decisions.
What you’ll learn
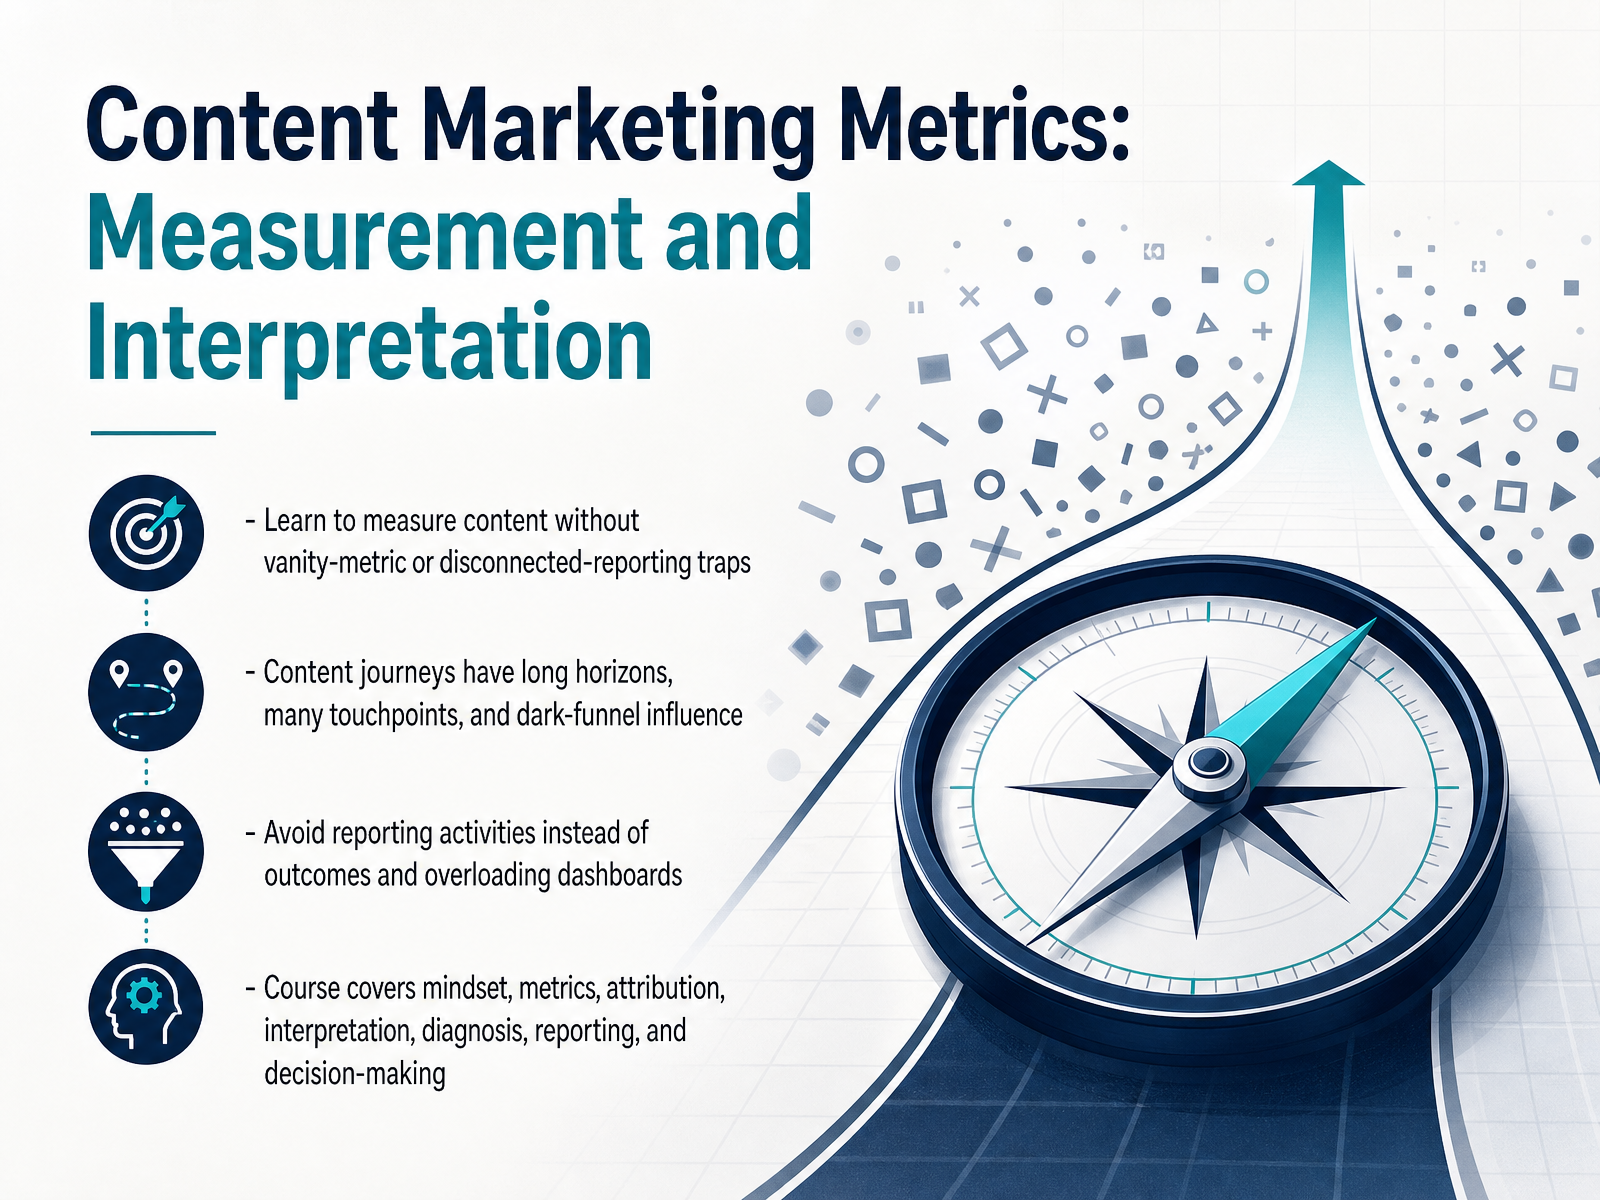
- 01Content Marketing Metrics: Measurement and InterpretationWelcome to Content Marketing Metrics: Measurement and Interpretation. This course is built for content teams, analysts, and growth leads who want to connect content to pipeline, not just pageviews. Here's the core problem we'll solve. Most content measurement fails for predictable reasons. Teams track vanity metrics like raw traffic and posts published. They report activities instead of outcomes. And they build dashboards so crowded that no one actually uses them. Content journeys are different from typical campaigns. They have long time horizons, many touchpoints, and influence that often happens in the dark funnel, where people share links privately or discover you through conversations analytics can't fully see. If your measurement doesn't account for that, you'll keep undervaluing your work. This course changes that. We'll cover the right mindset, which metrics actually matter, how attribution works, how to interpret and diagnose performance, and how to build reporting that drives decisions. By the end, you'll be able to defend content investment with numbers your leadership actually trusts. Next up, we'll look at why content measurement fails, so you can avoid the most common traps before building your own framework.sona.comivristech.comagencyanalytics.com+22 min
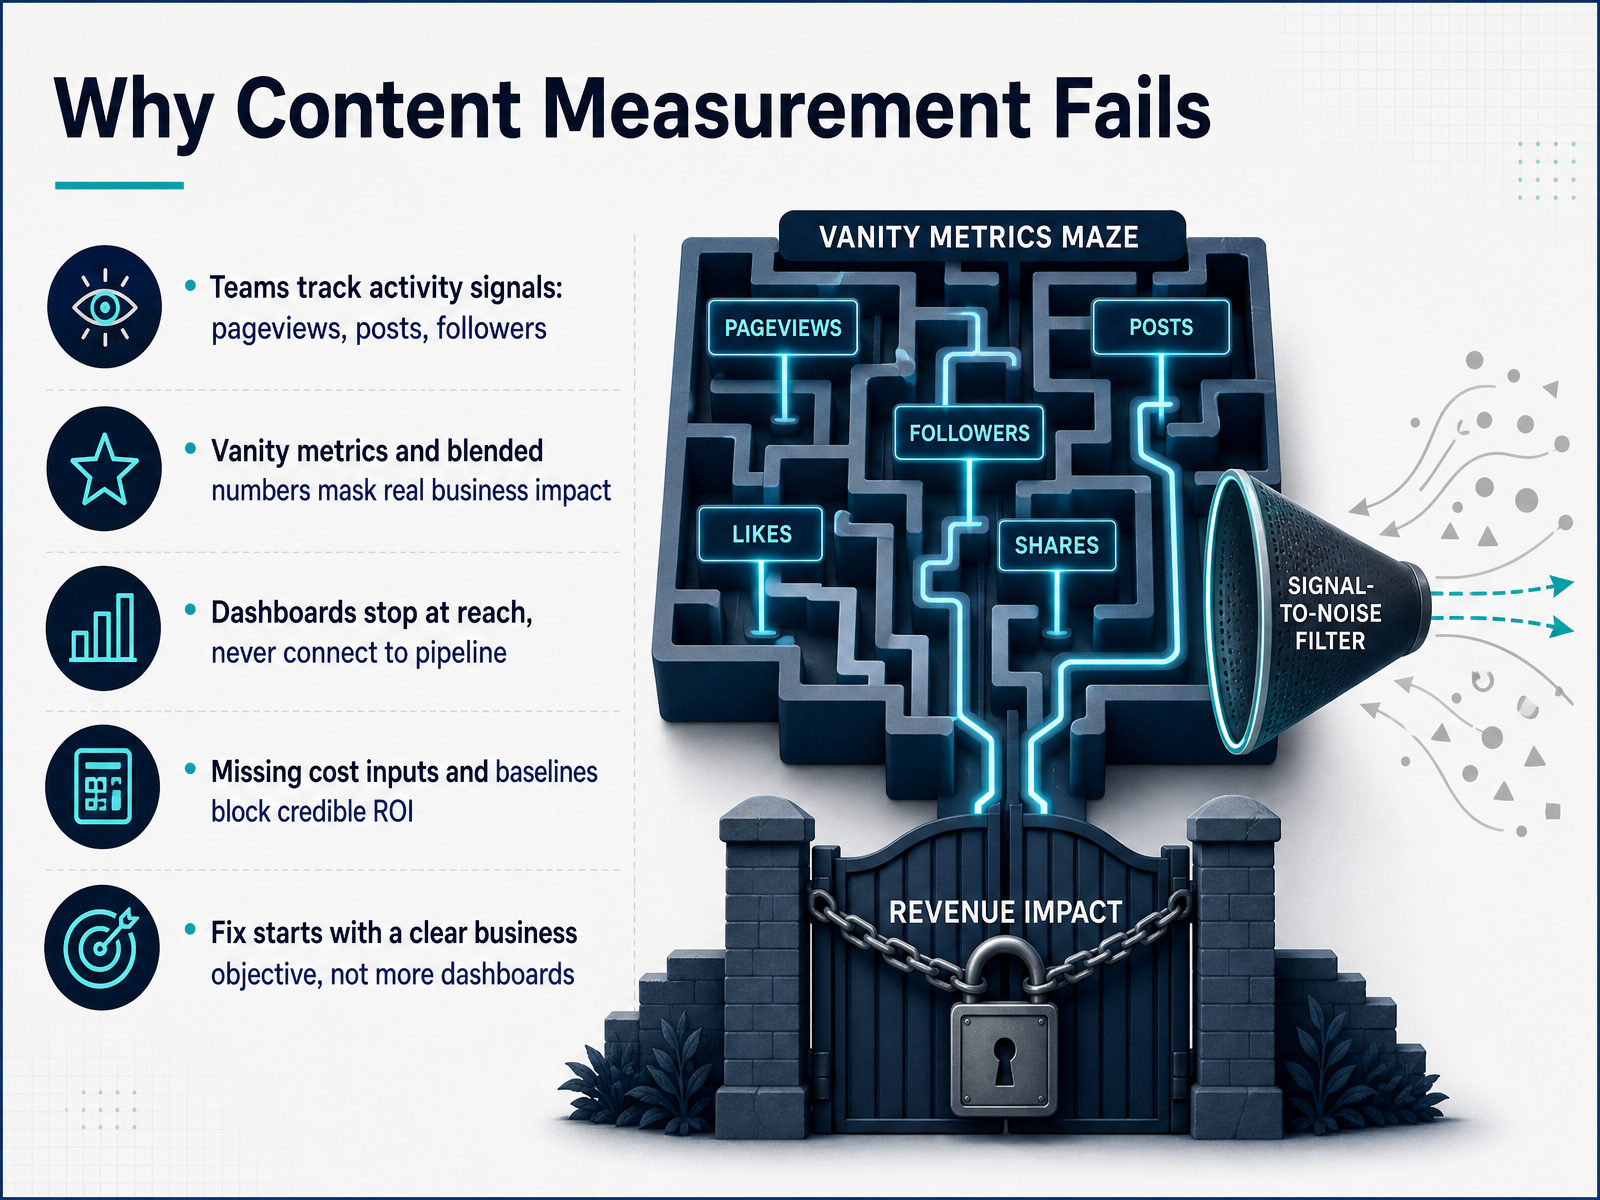
- 02Why Content Measurement FailsNow, let's look at why content measurement so often fails. The root cause is usually that teams track activity signals like pageviews, posts published, and follower counts. Those numbers go up, but they don't tell you if the business is growing. Vanity metrics and blended numbers mask real impact, because a post can earn fifty thousand visits and still generate zero pipeline. Dashboards also tend to stop at reach. They never connect content to form fills, demos, or closed deals, so leadership never sees the commercial value. Missing cost inputs and baselines makes it worse. If you don't capture production spend, promotion cost, and a clear performance baseline, you can't calculate a credible ROI. The fix isn't another dashboard with forty tiles. It starts with one clear business objective. Define the outcome first, then pick the metrics that trace back to it. Next, let's clarify the difference between metrics, KPIs, benchmarks, and goals.
 sona.comivristech.comagencyanalytics.com+21 min
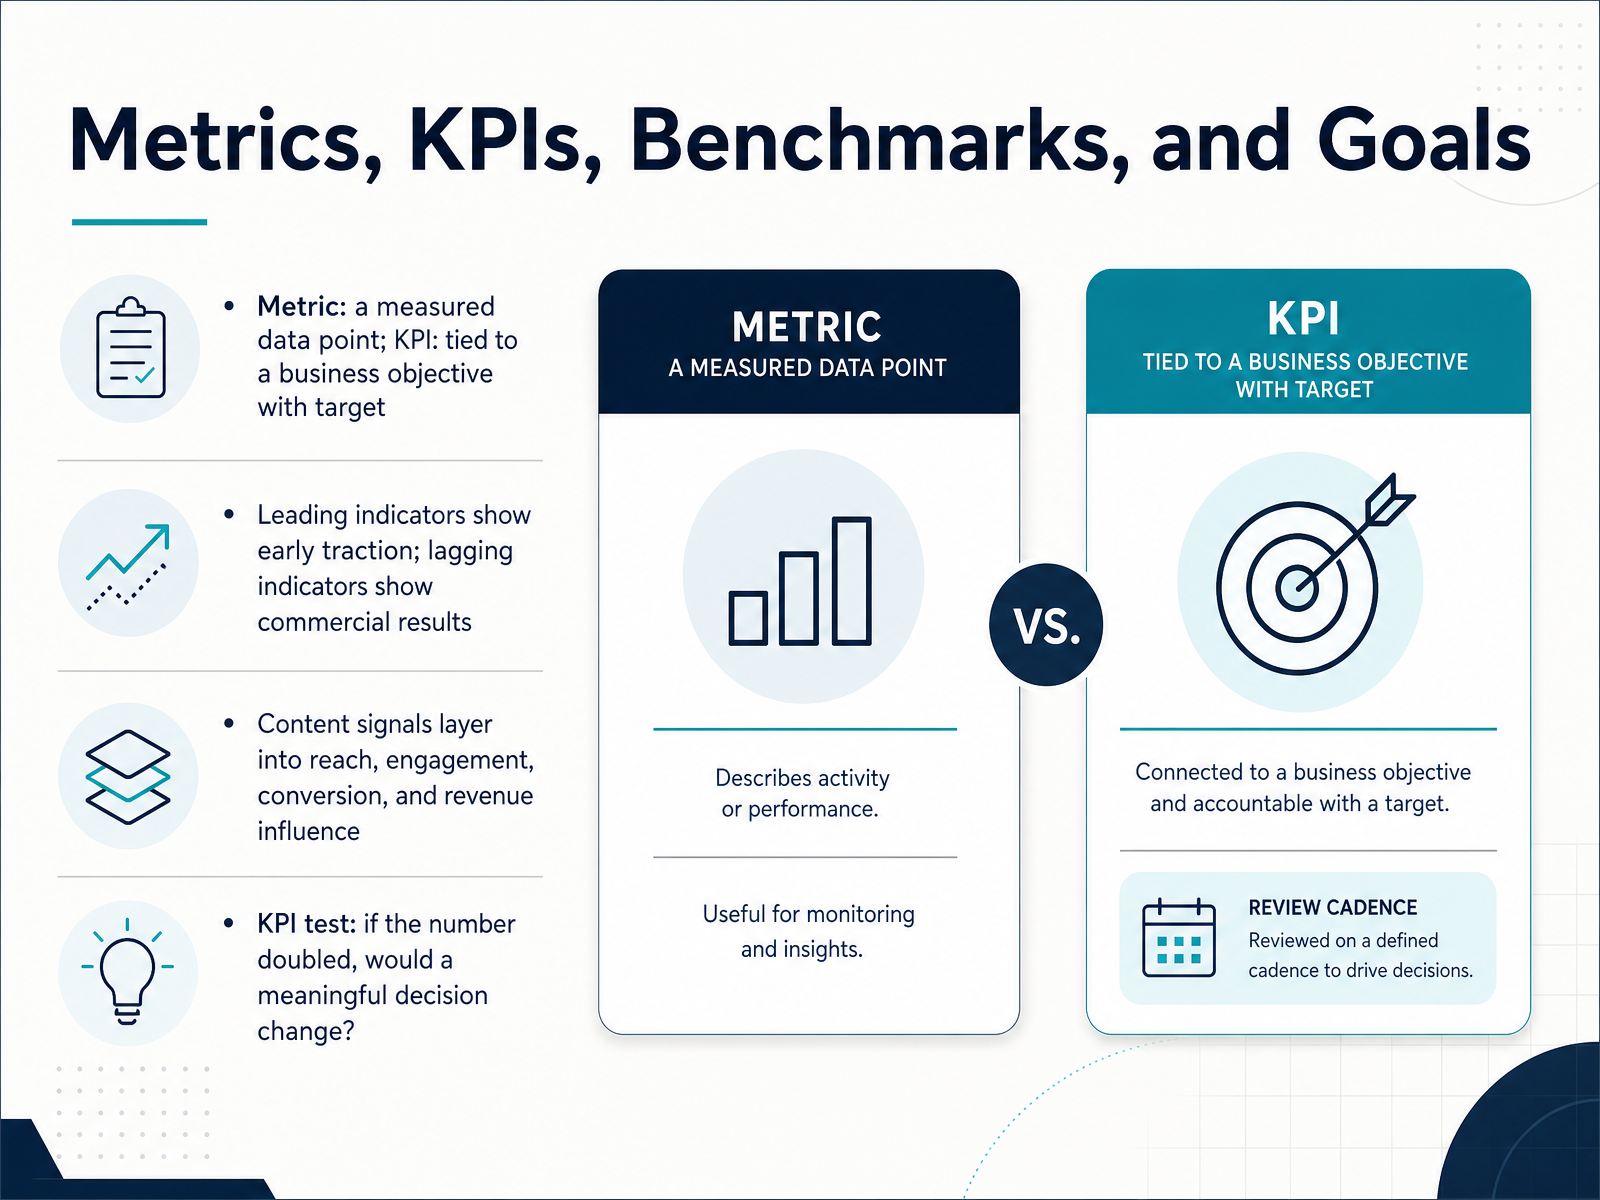
 - 03Metrics, KPIs, Benchmarks, and GoalsBefore you choose a dashboard tool or pull a report, you need to separate four things that often get mixed up: metrics, KPIs, benchmarks, and goals. A metric is just a measured data point, like time on page or the number of demo requests from content. A KPI is a metric tied to a business objective with a defined target and review cycle. So organic traffic is a metric. Organic traffic from your target accounts that grows twenty percent quarter over quarter is a KPI. Leading indicators show early traction. They include signals like impressions, return visits, and scroll depth. Lagging indicators show commercial results, such as content-assisted pipeline or closed won revenue. You need both, but for different conversations. Leading indicators help you adjust campaigns this month. Lagging indicators help leadership judge budget decisions this quarter. Content signals layer into four groups: reach, engagement, conversion, and revenue influence. The fastest way to sort these is the KPI test. If the number doubled tomorrow, would a meaningful decision change? If yes, it is a KPI. If no, it is likely a vanity metric. Apply that test to every number before it lands in your dashboard. Next, we will match those metrics to specific content objectives.
 tenspeed.iocontentmarketinginstitute.comthemarketingjuice.com+22 min
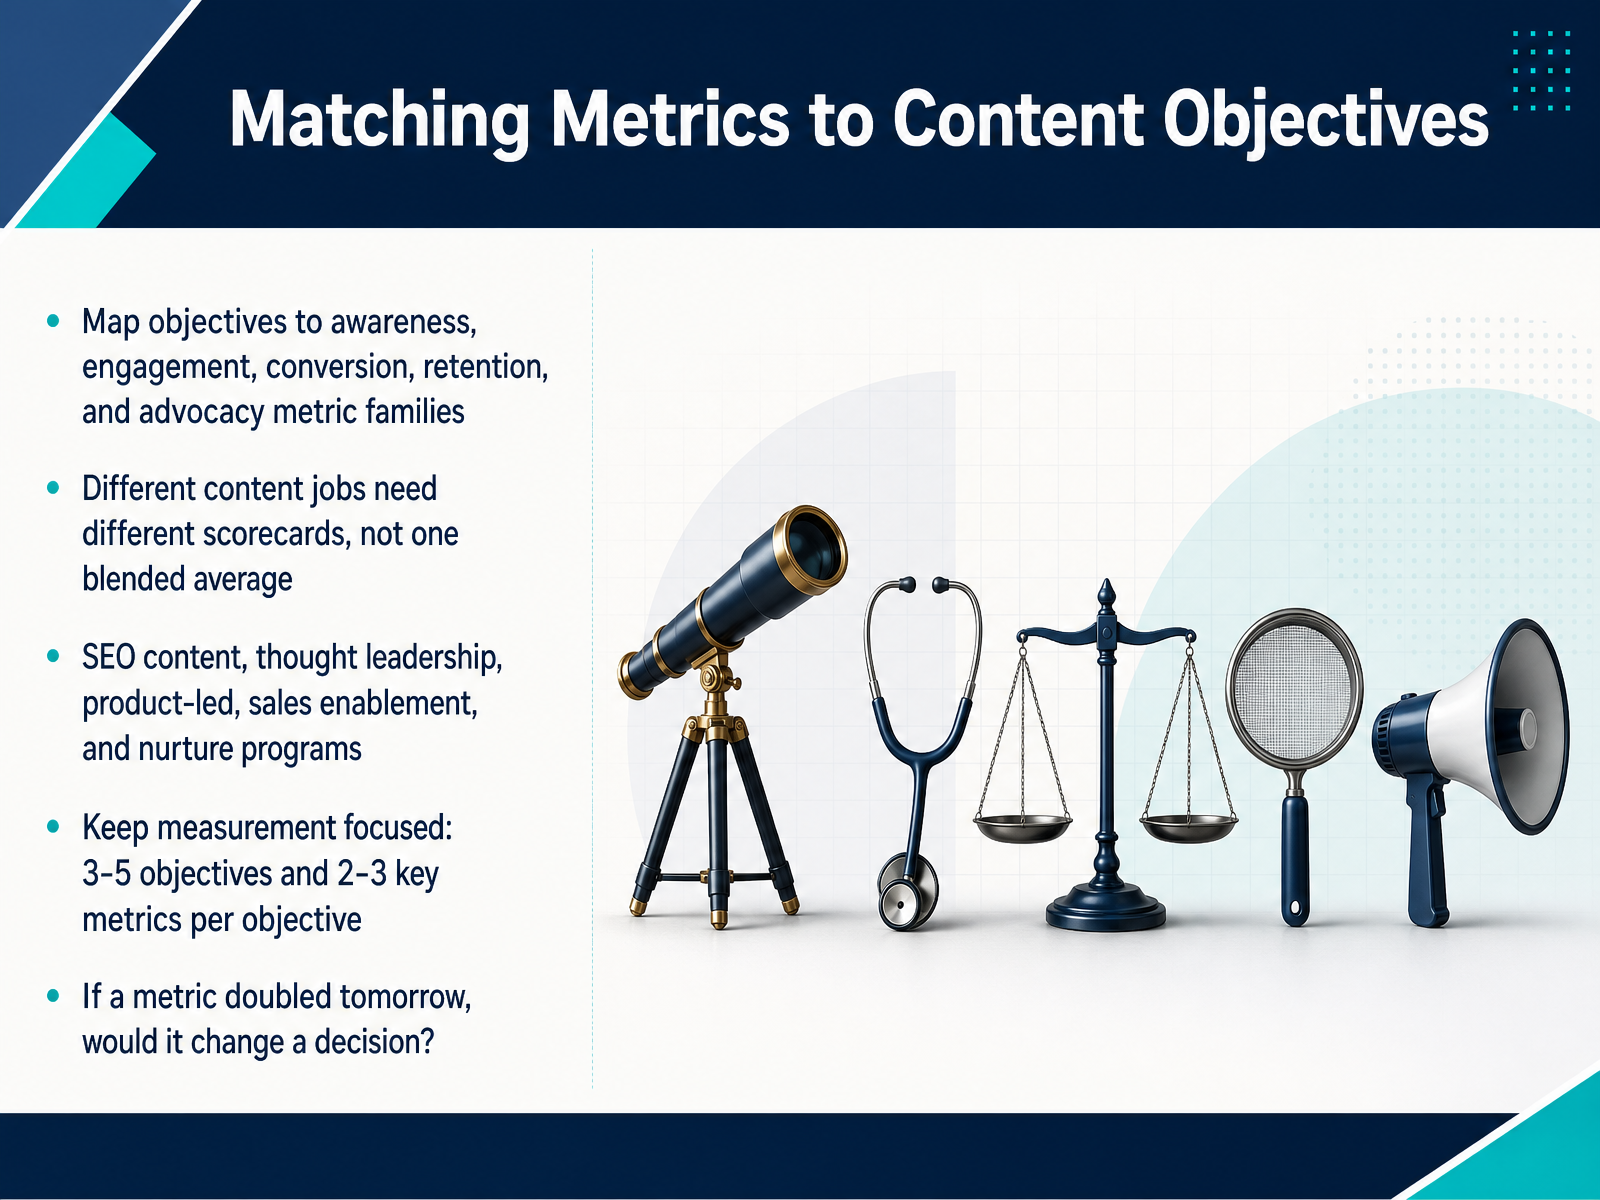
 - 04Matching Metrics to Content ObjectivesThis slide is about making your metrics work for the specific job your content is doing. The first rule is to map each content objective to a metric family. Awareness, engagement, conversion, retention, and advocacy should each have their own scorecard. A thought leadership article and a pricing comparison page should not be judged by the same numbers. Blending them together hides what is really working and what is not. This applies to your SEO content, your sales enablement material, and your nurture programs. Each one needs metrics that match its purpose. The second rule is to keep the scorecard focused. Limit yourself to three to five objectives, and then pick only two or three key metrics for each one. Do not track everything your analytics tool offers. Finally, use the doubling test. If a metric doubled tomorrow, would you change a decision? If the answer is no, it is a vanity metric, and you should cut it from the report. Next, we will look at the core content metrics and their limits.
 tenspeed.iocontentmarketinginstitute.comthemarketingjuice.com+22 min
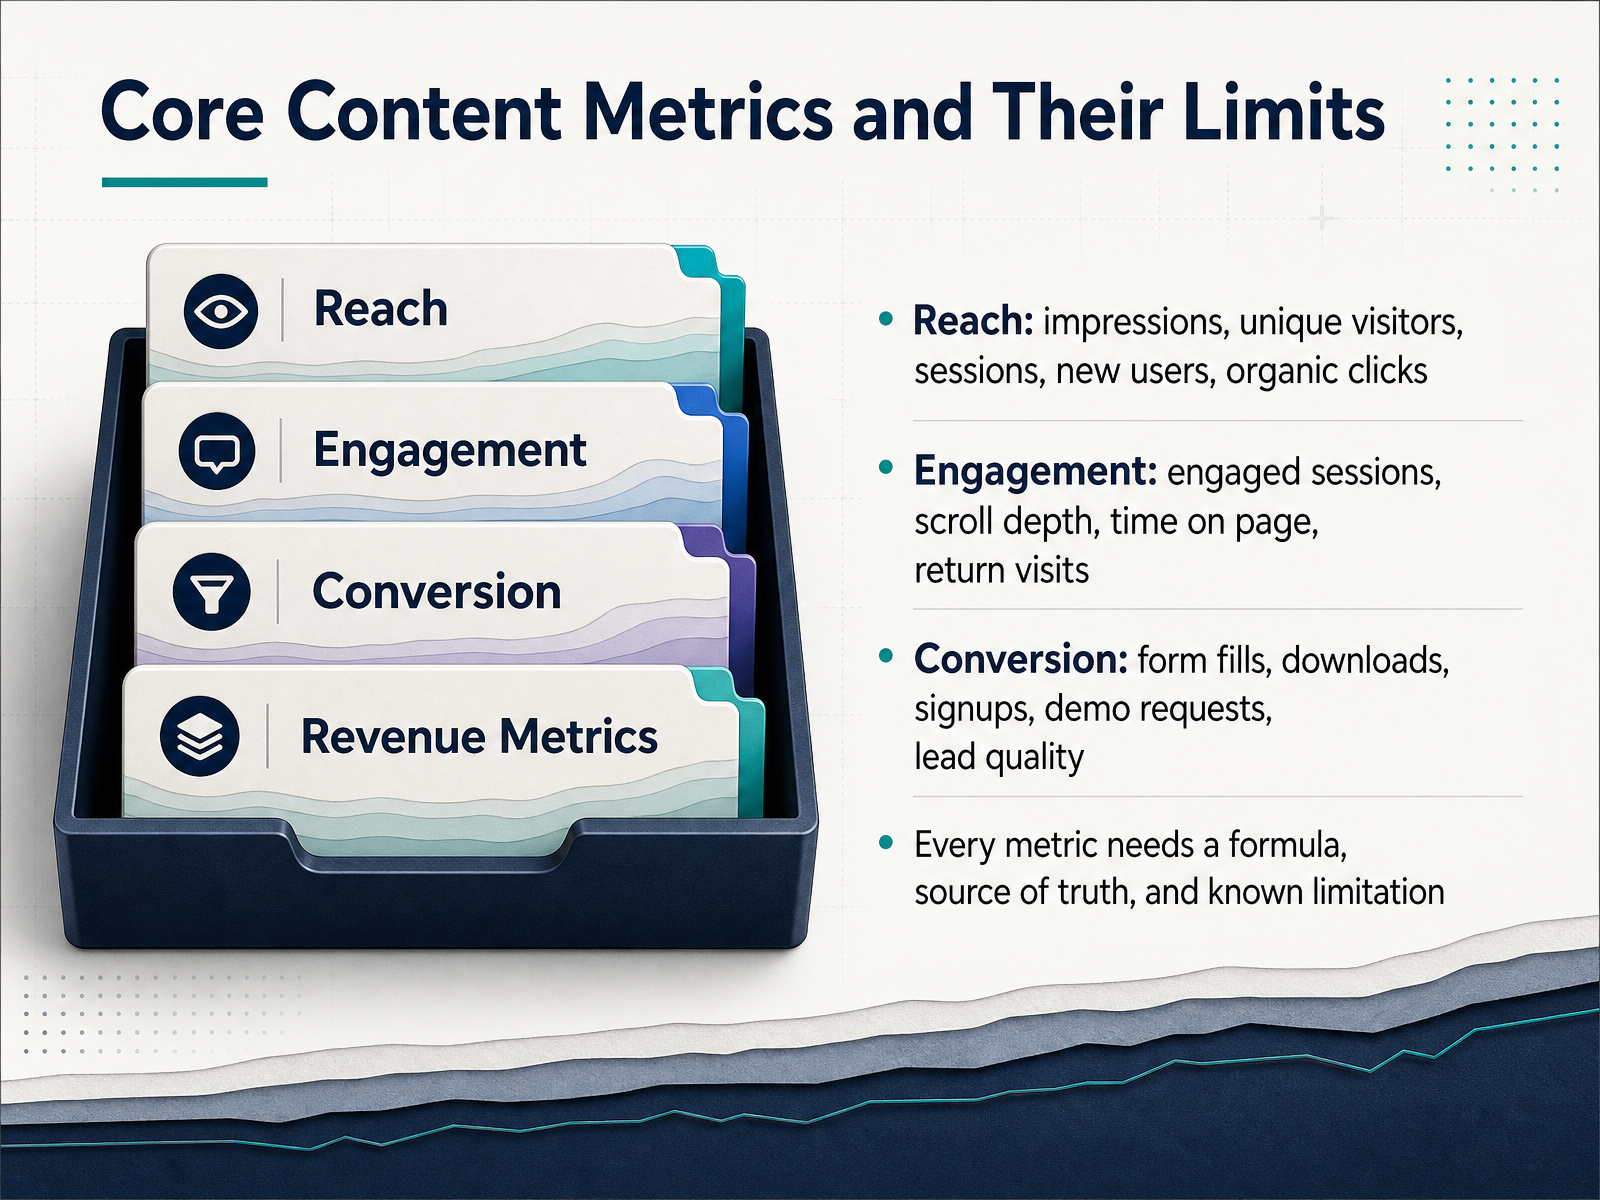
 - 05Core Content Metrics and Their LimitsNow let's break down the metric families you'll see on any content dashboard, and the limits of each. First, reach answers the question, is anyone finding us? Track impressions, unique visitors, sessions, new users, and organic clicks. Reach tells you if distribution works. It doesn't tell you if the content is good. For that, look at engagement. Engaged sessions, scroll depth, time on page, and return visits show whether people actually consume what they open. A reach number without engagement is just volume. Next, conversion covers the actions that matter commercially. Think form fills, downloads, signups, demo requests, and lead quality. Lead quality is the part most teams skip, and it changes the whole story. A hundred unqualified form fills are less useful than ten demos from your target segment. Here's the discipline to apply across all three. Every metric needs a formula, a source of truth, and a known limitation. For example, time on page can look strong while a reader has the tab open in the background. Name that limitation, and don't let one bad metric drive a decision. Next, we'll go beyond reach and look at lead quality and revenue influence.
 marketful.comcontentmarketinginstitute.comtenspeed.io+22 min
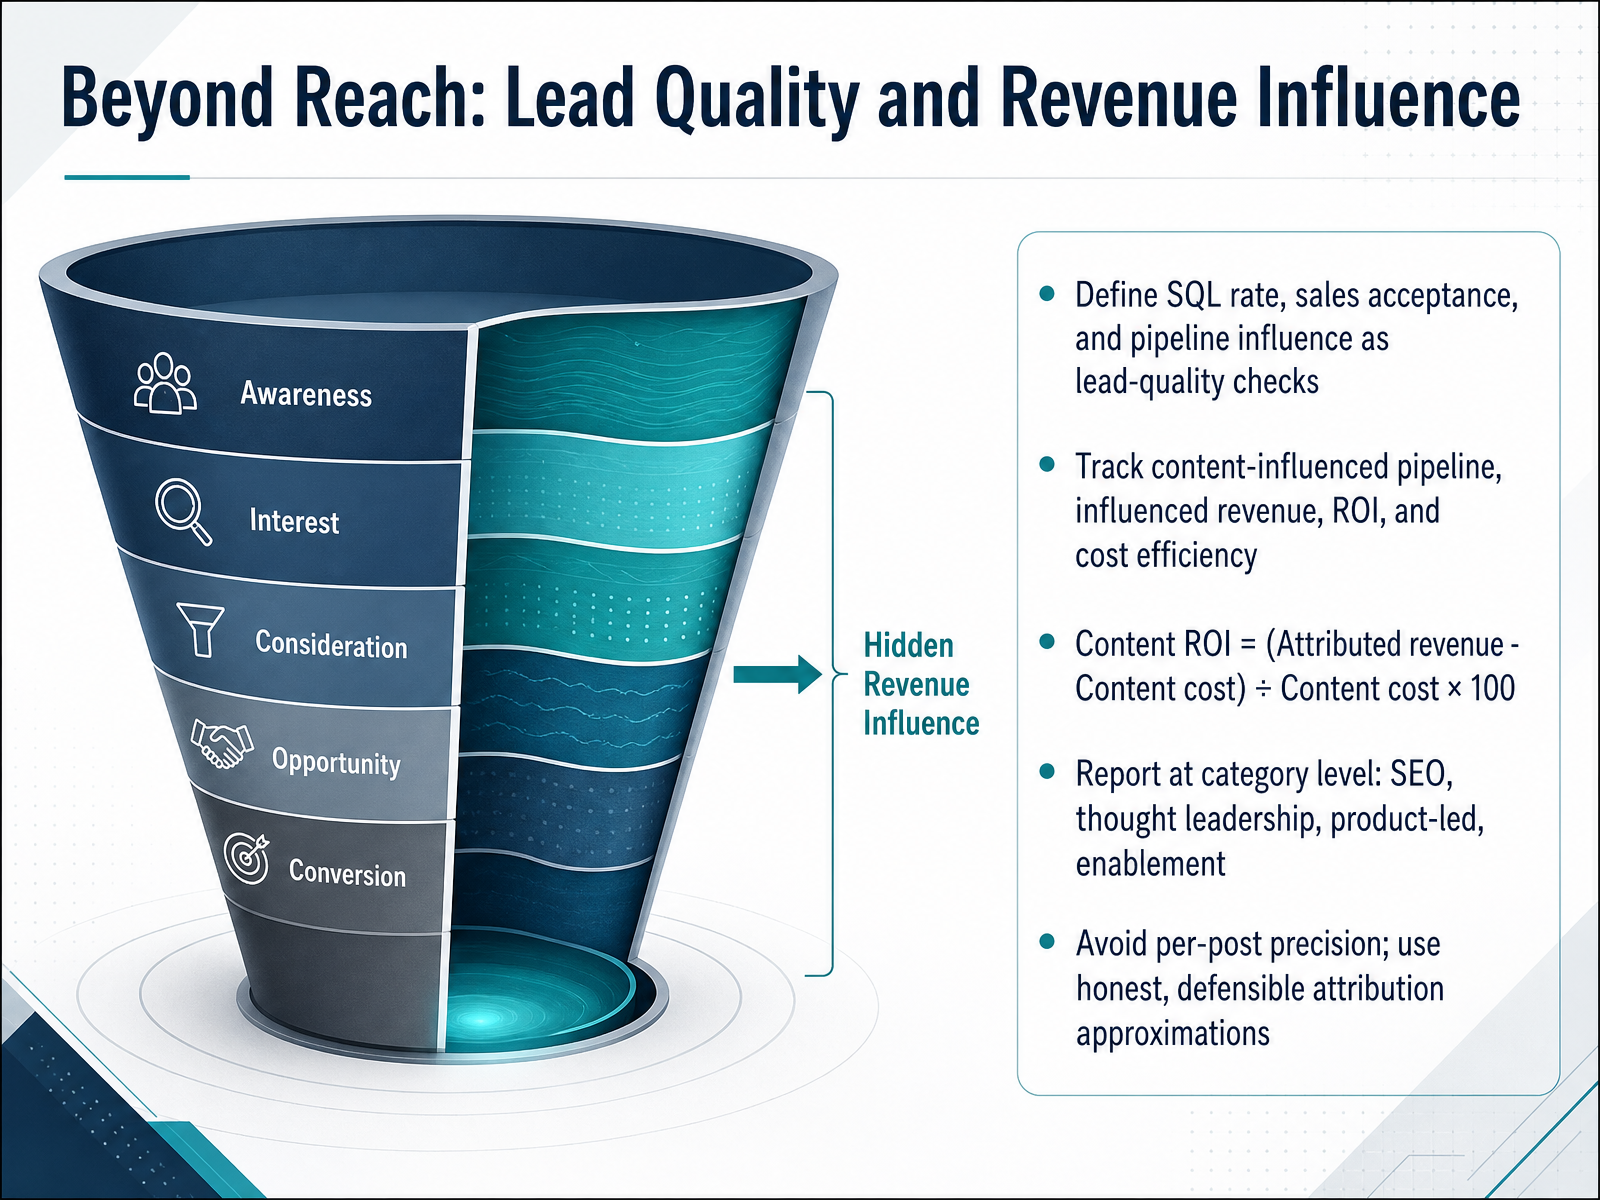
 - 06Beyond Reach: Lead Quality and Revenue InfluenceNow let's move past reach and focus on lead quality and revenue influence. This is where content stops being a traffic play and becomes a pipeline asset. Start by tracking SQL rate, sales acceptance, and pipeline influence. These are your lead-quality checks. They tell you whether content is attracting buyers worth selling to, not just anyone with a click. Next, track content-influenced pipeline, influenced revenue, ROI, and cost efficiency. For ROI, the formula is straightforward. Attributed revenue minus content cost, divided by content cost, times one hundred. That number gives you a defensible efficiency signal for budget conversations. Report these metrics at the category level. SEO, thought leadership, product-led, and enablement content all play different roles in the funnel. Measuring them together hides where the leverage actually is. And resist the urge to attribute revenue to a single blog post. Use honest, defensible approximations instead. Per-post precision sounds impressive but rarely survives scrutiny. Category-level attribution is actionable enough to reallocate budget. Next, let's look at attribution models in practice.
 sona.comivristech.comagencyanalytics.com+21 min
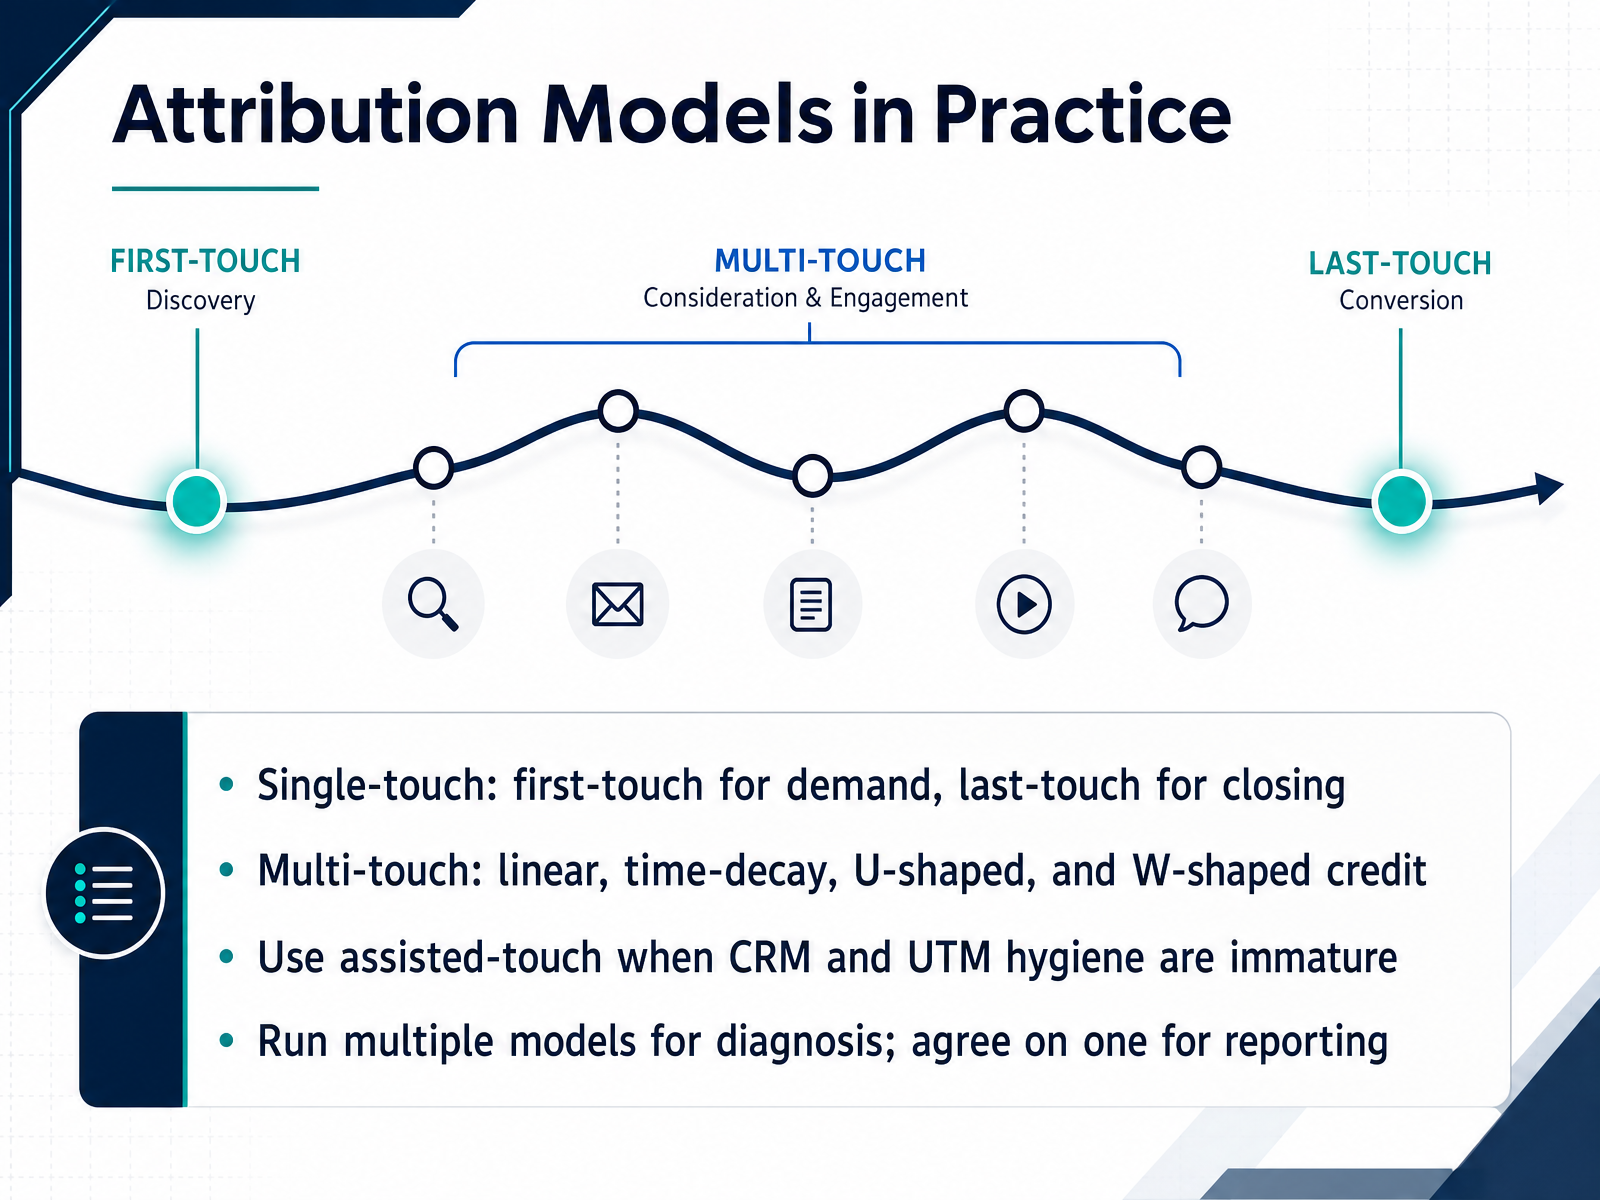
 - 07Attribution Models in PracticeAttribution models in practice start with a simple rule. Match the model to the question you need answered, not to whatever looks most rigorous in a dashboard. Single touch models give all credit to one interaction. Use first touch when you need to show which content creates demand. Use last touch when you need to see what closes pipeline. But be careful. In B2B journeys, last touch often rewards a branded search or a direct visit while erasing the blog post that started the relationship. Multi touch models distribute credit across the full path. Linear gives every touchpoint equal weight. Time decay gives more credit to interactions closer to conversion. U shaped splits forty percent to first touch, forty percent to last touch, and twenty percent across the middle. W shaped adds a third milestone, usually lead creation, which matters in longer enterprise cycles. If your CRM and UTM hygiene are still immature, skip the complexity. Use assisted touch reporting instead. It shows which content appeared anywhere in the conversion path without requiring clean multi touch data. And here is the practical rule. Run multiple models for diagnosis. Agree on one model for reporting. Different lenses reveal different problems, but your leadership needs one consistent number they can track over time. Next, we turn to tracking infrastructure and data quality, because every model is only as good as the data feeding it.
 cometly.comcometly.comtenspeed.io+22 min
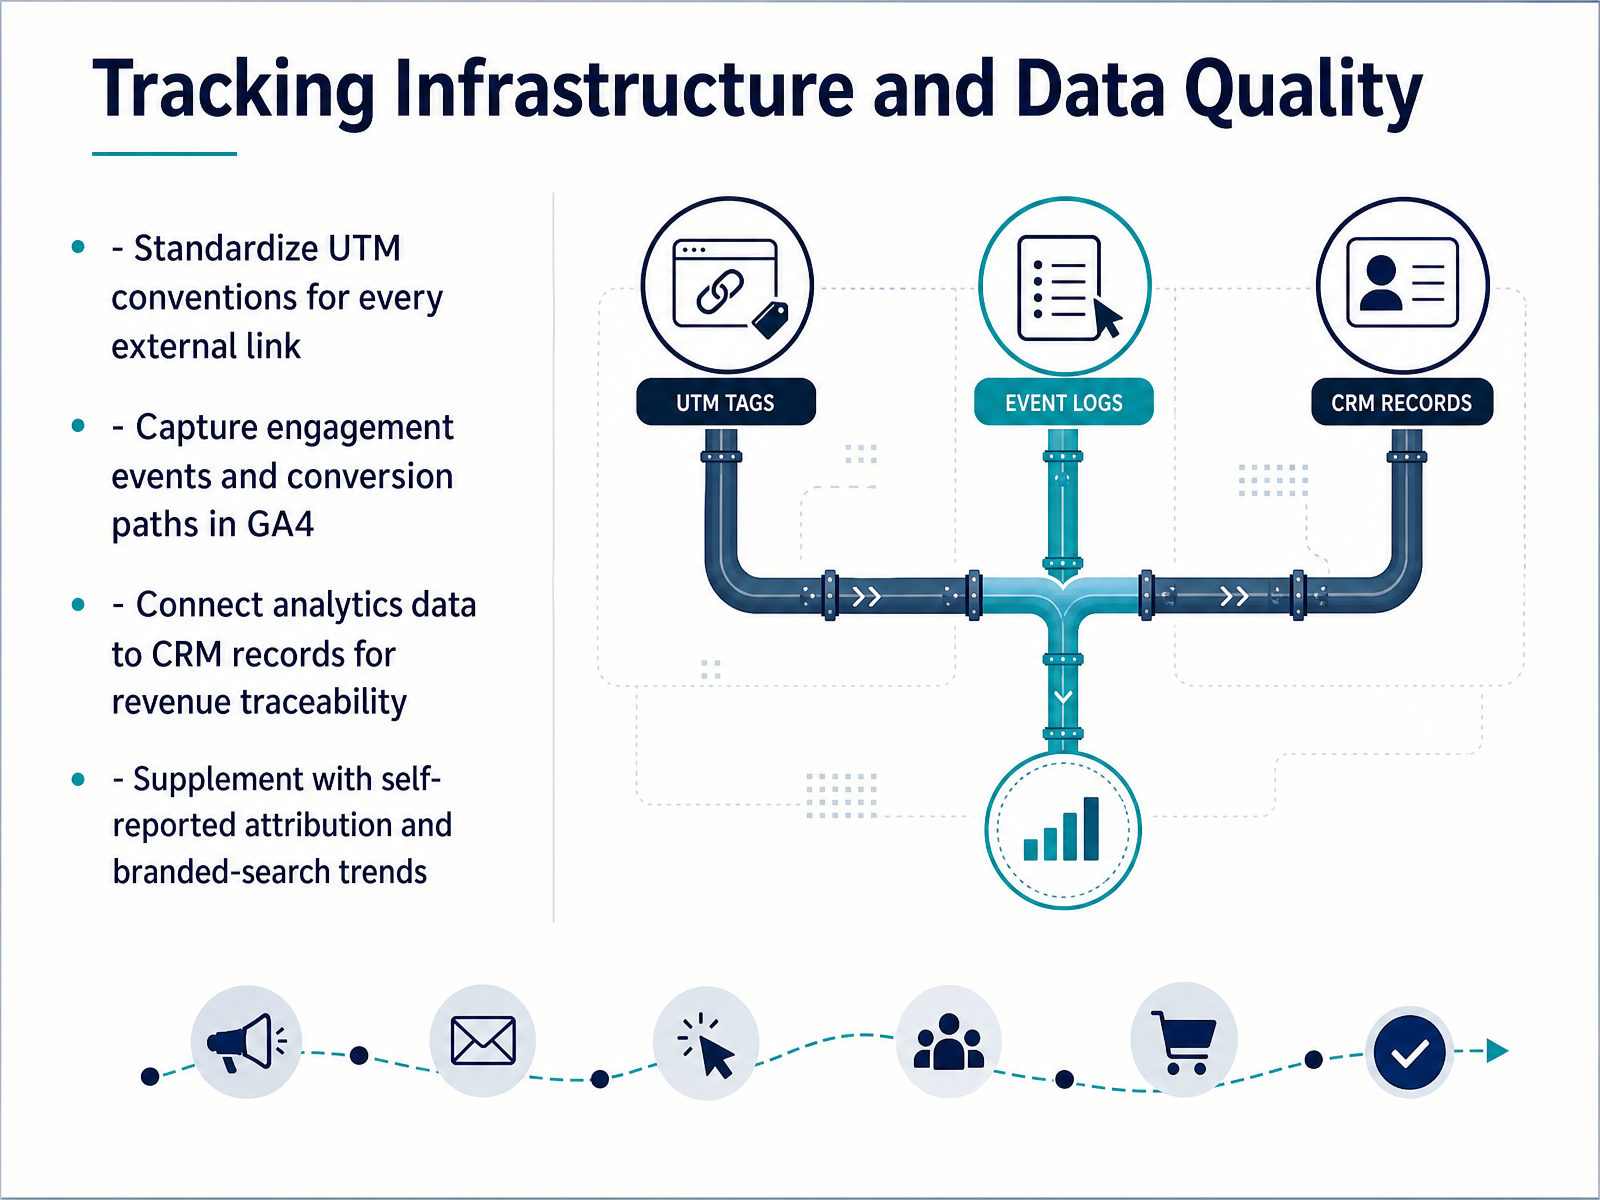
 - 08Tracking Infrastructure and Data QualityNone of the attribution models we discussed will give you signal unless your tracking infrastructure is clean. So let's get tactical about the four areas that keep your data honest. First, standardize your UTM conventions for every external link. Consistent source, medium, and campaign parameters let you compare channels without guessing. Next, go beyond pageviews in GA4 and capture engagement events like scroll depth and content downloads, plus the full conversion paths that lead to demos or signups. Third, connect your analytics data to CRM records. This is what turns anonymous touches into revenue traceability. When a lead becomes a customer, you can see which content influenced the deal. Fourth, supplement your structured data with self-reported attribution and branded-search trends. A simple form field asking how someone heard about you will surface dark funnel influence that cookies miss. Rising branded search is another sign your content is building demand. Getting these four elements in place makes every metric downstream more defensible. Next, we will move into reading trends, segments, and baselines.
 cometly.comcometly.comtenspeed.io+22 min
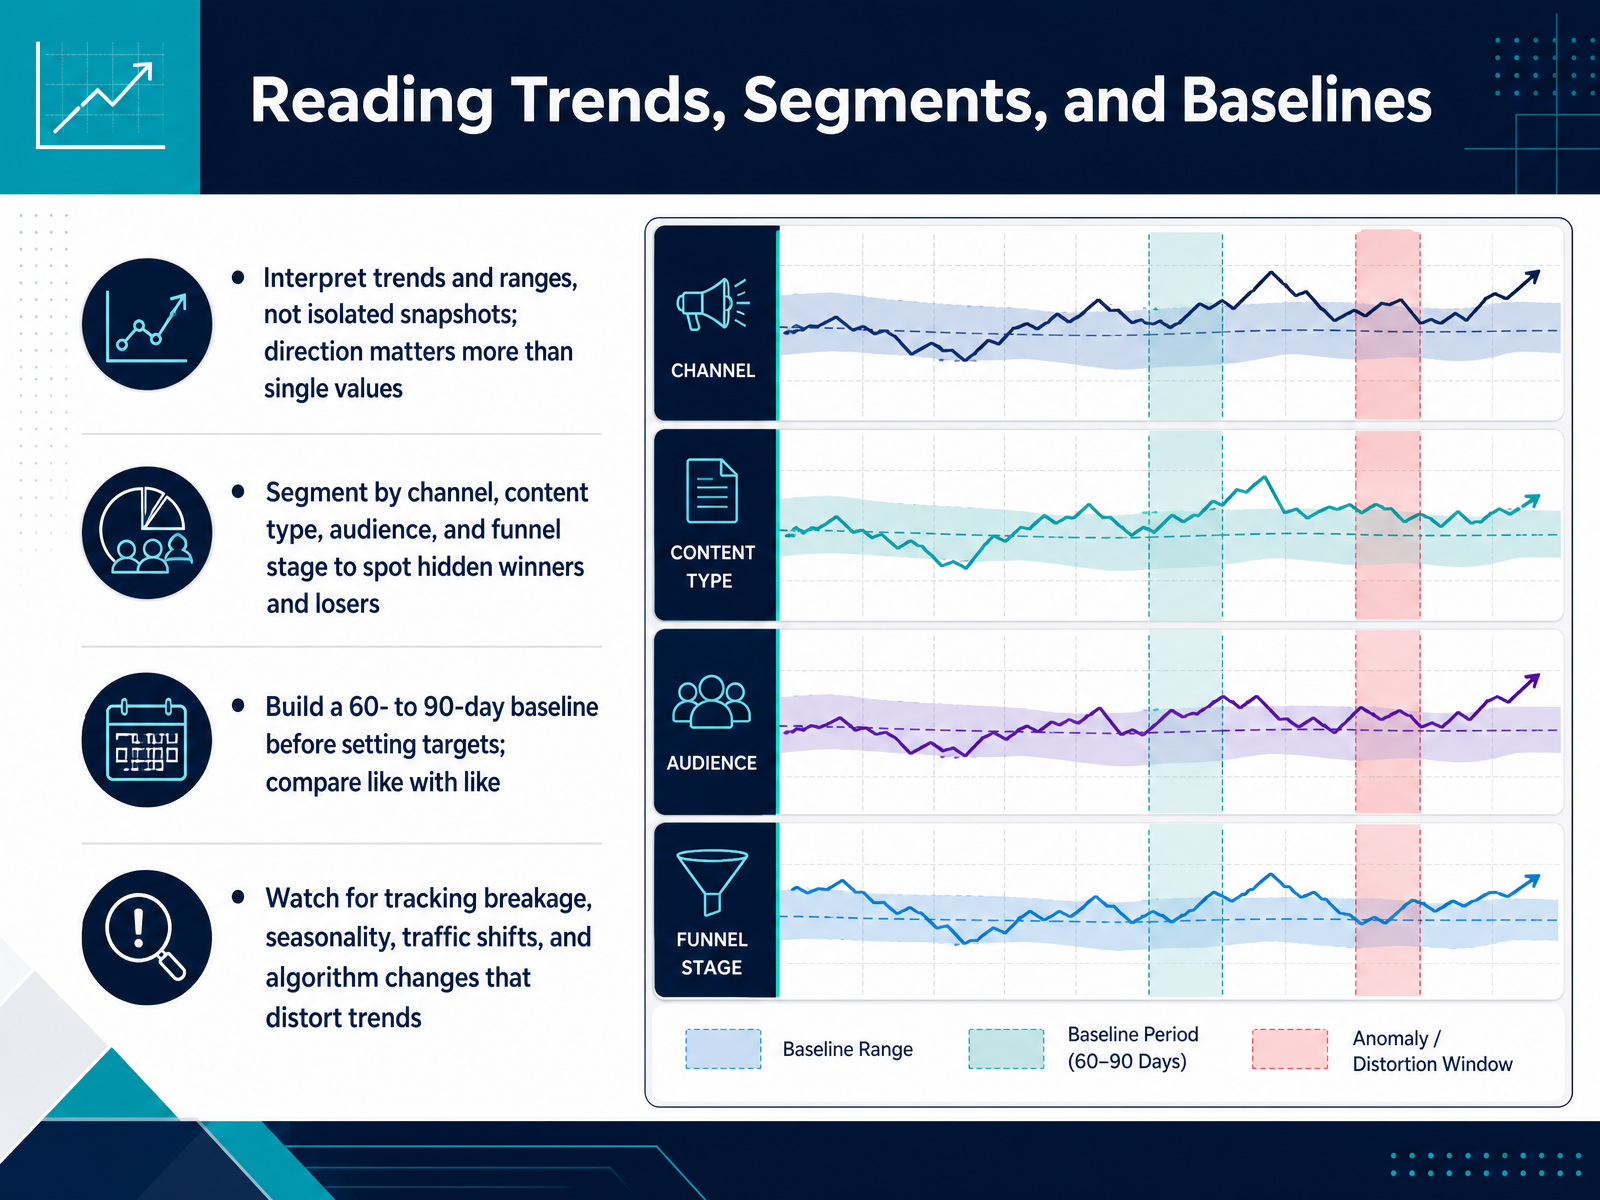
 - 09Reading Trends, Segments, and BaselinesNow, let's talk about how to read the data once you're collecting it. The biggest mistake I see is teams reacting to a single week's numbers. That's noise. What matters is direction over time. Look at trends and ranges, not isolated snapshots. A page that dropped ten percent in one week is a question mark. A page that's declined for eight straight weeks is a decision. Next, segment aggressively. Average performance will hide your hidden winners and losers. Cut the data by channel, content type, audience, and funnel stage. A comparison page and a thought leadership article have completely different jobs, so judge them separately. Before you set any targets, build a baseline. Measure for sixty to ninety days to capture the natural ups and downs of your own content. This lets you compare like with like instead of chasing benchmarks from other businesses. Finally, check for distortion before you celebrate or panic. Tracking breakage, seasonality, traffic shifts, and algorithm changes all move your numbers without reflecting your content quality. Always ask what else changed. That brings us to the practical next step.
 tenspeed.iocontentmarketinginstitute.comthemarketingjuice.com+22 min
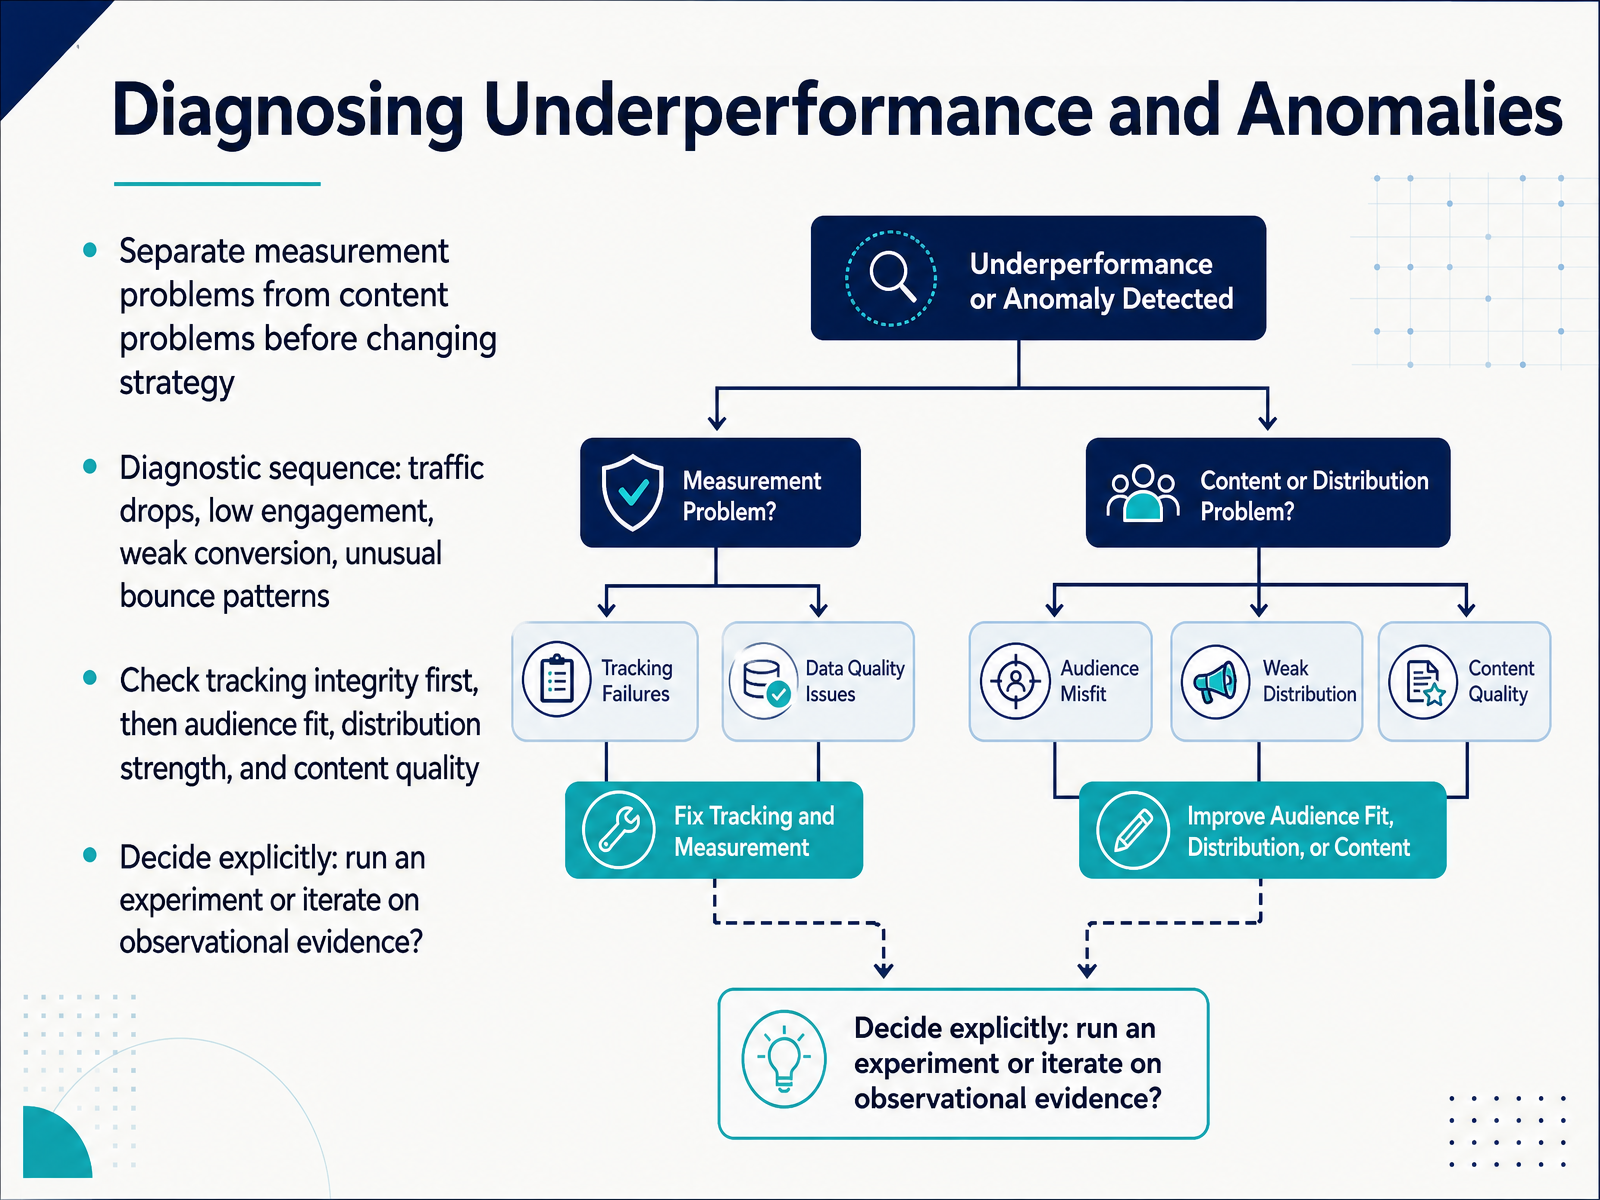
 - 10Diagnosing Underperformance and AnomaliesNow let's talk about diagnosing underperformance and anomalies. When a key metric drops, your first job is to separate measurement problems from content problems. Do not change your strategy until you know which one you are facing. Start with a simple diagnostic sequence. Check whether traffic actually dropped, or whether engagement fell while traffic stayed flat. Then look at conversion and any unusual bounce patterns. This order saves you from fixing a content issue when the real problem is a broken tracking script. So check tracking integrity first. Verify that your analytics tags, UTMs, and CRM sync are working before you question audience fit, distribution strength, or content quality. A common example is a sudden forty percent drop in form fills. That usually points to a broken call-to-action, not a failed content strategy. If the tracking is clean, then decide explicitly whether to run a controlled experiment or iterate on observational evidence. Experiments give you clearer cause and effect, but they take more setup. Observation is faster, but it can mislead you. Make that choice before you act. Next, we will look at how to design dashboards for different stakeholders.
 tenspeed.iocontentmarketinginstitute.comthemarketingjuice.com+21 min
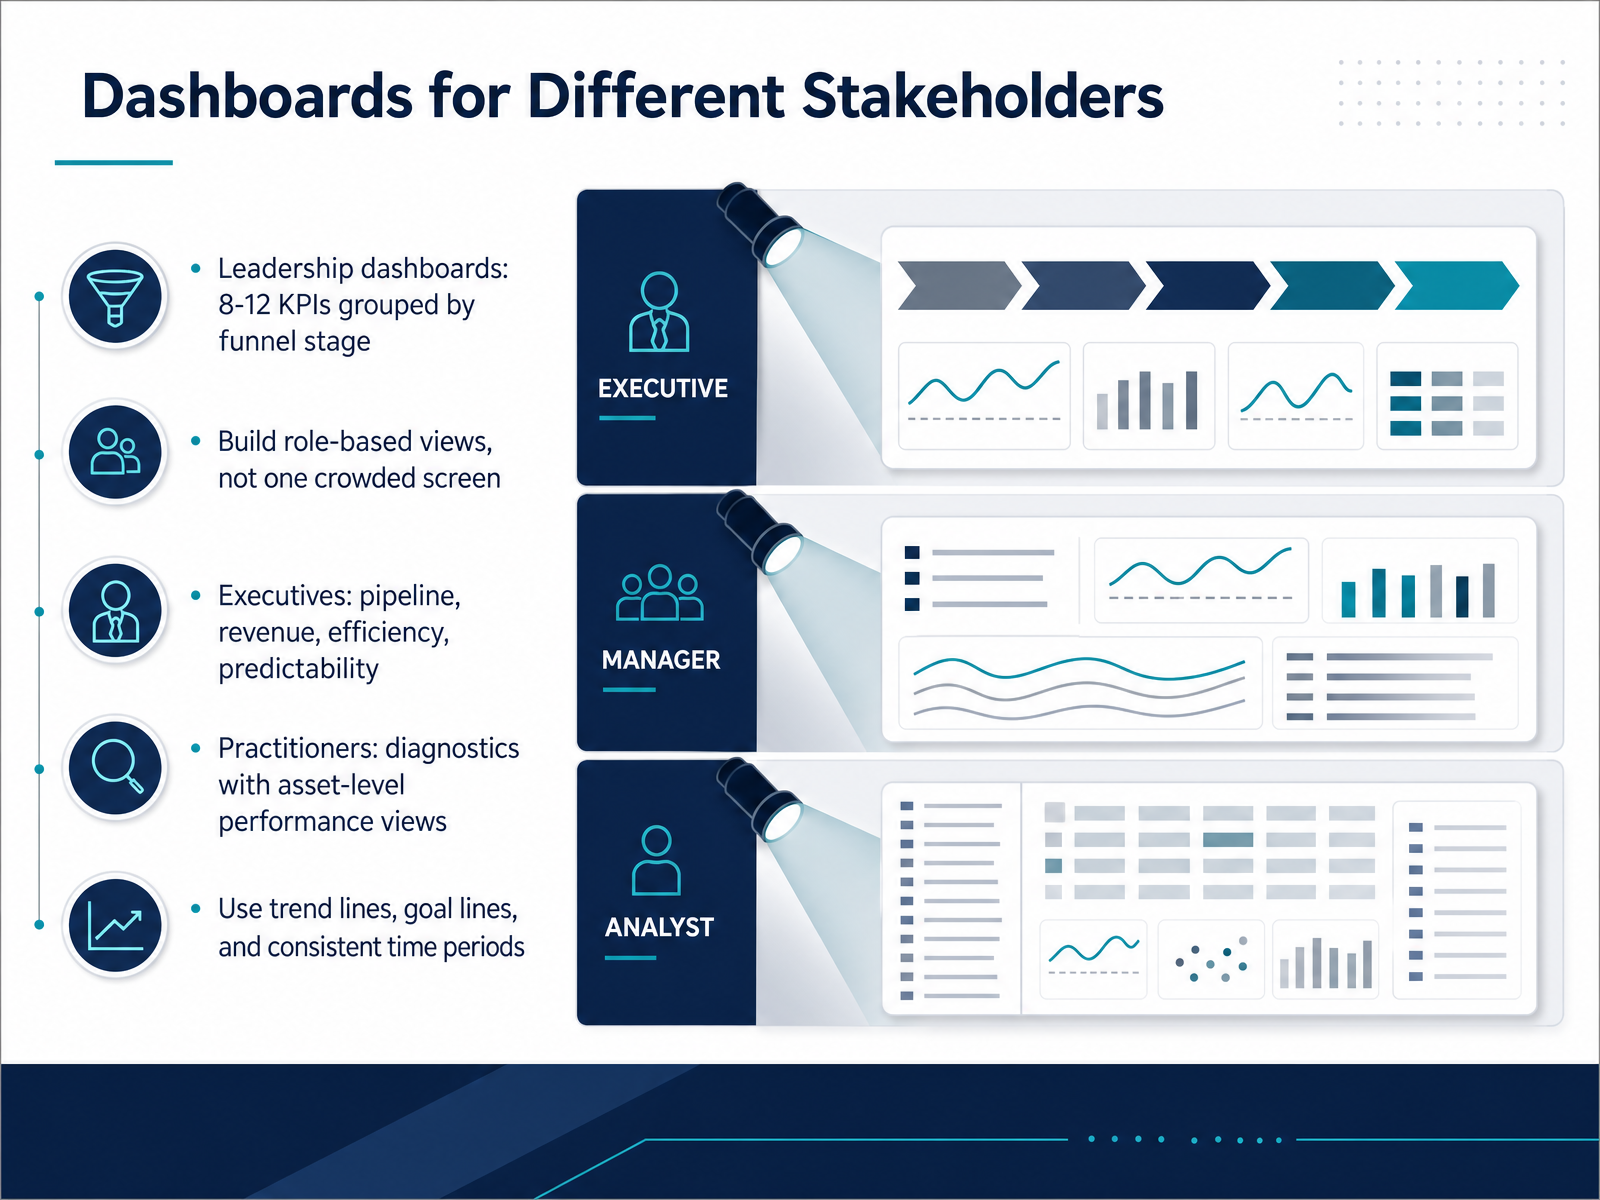
 - 11Dashboards for Different StakeholdersNow let's talk about building dashboards for the right people, because one crowded screen never works. Limit leadership views to eight to twelve KPIs, grouped by funnel stage. Executives need to see pipeline, revenue, efficiency, and predictability. Practitioners need diagnostics. They need asset-level performance views so they can spot what to fix this week. Use trend lines and goal lines so a number has context. And keep time periods consistent across every widget, otherwise you are comparing apples to oranges. Next, we'll cover reporting that tells a defensible story.
 sona.comivristech.comagencyanalytics.com+21 min
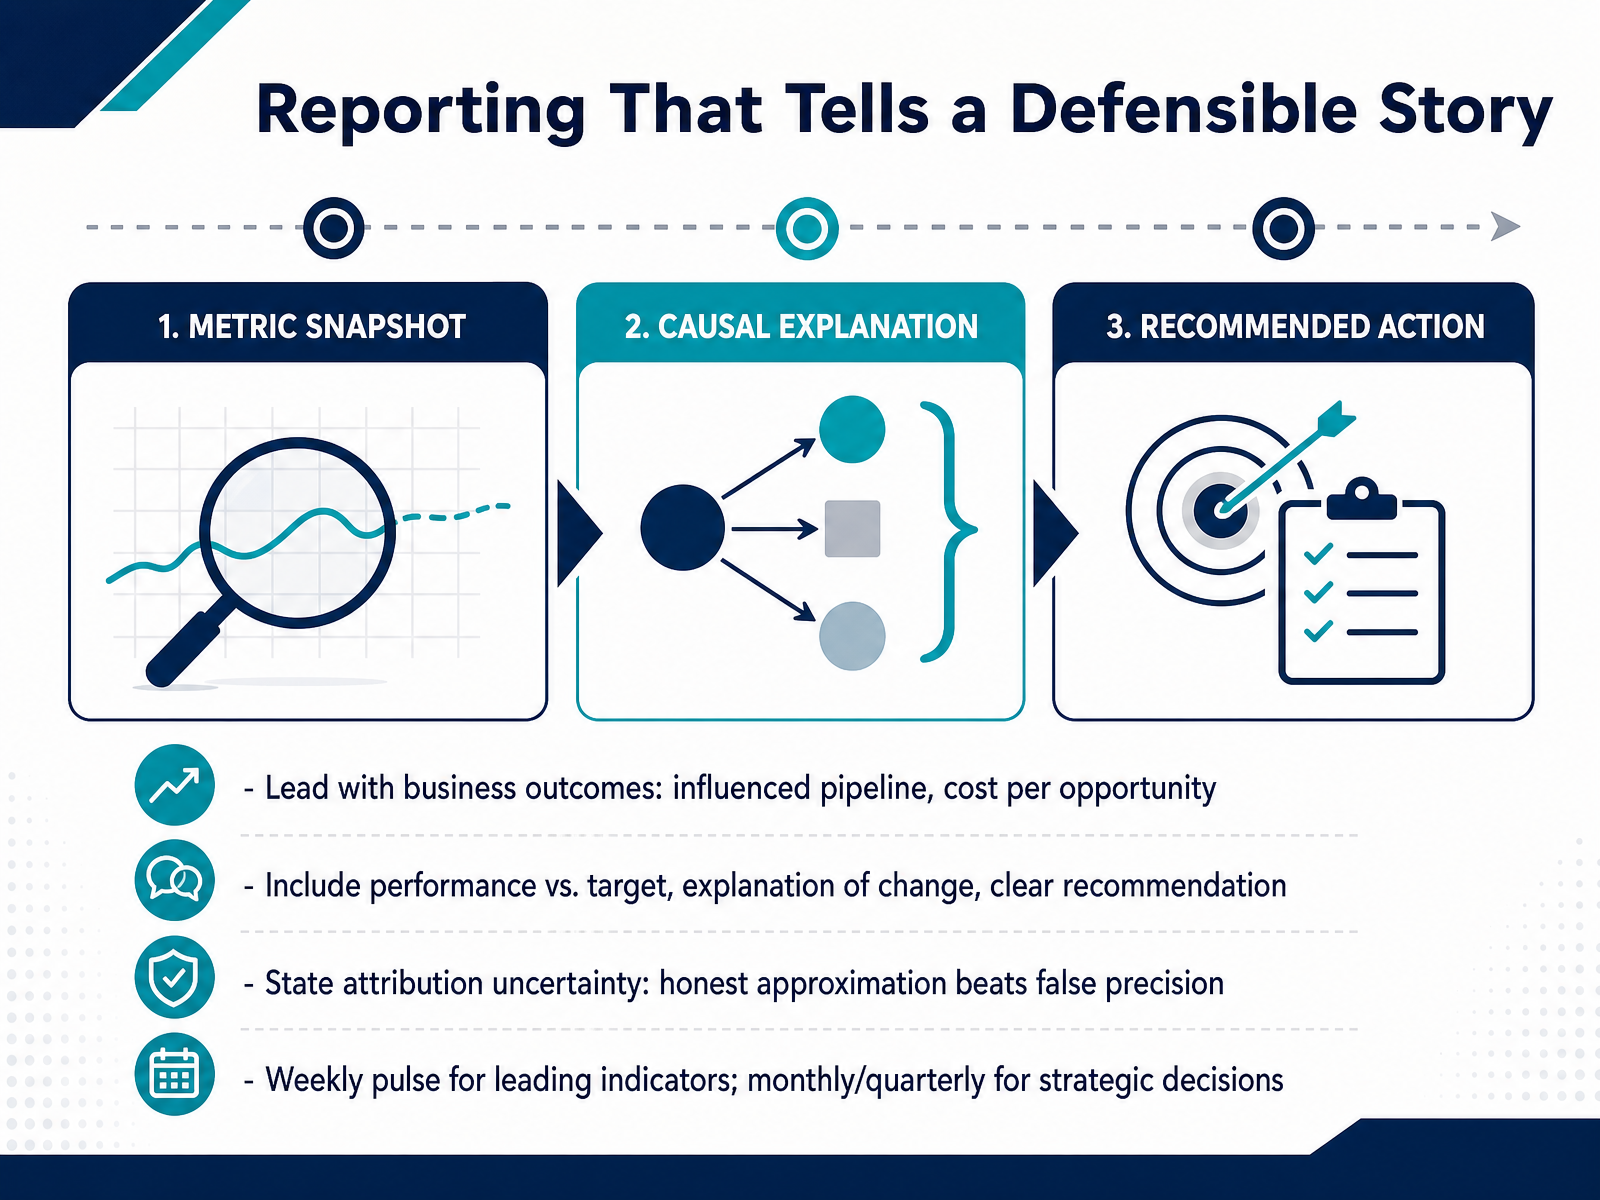
 - 12Reporting That Tells a Defensible StoryHere's where we turn measurement into a narrative you can actually defend. Reporting that tells a defensible story always leads with business outcomes, not activity. Start your report with influenced pipeline and cost per opportunity. Those are the numbers your stakeholders care about. Then include the critical context. Show performance against target, explain what changed and why, and end every section with a clear recommendation. A number with no next step is just decoration. Now, about attribution. Be honest here. State your model's limitations upfront. An honest approximation using assisted conversions beats false precision every time. If your data shows a content touchpoint appeared in the journey, say that. Don't pretend you have perfect last-click certainty. Finally, match your cadence to the decision. Run a weekly pulse for leading indicators like traffic and conversion activity. Reserve monthly and quarterly reviews for strategic questions like budget allocation and pipeline efficiency. That rhythm keeps the team responsive without creating analysis paralysis. Up next, we'll shift from measurement to action in our final section, From Metrics to Decisions.
 sona.comivristech.comagencyanalytics.com+22 min
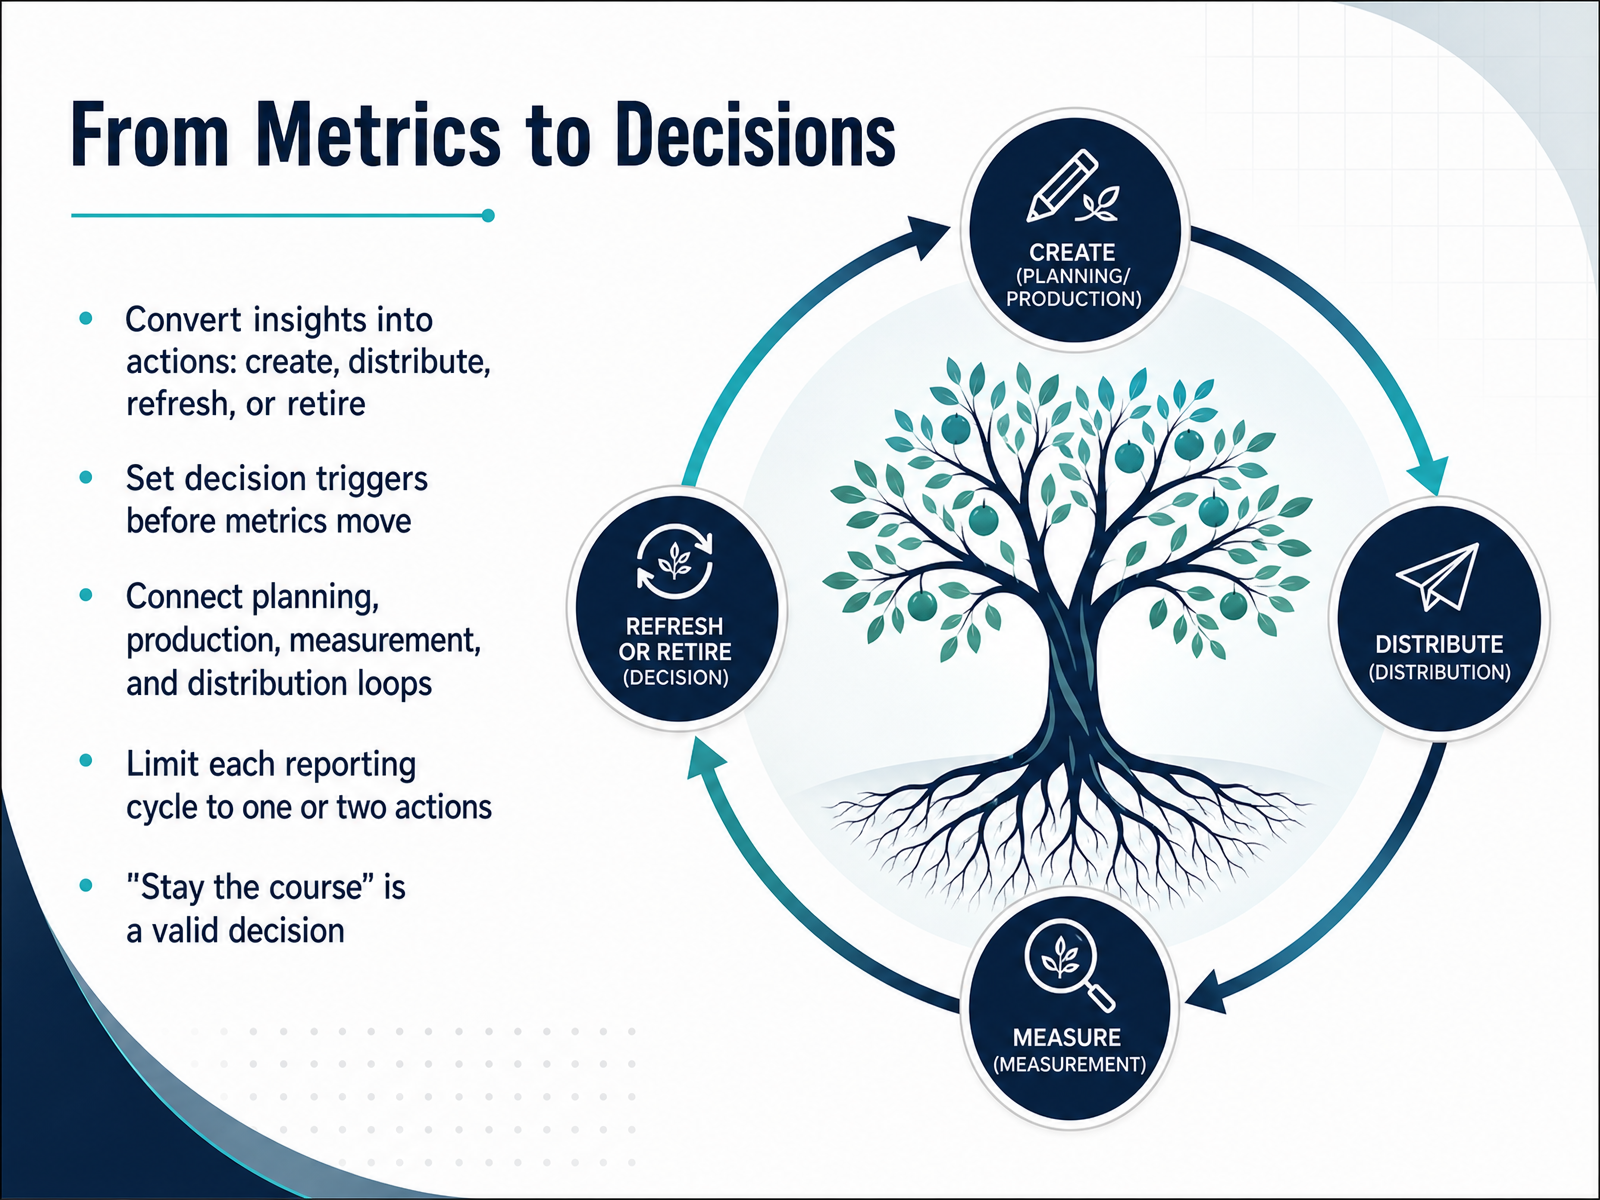
 - 13From Metrics to DecisionsAlright, let's talk about the part where measurement actually pays off: turning numbers into decisions. The core rule is this. Every reporting cycle should end with one of four actions. Create something new to fill a gap. Refine an existing piece or distribution channel. Refresh an asset that's losing traction. Or retire content that no longer earns its keep. Before you look at your data, set your decision triggers. Decide in advance what a CTA click-through rate above five percent means, or what a qualified conversion below one percent means. That way, the metric tells you to act instead of sparking a debate. And connect your loops. Planning, production, measurement, and distribution should feed each other, not live in separate silos. Here is the most common mistake I see. You surface twelve recommendations, stakeholders nod, and nothing changes. So commit to one or two actions per cycle. That builds real operational cadence. And remember: 'stay the course' is a legitimate decision when performance meets thresholds. With that mindset locked in, let's move to the final slide and build a repeatable measurement playbook.
 tenspeed.iocontentmarketinginstitute.comthemarketingjuice.com+21 min
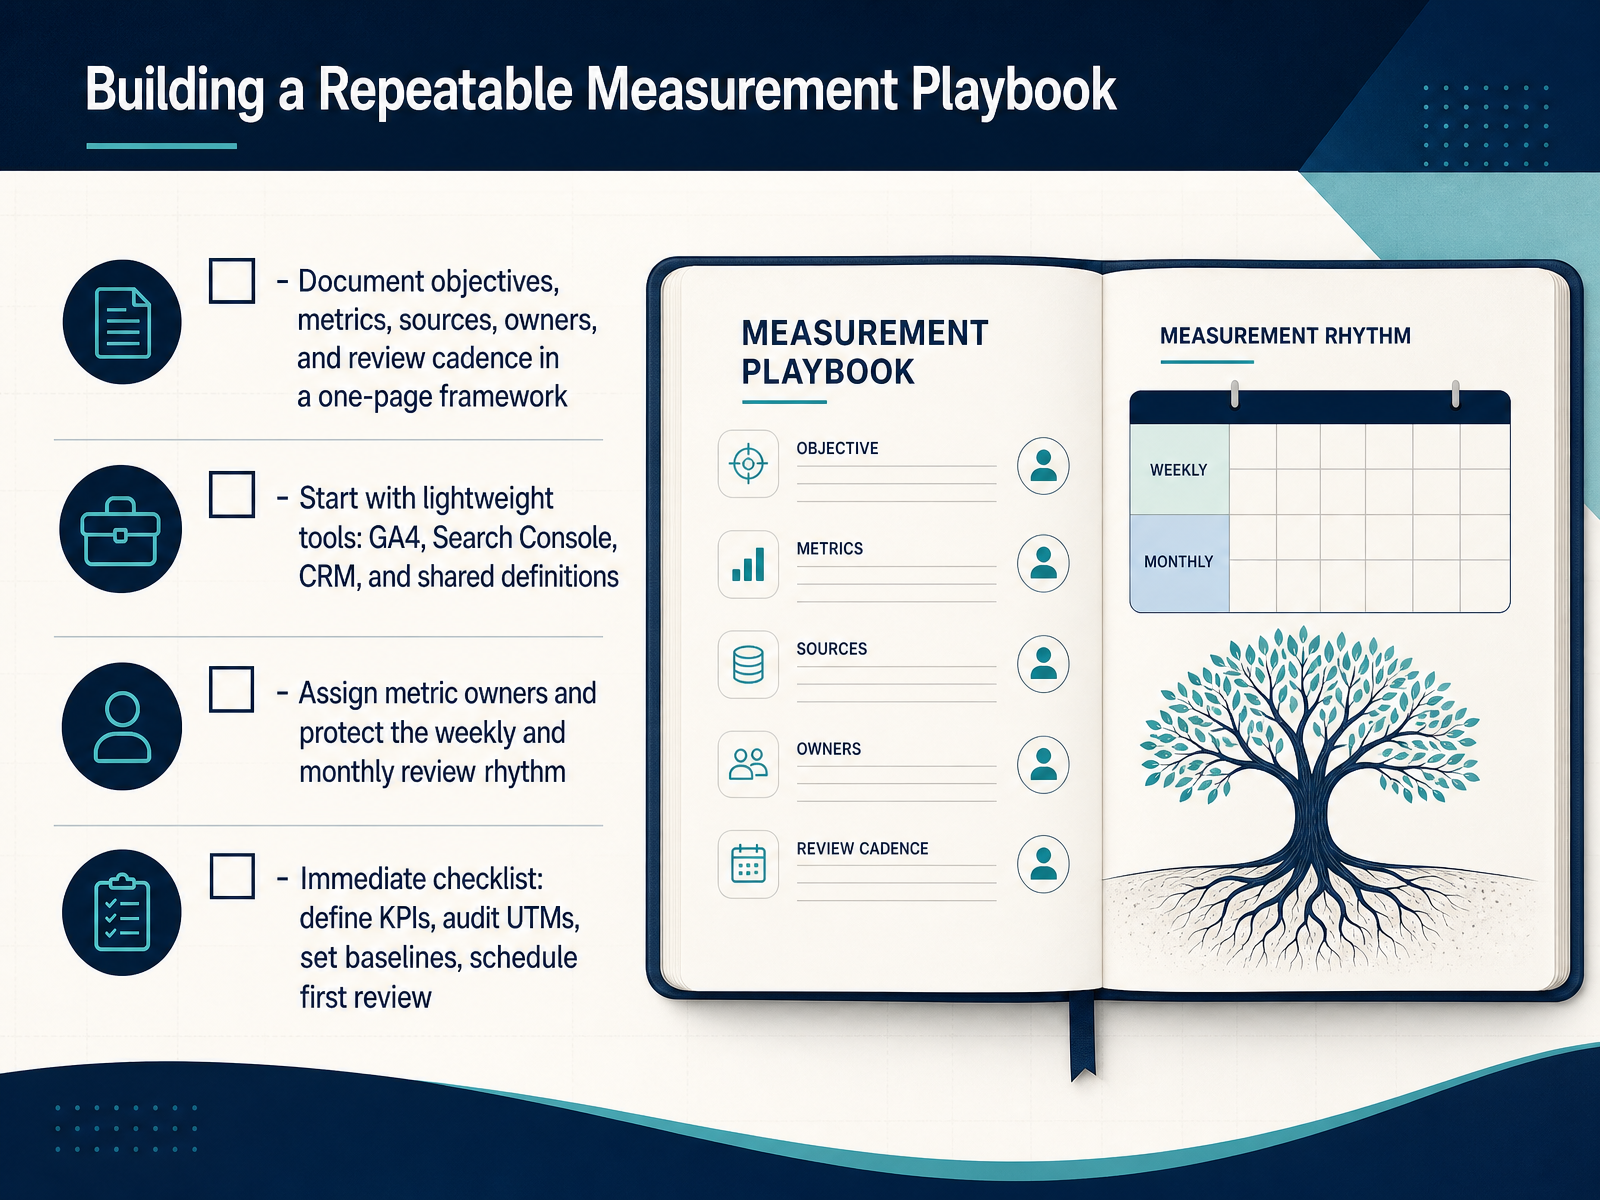
 - 14Building a Repeatable Measurement PlaybookLet's land this with a repeatable playbook. Start with a one-page framework that documents your objectives, the metrics, the data sources, the owners, and the review cadence. Keep that document simple. A one-pager gets used. A forty-tab spreadsheet does not. Start with lightweight tools you already have. GA4, Search Console, your CRM, and a shared definitions doc. You don't need enterprise attribution software on day one. Next, assign a single owner to each metric. When a metric belongs to everyone, it belongs to no one. Protect the review rhythm. Run a quick weekly pulse check on leading indicators like traffic and form fills. Then hold a monthly review focused on pipeline influence and decisions. Finally, start this week with four actions. Define your core KPIs. Audit your UTM tagging. Set a baseline for current performance. And schedule your first review meeting. Measurement only creates value when someone reviews it regularly and acts on it. Build the habit now, and your reporting will drive decisions instead of decorating dashboards. That wraps up this course. Thanks for learning with me. Go set your baselines and make measurement part of how your team operates.
 tenspeed.iocontentmarketinginstitute.comthemarketingjuice.com+22 min
Take the deck with you
Download this course as a file — free, no sign-up needed.
- PDF handoutEvery slide page, ready to print or share.15 pages · 3.6 MBDownload
- Narrated PowerPointThe deck that presents itself — every slide carries the digital human's narration video.15 pages · 15.4 MBDownload
- PowerPoint slidesThe full deck as a .pptx — open it in PowerPoint, Keynote, or Google Slides.15 pages · 3.5 MBDownload
Free to use in your own training — please keep the PersonWise credit page at the end.
Have your own deck? Turn it into a course
Sources consulted
Web sources consulted while building this course.
- What Is a Content Marketing Metrics Dashboard? Definition and Best Practices | Sona — sona.com
- Content Marketing Metrics Dashboard: Prove Real ROI (2026) — ivristech.com
- Content Marketing Dashboard: How To Build, Track KPIs & Prove ROI - AgencyAnalytics — agencyanalytics.com
- How to Measure Content Marketing Success in 2026 | Ten Speed — tenspeed.io
- Guide to Reporting on Your Content Marketing Success | Content RevOps — contentrevops.com
- 5-Step Content Marketing Measurement Framework — contentmarketinginstitute.com
- Content Marketing Metrics That Drive Business Outcomes — themarketingjuice.com
- Measuring Content Marketing: A Practical Playbook for 2026 — trysight.ai
- Content Marketing Metrics: KPIs by Funnel Stage (2026 Guide) — marketful.com
- Content Marketing Conversion: What Good Looks Like for B2B Teams in 2026 | Ten Speed — tenspeed.io
- The Content ROI Playbook: How to Measure What Actually Matters in 2026 - Chief Content Marketer — chiefcontentmarketer.com
- Content Marketing Reporting: Metrics That Matter — themarketingjuice.com
- Attribution For Content Marketing: Prove Your ROI! — cometly.com
- Content Marketing Attribution Methods: A Complete Guide — cometly.com
- Content Marketing Attribution: A Framework for B2B Teams | Ten Speed — tenspeed.io
- Measure Content Marketing ROI With Multi-Touch Attribution Models — nestscale.com
- Content Marketing ROI 2026: Measurement Framework — digitalapplied.com