Content Marketing Metrics Mastery
Begin
14 pages · ~28 min
Content Marketing Metrics Mastery
Learn to measure and interpret key content marketing metrics, enabling data-driven decisions to optimize campaign performance and ROI.
What you’ll learn
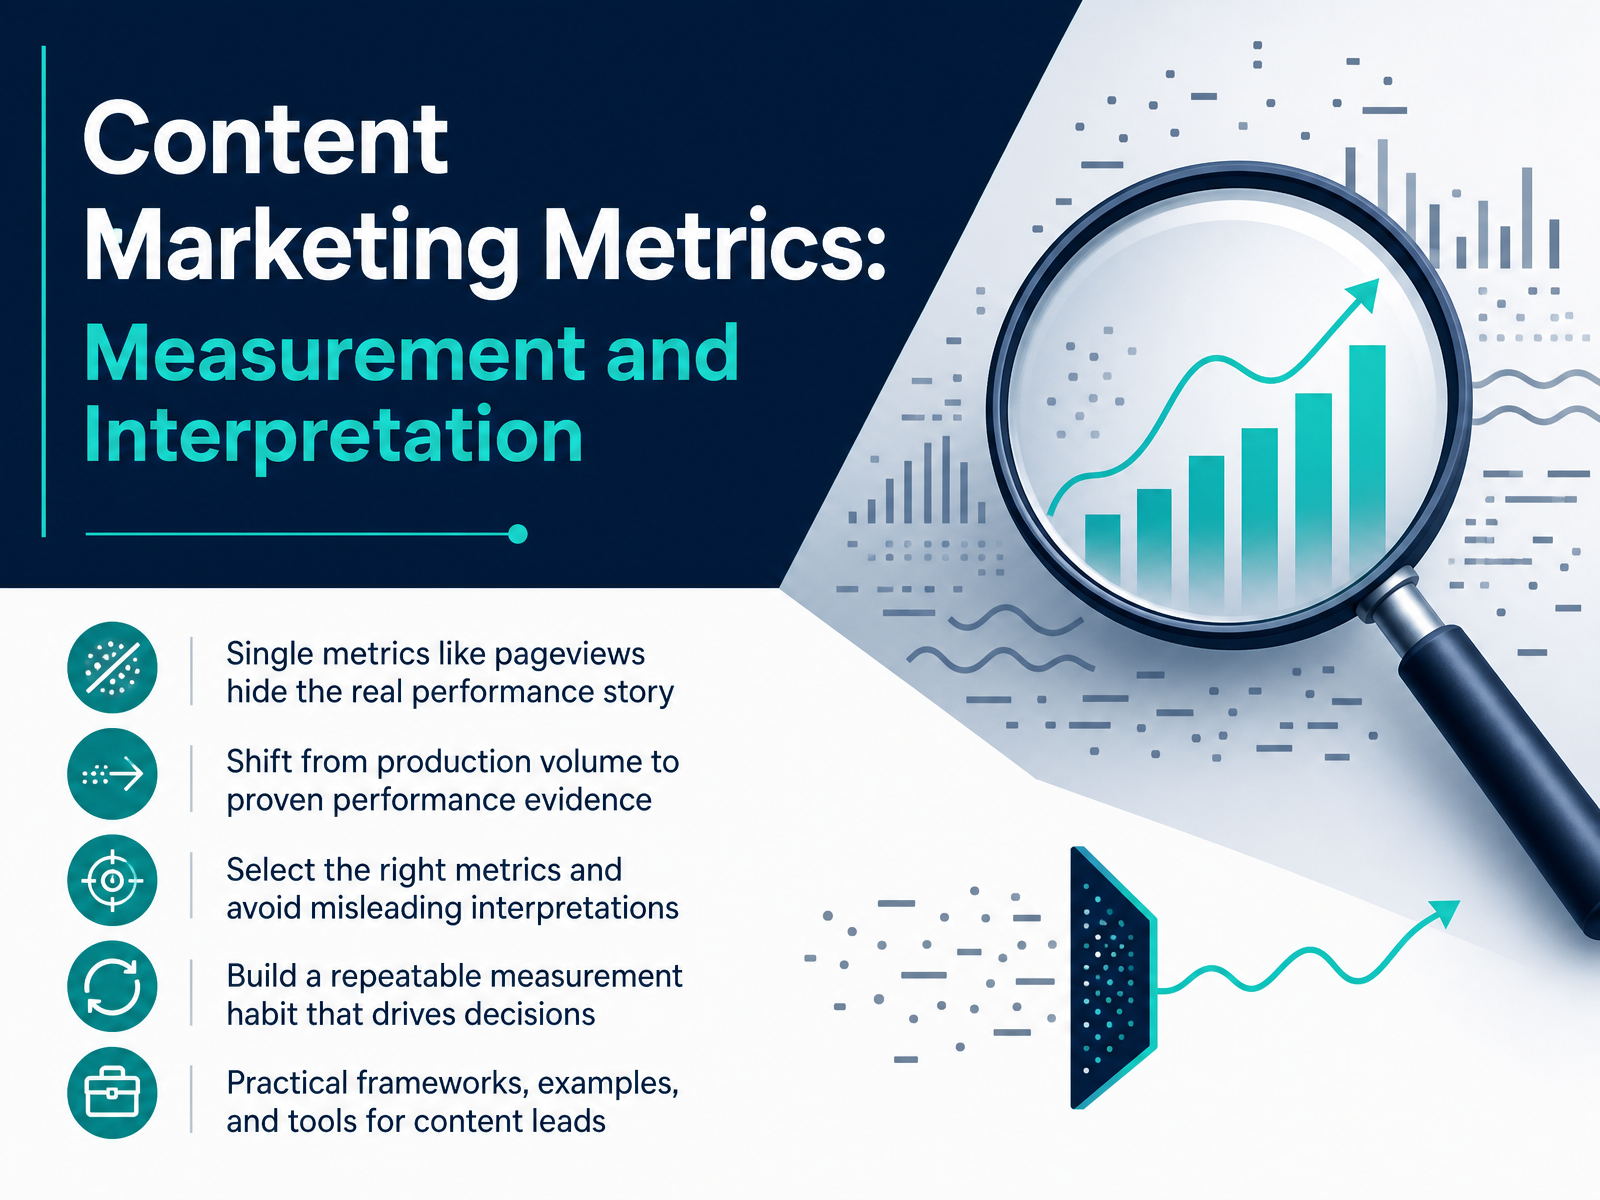
- 01Content Marketing Metrics: Measurement and InterpretationWelcome. If you lead a content team or create content that needs to prove itself, you know the feeling: the dashboard looks great, but leadership still asks, 'What did this actually do for the business?' The answer usually gets lost in a sea of pageviews and shares. That's what this course is about. We're going to move beyond single metrics that hide the real story, and shift from measuring production volume to proving performance. You'll learn how to select the right metrics, avoid misleading interpretations, and build a repeatable measurement habit that drives better decisions and protects your budget. We'll use practical frameworks, real examples, and tools you can start using this week. Let's get into it. First, we need to confront a trap that keeps most content teams stuck: the trap of single-metric thinking.contentmarketinginstitute.commarketful.comtenspeed.io+21 min
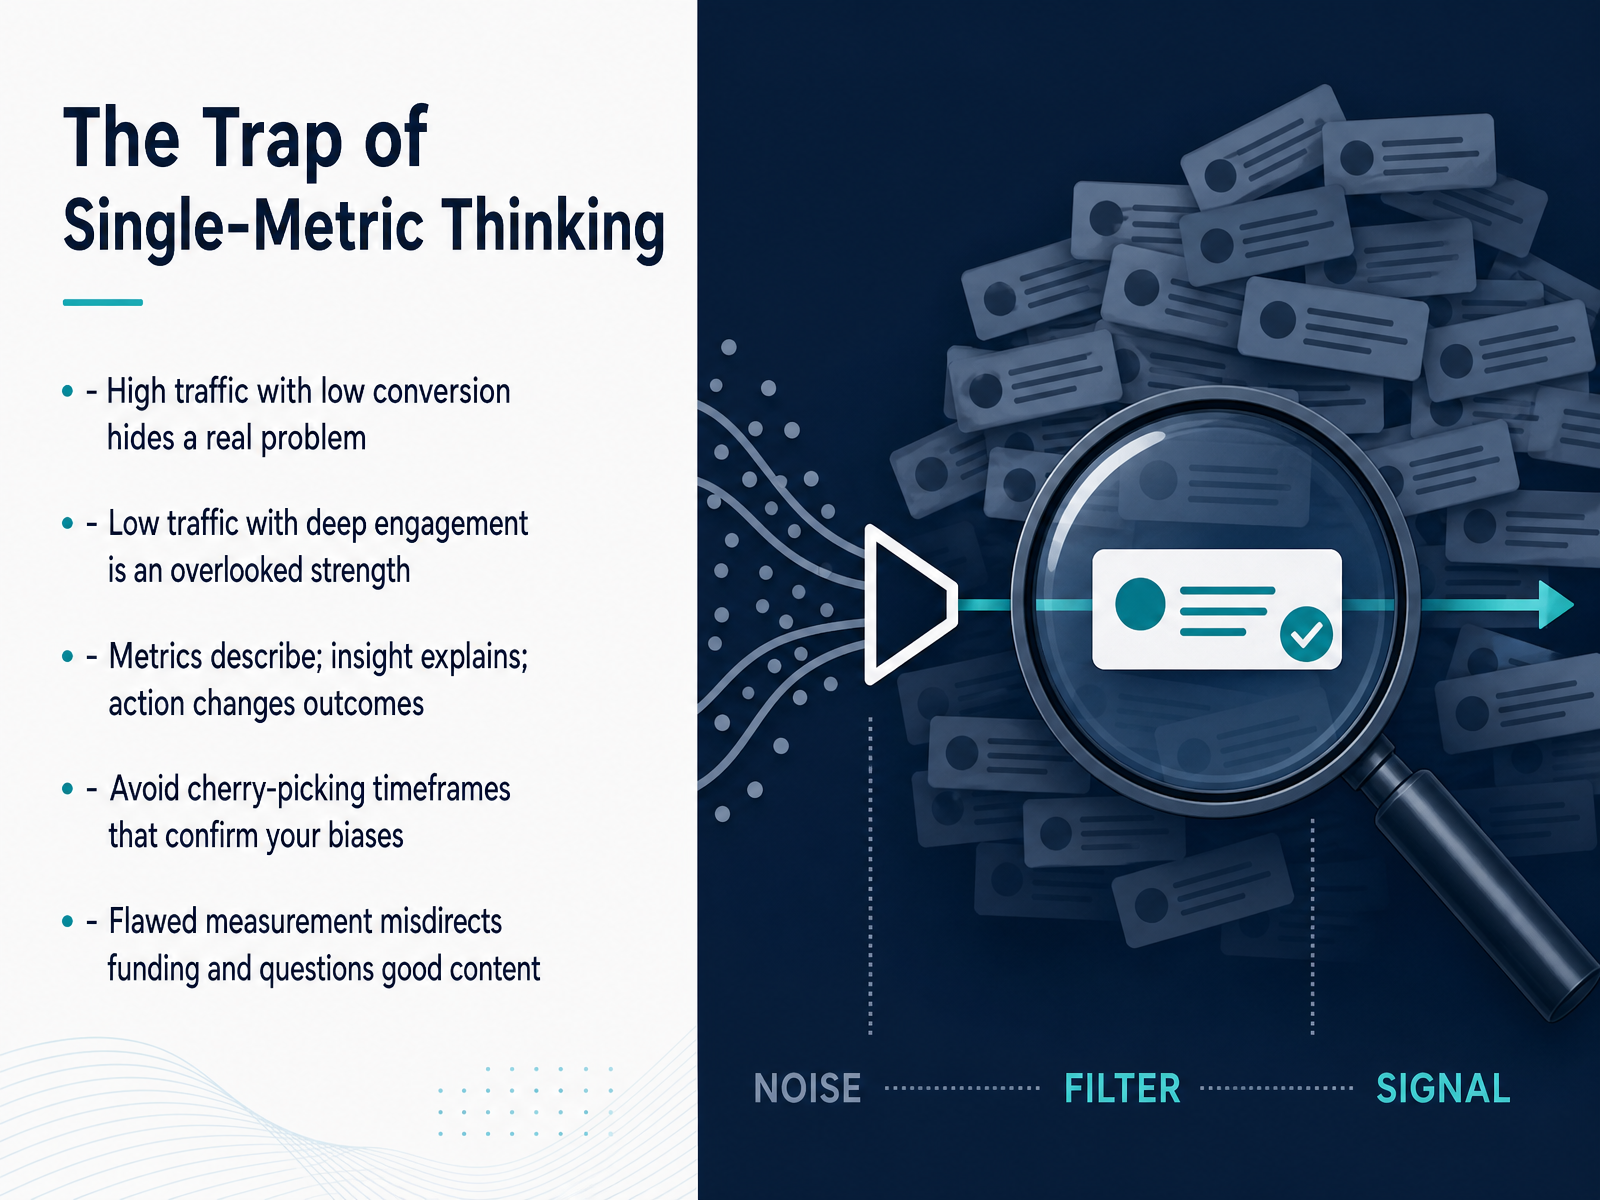
- 02The Trap of Single-Metric ThinkingLet's talk about a trap that catches almost every content team: single-metric thinking. You pull up the dashboard and see a post with huge traffic. Feels like a win, but if that traffic isn't converting, you're not looking at a win; you're looking at a problem hiding in plain sight. The reverse is true, too. A piece with modest traffic but deep engagement, with readers who scroll to the bottom and actually take a next step, that's an overlooked strength in most reports. Metrics describe what happened. Insight explains why it happened. Action is what changes outcomes. So resist the urge to cherry-pick timeframes that confirm your own biases. That's a fast way to misdirect funding and get good content questioned. Numbers are a starting point, not the whole story. Now let's build a practical framework to make sense of them.
 contentmarketinginstitute.comblog.theseoengine.comshankom.com+22 min
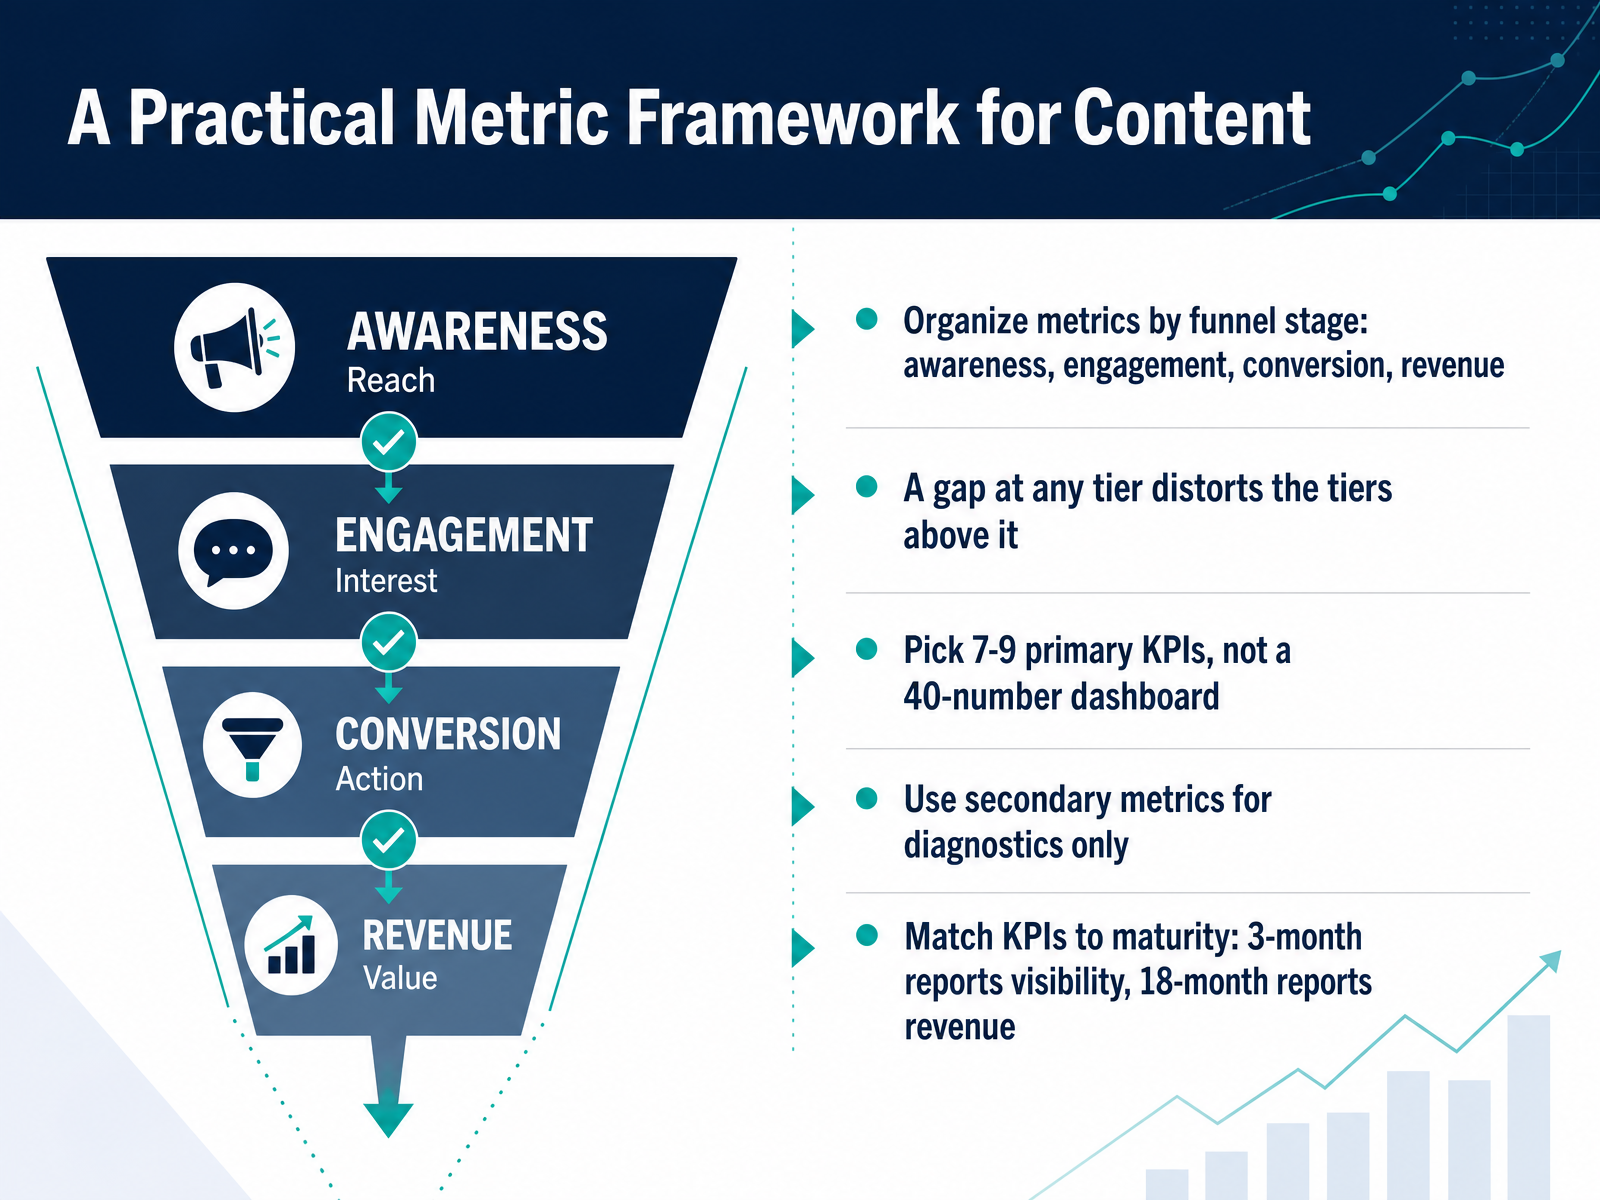
 - 03A Practical Metric Framework for ContentLet’s put this into a practical framework. Organize your metrics by funnel stage: awareness, engagement, conversion, and revenue. The reason is simple. A gap at any tier will distort the tiers above it. If your tracking for awareness is broken, your conversion numbers will look confusing, and you won’t know why. Next, be disciplined about what you report. Pick seven to nine primary KPIs. Not a forty-number dashboard. A forty-number report is a zero-number report, because nobody reads it. Track everything else as secondary metrics, purely for diagnostics. And match your KPIs to your program’s maturity. If your content program is three months old, report visibility signals like organic traffic and impressions. If it’s over eighteen months old, focus on revenue attribution, because by then you have the data to back it up. The goal is to keep your reporting honest and actionable at every stage. Next, let’s dig into the core content metrics and how to read them.
 contentmarketinginstitute.commarketful.comtenspeed.io+22 min
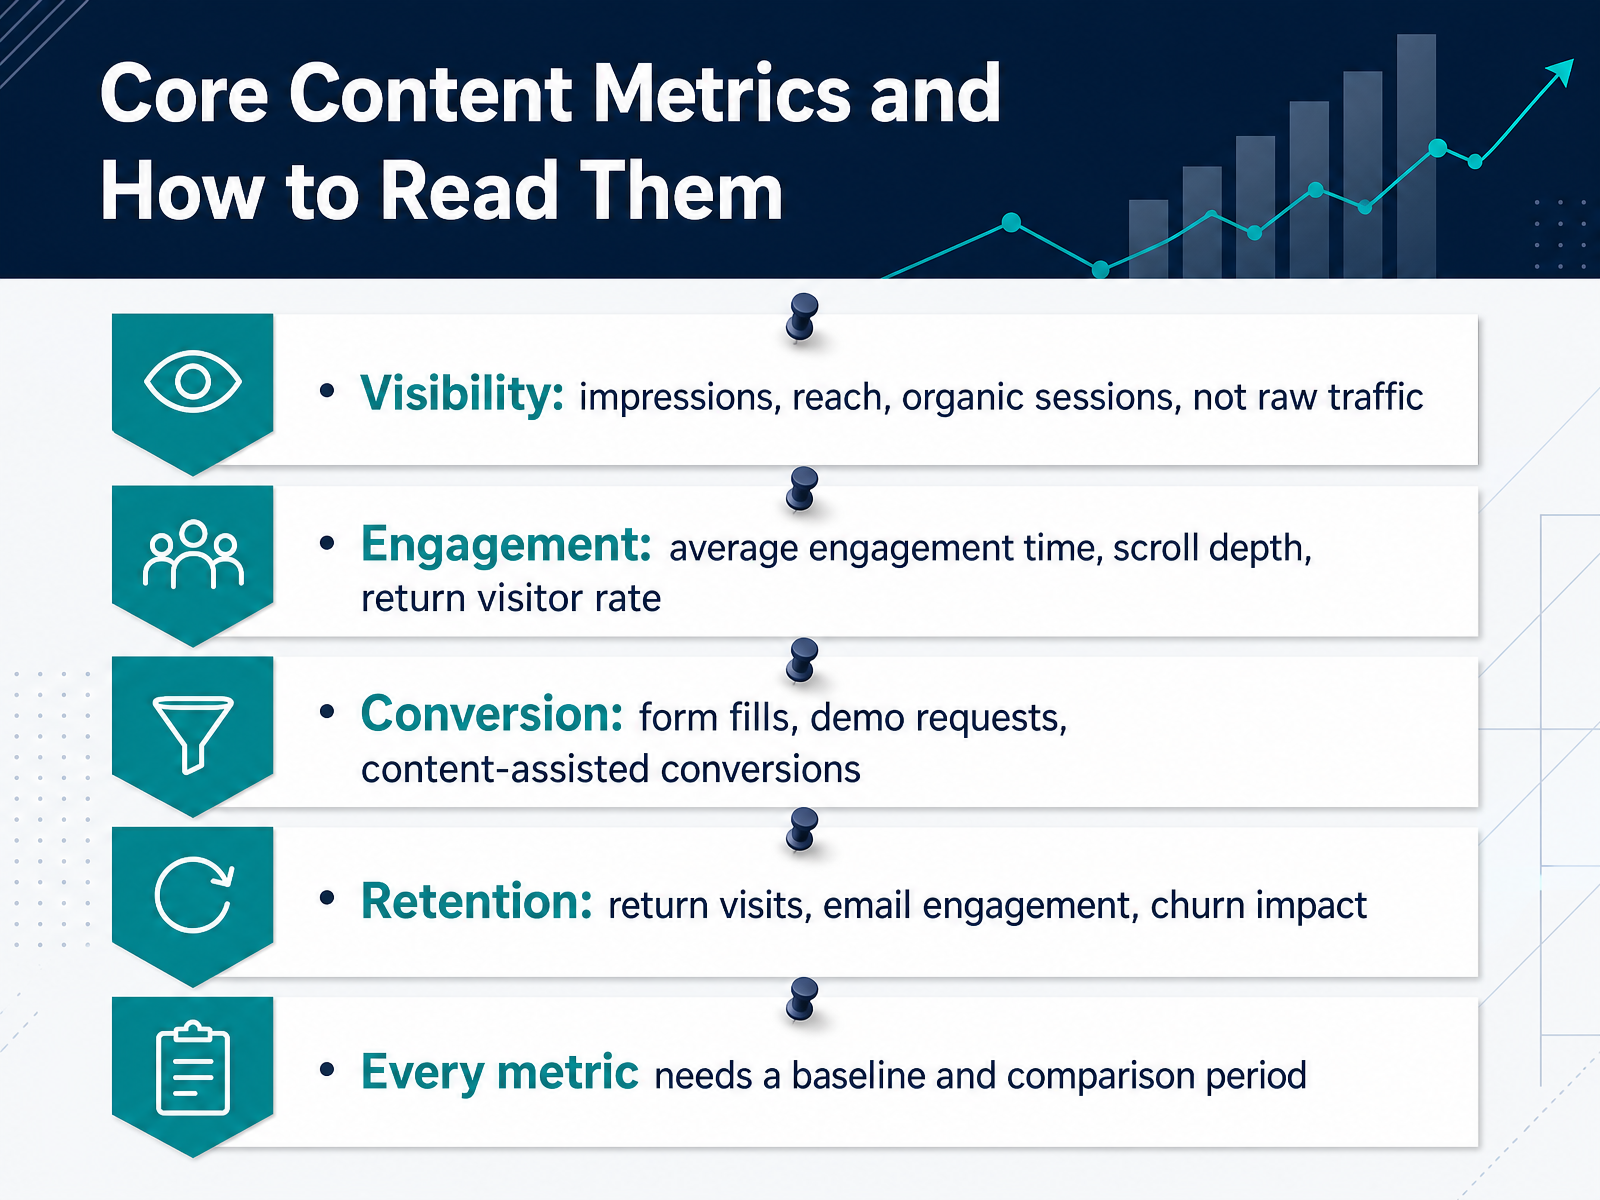
 - 04Core Content Metrics and How to Read ThemNow let's get specific about the metrics that actually matter. There are four core categories to watch: visibility, engagement, conversion, and retention. For visibility, think impressions, reach, and organic sessions. But don't just chase raw traffic. It's about the right people seeing your content. Engagement goes deeper. Look at average engagement time, scroll depth, and return visitor rate. These tell you if attention is real or just a quick glance. Conversion is where content proves its value: form fills, demo requests, and content-assisted conversions. And retention measures whether your audience comes back: repeat visits, email engagement, and reduced churn. Here's the key caution. Every single metric needs a baseline and a comparison period. A number on its own is just noise. A spike in page views might look great, but without context, you don't know if it came from a viral fluke or a real audience shift. Compare against last month, last quarter, or a benchmark. That's how you read metrics with confidence. Next, let's connect these metrics to business outcomes.
 contentmarketinginstitute.comcontentmarketinginstitute.comcontentia.co+22 min
 - 05Connecting Content Metrics to Business OutcomesNow let's connect content metrics to the outcomes that actually matter to the business. This starts with tracing content influence from first touch to revenue. You do that with UTM parameters and CRM integration. UTM tags tell you which piece of content drove the visit. The CRM tells you what that visit eventually became. Without both, you're guessing. Next, choose an attribution model. First-touch gives all credit to the piece that introduced the prospect. Last-touch gives it to the final interaction before conversion, which usually erases content's contribution entirely. Multi-touch distributes credit across the journey. W-shaped gives thirty percent each to first touch, lead creation, and opportunity creation, with ten percent spread across the middle. For most B2B teams, multi-touch is the honest option. Now, report business value: revenue, lead quality, cost savings, and reduced sales cycle. Not pageviews. Communicate content-influenced pipeline and content ROI. And remember, an imperfect model you use consistently beats a perfect one you don't. That's the core. Next, we'll look at avoiding misinterpretation around correlation, causation, and noise.
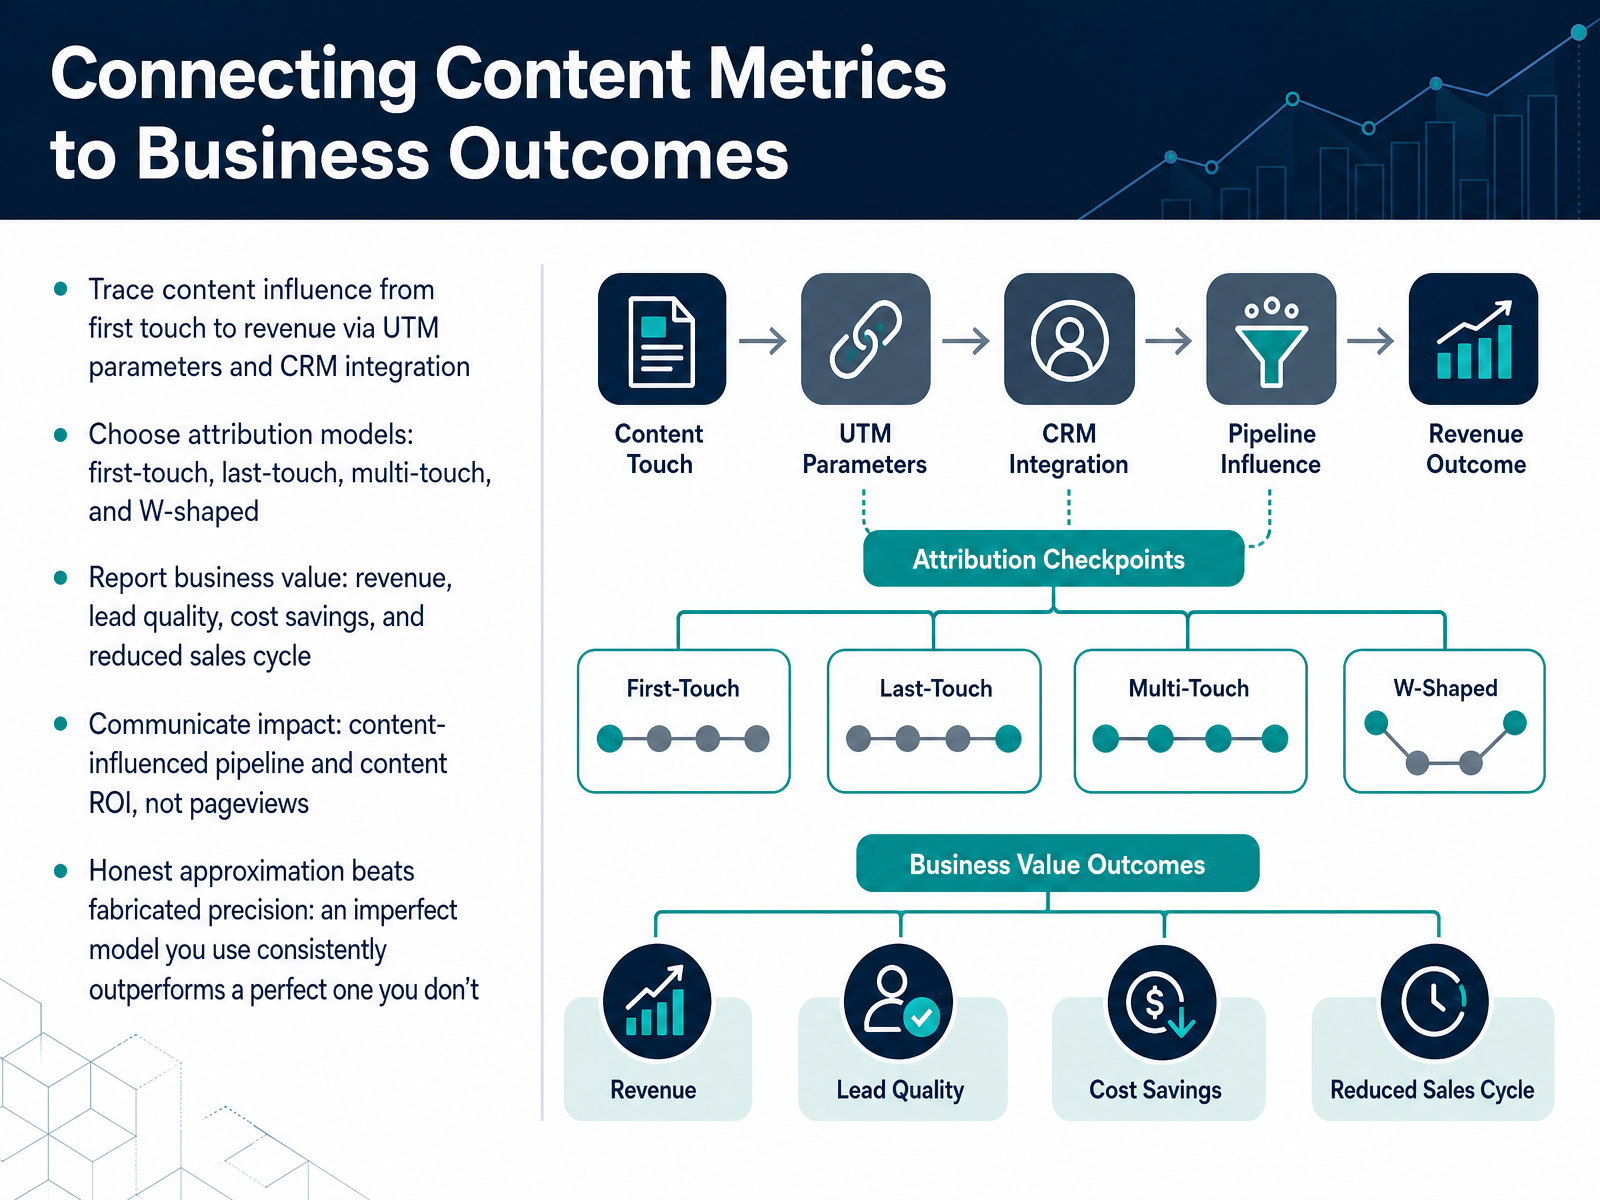 cometly.comthestacc.comdigitalapplied.com+22 min
 - 06Avoiding Misinterpretation: Correlation, Causation, and NoiseLet's talk about the biggest trap in content measurement: mistaking correlation for causation. Your attribution tool might credit a whitepaper for a deal, but it's often measuring proximity, not influence. It stood next to the pipeline at a party. Averages are just as dangerous. One number hides the difference between a segment that reads deeply and one that bounces. Before you trust any metric, check the baseline, the trend, the sample size, and the context. Noise is everywhere. Compare against your own history, not generic benchmarks that flatten your industry into one number. And never assume a metric measures what its name suggests. New users don't mean new customers. Time on page doesn't mean attention. So before you report a win or make a cut, ask what the number is really saying, and what it's leaving out. That brings us to the attribution reality check, which we'll dive into next.
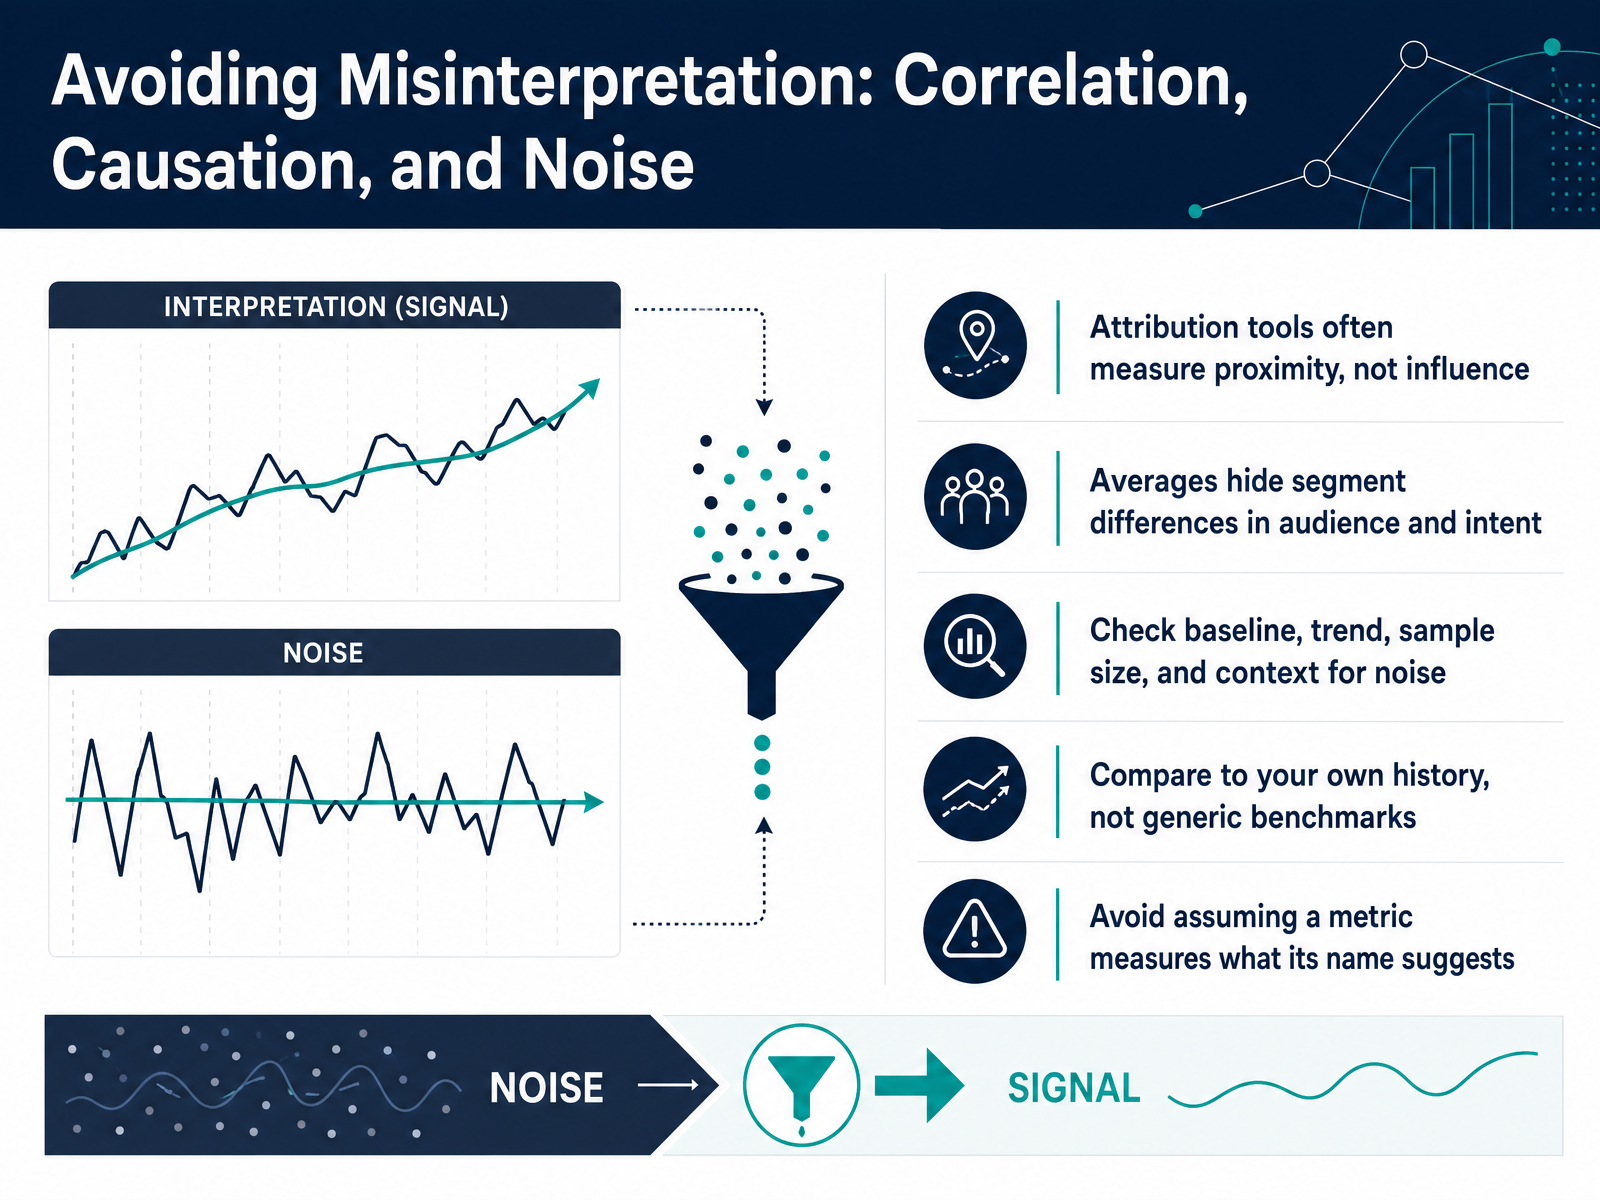 contentmarketinginstitute.comblog.theseoengine.comshankom.com+21 min
 - 07The Attribution Reality CheckLet's be honest about attribution. Your B2B buyers are touching six to ten pieces of content before they ever raise their hand. But if you're using last-click attribution, all that early and mid-funnel work gets erased. Only the final touch gets credit. And first-touch? That completely ignores the content that actually closed the deal. Neither model tells the real story. That's why multi-touch and data-driven models matter. They spread the credit across the journey, giving each interaction its fair share. Now, one thing to keep in mind: dark social and AI discovery are nearly invisible to your tracking. So supplement your digital data with self-reported attribution. Ask your customers what influenced them. Finally, accept that attribution is directional. You won't get perfect precision, so report what you can measure with integrity. With that foundation, let's look at how to design dashboards that actually drive decisions.
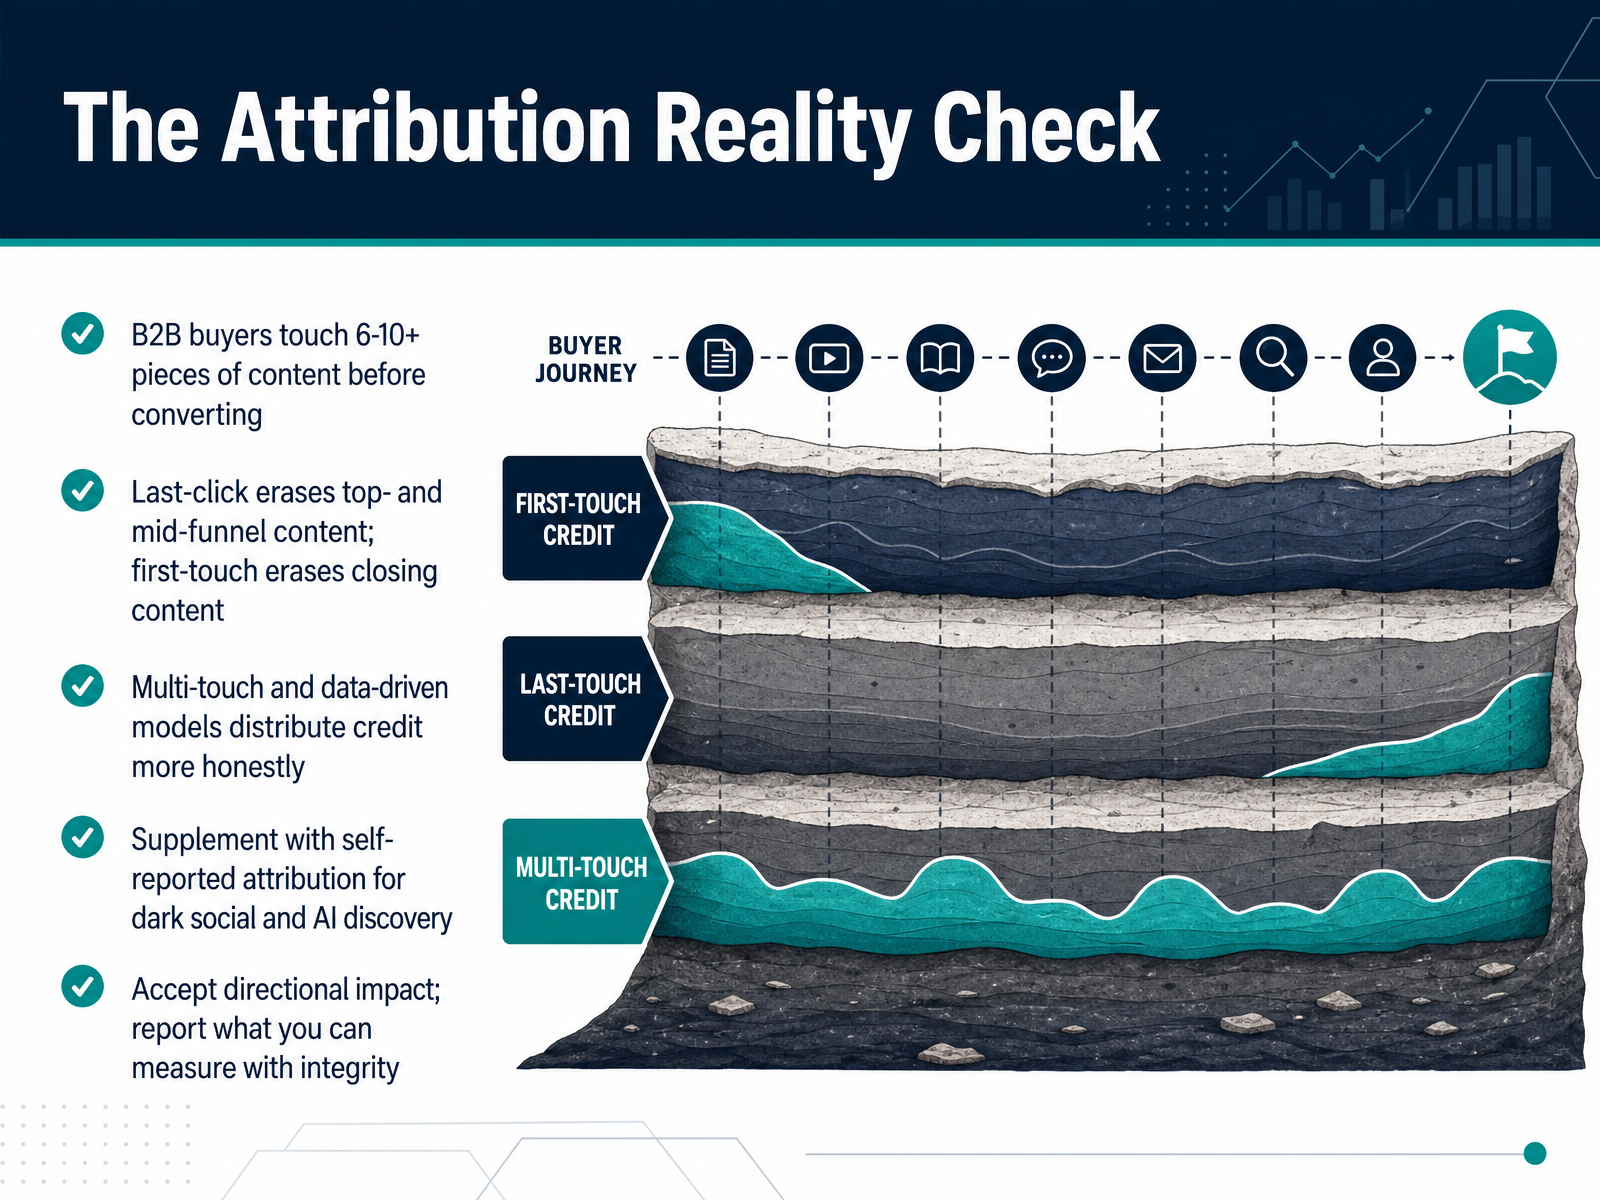 cometly.comthestacc.comdigitalapplied.com+21 min
 - 08Designing Dashboards that Drive DecisionsNow let's talk about designing dashboards that actually drive decisions — not just dashboards that display data. The core discipline is keeping it tight. Limit yourself to eight to twelve KPIs, and each one needs to tie back to a specific business question. If a metric doesn't change the next decision you'd make, leave it off. Structure the dashboard by funnel: awareness, engagement, conversion, revenue. That order helps you spot where the drop-off is happening, and it keeps top-of-funnel activity from disguising bottom-funnel problems. And build role-specific views. Leadership wants the ROI story. Managers need performance trends. Analysts need diagnostics. One view cannot serve all three without watering down the message. Every metric also needs a target, a named owner, and a review cadence. A number with no owner is just decoration. Finally, automate your data collection. Manual reporting dies within weeks — that's not a matter of discipline, it's just human nature. If the dashboard doesn't update itself, nobody will keep it alive. Remember: a dashboard is a decision tool, not a data dump. Next, let's talk about building a repeatable measurement workflow.
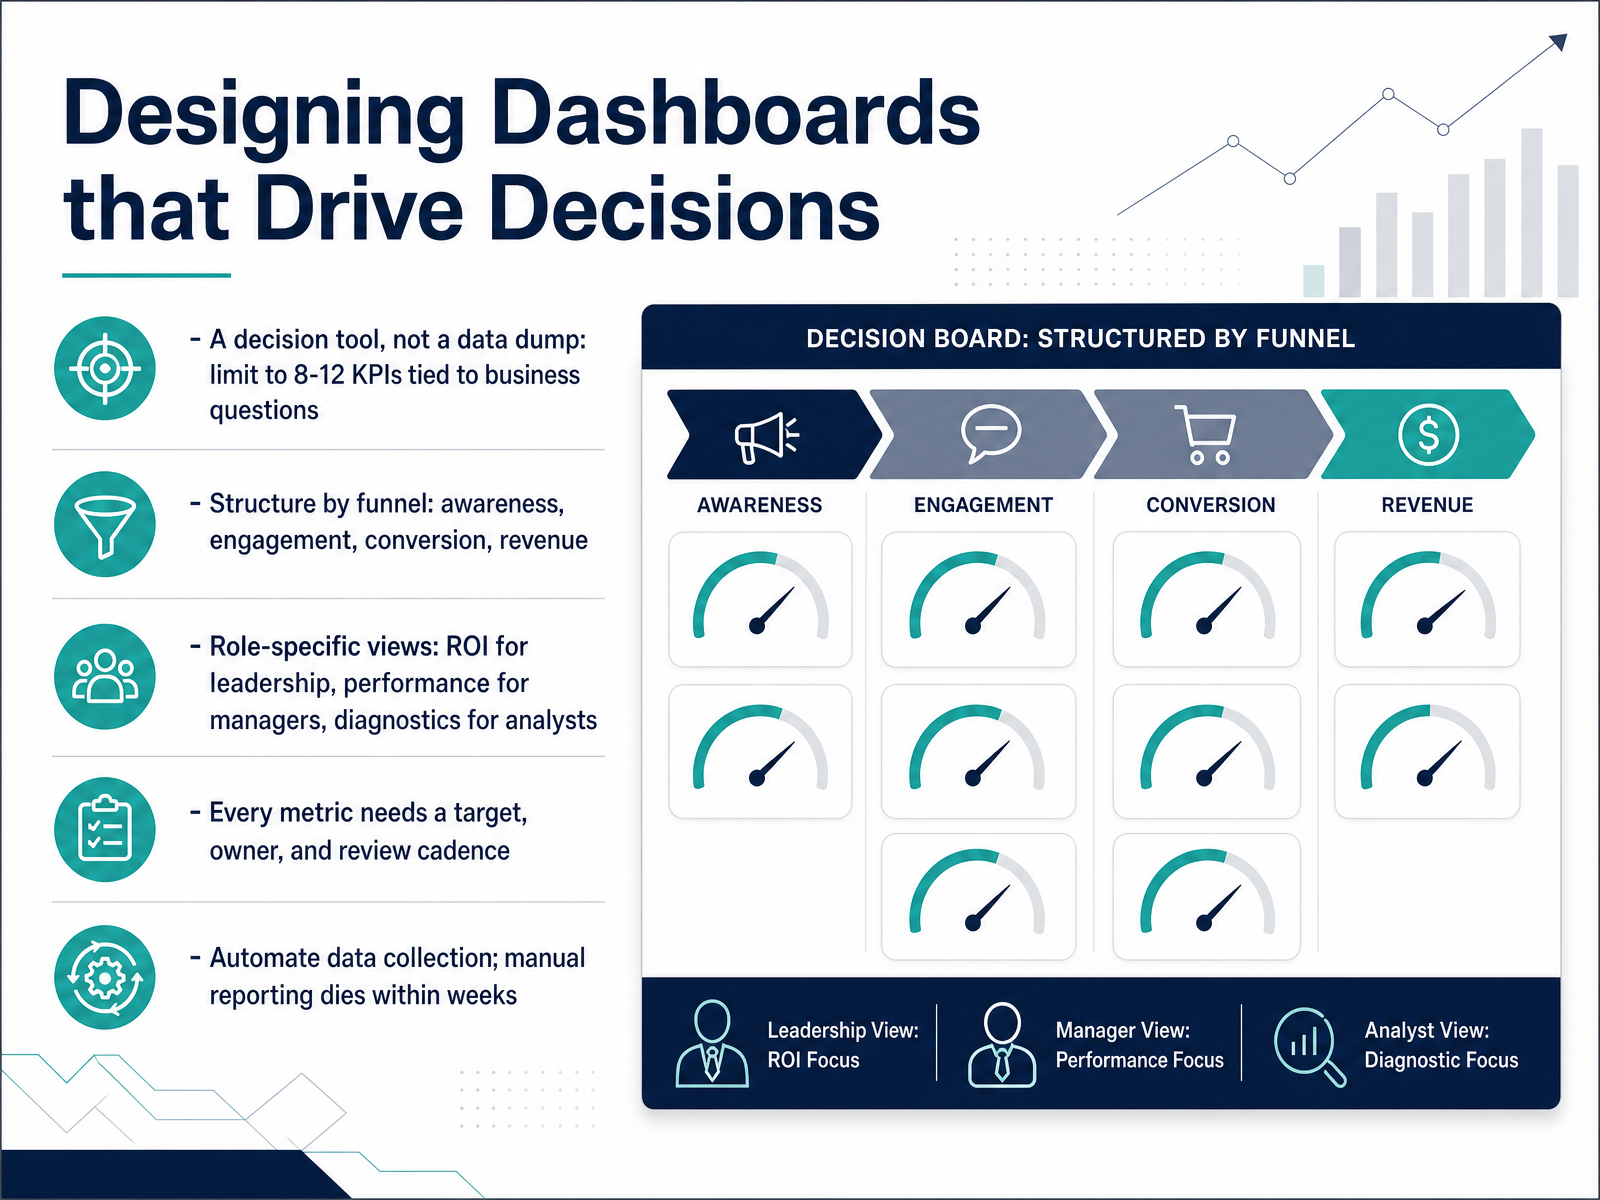 improvado.iosona.comcontentmarketinginstitute.com+22 min
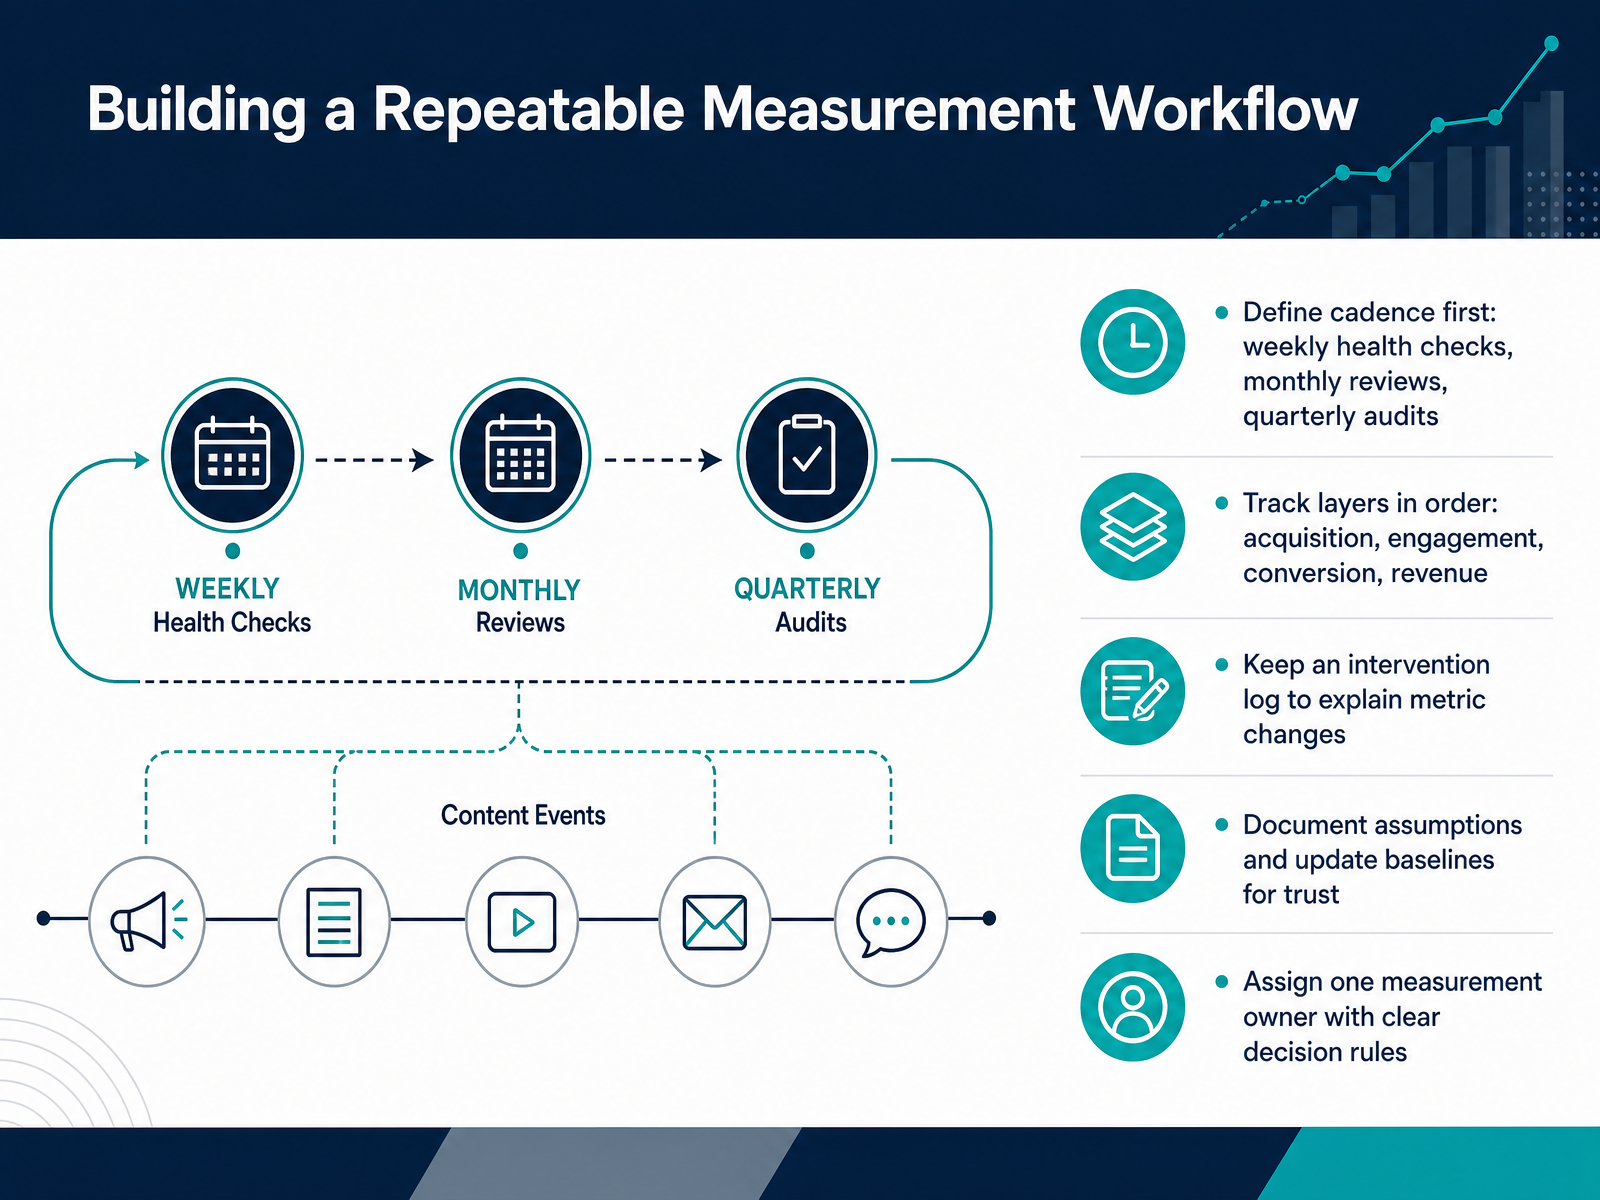
 - 09Building a Repeatable Measurement WorkflowLet's move from metrics to making them a habit. A repeatable workflow is what turns scattered data into decisions you can defend. First, define your cadence. Weekly health checks for the leading indicators. Monthly reviews for trends. Quarterly audits for strategy and attribution. Next, track your layers in order. Acquisition, then engagement, then conversion, and finally revenue. Each layer explains the one above it. Now, keep an intervention log. When you update a post or change a title, log it. Without this, you cannot explain why a metric moved, and unexplained dips will erode trust. Also, document your assumptions and update your baselines. If your baseline is stale, your decisions will be skewed. Finally, assign one measurement owner. This person owns the dashboard, the definitions, and the decision rules. If a number drops below a threshold, the rule tells you the next action. That is how you stop guessing and start managing. Up next, we will cover how to communicate these results to stakeholders.
 contentmarketinginstitute.comdigitalapplied.comchiefcontentmarketer.com+22 min
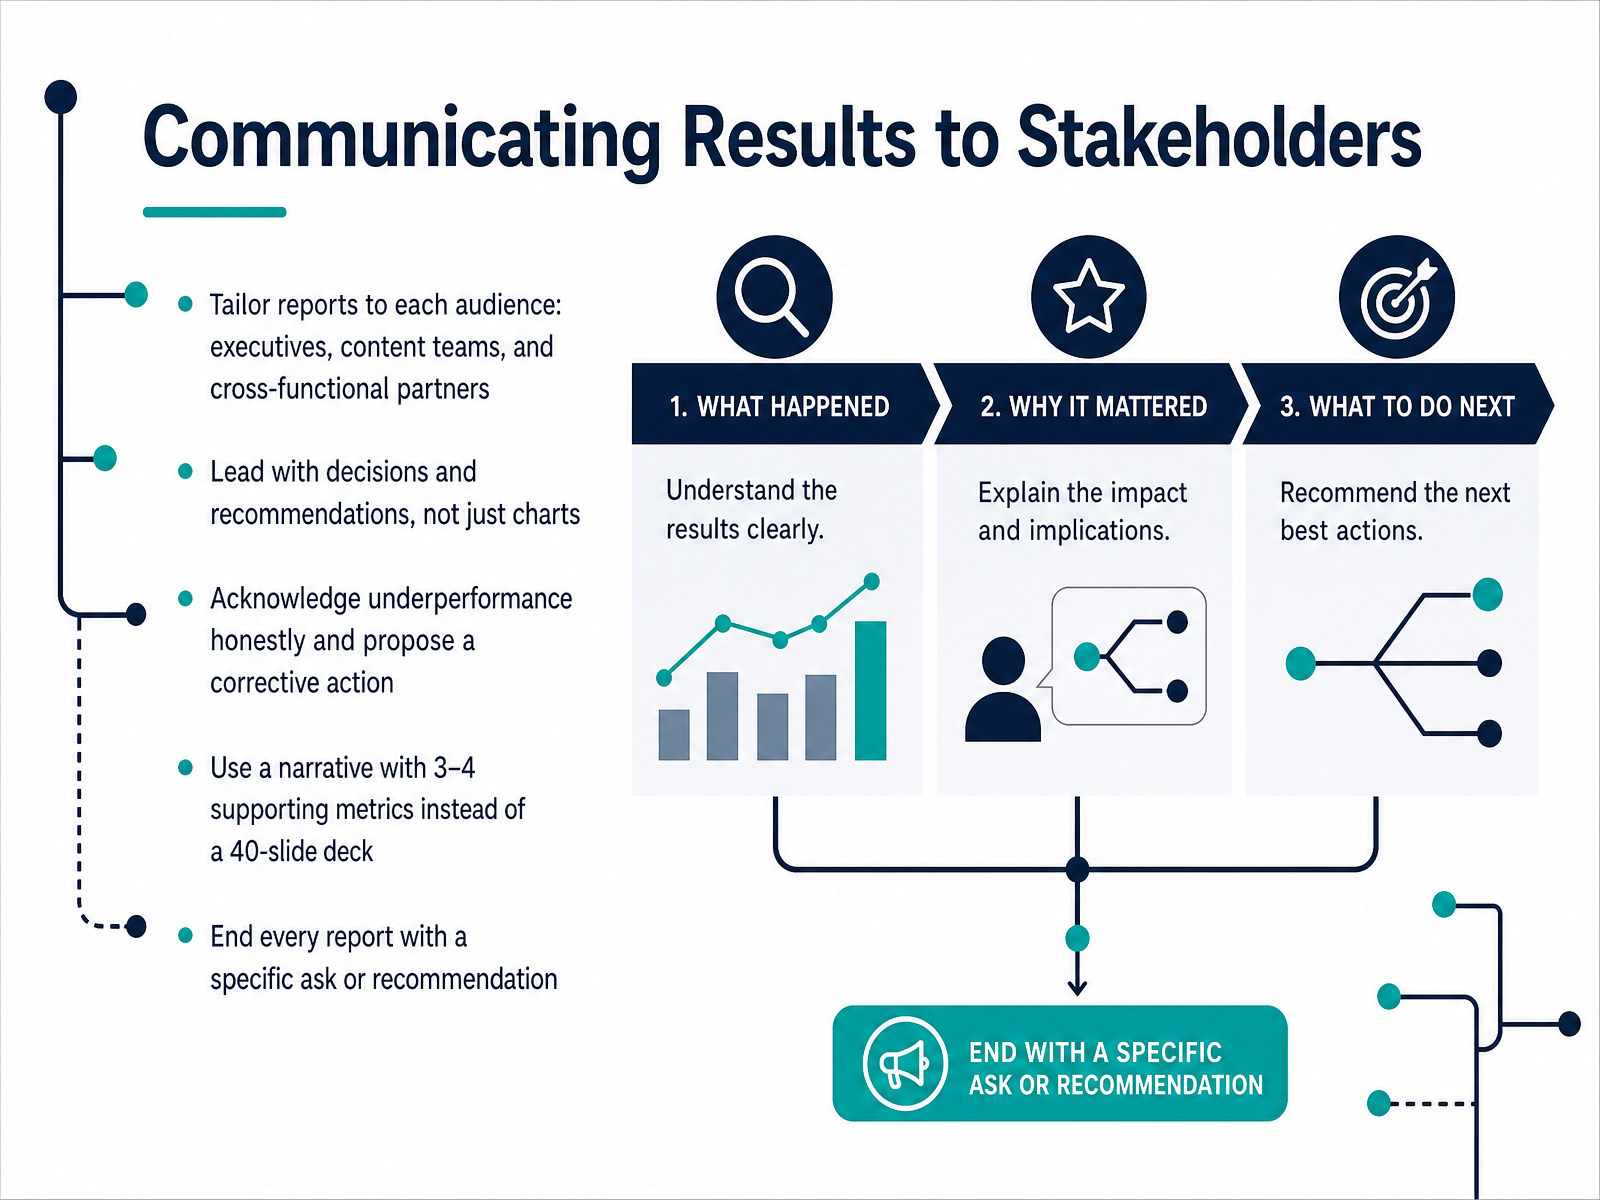
 - 10Communicating Results to StakeholdersSo you've done the analysis, you've found the insights, now the hard part: communicating them to stakeholders. Remember, your executives don't want a data dump. They want answers. Tailor your report to who's in the room. For executives, lead with decisions and recommendations, not charts. They're asking one question: is this investment working? For your content team, focus on learnings and next iterations. And for cross-functional partners, show how content supports their goals. Acknowledge underperformance honestly. Nothing kills credibility faster than a report that only shows wins. If a piece of content missed the mark, say so, and propose a fix. And here's the key: use a narrative with three or four supporting metrics. That's it. A single clear story beats a forty-slide deck every time. Brevity signals confidence. Finally, end with a specific ask. Whether it's budget, headcount, or a strategy decision, you need to leave the room with direction. Otherwise, you've just given a status update, not a decision-making tool. And that will set you up perfectly for our next topic: the common pitfalls in content measurement and how to avoid them.
 1 min
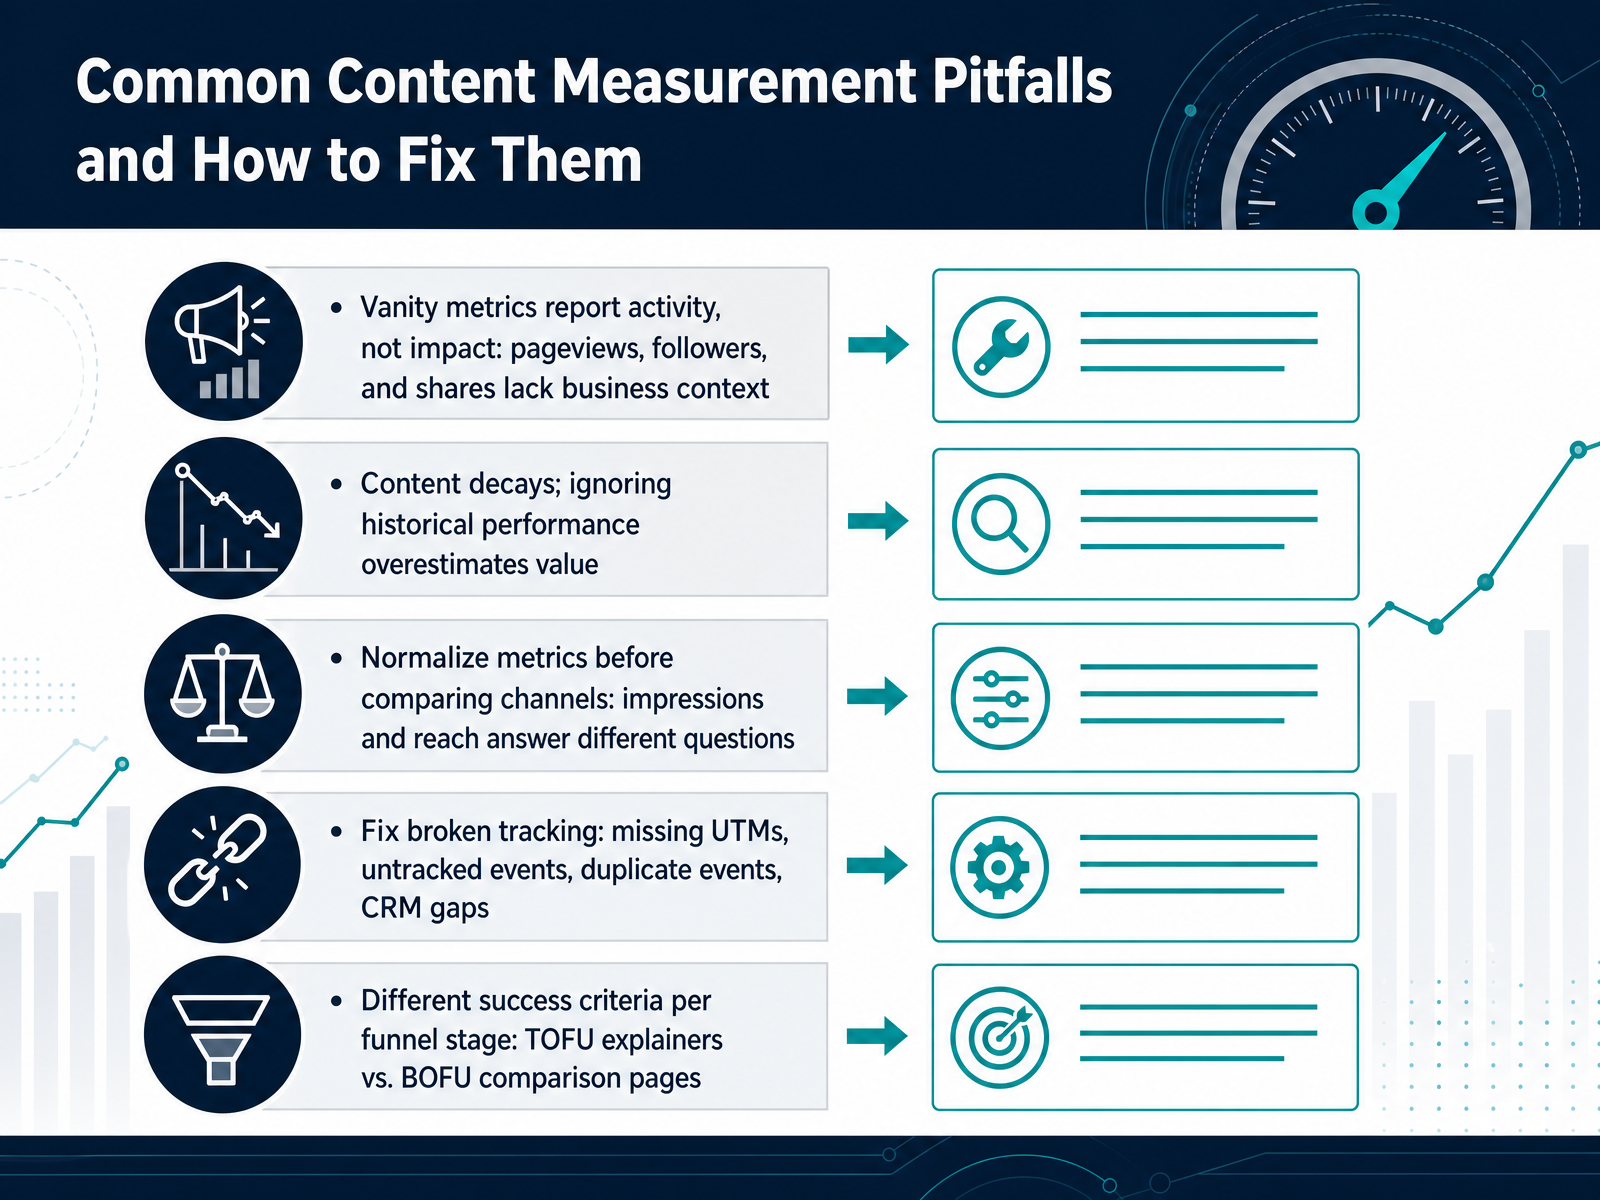
1 min - 11Common Content Measurement Pitfalls and How to Fix ThemLet’s talk about the common measurement pitfalls that trip up even experienced content teams. First, vanity metrics. Page views, followers, and shares report activity, not impact. A post with five thousand views that generates zero pipeline is not a marketing asset, it’s a hobby with a domain name. Watch out for content decay, too. That pillar article from two years ago? Its performance today is not what it was. Always compare against historical trends, or you will overestimate its current value. Before comparing channels, normalize your metrics. Impressions and reach answer different questions, so make sure you’re comparing apples to apples. Next, fix your tracking. Missing UTMs, untracked events, and duplicate events quietly corrupt your data. And remember the CRM gap. If your content consumption data never connects to closed deals, you’re guessing, not measuring. Finally, match your success criteria to the funnel stage. A top-of-funnel explainer shouldn’t be judged by demo requests, just as a bottom-of-funnel comparison page shouldn’t be judged by raw traffic. Different jobs, different yardsticks. Avoid these traps, and your numbers will finally tell the truth. From Interpretation to Action: Making Better Content Decisions.
 chiefcontentmarketer.comshankom.comcontentmarketinginstitute.com+22 min
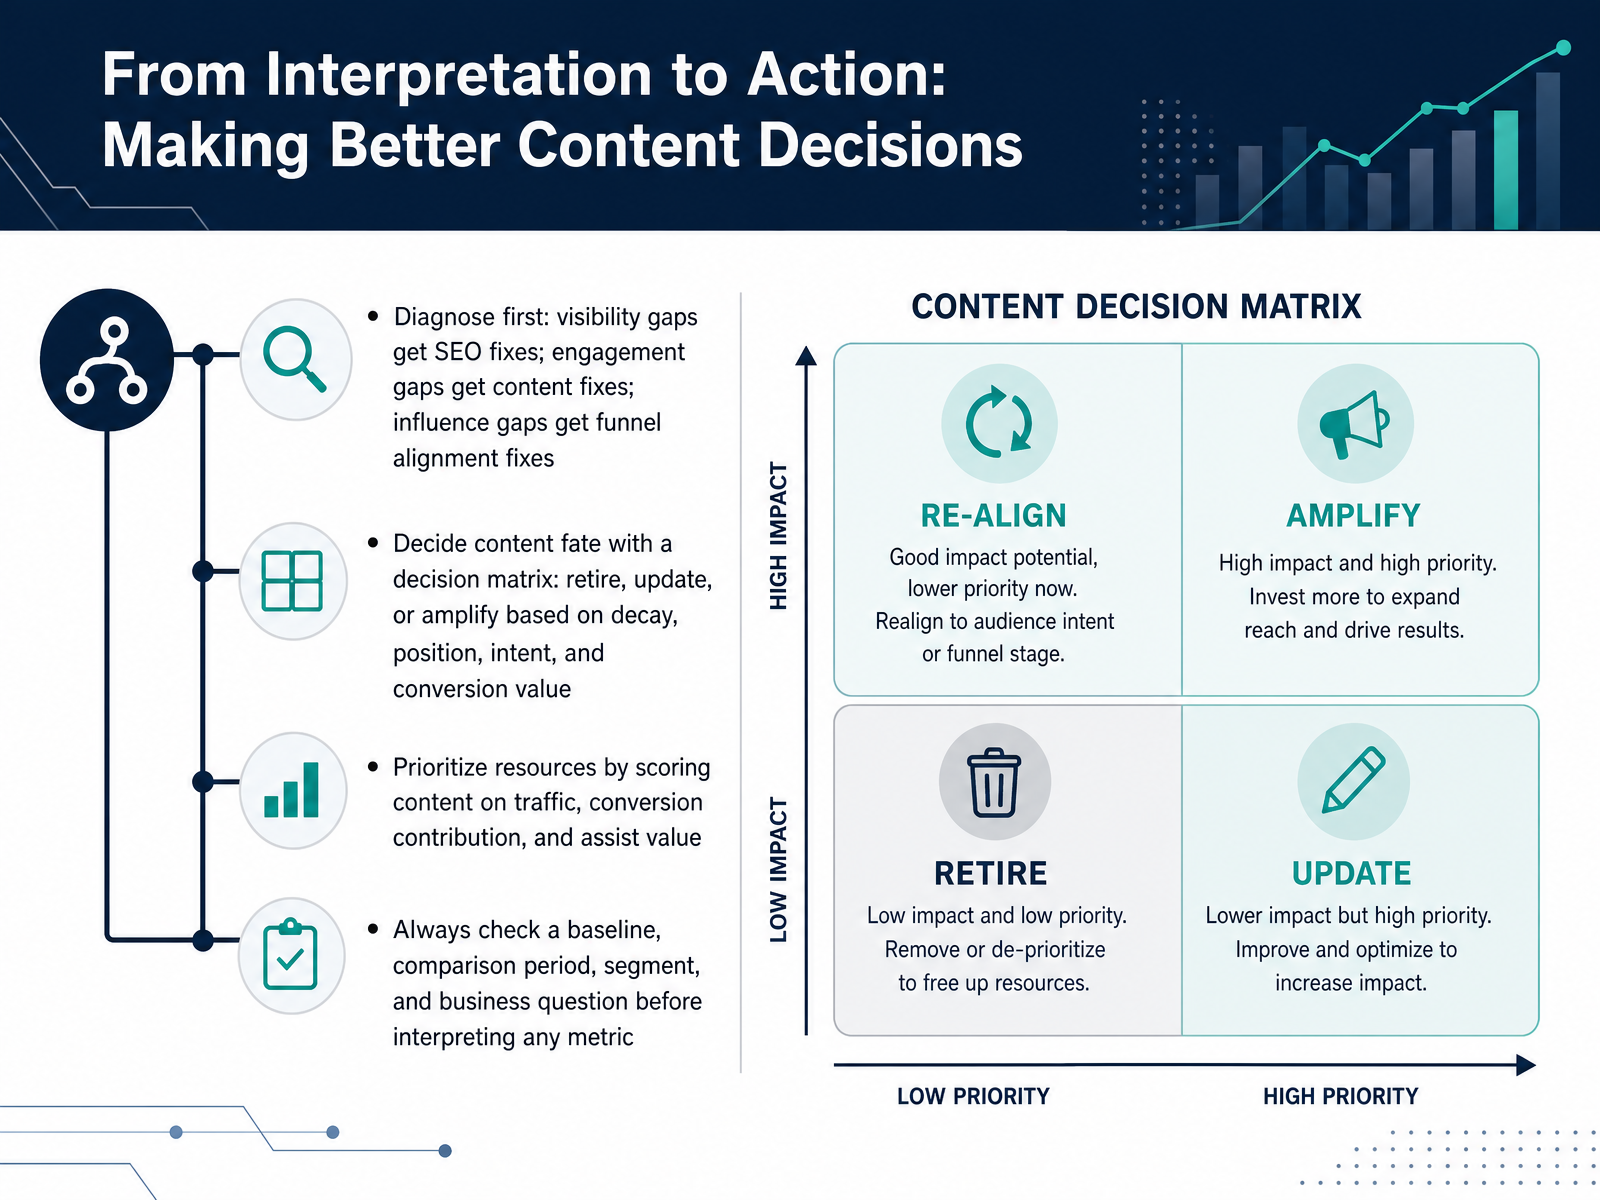
 - 12From Interpretation to Action: Making Better Content DecisionsSo here is where the numbers stop being a report and start being a plan. Diagnose first. If a page has a visibility gap, that is an SEO fix, not a content rewrite. An engagement gap means the content itself needs work, better structure, clearer copy. An influence gap, where people read but never convert, that is a funnel alignment problem. Different gaps, different fixes. Once you know the problem, decide the fate of the piece. Use a simple decision matrix. Retire it if it is obsolete and bleeding value. Update it if it is decaying but still relevant. Amplify it if it is performing well but under-distributed. Then score everything. Traffic, conversion contribution, and assist value. Rank your backlog by that score, not by gut feel. And before you interpret any single metric, always check four things. The baseline. A comparison period. The segment. And the business question you are actually answering. A number without those four is just a number. With them, it is a decision. Next, we look at the AI visibility layer, and why 2026 measurement is a completely different game.
 2 min
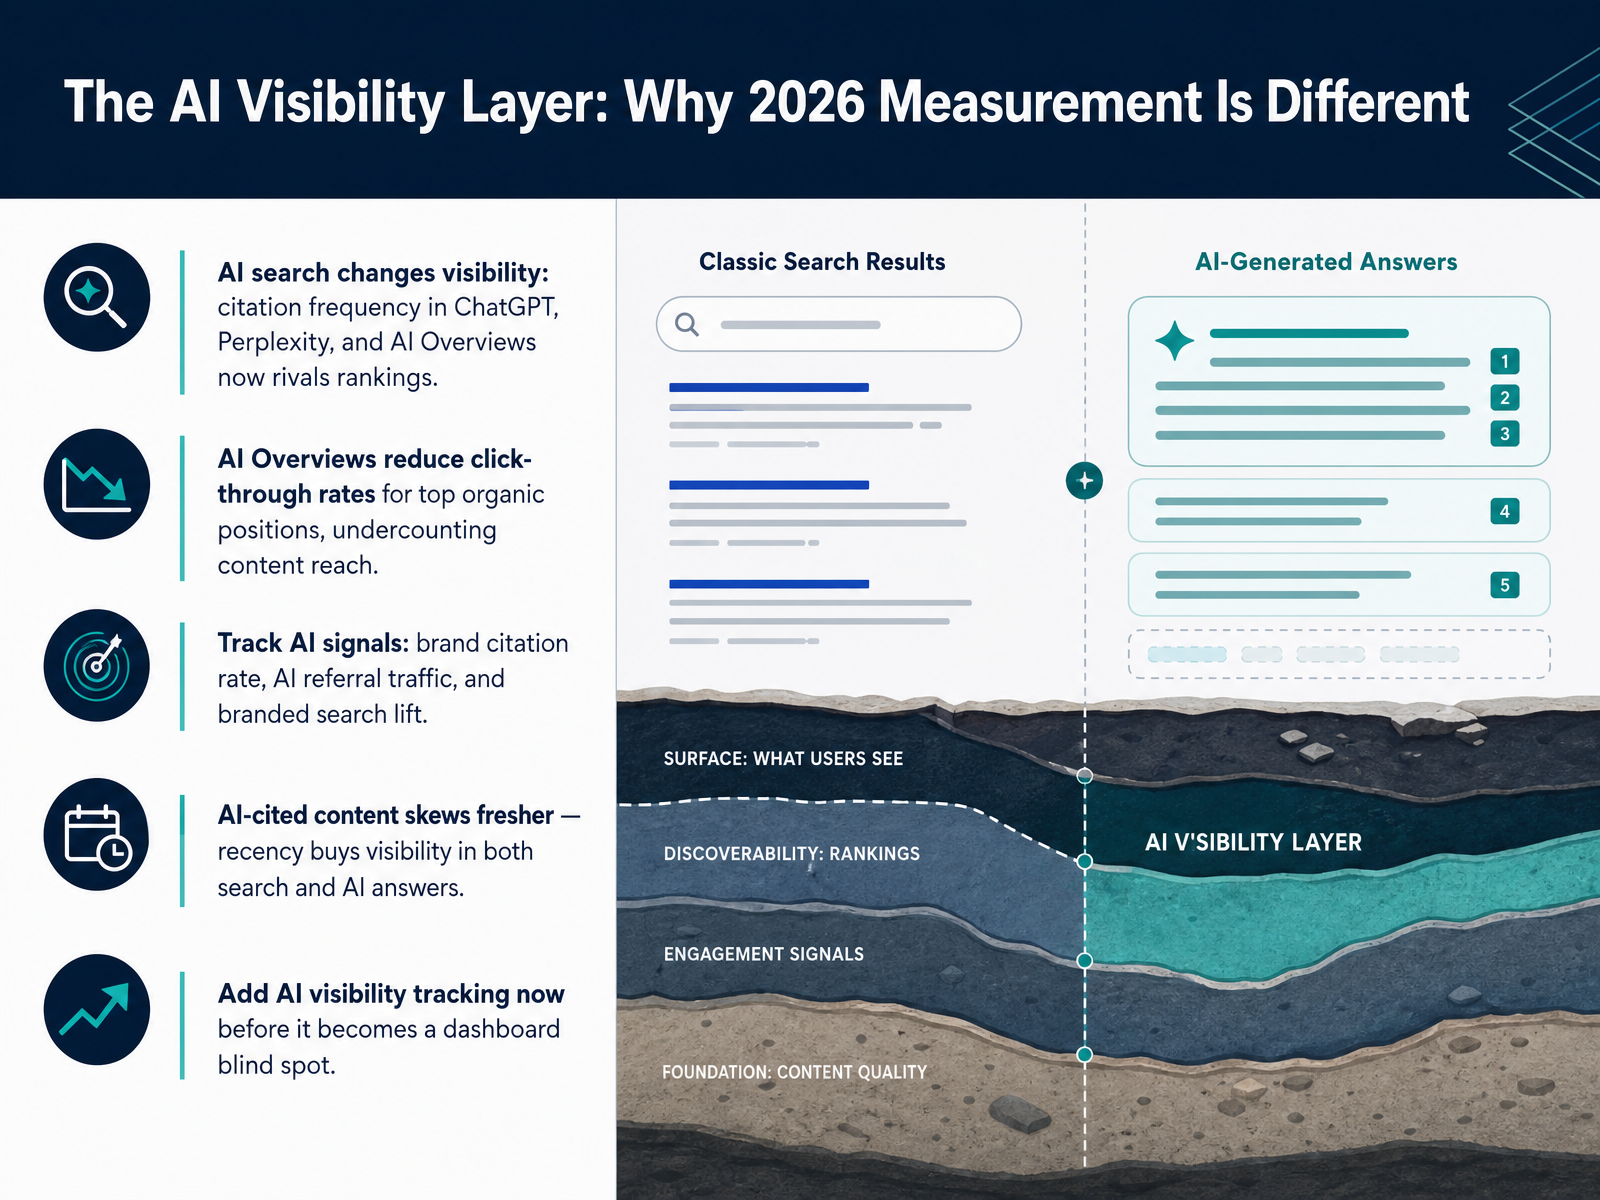
2 min - 13The AI Visibility Layer: Why 2026 Measurement Is DifferentLet's talk about the layer most dashboards still miss: AI visibility. By 2026, being cited in ChatGPT, Perplexity, or Google's AI Overviews matters as much as ranking on page one. But here's the catch. AI Overviews actually suppress click-through rates for top organic positions, which means your traditional analytics are now undercounting your true content reach. To fix this, start tracking three specific signals. Your brand citation rate in AI answers. Your AI referral traffic, which shows up in analytics under sources like chatgpt.com or perplexity.ai. And your branded search lift, because people who discover you through AI often search for your name directly afterward. One more thing to know. AI-cited content skews fresher. Ahrefs found cited pages are about twenty-five percent newer than typical organic results. That means recency now buys you visibility in both search and AI answers. So set up AI visibility tracking now. One quarterly prompt-testing session and a simple branded-search filter can get you started before this becomes a blind spot in your reporting. That brings us to the action plan: your measurement system for this quarter.
 contentmarketinginstitute.commarketful.comtenspeed.io+21 min
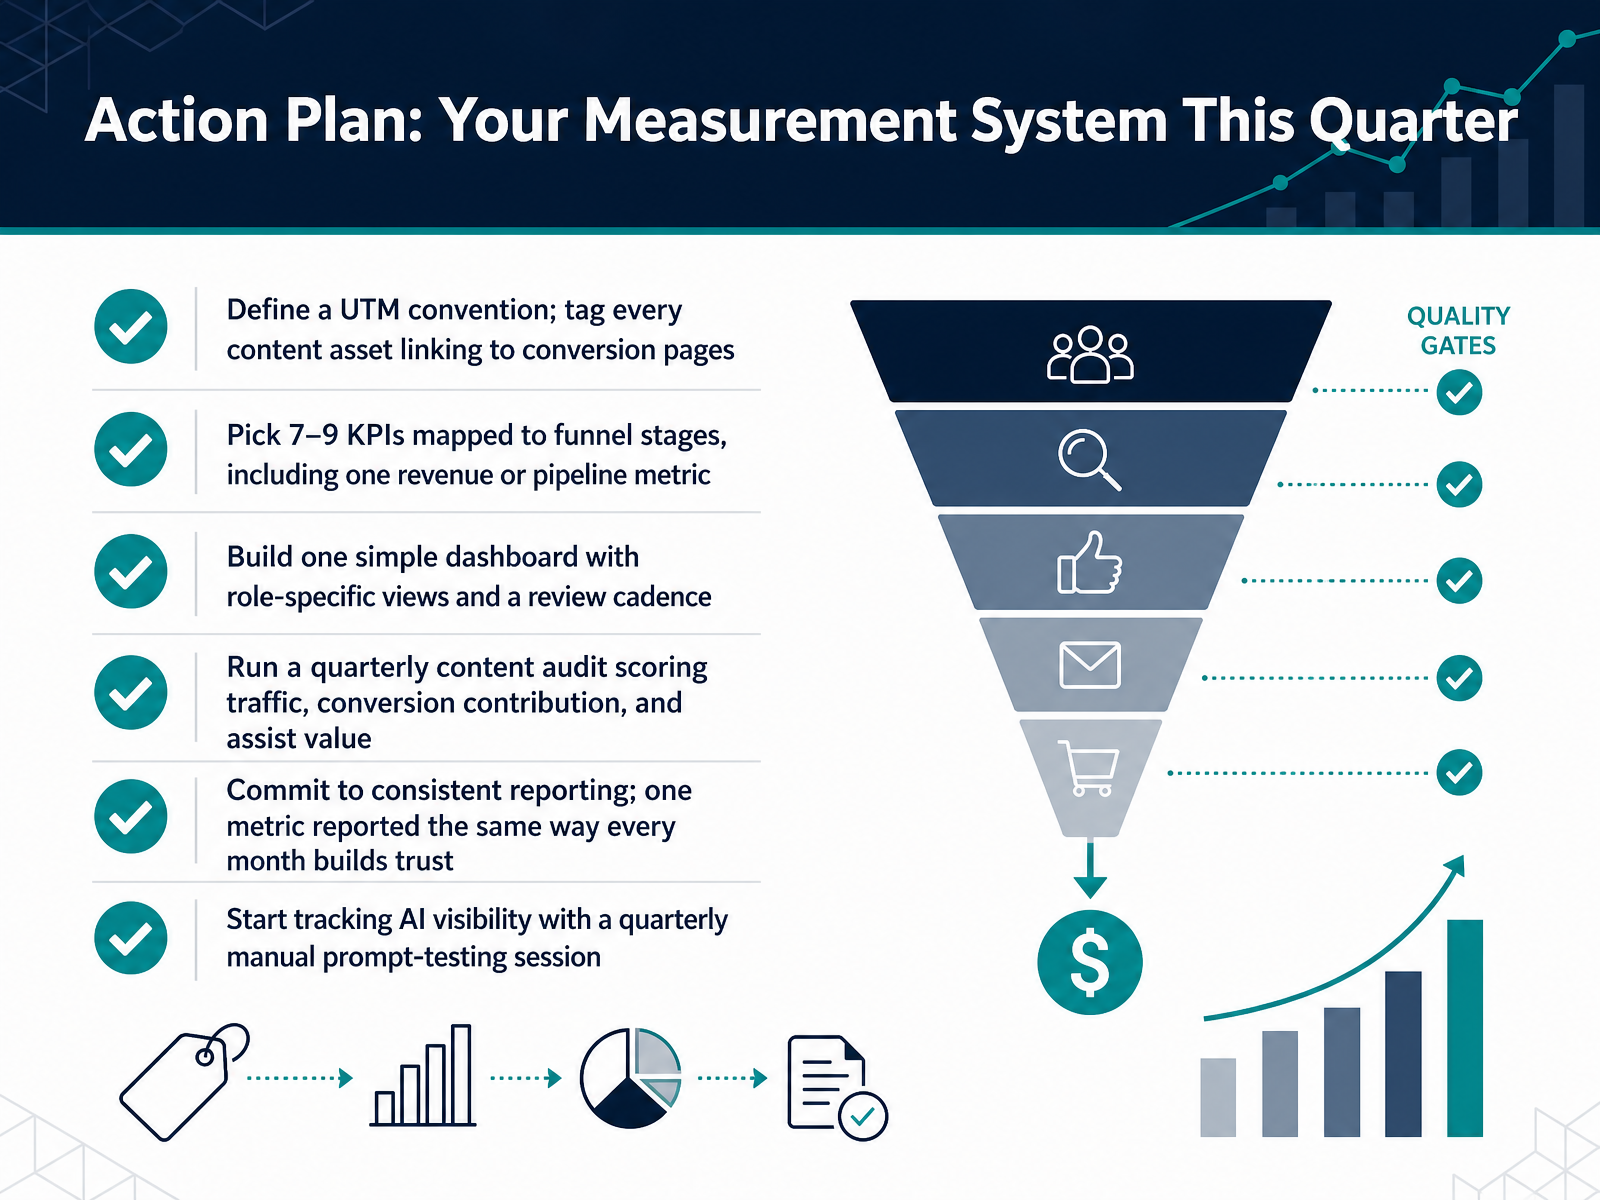
 - 14Action Plan: Your Measurement System This QuarterWe have covered a lot of ground in this session. Let us turn it into your action plan for the quarter. First, lock down your UTM convention. Tag every asset that links to a conversion page. A clean spreadsheet here is worth more than any analytics tool. Next, pick seven to nine KPIs that map to your funnel stages, and make sure at least one of them connects to pipeline or revenue. Remember, one metric reported consistently every month builds more trust than a dozen shiny numbers that keep changing. Build one simple dashboard with views for your team and your leadership. Then, run a quarterly content audit. Score everything on traffic, conversion contribution, and assist value. This shows you what to scale, what to refresh, and what to prune. And in this new era, schedule a quarterly manual prompt-testing session to see how often your content gets cited by AI assistants. Start small, stay consistent, and let the data guide your next move. Thanks for joining. Go build your measurement system. You have got this.
 contentmarketinginstitute.comdigitalapplied.comchiefcontentmarketer.com+22 min
Take the deck with you
Download this course as a file — free, no sign-up needed.
- PDF handoutEvery slide page, ready to print or share.15 pages · 3.6 MBDownload
- Narrated PowerPointThe deck that presents itself — every slide carries the digital human's narration video.15 pages · 14.0 MBDownload
- PowerPoint slidesThe full deck as a .pptx — open it in PowerPoint, Keynote, or Google Slides.15 pages · 3.4 MBDownload
Free to use in your own training — please keep the PersonWise credit page at the end.
Have your own deck? Turn it into a course
Sources consulted
Web sources consulted while building this course.
- 5-Step Content Marketing Measurement Framework — contentmarketinginstitute.com
- Content Marketing Metrics: KPIs by Funnel Stage (2026 Guide) — marketful.com
- Content Marketing Funnel Explained: Stages, Metrics, and Tactics in 2026 | Ten Speed — tenspeed.io
- The Content ROI Playbook: How to Measure What Actually Matters in 2026 - Chief Content Marketer — chiefcontentmarketer.com
- Content marketing funnel: stages, templates & metrics - Semrush — semrush.com
- Measurement: You’re Doing It Wrong — contentmarketinginstitute.com
- Content Marketing Metrics: 12 Proven KPIs for 2026 — The Seo Engine — blog.theseoengine.com
- How to Measure Content Marketing ROI Correctly - Shankom — shankom.com
- The Content Marketing Metrics That Actually Matter (And the Ones to Ignore) - — stratcommunications.com
- The Content Attribution Lie: Why Your Dashboard Is Wrong | Chief Content Marketer — chiefcontentmarketer.com
- 27 Need-to-Know Definitions for Effective Content Marketing Measurement — contentmarketinginstitute.com
- The Executive Guide: Content Marketing KPIs | Contentia — contentia.co
- Content Marketing KPIs That Matter: What to Track and How to Report It | WordPress VIP — wpvip.com
- Attribution For Content Marketing: Prove Your ROI! — cometly.com
- Content ROI (2026): Strategies, Tactics & Examples — thestacc.com
- Content Marketing ROI 2026: Measurement Framework — digitalapplied.com
- How to Measure Content Marketing ROI (and Actually Prove It Pays Off) - Good At Marketing — goodatmarketing.com
- How to Build a W-Shaped Attribution Model for Content (And Prove Your ROI). - CONTADU Content Intelligence — contadu.com
- Content Marketing Dashboard Guide 2026 | Performance ... — improvado.io
- What Is a Content Marketing Report Template? Definition, Examples, and Best Practices | Sona — sona.com