Marketing Analytics Platform Architecture
Begin
14 pages · ~28 min
Marketing Analytics Platform Architecture
This training helps data and marketing professionals evaluate marketing analytics platforms, covering selection criteria, architecture design, and key tradeoffs.
What you’ll learn
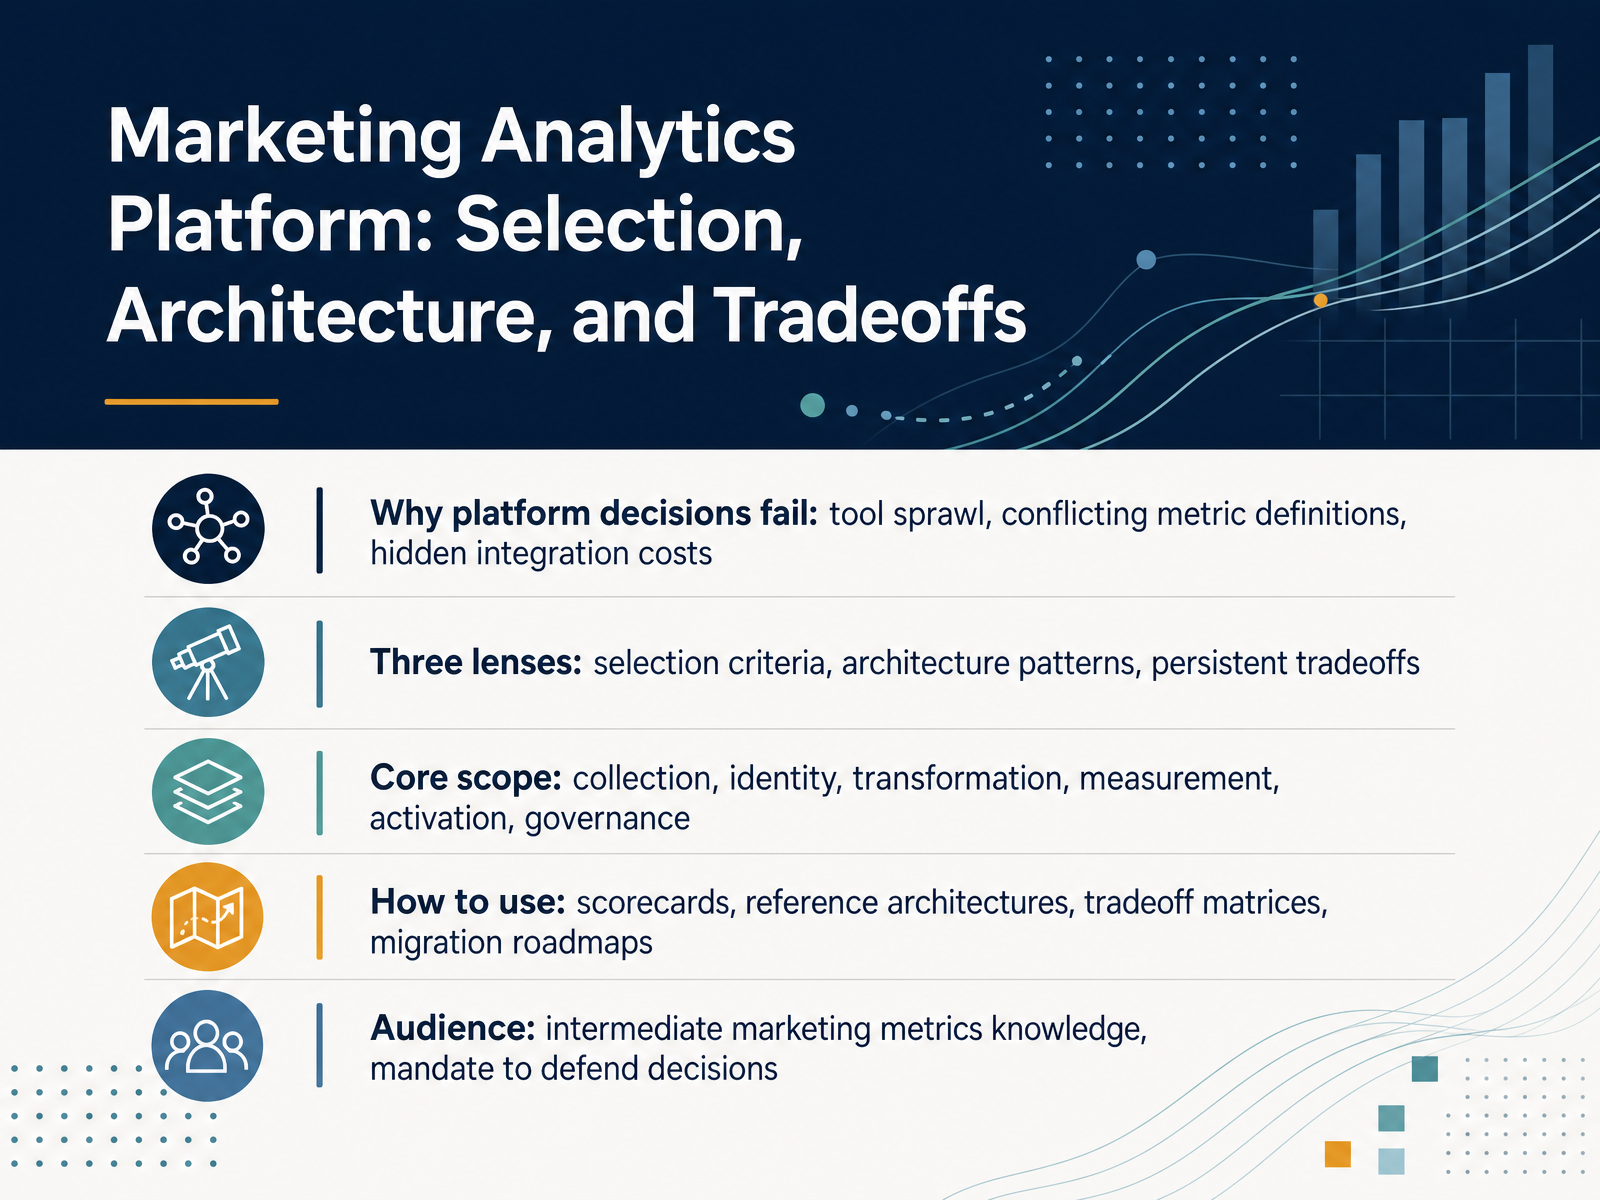
- 01Marketing Analytics Platform: Selection, Architecture, and TradeoffsWelcome. Over the next few minutes, we are going to work through how to choose, architect, and defend a marketing analytics platform. This is not a vendor pitch. It is a working session for analysts, growth leads, and marketing ops teams who own these decisions.
Let's start with why platform decisions fail. Three patterns show up constantly. Tool sprawl, where nobody agrees on which number is right. Conflicting metric definitions, where two dashboards report two different conversion rates. And hidden integration costs that surface long after the contract is signed.
We will use three lenses throughout. Selection criteria, architecture patterns, and persistent tradeoffs. Every platform trades flexibility for speed, or control for convenience. Naming that tradeoff early is how you avoid regret later.
On scope, we cover six layers. Collection, identity, transformation, measurement, activation, and governance. Most stacks are strong in three and weak in the rest.
By the end, you will have practical tools. Weighted scorecards, reference architectures, tradeoff matrices, and a migration roadmap you can defend to finance.
The assumption is intermediate marketing metrics knowledge, and a mandate to justify your decisions.
Let's begin with why these stacks actually break. Background: Why Marketing Analytics Stacks Break.datamoon.comemarsys.comabmatic.ai+22 min
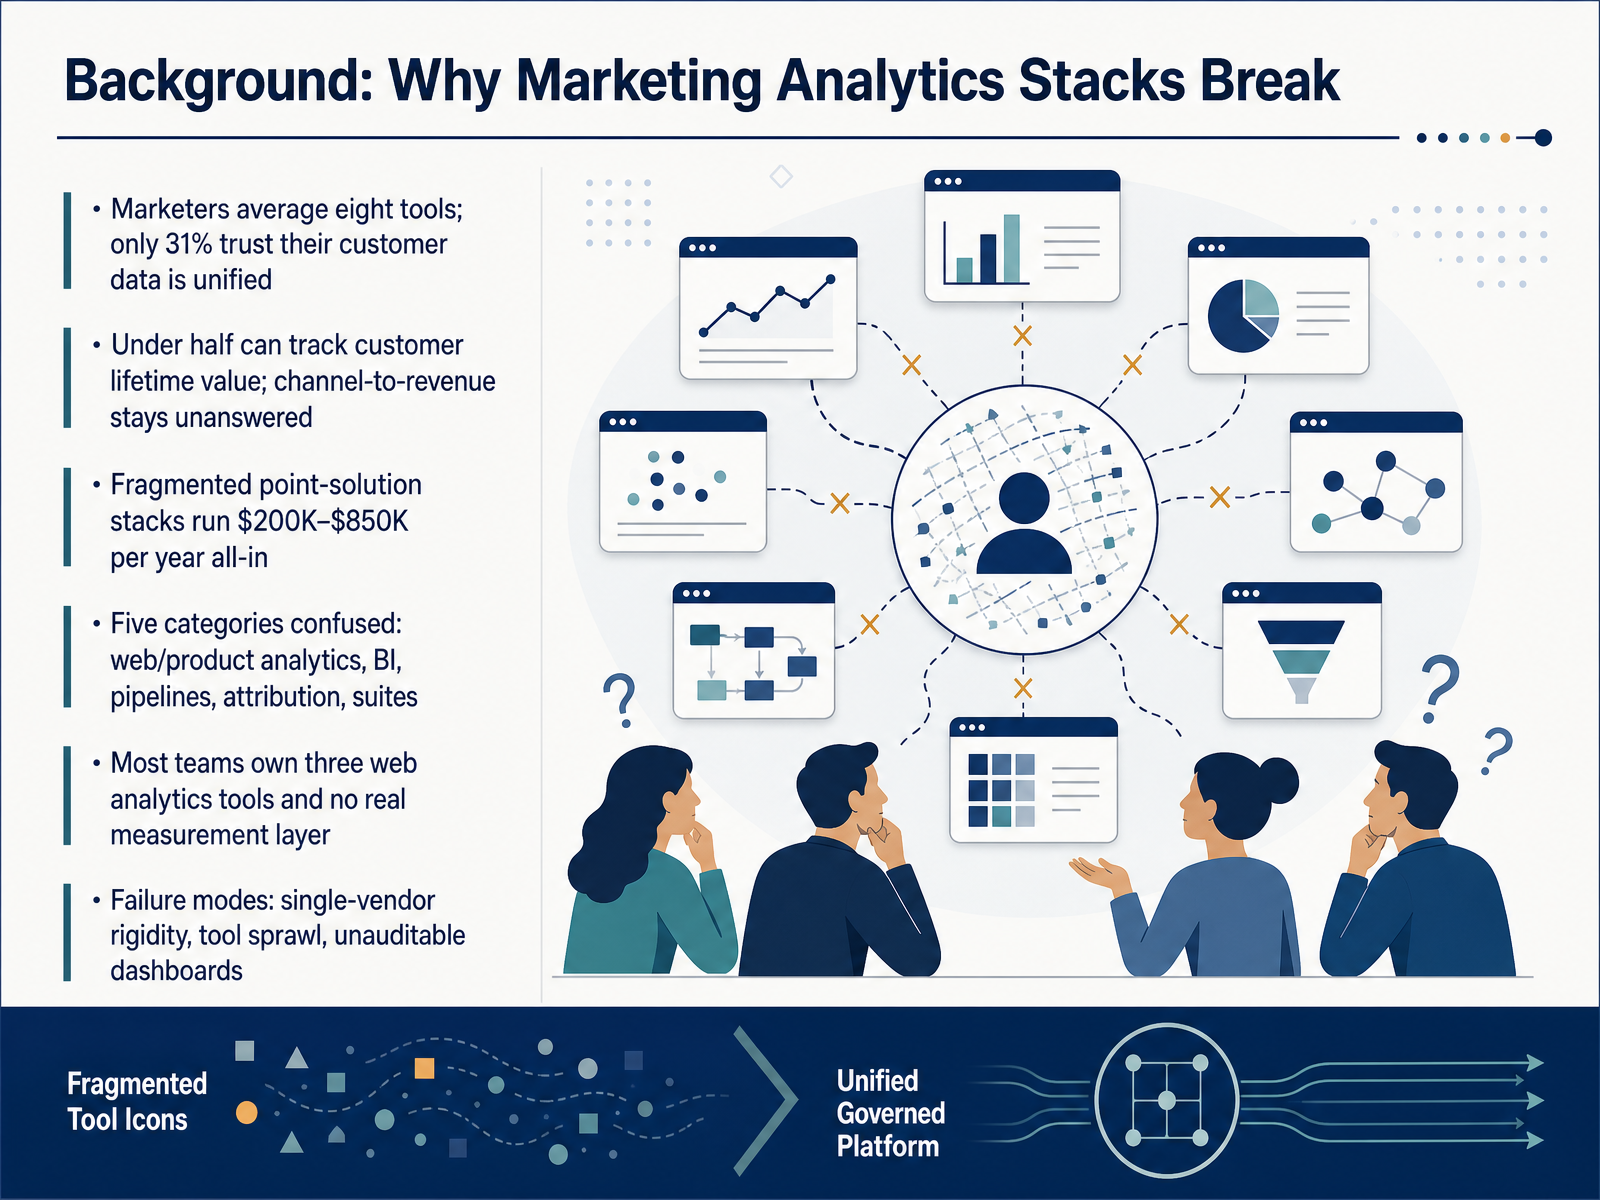
- 02Background: Why Marketing Analytics Stacks BreakLet's start with why these stacks break, because the failure is usually structural, not a bad vendor. Marketers run eight tools on average, yet only thirty-one percent trust their customer data is unified. Under half can track customer lifetime value, and channel-to-revenue often stays unanswered. Fragmented point-solution stacks run two hundred thousand to eight hundred fifty thousand dollars a year, all in. The confusion is categorical. Web analytics, BI, pipelines, attribution, and suites are five different jobs. Most teams own three web analytics tools and no real measurement layer. The failure modes repeat. Single-vendor rigidity, tool sprawl, and unauditable dashboards. None of that is a charting problem. It's a data foundation problem. Next, let's define what a platform must actually do.
 skopx.comlayerfive.comobservix.ai+22 min
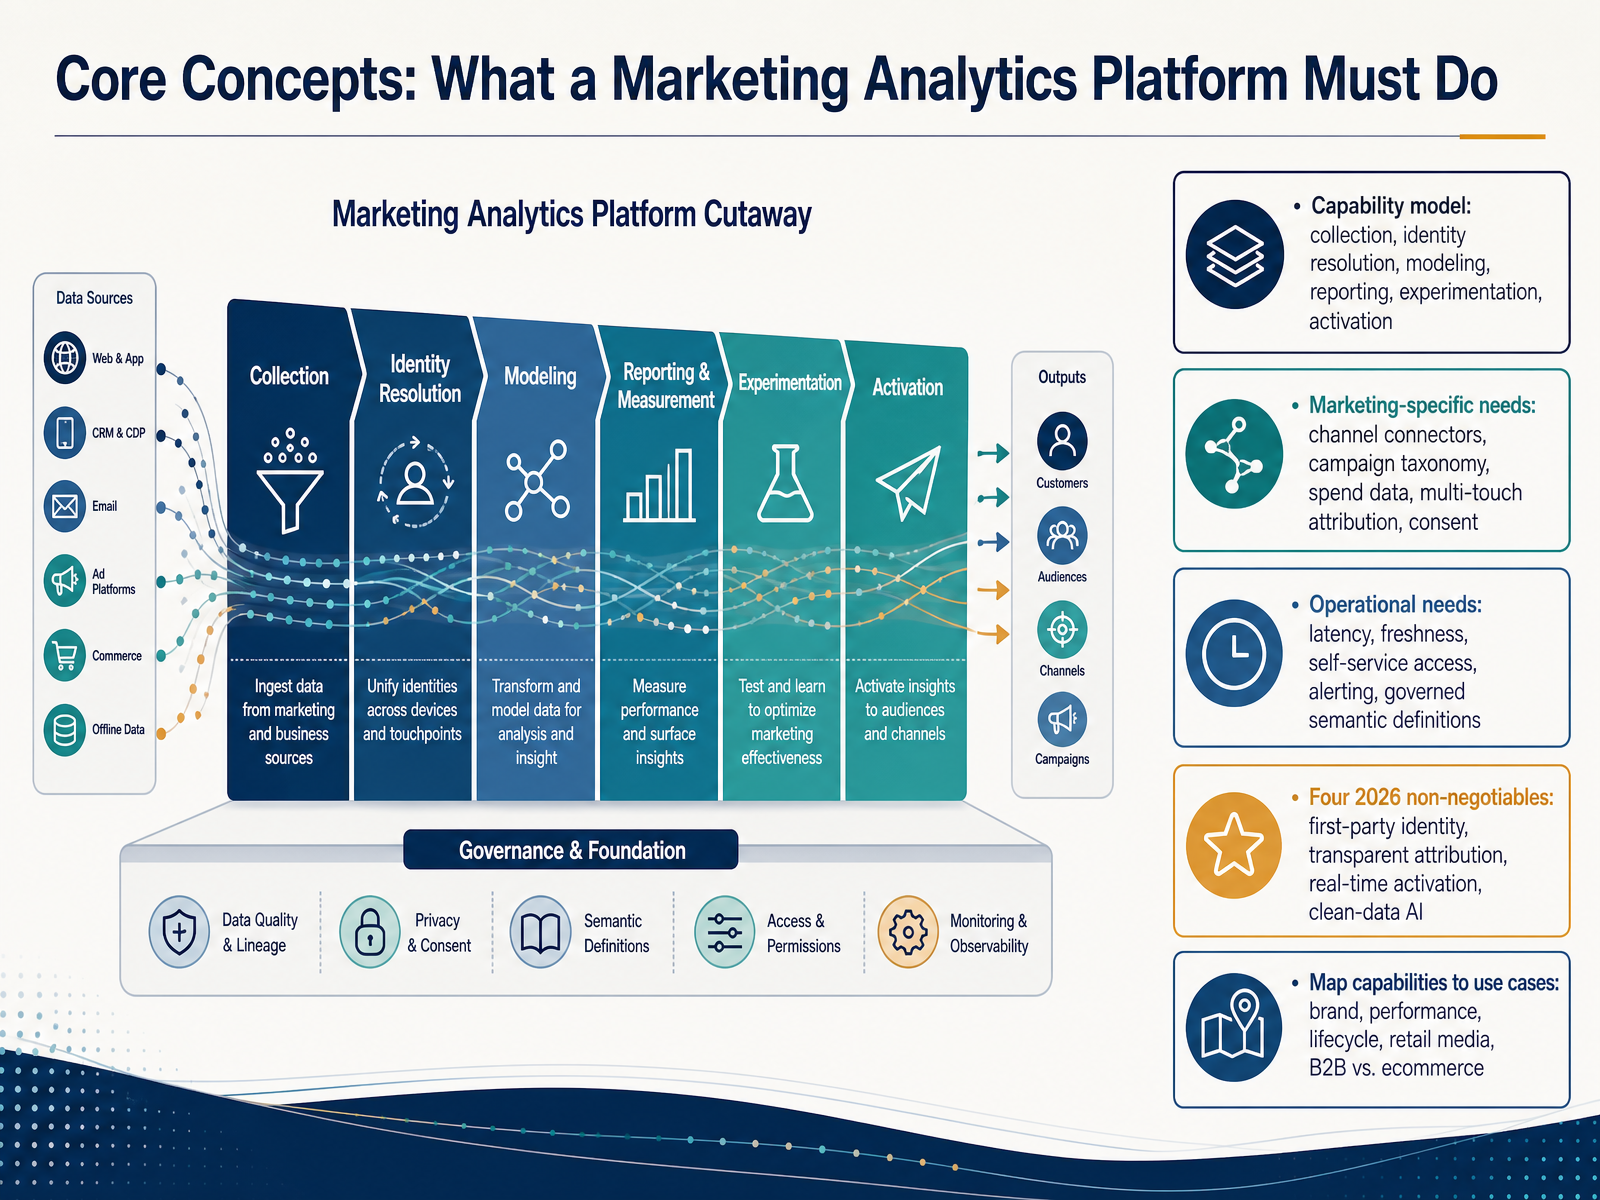
 - 03Core Concepts: What a Marketing Analytics Platform Must DoHere is where we define the job, before you look at any vendor. Think in six capabilities: collection, identity resolution, modeling, reporting, experimentation, and activation. Collection and identity come first, because if a visit never ties to a person or account, everything downstream is guesswork. Modeling is where attribution lives. Reporting turns it into a number people defend in budget meetings. Experimentation validates your assumptions. Activation pushes audiences back into ad platforms and lifecycle tools. Now layer on marketing-specific needs: channel connectors, a consistent campaign taxonomy, spend data, multi-touch attribution, and consent handling. Then the operational layer: latency, freshness, self-service access, alerting, and governed metric definitions. That governed semantic layer is what prevents two teams reporting different revenue numbers from the same data. Four things I would treat as non-negotiable in 2026: first-party identity, transparent attribution, real-time activation, and AI grounded in clean data. Bolting AI onto messy inputs just produces confident wrong answers faster. Finally, map capabilities to use cases. Brand, performance, lifecycle, retail media, and B2B versus ecommerce each weight these differently. A B2B pipeline question needs account identity and CRM joins. An ecommerce question needs order-level revenue. Same platform, different priorities. Next, we look at stack archetypes, from warehouse-centric to composable.
 marqops.comlayerfive.compropicked.com+22 min
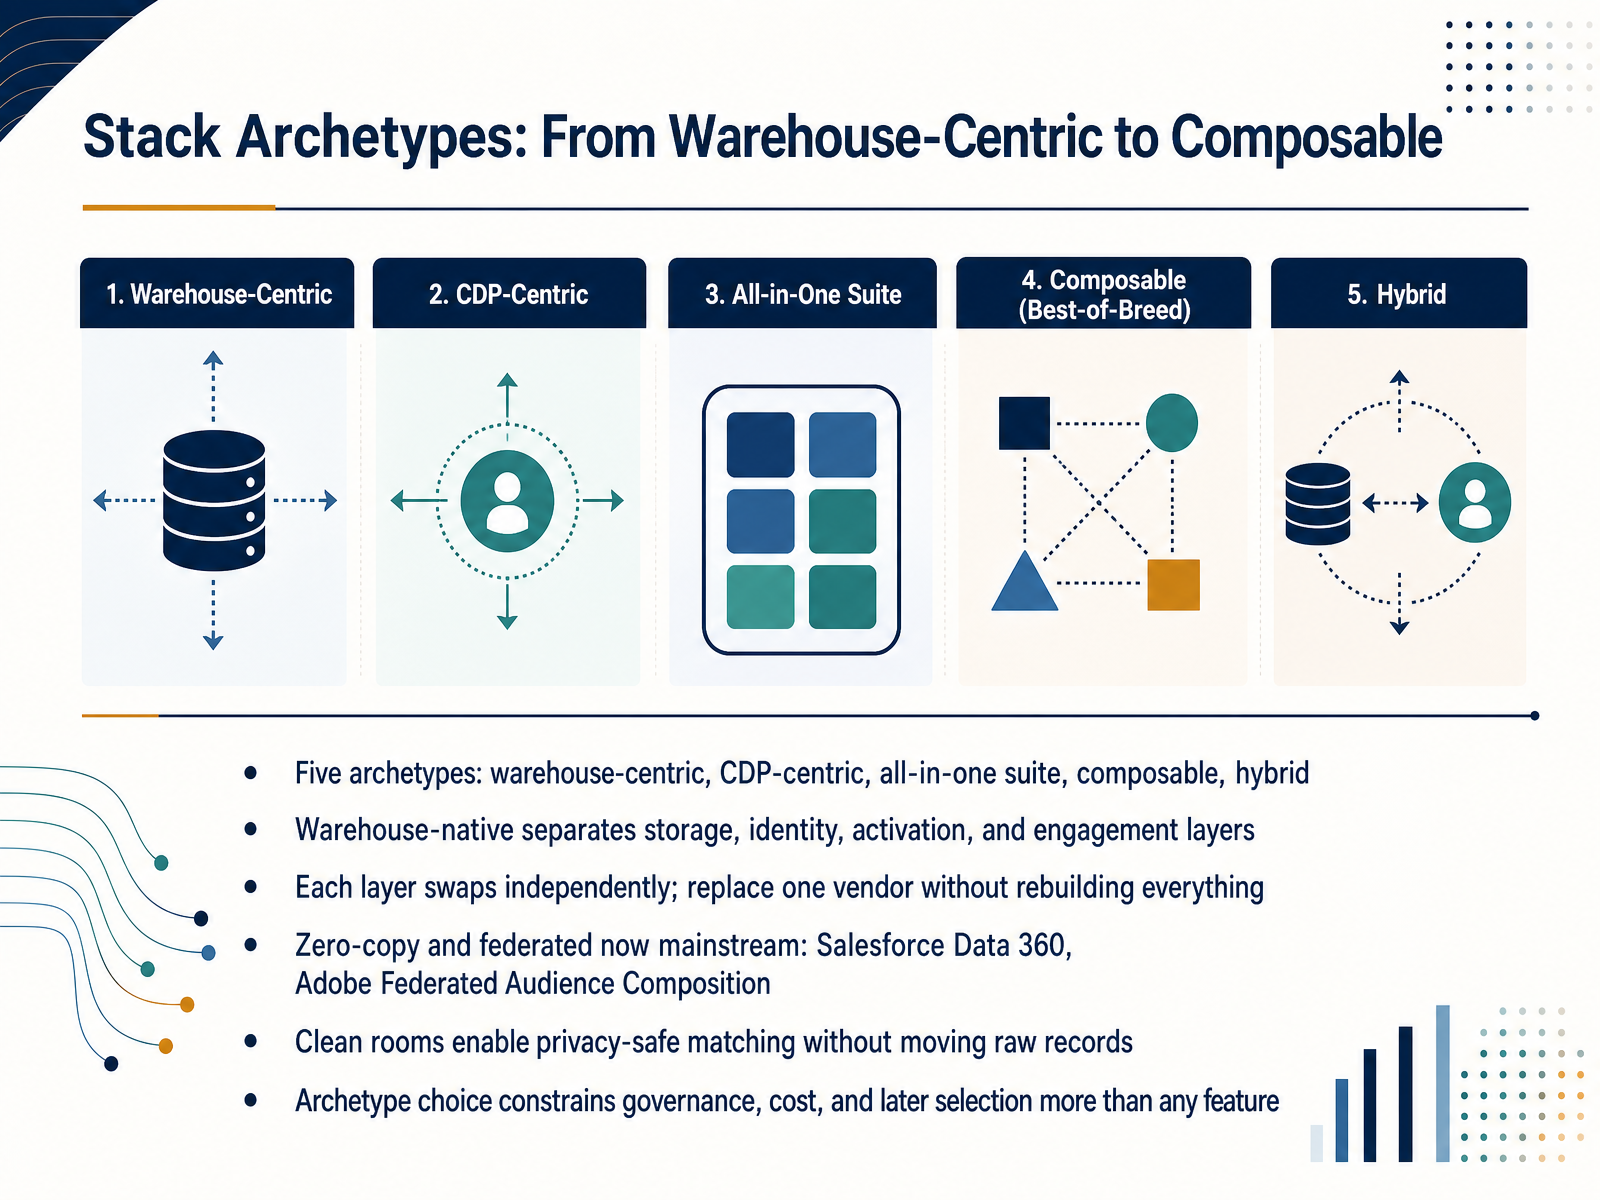
 - 04Stack Archetypes: From Warehouse-Centric to ComposableArchitecture first, vendors second. Five archetypes dominate: warehouse-centric, CDP-centric, all-in-one suite, composable, and hybrid. The warehouse-native model separates four layers: storage, identity, activation, and engagement. Each layer swaps independently, so you can replace one vendor without rebuilding everything. Zero-copy and federated approaches are now mainstream. Salesforce Data 360 and Adobe Federated Audience Composition both query data in place rather than copying it. Clean rooms go further, enabling privacy-safe matching without moving raw records. One caution: composable looks cheaper on paper, but data engineering salaries are the hidden cost, often two engineers at roughly one hundred eighty thousand dollars each per year. Archetype choice constrains governance, cost, and later selection more than any feature. Choose based on your engineering capacity, not which architecture sounds most modern. Next, we will cover requirements discovery and evaluation criteria.
 martech360.comdatawhistl.comtrackraptor.com+21 min
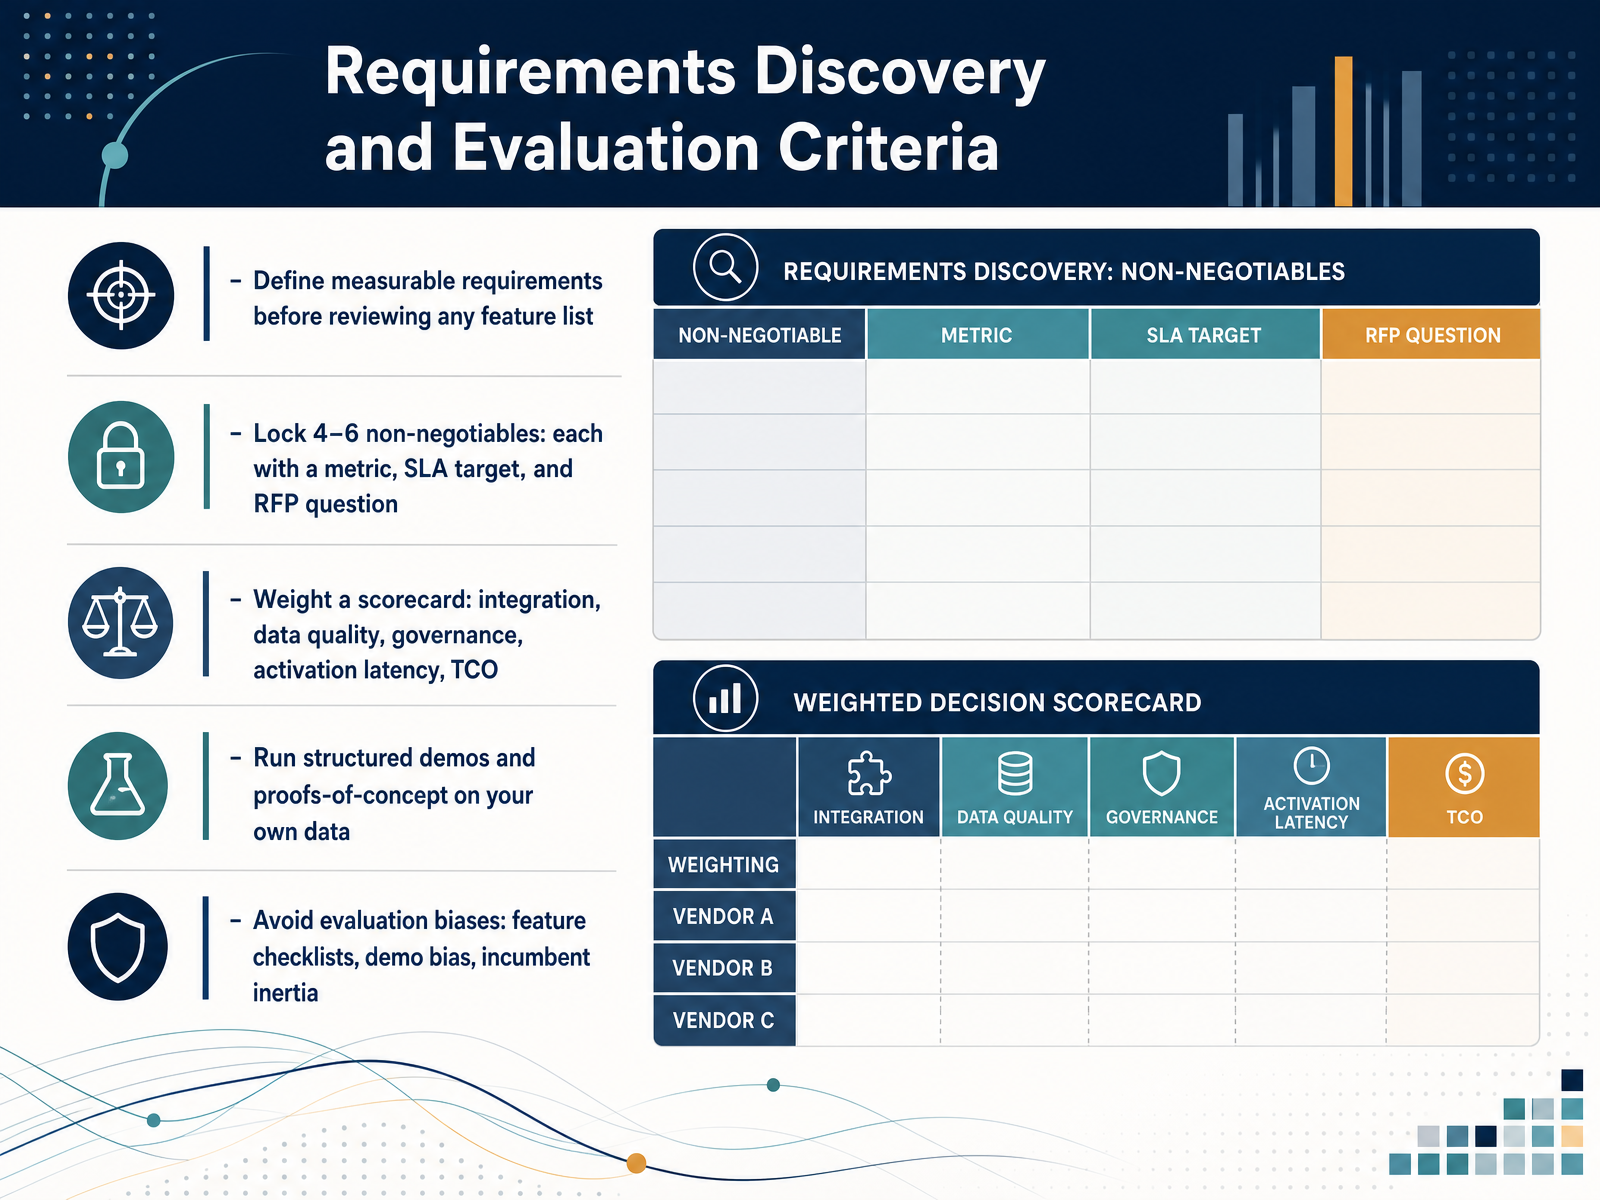
 - 05Requirements Discovery and Evaluation CriteriaLet's talk about requirements discovery and evaluation criteria. Start by defining measurable requirements before you review a single feature list. Then lock four to six non-negotiables. For each one, write a metric, an SLA target, and an RFP question. For example, not "describe your integrations," but "what are your P50 and P90 sync times from our CRM?" Next, weight a scorecard. The five categories that decide success are integration effort, data quality, governance, activation latency, and total cost of ownership. And make the weights a team argument, not a vendor pitch. Then run structured demos and proofs-of-concept on your own data, because a canned demo is slideware. Watch for evaluation biases too: feature checklists, demo bias, and incumbent inertia. A failed non-negotiable outranks the top total score. Next, we'll work through the build, buy, or compose decision framework.
 datamoon.comemarsys.comabmatic.ai+22 min
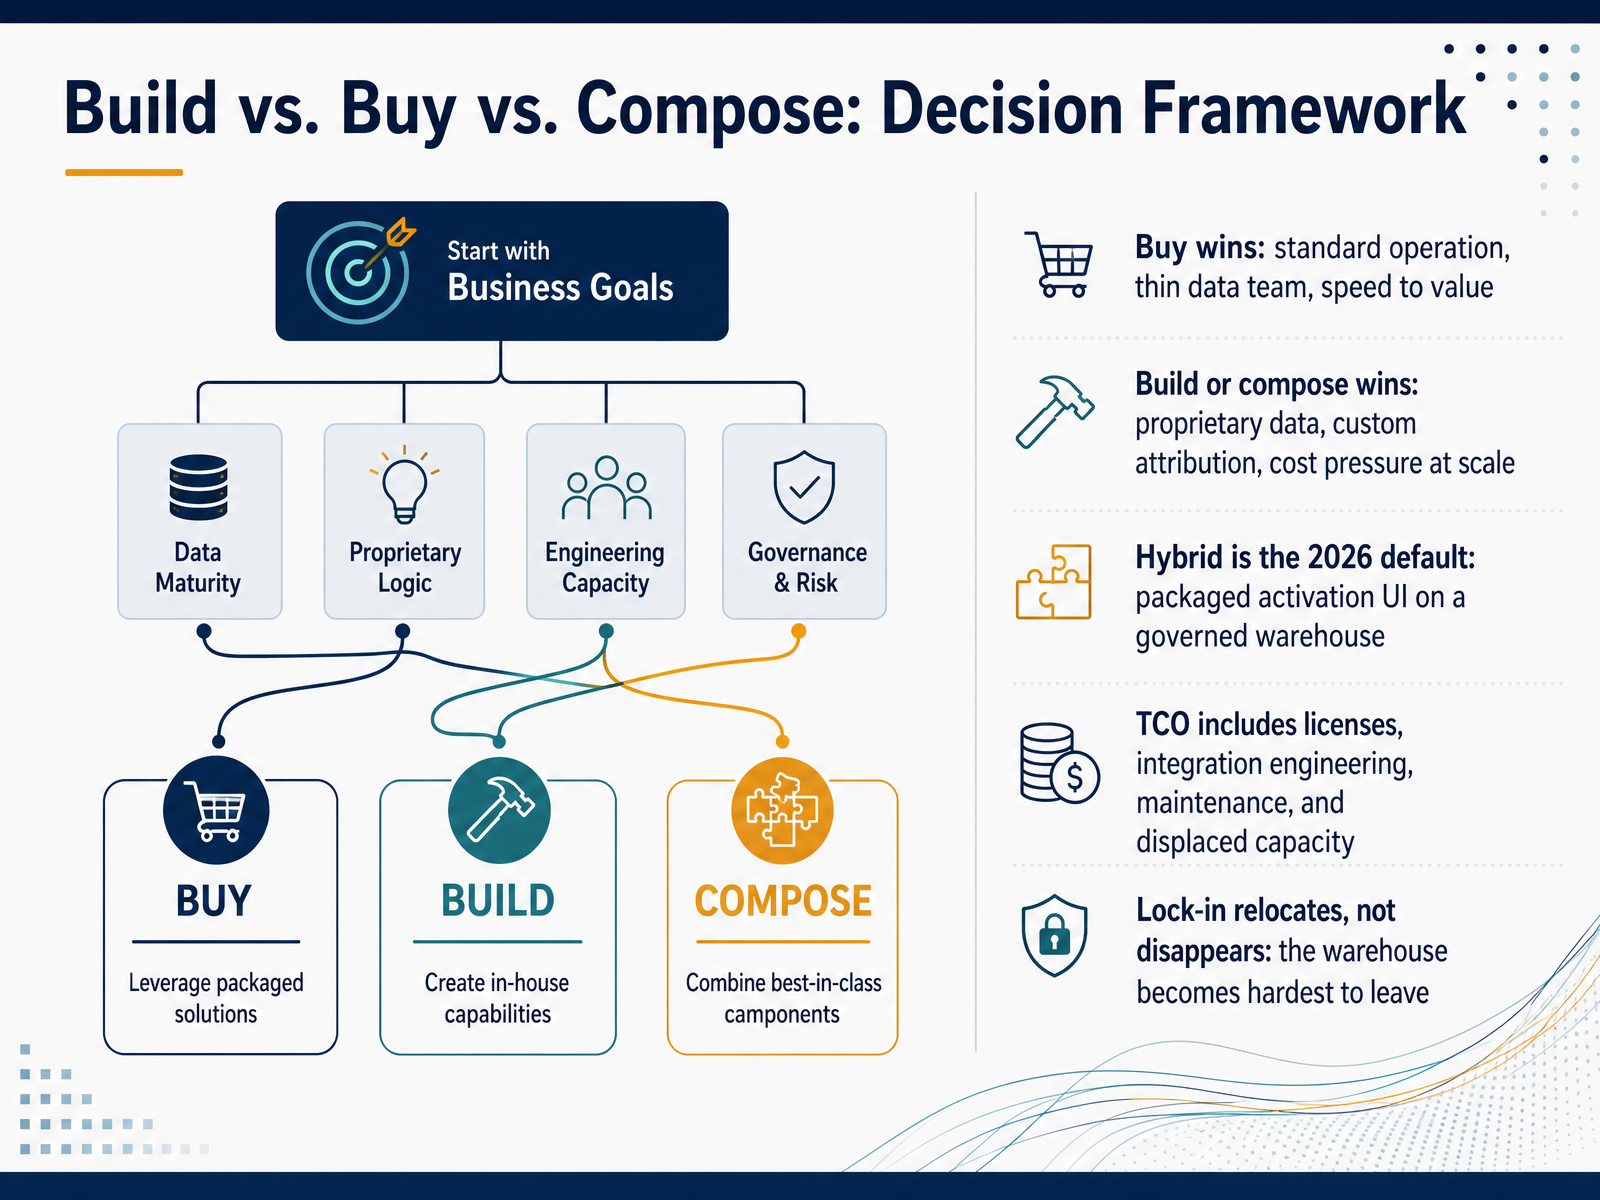
 - 06Build vs. Buy vs. Compose: Decision FrameworkLet's walk through the build versus buy versus compose decision. Buy wins when you need standard operation, have a thin data team, and want speed to value. Build or compose wins when proprietary data, custom attribution, or cost pressure at scale justify it. Teams spending about forty thousand dollars a year on tools that still cannot connect spend to closed revenue are the clearest build case. Break-even on a custom build typically runs two to three years. Hybrid is the 2026 default: a packaged activation interface sitting on a governed warehouse. You get marketer-friendly segmentation without copying data into yet another system. But weigh total cost of ownership honestly. Licenses, integration engineering, ongoing maintenance, and displaced engineering capacity all count. Maintenance often exceeds initial development. And lock-in relocates, it does not disappear. The warehouse becomes your hardest layer to leave. So decide deliberately. Next, we cover data architecture foundations: ingestion, identity, and governance.
 raftlabs.comeltherion.commartech360.com+21 min
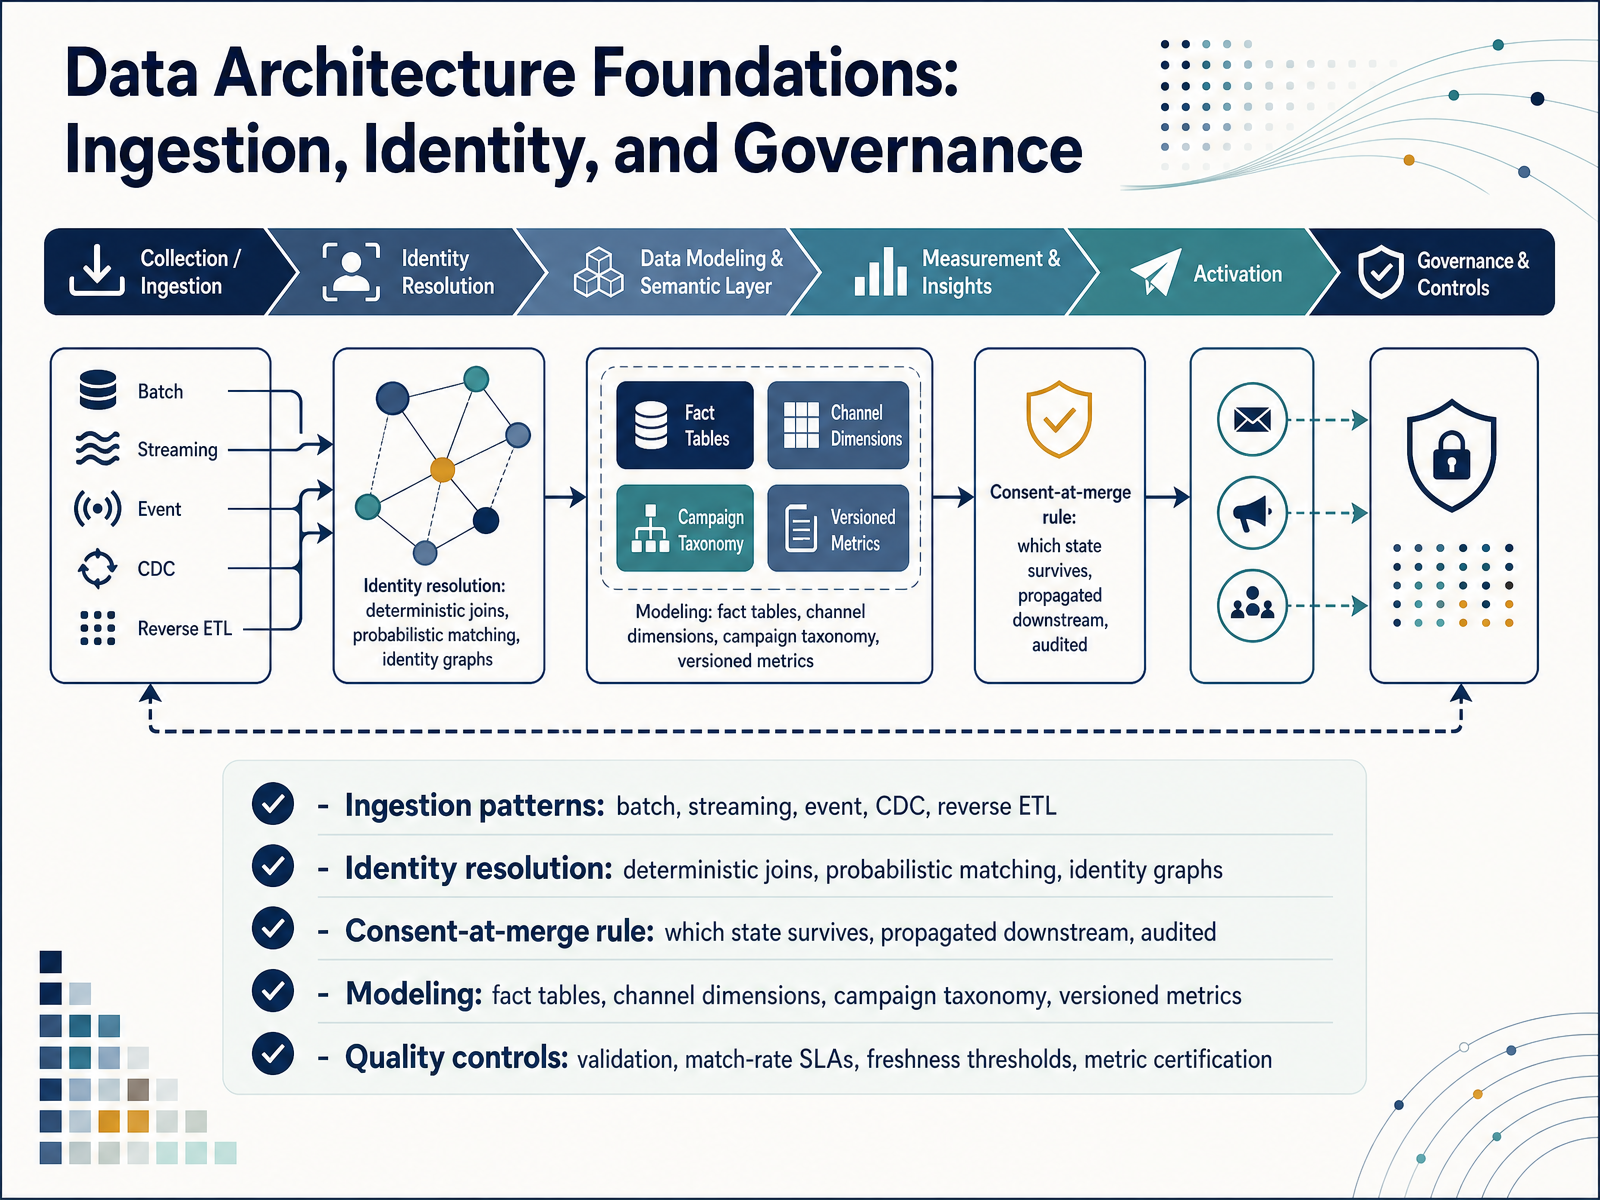
 - 07Data Architecture Foundations: Ingestion, Identity, and GovernanceNow let's ground this in the data architecture, because selection decisions live or die here. Ingestion patterns matter first. Batch, streaming, event, change data capture, and reverse ETL each solve a different latency problem. Most teams need several. Next, identity resolution. Deterministic joins on hashed email or login are high confidence. Probabilistic matching fills anonymous gaps, but treat it as modeling input, not as stored PII. Here's the rule that trips teams up. When identities merge, which consent state survives? Not the most permissive, not the most restrictive. Apply an explicit rule, propagate it downstream, and audit every merge. Modeling follows. Build fact tables, channel dimensions, and a versioned campaign taxonomy. Then enforce quality controls. Validation, match-rate service levels, freshness thresholds, and metric certification. One takeaway. Consent-aware identity is the architecture that actually makes the rest defensible. Next, we move into measurement architecture, covering attribution, experimentation, and incrementality.
 martech360.comdatawhistl.comtrackraptor.com+22 min
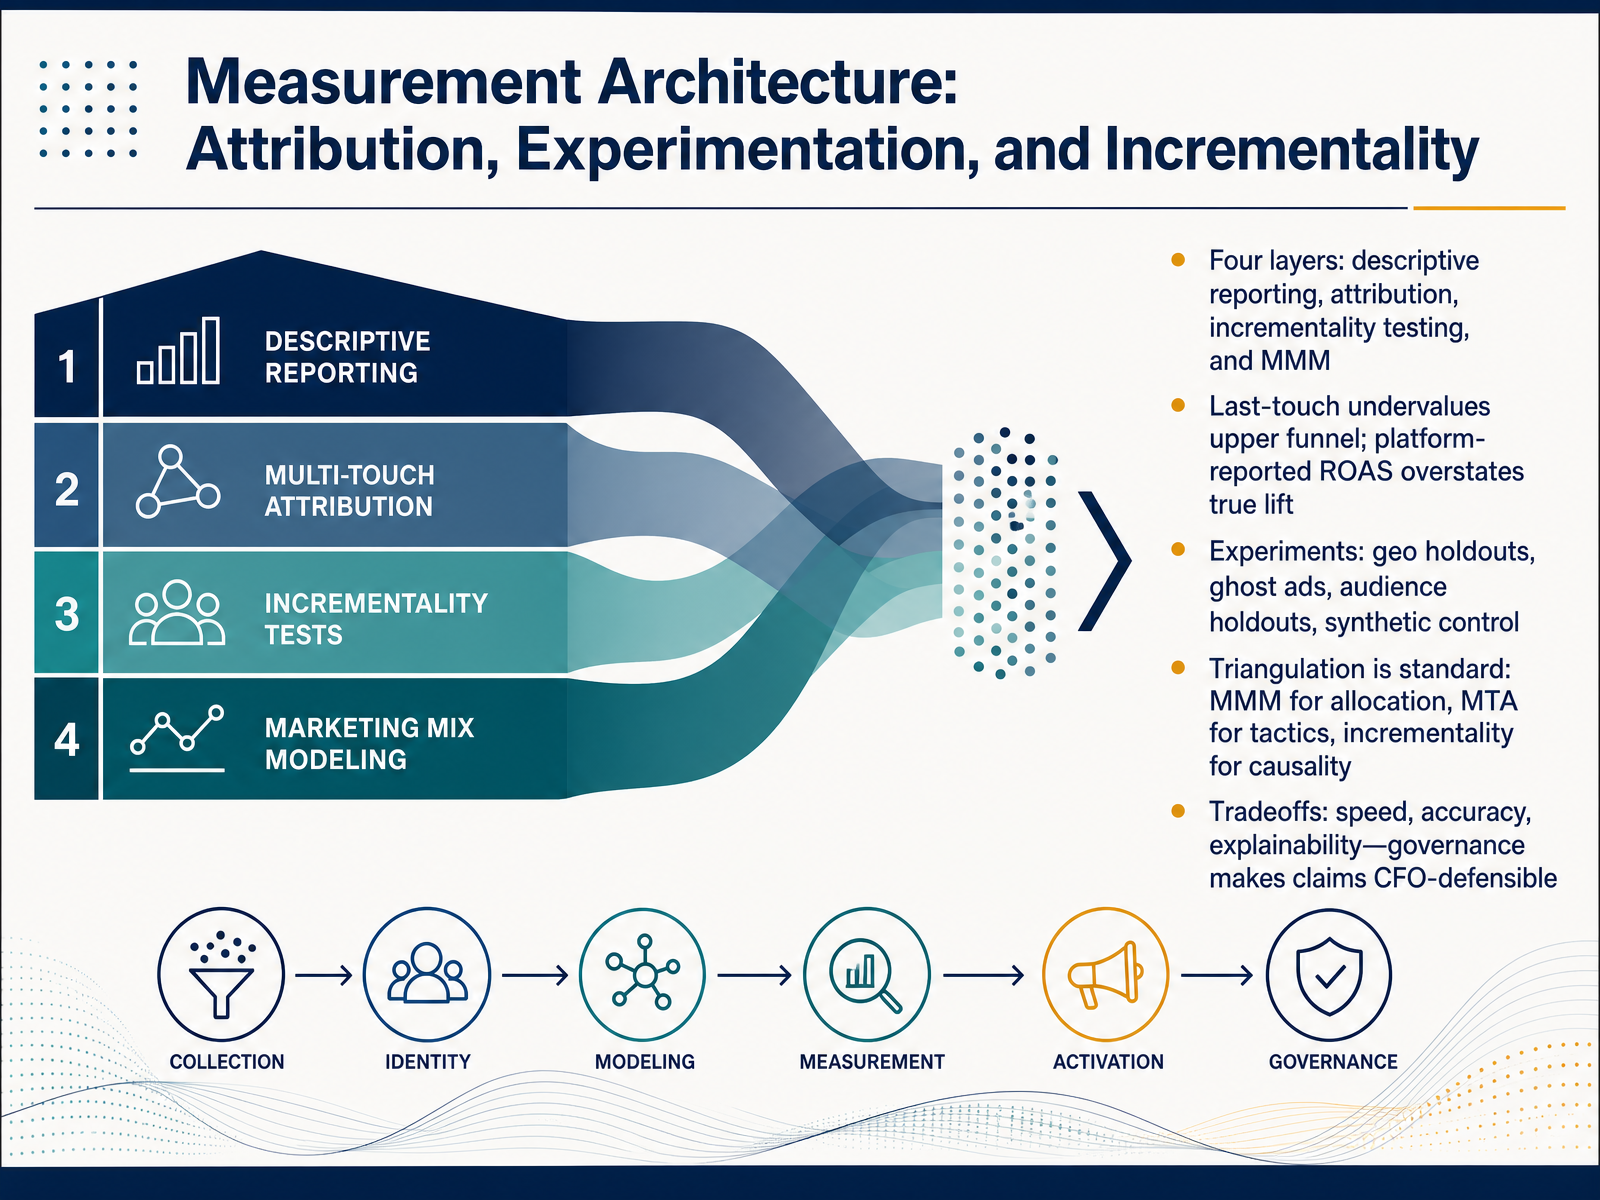
 - 08Measurement Architecture: Attribution, Experimentation, and IncrementalityNow let's move into measurement architecture, because this is where most stacks quietly break. Think in four layers: descriptive reporting, attribution, incrementality testing, and marketing mix modeling. Each answers a different question, and none replaces the others. Last-touch attribution undervalues upper funnel, while platform-reported ROAS overstates true lift. Measured incremental ROAS often lands thirty to sixty percent below what the platform claims. So you run experiments: geo holdouts, ghost ads, audience holdouts, and synthetic control, depending on channel and data access. Triangulation is now standard. Marketing mix modeling guides allocation, multi-touch attribution guides tactics, and incrementality settles causality. The tradeoff is speed, accuracy, and explainability. Governance is what makes those claims CFO-defensible: documented assumptions, source separation, and an audit trail. Next, we move to activation and workflow integration.
 skopx.comlayerfive.comobservix.ai+22 min
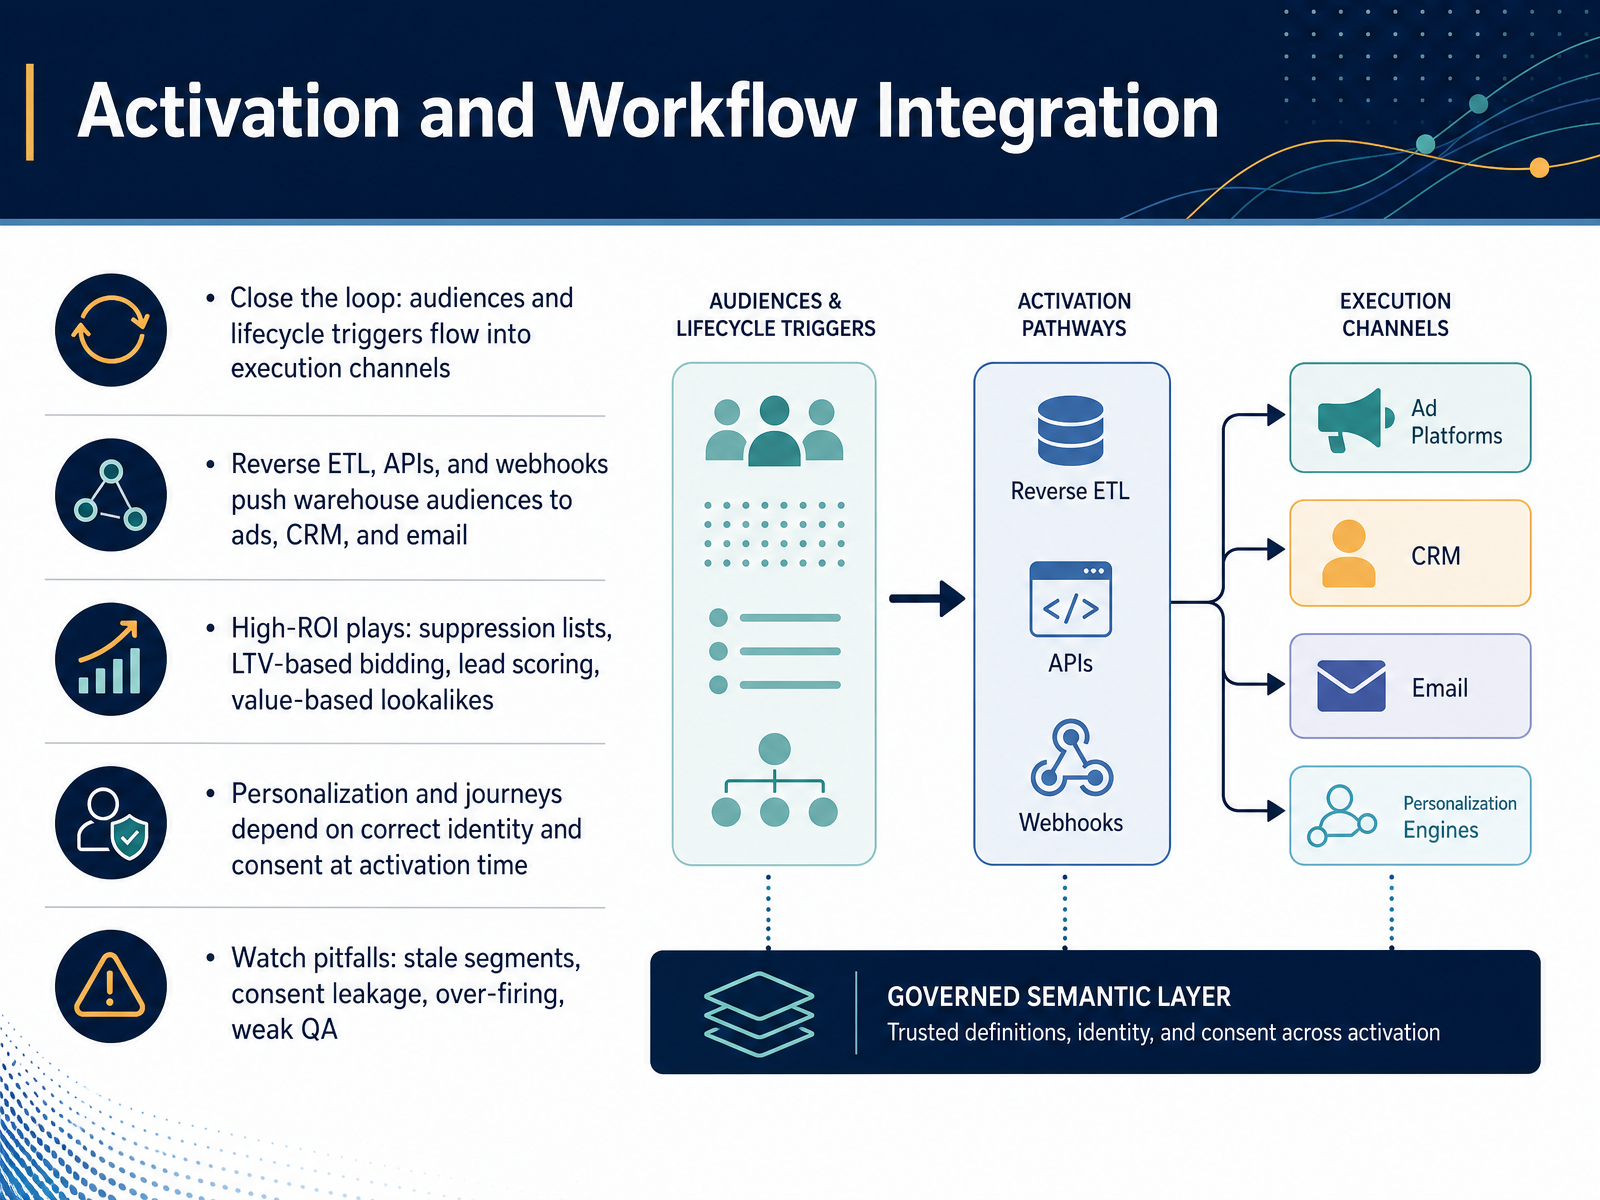
 - 09Activation and Workflow IntegrationNow let's talk about activation and workflow integration, where analytics stops being a report and starts changing behavior. Closing the loop means audiences and lifecycle triggers flow into your execution channels. Reverse ETL, APIs, and webhooks push warehouse audiences to ads, CRM, and email, so nobody exports a CSV on Monday morning. The highest-return plays are practical. Suppression lists stop you paying to acquire existing customers. Lifetime value based bidding feeds real value into ad platforms instead of a flat conversion. Lead scoring activation puts trusted scores into the CRM field that triggers routing. Value based lookalikes seed from your best customers, not just all purchasers. But personalization and journeys depend on correct identity and consent at activation time. Watch four pitfalls: stale segments, consent leakage, over-firing messages, and weak QA. So test one audience end to end before scaling, and check freshness and consent on every sync. Next, we look at cost, performance, and operational tradeoffs at scale.
 martech360.comdatawhistl.comtrackraptor.com+22 min
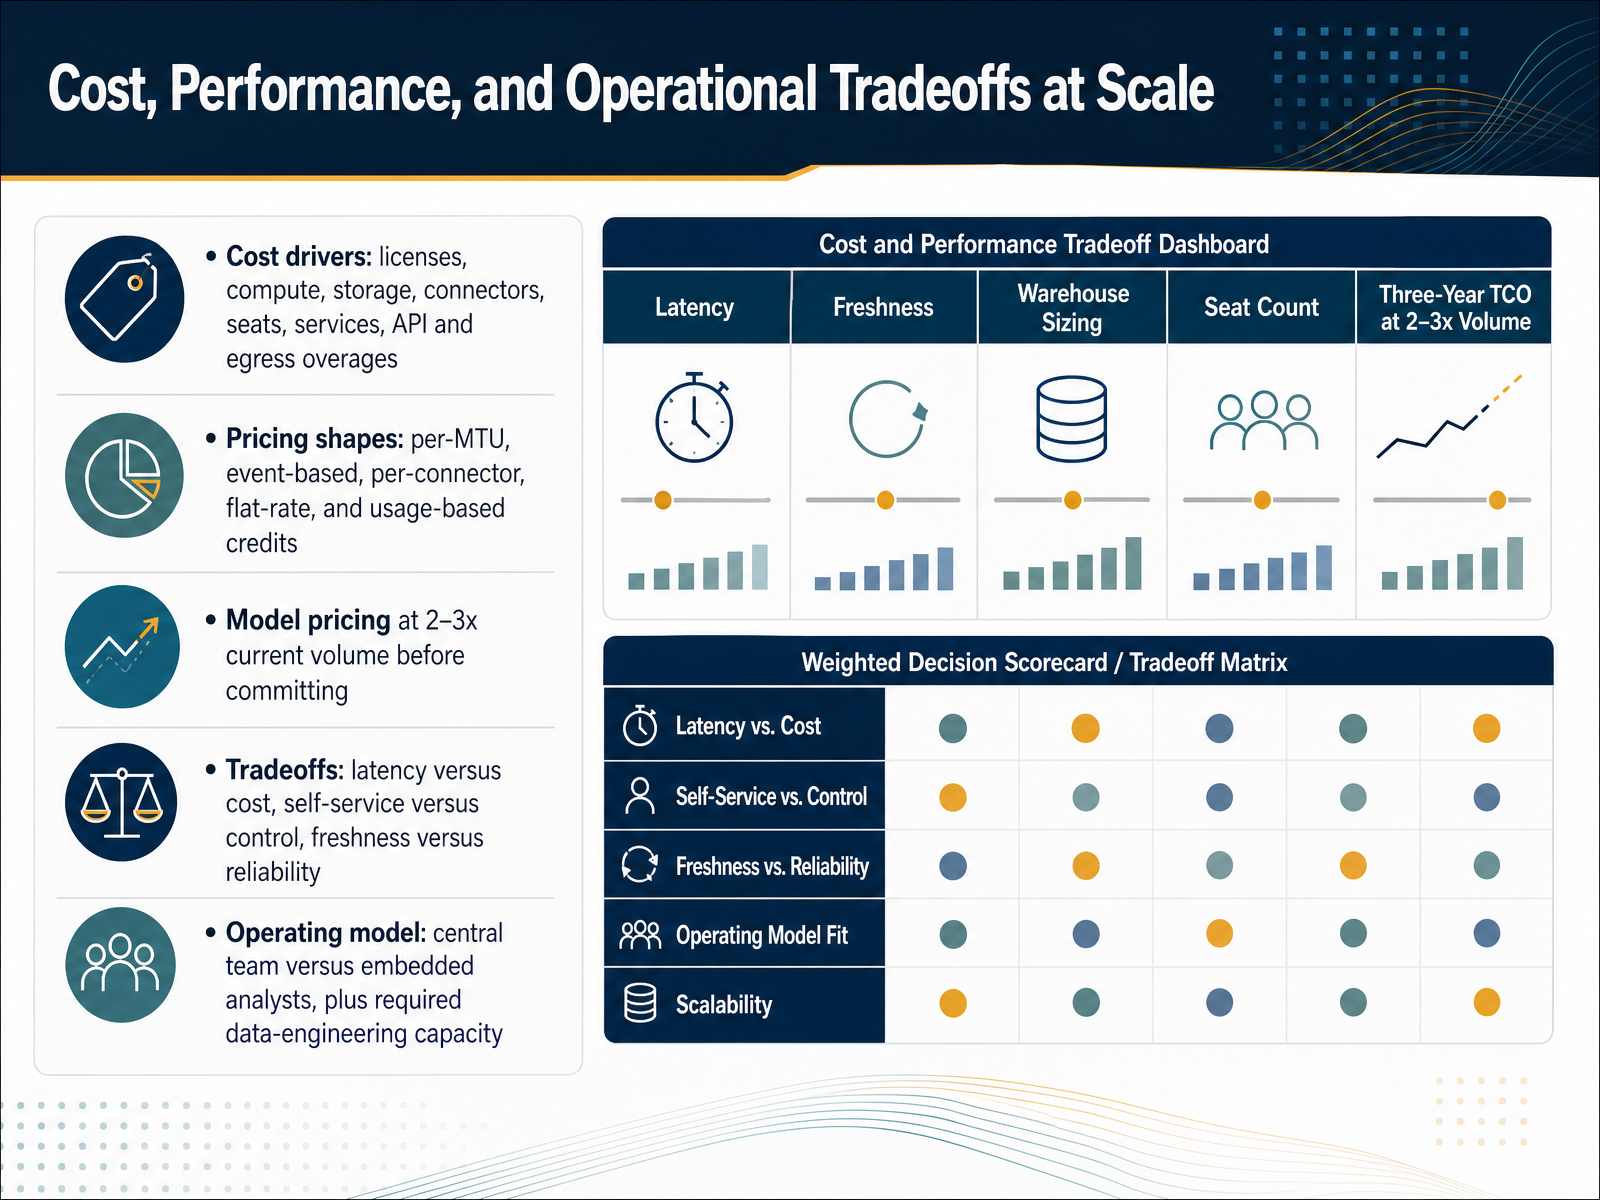
 - 10Cost, Performance, and Operational Tradeoffs at ScaleNow let's get concrete about cost, performance, and operational tradeoffs at scale. Start by listing your cost drivers honestly: licenses, compute, storage, connectors, seats, services, plus API and egress overages. Pricing shapes differ too. Some vendors charge per monthly tracked user, some per event, some per connector, others flat-rate or on usage-based credits. Each shape punishes a different growth pattern, so read the shape before the price. One discipline matters most here. Model your pricing at two to three times current volume before you commit. Teams that skip this step routinely hit surprise bills six months in. Then weigh the tradeoffs explicitly. Lower latency usually costs more. More self-service usually means less control. Fresher data usually means less reliability. None of those is free. And decide your operating model up front. A central team versus embedded analysts, plus the data-engineering capacity each one actually requires. Next, we'll walk through the migration roadmap, risks, and governance.
 raftlabs.comeltherion.com2 min
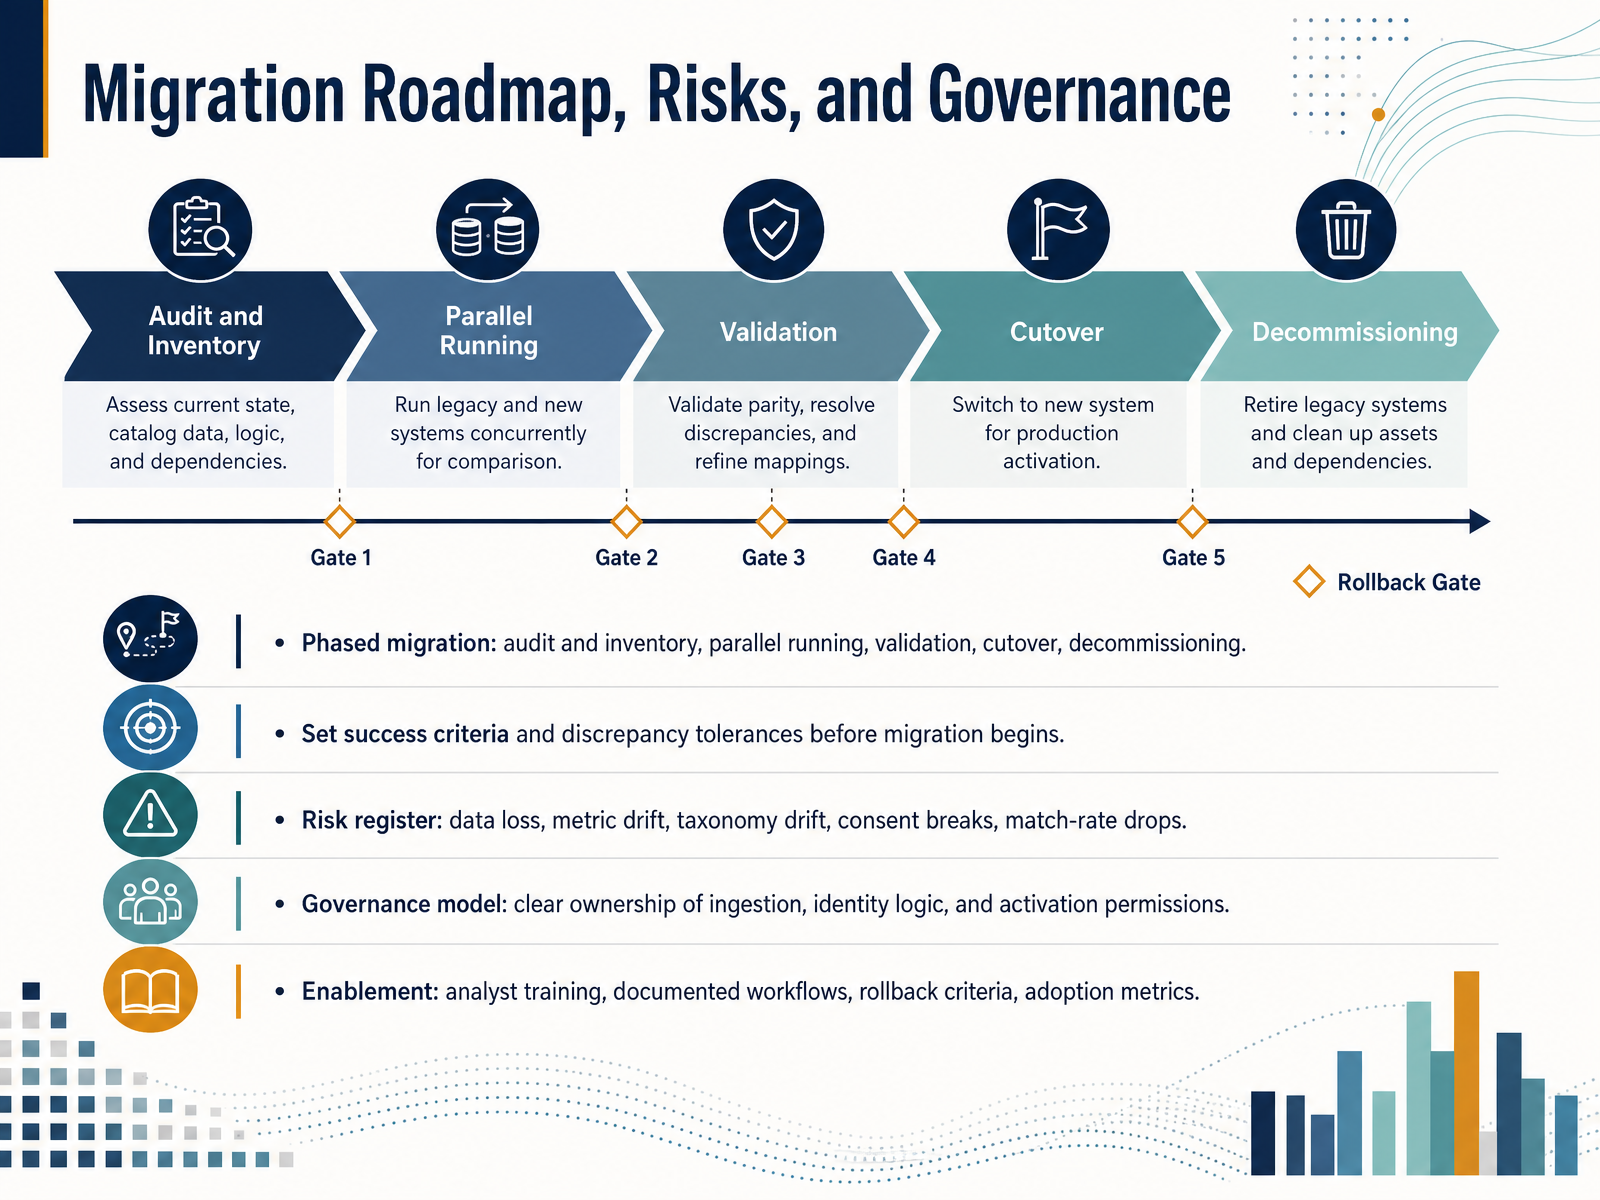
 - 11Migration Roadmap, Risks, and GovernanceNext, let's talk about migration roadmap, risks, and governance. Every platform migration follows five phases: audit and inventory, parallel running, validation, cutover, then decommissioning. Audit and inventory comes first. Map every source, every downstream dependency, every audience, and every dashboard before you touch anything. Then run both platforms in parallel. That parallel window is where you catch problems safely, while your old system is still your backup. One caution. Set success criteria and discrepancy tolerances before migration begins, not after. For example, conversion tracking within five percent of your CRM data, and alert on anything above one percent metric drift. Otherwise, every disagreement becomes a debate. Build a risk register around five recurring failure modes. Data loss, metric drift, taxonomy drift, consent breaks, and match-rate drops. Then assign a governance model with clear ownership of ingestion, identity logic, and activation permissions. Finally, plan enablement. Analyst training, documented workflows, written rollback criteria, and adoption metrics for the first ninety days. The migration only succeeds if the team can operate it. That leads us to reference architectures and decision artifacts.
 datamoon.comemarsys.comabmatic.ai+22 min
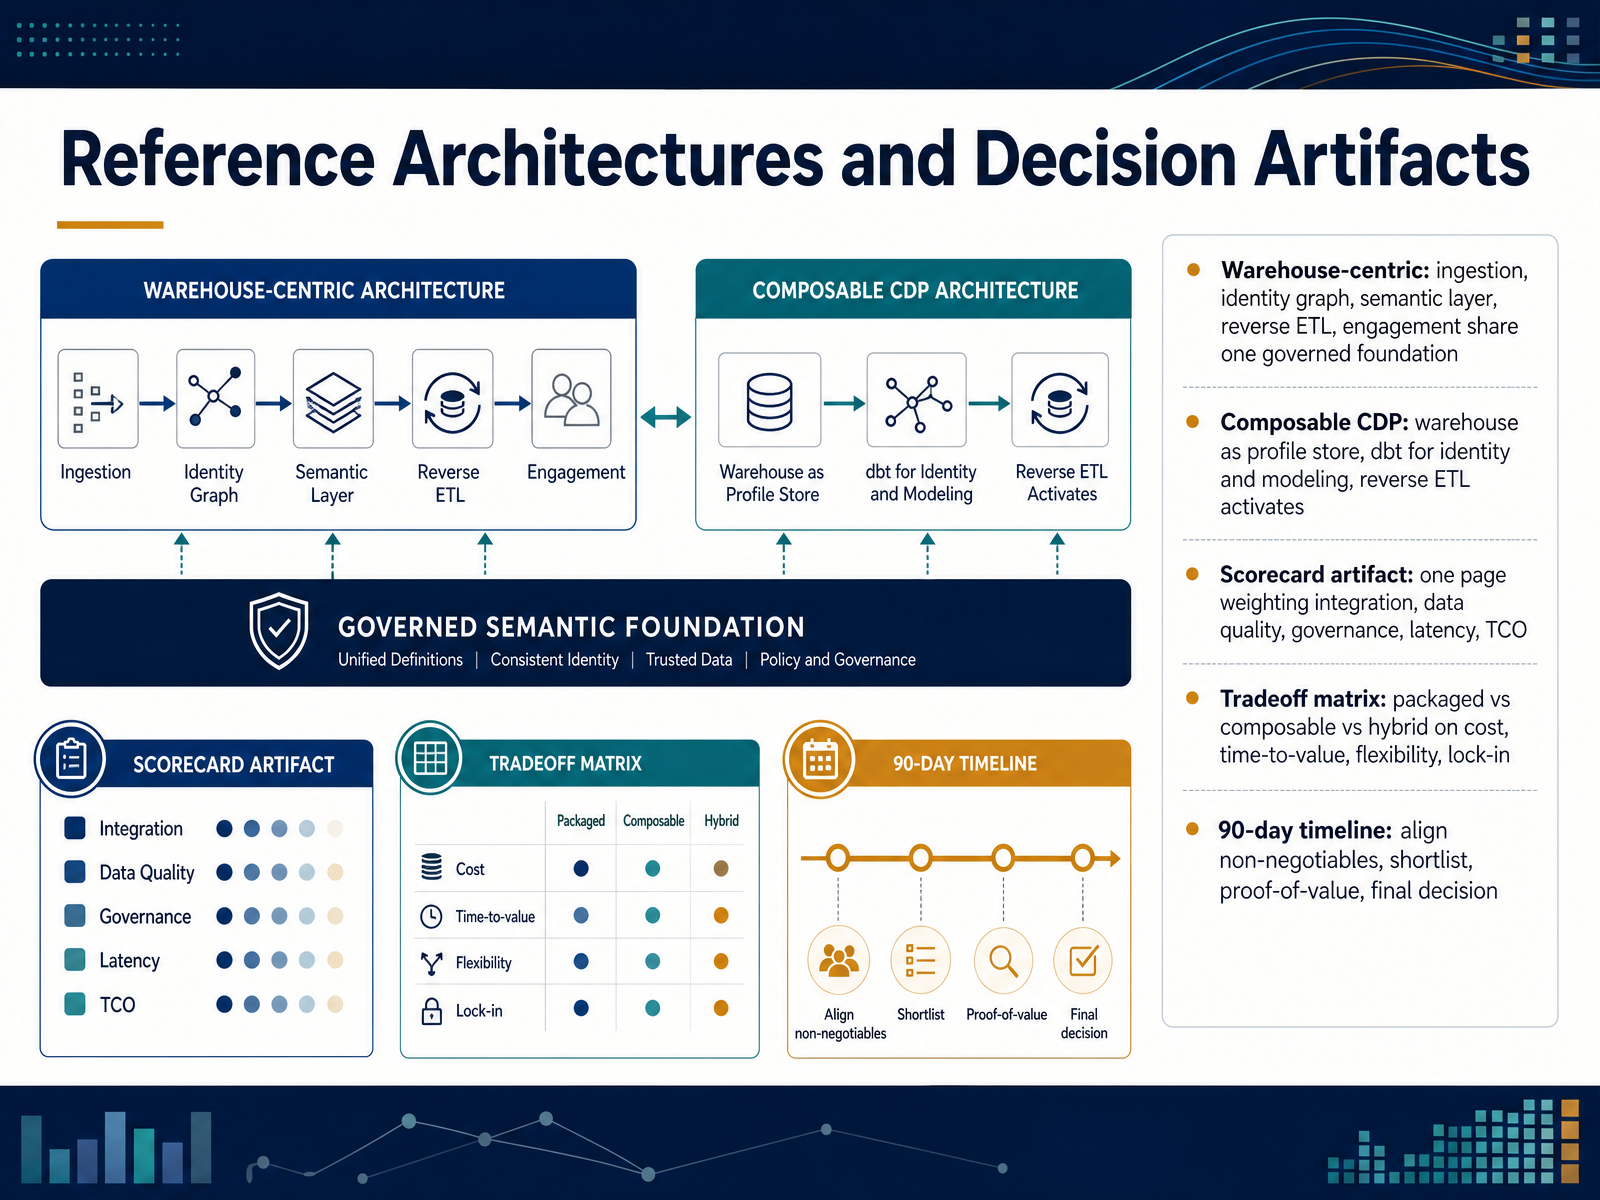
 - 12Reference Architectures and Decision ArtifactsLet's bring this together into concrete architectures and decision artifacts you can actually use. Two patterns dominate. In the warehouse-centric model, ingestion, identity graph, semantic layer, reverse ETL, and engagement share one governed foundation. The composable CDP variant treats the warehouse as the profile store, uses dbt for identity and modeling, and lets reverse ETL handle activation. Before you compare vendors, build two artifacts. First, a one-page scorecard weighting integration, data quality, governance, latency, and TCO. Second, a tradeoff matrix comparing packaged, composable, and hybrid across cost, time-to-value, flexibility, and lock-in. Then run a ninety-day timeline: align non-negotiables, shortlist, run a proof-of-value, and make the final decision. The core principle is durable data with replaceable tools around it. Next, we'll cover common failure modes and how to avoid them.
 martech360.comdatawhistl.comtrackraptor.com+22 min
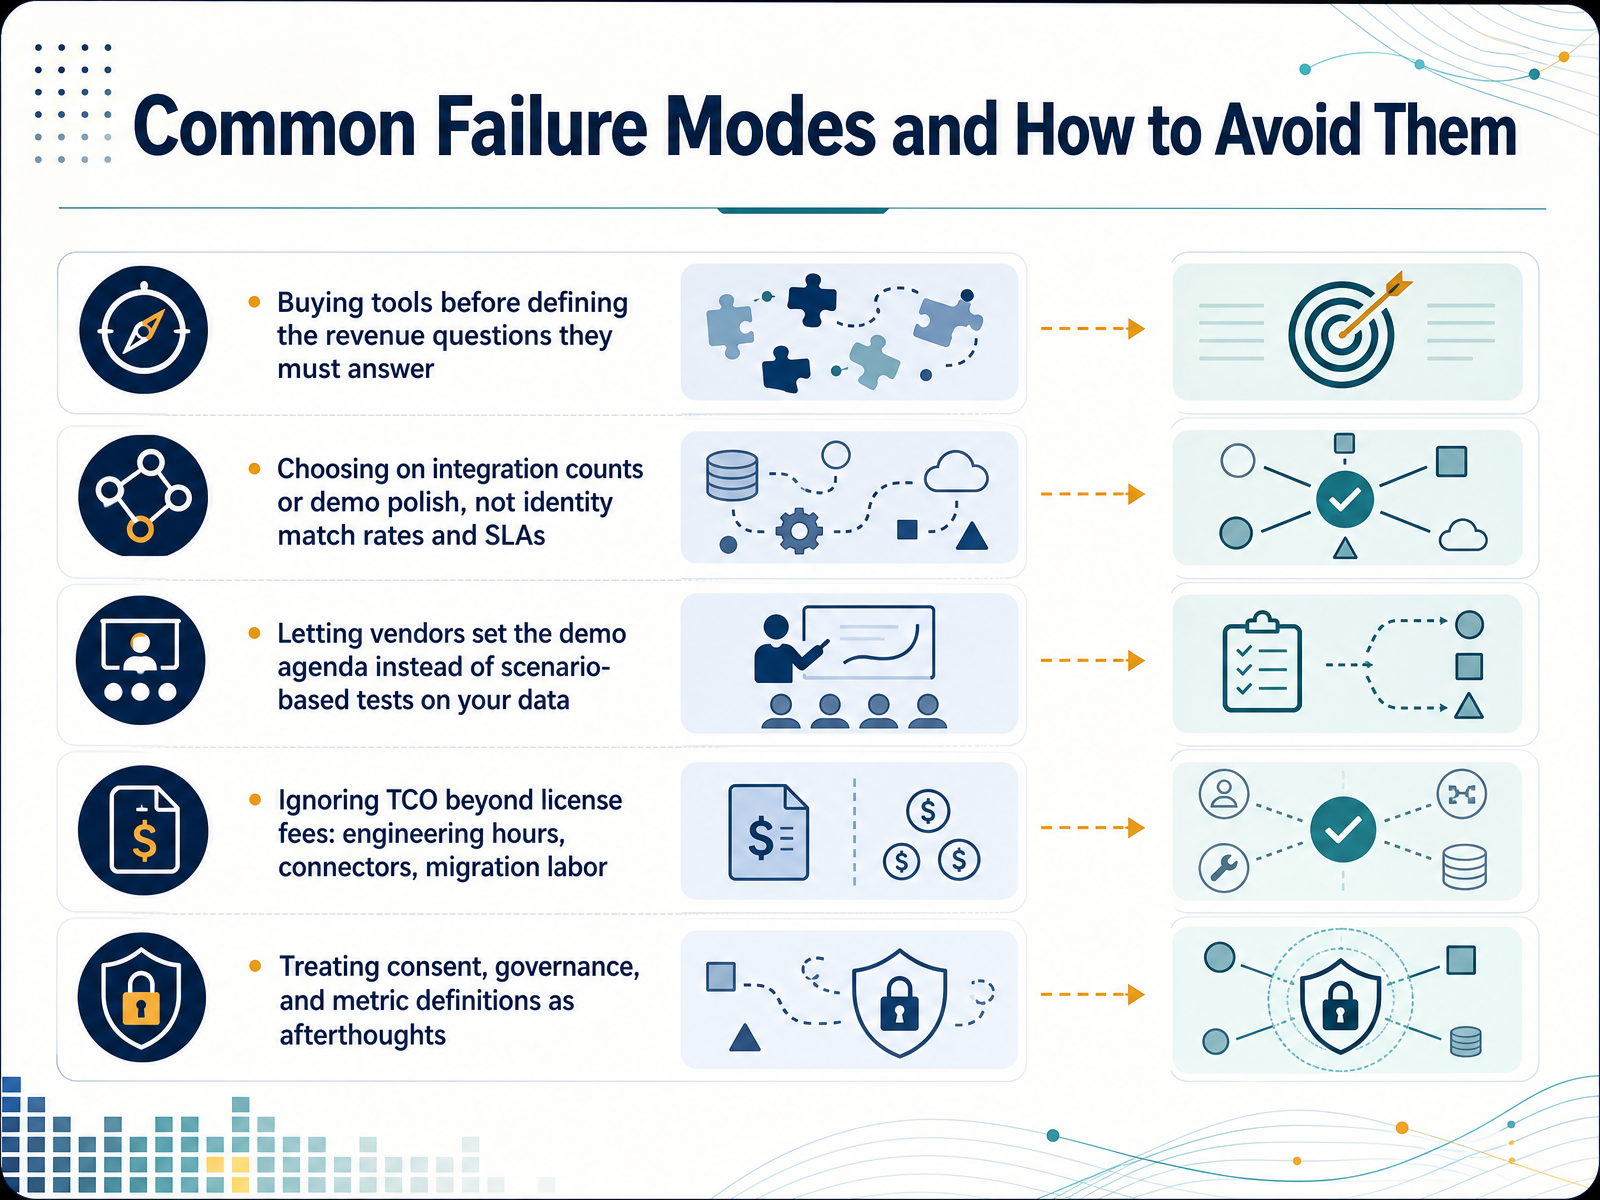
 - 13Common Failure Modes and How to Avoid ThemNow let's talk about the failure modes that derail most platform decisions. The first is buying tools before defining the revenue questions they must answer. Vendors can't optimize for questions you never wrote down. Second, teams choose on integration counts or demo polish instead of identity match rates and data quality service levels. A connector can exist and still sync to the wrong fields or miss your service level commitments. Third, letting vendors set the demo agenda. Instead, run scenario-based tests on your own data, and ask for twelve months of match rates by region. Fourth, ignoring total cost of ownership beyond license fees. Engineering hours, connectors, and migration labor typically push three-year costs well past the sticker price. Fifth, treating consent, governance, and metric definitions as afterthoughts. They're non negotiable, and they're painful to retrofit. Next, we'll walk through the decision checklist and next steps.
 datamoon.comemarsys.comabmatic.ai+22 min
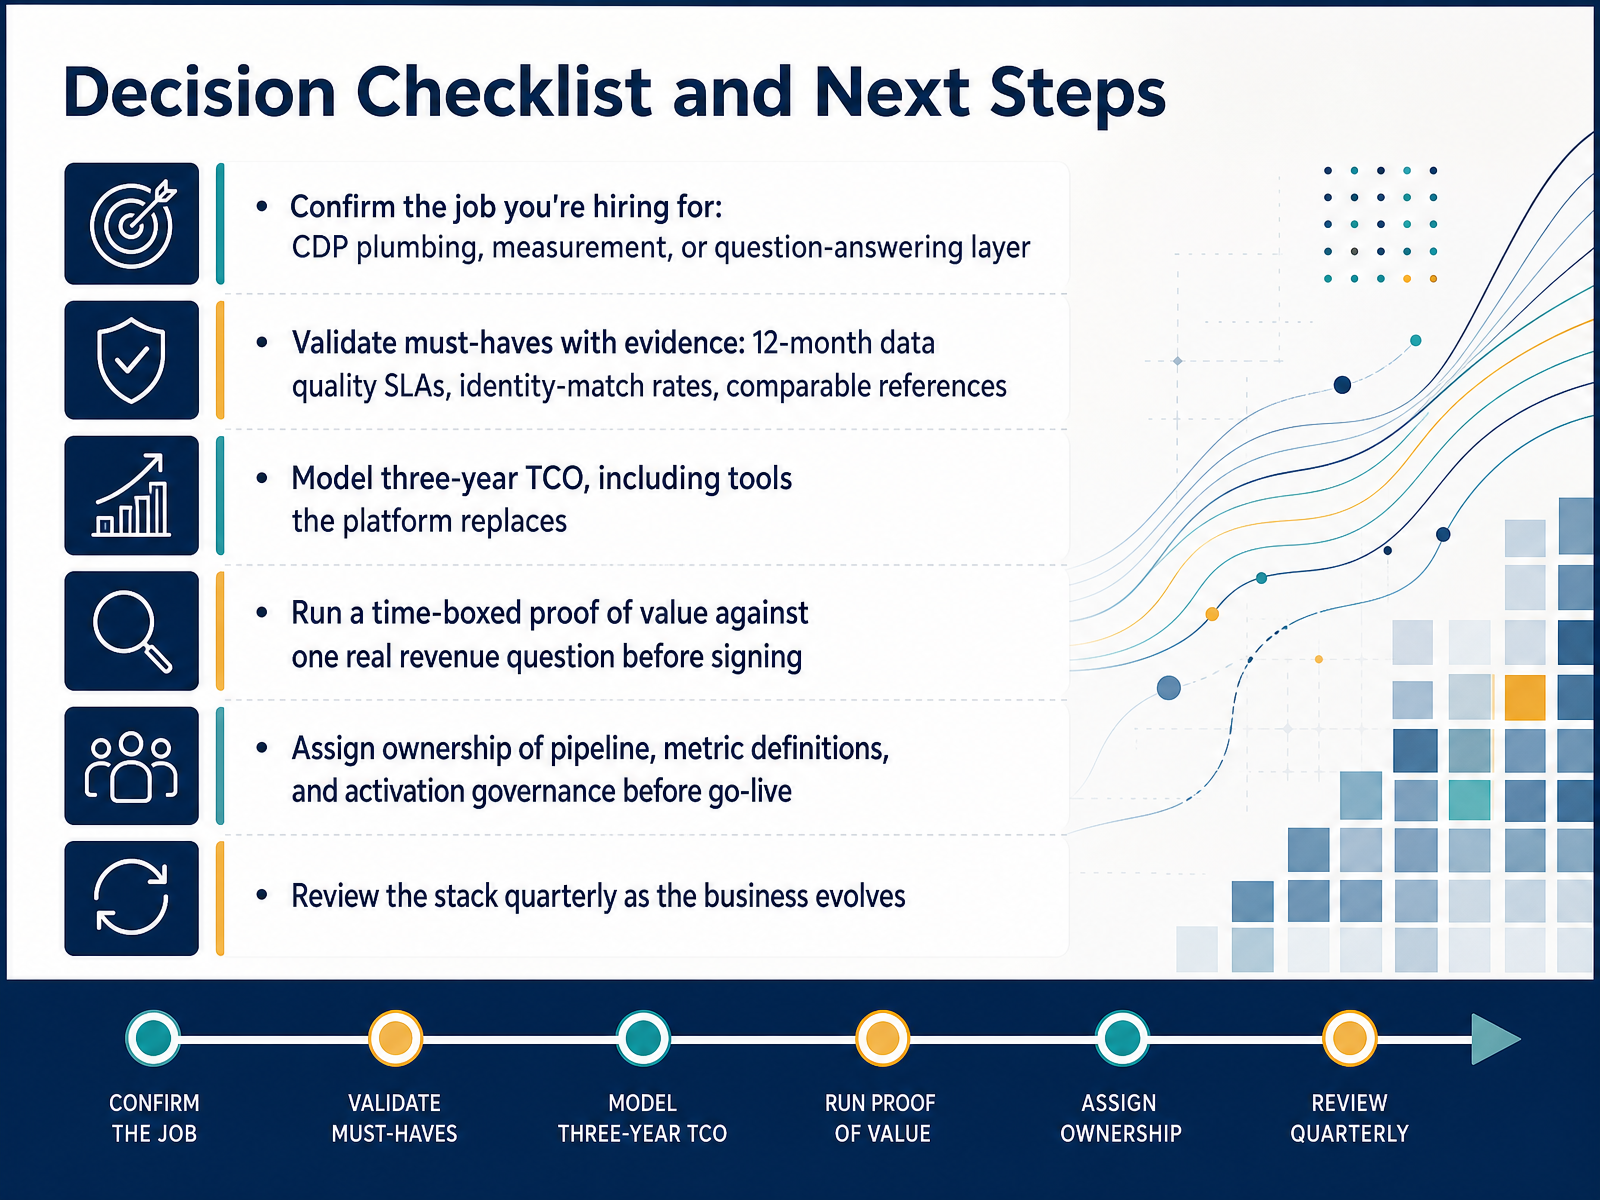
 - 14Decision Checklist and Next StepsLet's close with a checklist you can actually run. First, confirm the job you're hiring for. Is this customer data platform plumbing, a measurement layer, or a question-answering layer? Those three often get blended, and they shouldn't be. Second, validate must-haves with evidence, not promises. Ask for twelve months of data quality service-level agreements, identity-match rates, and two or three comparable references. Third, model three-year total cost of ownership, including every tool the platform replaces. License is often only forty to sixty percent of that number. Fourth, before you sign, run a time-boxed proof of value against one real revenue question. Fifth, assign ownership of the pipeline, the metric definitions, and activation governance before go-live, not after. And sixth, review the stack quarterly, because your business will evolve. If you remember one thing: start from the revenue question, demand evidence, and decide on the rubric, not the demo. Thank you for working through this with me. You now have a framework you can apply in your next buying cycle. Go run it.
 datamoon.comemarsys.comabmatic.ai+22 min
Take the deck with you
Download this course as a file — free, no sign-up needed.
- PDF handoutEvery slide page, ready to print or share.15 pages · 4.0 MBDownload
- PowerPoint slidesThe full deck as a .pptx — open it in PowerPoint, Keynote, or Google Slides.15 pages · 3.8 MBDownload
Free to use in your own training — please keep the PersonWise credit page at the end.
Have your own deck? Turn it into a course
Sources consulted
Web sources consulted while building this course.
- Marketing Data Platform RFP Scorecard: Practical Evaluation Framework. — datamoon.com
- 2026 Martech RFP Guide — emarsys.com
- How to Score an ABM Platform RFP (A Defensible Rubric for 2026) — abmatic.ai
- A Realistic Marketing Automation Vendor Evaluation Guide | Iris AI — heyiris.ai
- CDP RFP Template: How to Structure Your Request for Proposal | CDP.com — cdp.com
- Choosing a Data Driven Marketing Platform: 2026 Guide — skopx.com
- What Makes a Great Marketing Analytics Platform in 2026 — layerfive.com
- Marketing Analytics Tools: 2026 Buyer's Guide — observix.ai
- 15 Marketing Analytics Tools for 2026 + How to Choose — domo.com
- Composable Data Stacks for Marketing 2026: Complete Guide — 1clickreport.com
- Marketing Intelligence Platform: The 2026 Guide to Unifying Data, — marqops.com
- Marketing Analytics Features Comparison (2026) — Checklist | ProPicked — propicked.com
- AI-Driven Marketing Analytics & Predictive Insights: The 2026 Evaluation Guide - SwipeDirectory — swipedirectory.com
- The Composable Warehouse-Native Marketing Stack Playbook — martech360.com
- Composable CDP in 2026: The Data Platform Absorbed the CDP - Datawhistl — datawhistl.com
- How to build a composable CDP on a data warehouse | TrackRaptor | TrackRaptor Blog — trackraptor.com
- What is an end-to-end reference architecture for a composable CDP with identity resolution, segmentation, and activation? | Databricks — answers.databricks.com
- Composable Data Architecture for GTM Stacks: Practical Guide | Anfloy — anfloy.com
- Marketing Analytics Software Development Cost (2026) — raftlabs.com
- Product analytics build vs buy — Snowplow, Amplitude, 3‑yr TCO | Eltherion — eltherion.com