Marketing Metrics Mastery
Begin
14 pages · ~28 min
Marketing Metrics Mastery
Learn how to measure and interpret key content marketing metrics to optimize performance, with practical techniques for tracking ROI and improving strategy.
What you’ll learn
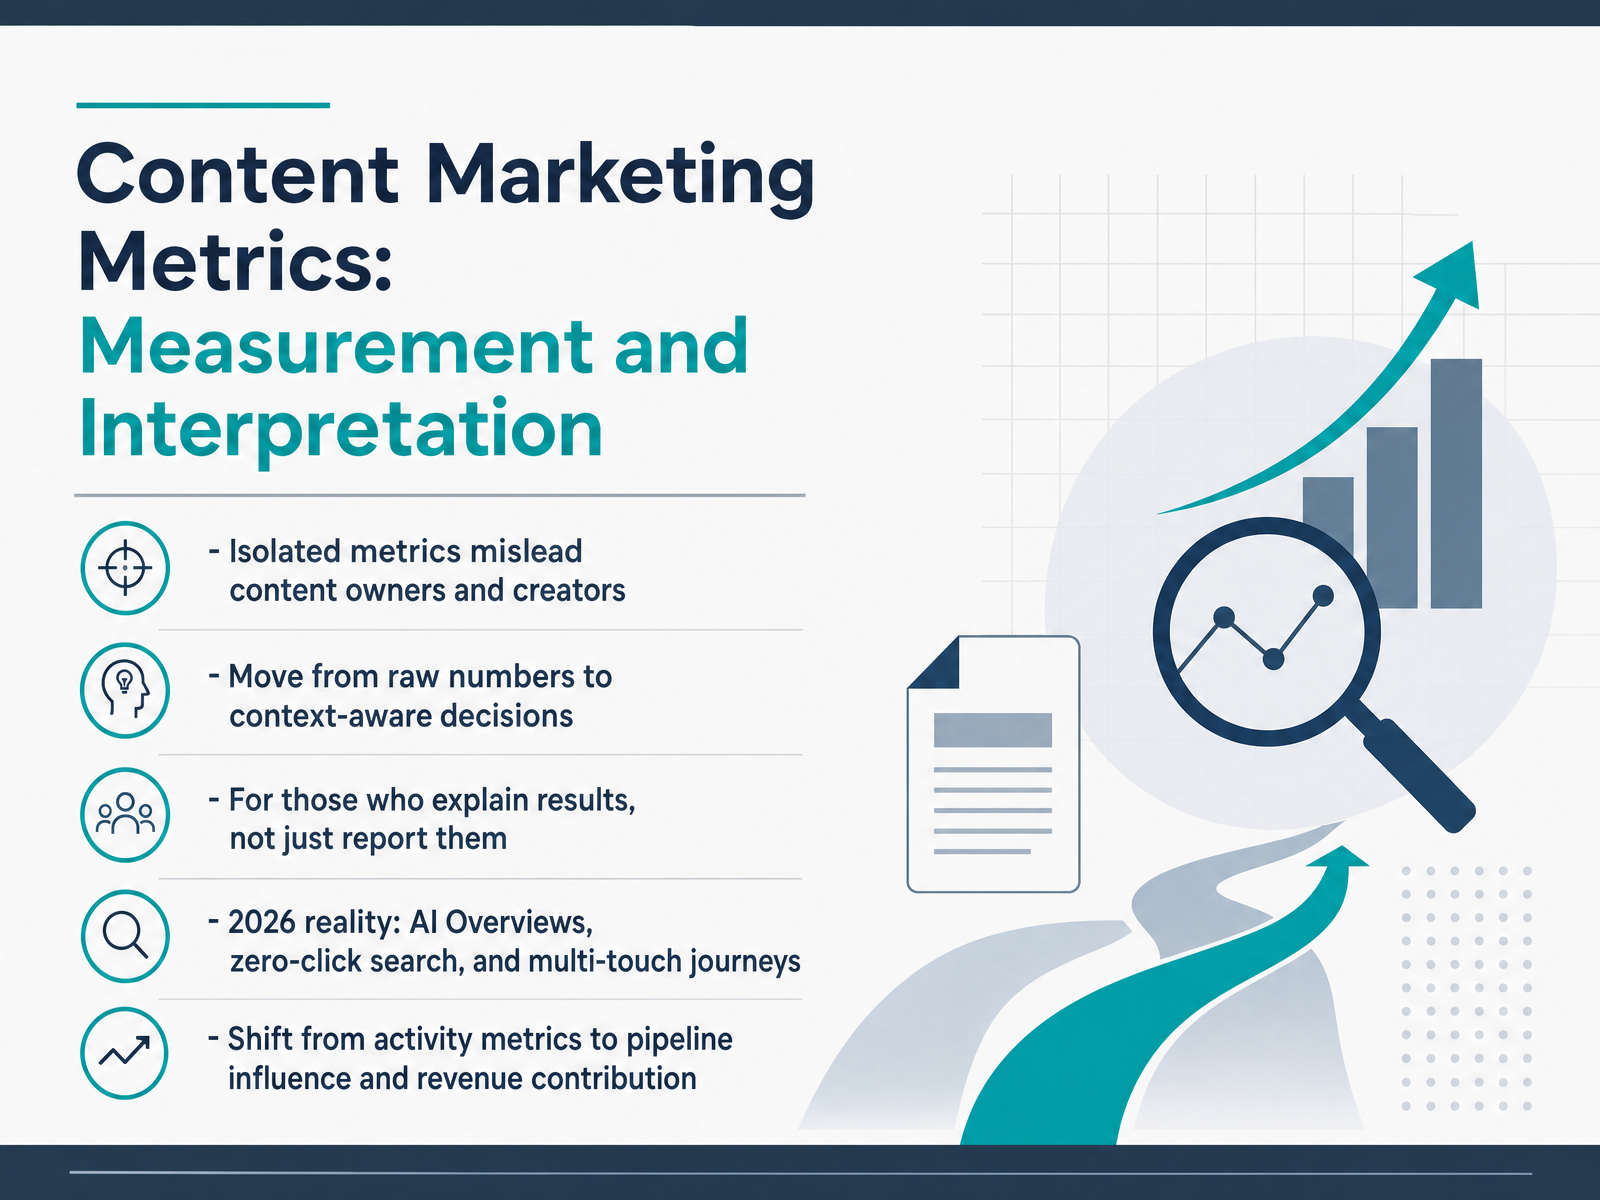
- 01Content Marketing Metrics: Measurement and InterpretationWelcome. If you create or interpret content results, you know the feeling. A dashboard shows a spike in traffic, but leadership asks about revenue. In 2026, isolated metrics mislead more than ever. AI Overviews, zero-click searches, and multi-touch journeys have broken the old rules of measurement. This course helps you move from raw numbers to context-aware decisions. You will learn to interpret results, not just report them. And you will shift your focus from activity metrics to pipeline influence and revenue contribution. By the end, you will have a framework to explain what content actually does for the business. Let's begin by looking at why single metrics often lead us astray.cometly.comcometly.comtendocom.com+21 min
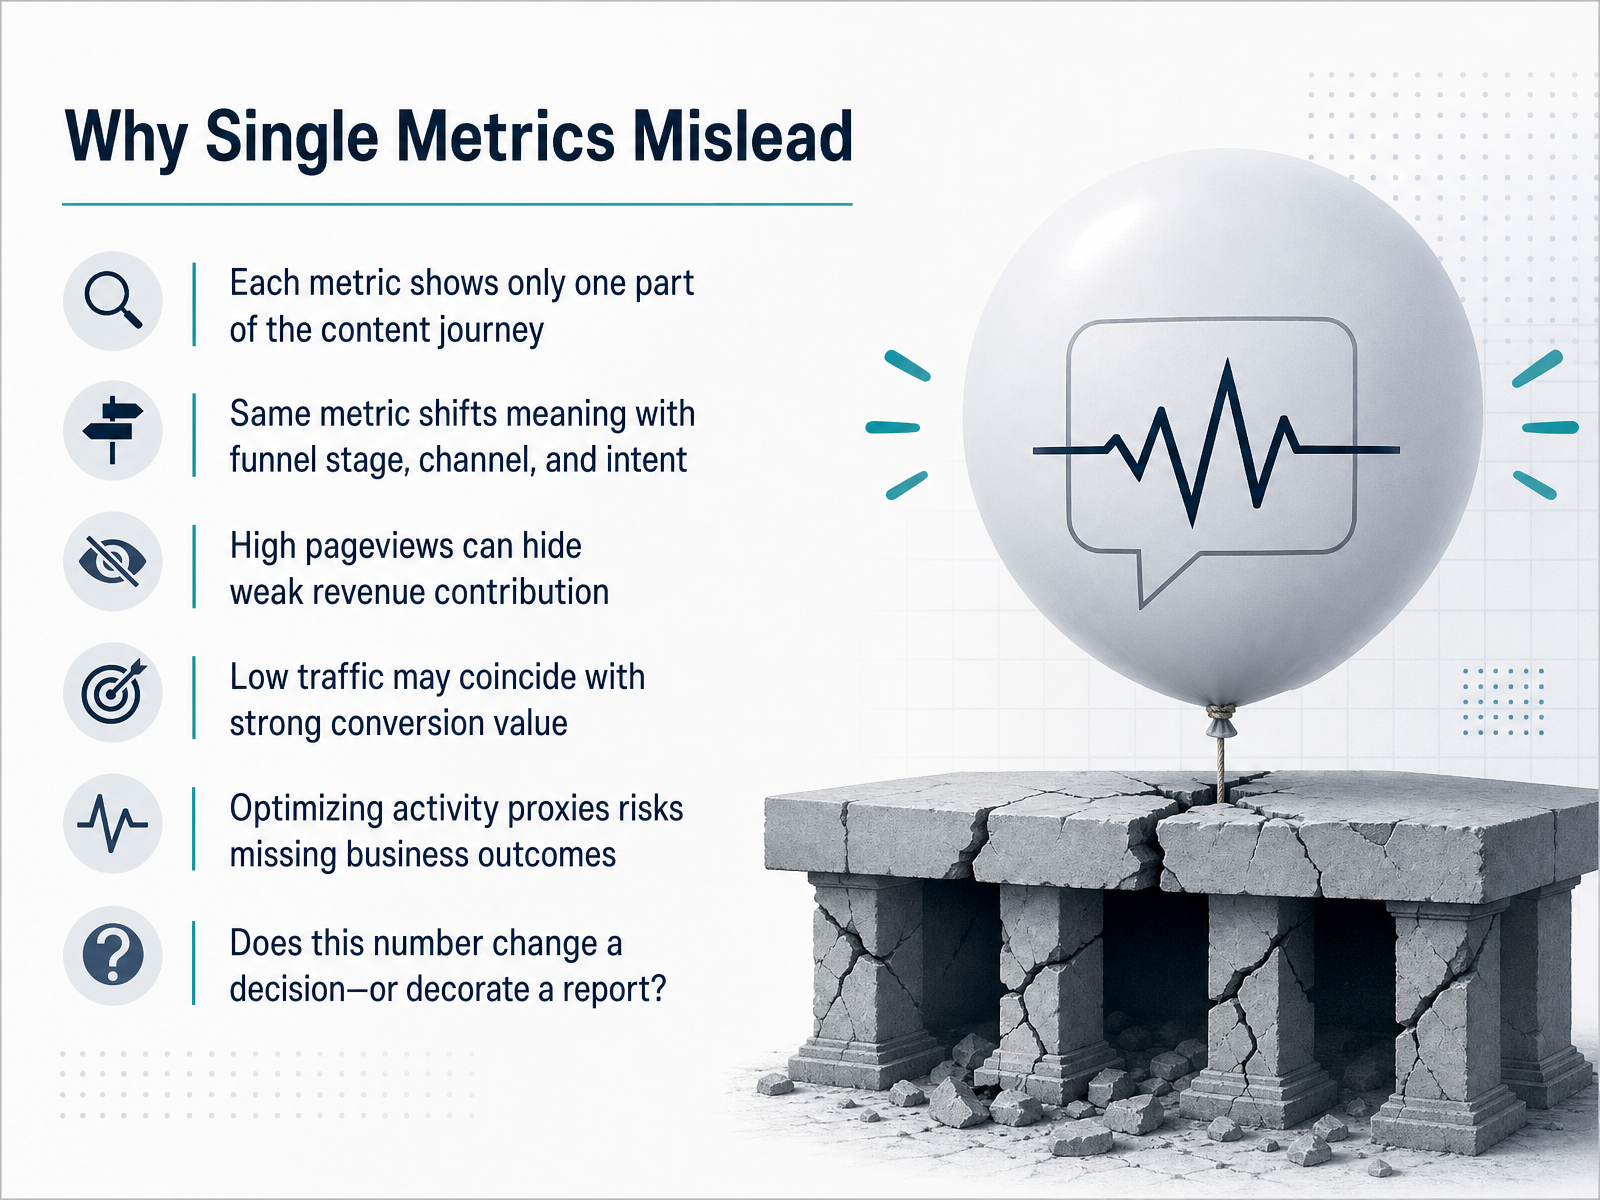
- 02Why Single Metrics MisleadLet’s start with a hard truth: no single number tells the full story. Each metric you track is just one frame in a long, messy journey. Pageviews show reach, but not whether that reach moved anyone. A blog post can pull in fifty thousand visits and still contribute nothing to revenue. Meanwhile, a low-traffic guide might be the thing that tips a serious buyer toward a demo. The same metric even changes meaning depending on the funnel stage. A high bounce rate on a how-to article? Probably fine. On a pricing page? A red flag. So when you see one number spike or dip, resist the urge to declare victory or panic. Instead, ask the better question: does this number change a decision, or is it just decorating a report? Traffic is a clue, not a verdict. What matters is whether the content influenced outcomes, and that takes more than a single data point. This is where we’re headed next — the measurement landscape of 2026.
 cometly.comcometly.comtendocom.com+21 min
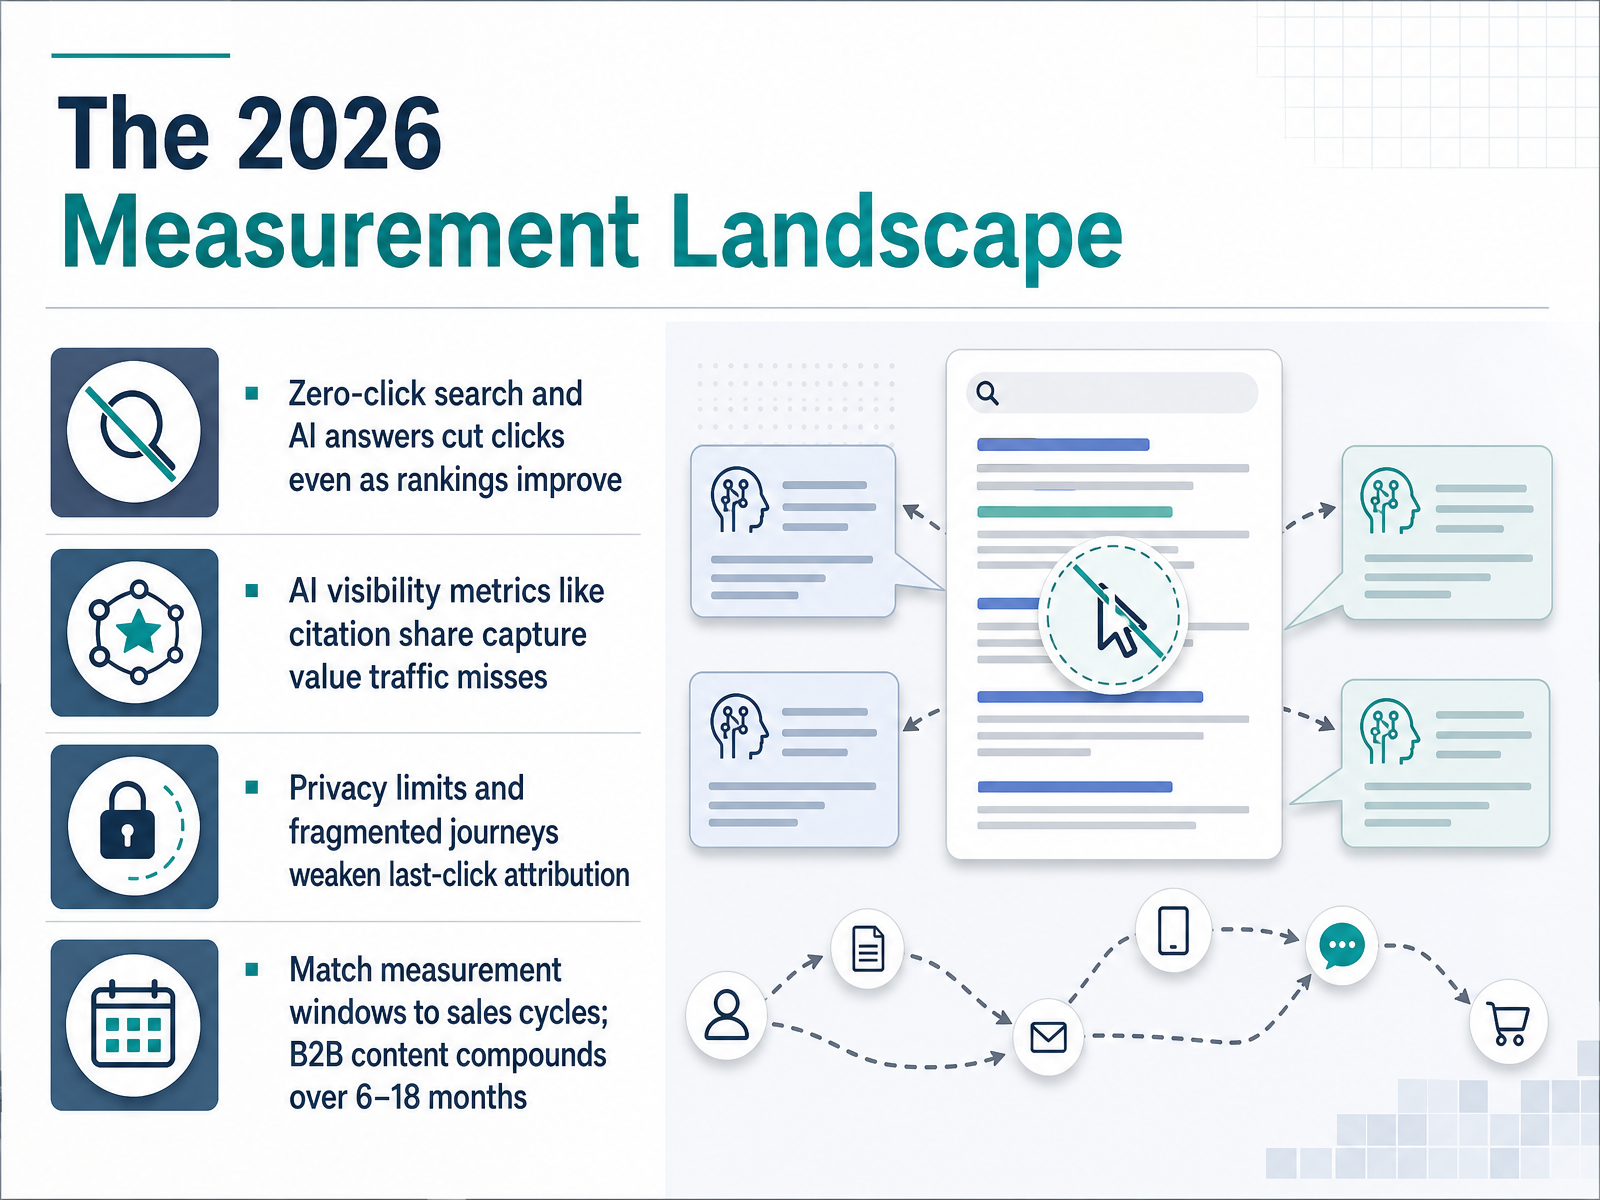
 - 03The 2026 Measurement LandscapeLet's zero in on the 2026 measurement landscape, because the rules have genuinely shifted. Consider this: zero-click searches and AI-generated answers can cut clicks even as your rankings improve. A page can hold the top spot and still see traffic fall. That's not a content failure. It's a change in how people consume answers. So instead of leaning only on clicks, track AI visibility metrics like citation share. That captures value your traffic reports simply miss. Also, privacy limits and fragmented journeys have severely weakened last-click attribution. Buyers switch devices, clear cookies, and research in places you can't track. That makes single-touch models misleading at best. The key is to match your measurement window to your sales cycle. For B2B, content compounds over six to eighteen months. A post published in March might drive its first attributable deal in September. If you measure on a thirty-day window, you'll kill it before the revenue arrives. One number is never the whole story. Context is everything.
 cometly.comcometly.comtendocom.com+22 min
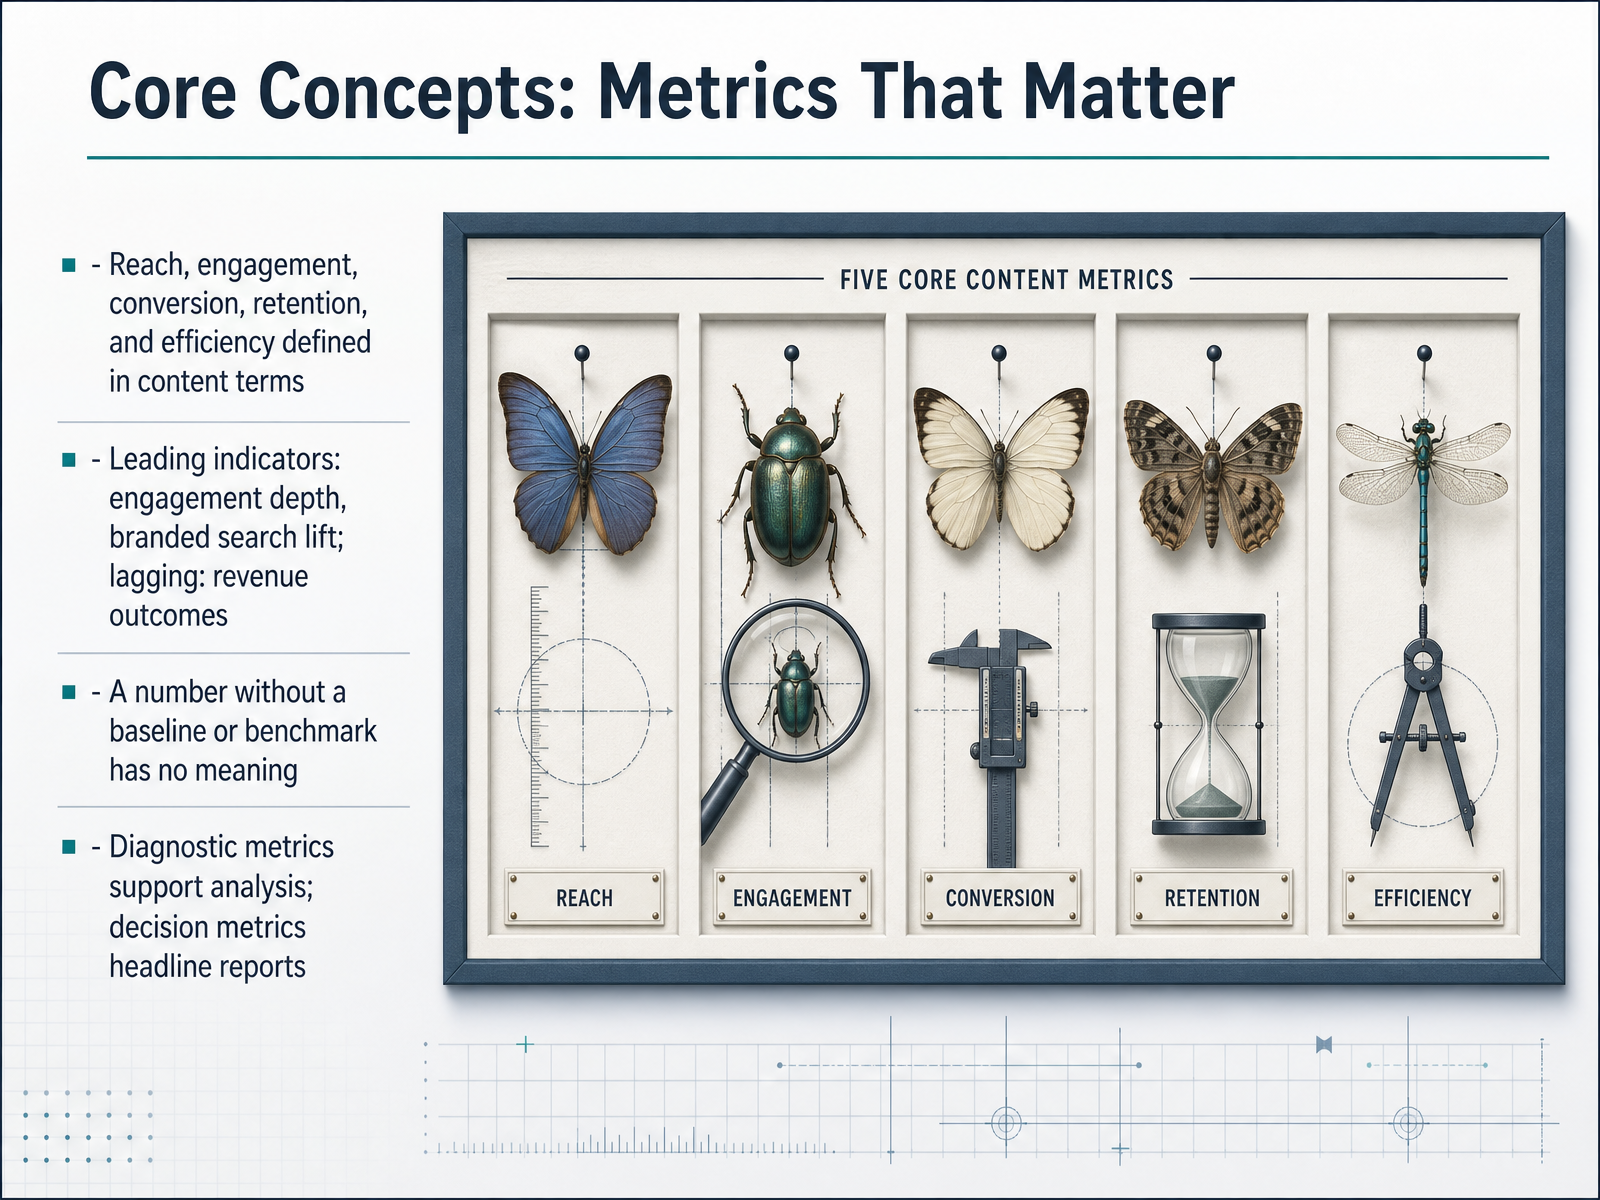
 - 04Core Concepts: Metrics That MatterNow let's define the metrics that actually matter, and start by separating them into two clear buckets: leading indicators and lagging ones. Leading indicators, like engagement depth or a lift in branded search, tell you early whether your content is building momentum. Lagging indicators, like revenue outcomes, confirm that momentum turned into business results. You need both. A number without a baseline or benchmark is meaningless on its own. Forty thousand page views sounds impressive until you know it dropped from sixty thousand the month before. So always anchor every metric against a reference point. There's also a practical distinction between diagnostic and decision metrics. Diagnostic metrics, like time on page or bounce rate, help you understand why something happened. Decision metrics, like content-influenced pipeline, are what you put at the top of your report. They guide the big calls. The trap is treating a leading signal as if it were a lagging result, or making a decision off a single number. One pageview spike is not a strategy. One drop in engagement is not a failure. Read the pattern, not the point. Next, we'll walk through a practical framework to turn these metrics into a structured measurement plan.
 cometly.comcometly.comtendocom.com+22 min
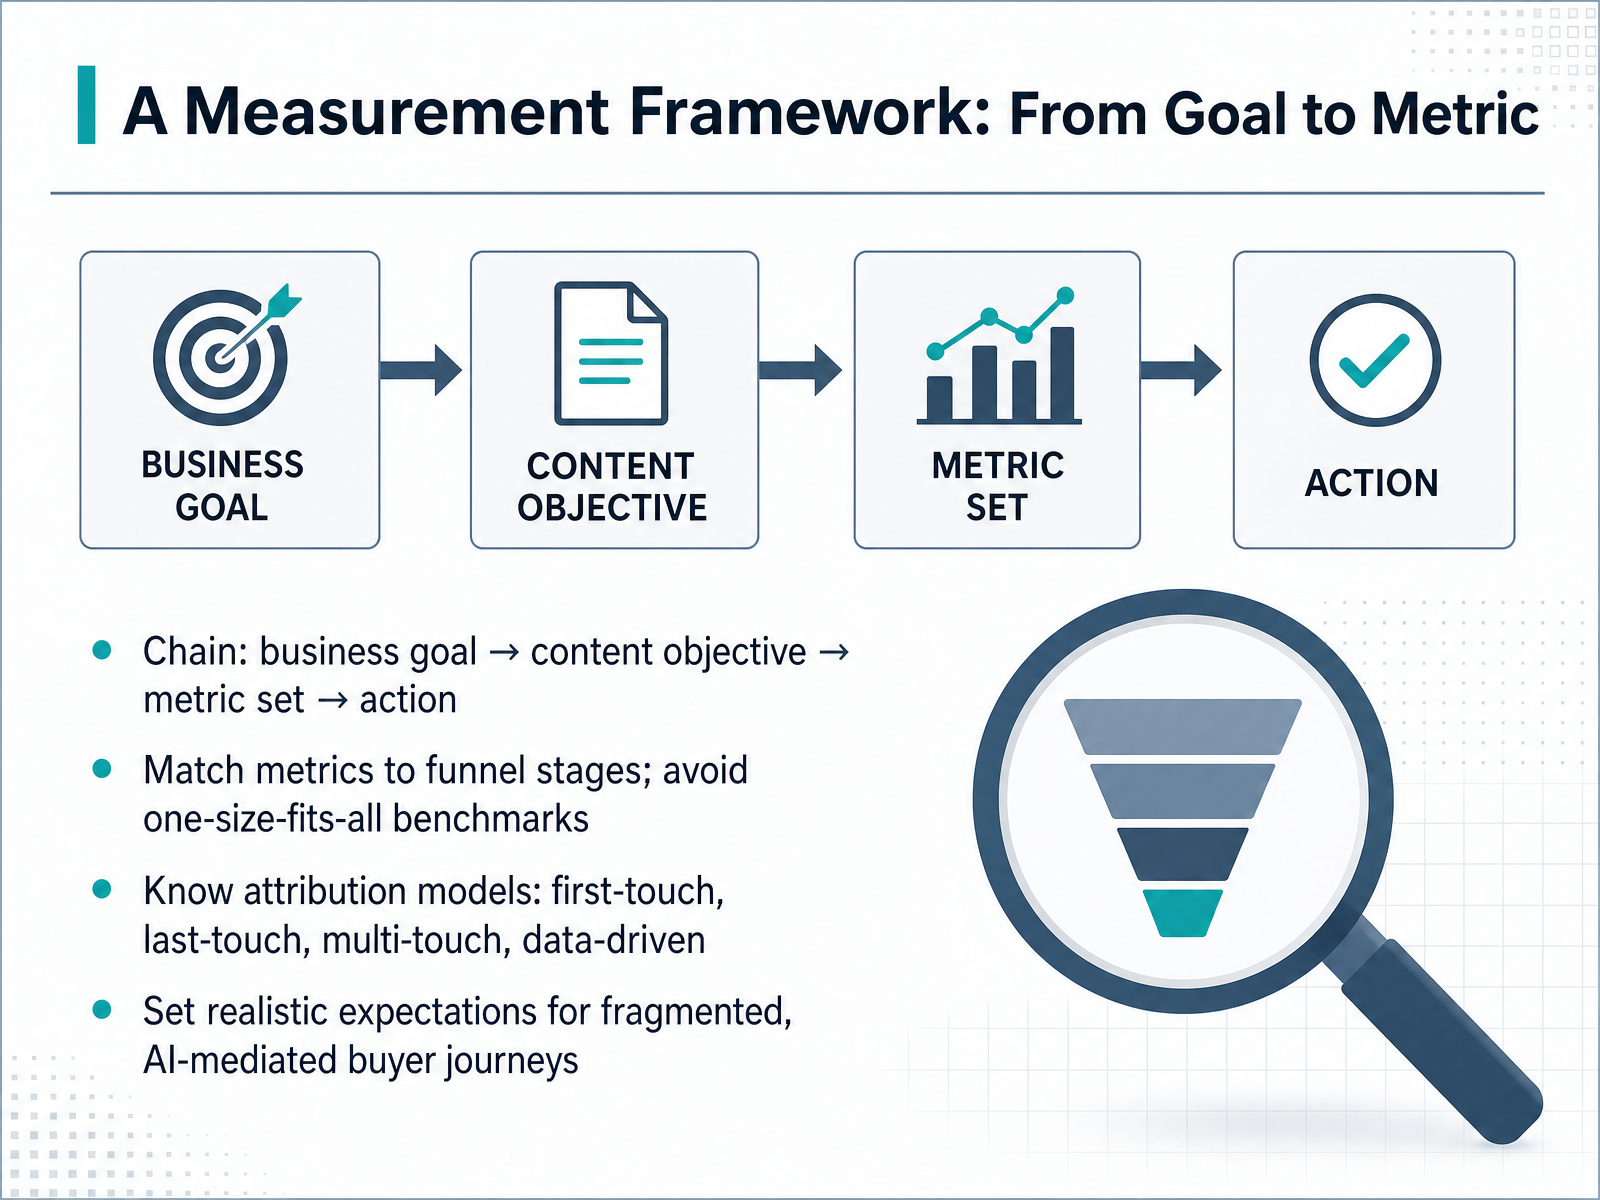
 - 05A Measurement Framework: From Goal to MetricLet’s turn this into a practical framework. It starts with a simple chain: your business goal, then your content objective, then the metric set that supports it, and finally the action you’ll take. Each link depends on the one before it. Now, the critical part: match your metrics to the funnel stage. Don’t benchmark a top-of-funnel awareness article against a bottom-of-funnel case study. They do different jobs, so they need different measures. Next, know your attribution models. First-touch shows what creates demand. Last-touch shows what closes it. But for most B2B journeys, that middle ground matters most, so multi-touch or data-driven models give a fairer picture. And be realistic about today’s buyer journey. It’s fragmented, nonlinear, and increasingly mediated by AI answers and private channels. No single data point will capture all of it. So set expectations accordingly. The goal is to make informed decisions, not to find a perfect number. From here, let’s look at how to work with imperfect signals in attribution.
 cometly.comcometly.comtendocom.com+21 min
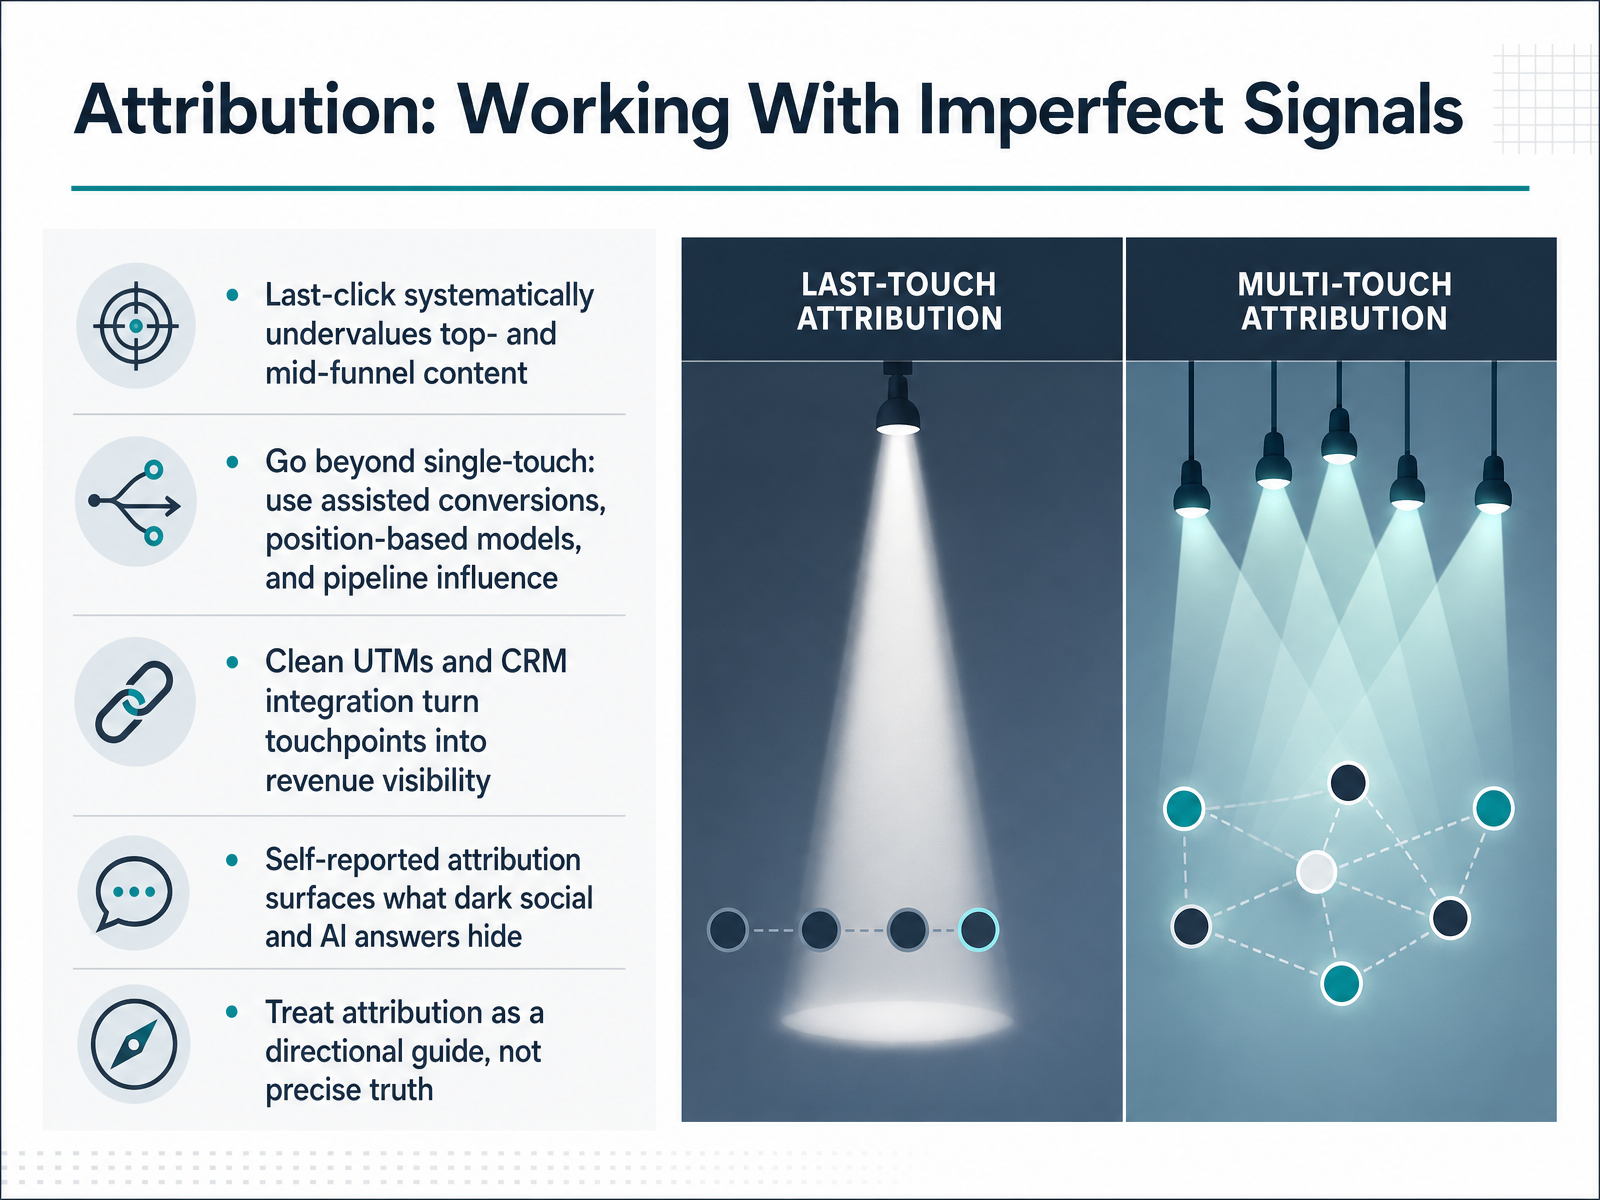
 - 06Attribution: Working With Imperfect SignalsAttribution is where good measurement goes to get complicated. We all know the last-click model is flawed — it gives all the credit to the final touchpoint and ignores the blog posts, guides, and webinars that built the buyer's trust weeks earlier. That's why we need to look beyond single-touch models. Assisted conversions, position-based models, and pipeline influence give credit where it's actually due. The foundation matters too. Clean UTM parameters and a well-integrated CRM turn scattered touchpoints into something you can trace to revenue. And when tracking tools go blind — like on dark social or AI answers — self-reported attribution can fill in the gaps. Ask buyers how they heard about you; you'll be surprised what surfaces. But remember, attribution is a directional guide, not precise truth. Use it to inform your judgment, not to replace it. So as we move forward, let's talk about interpreting these metrics in context.
 cometly.comcometly.comtendocom.com+21 min
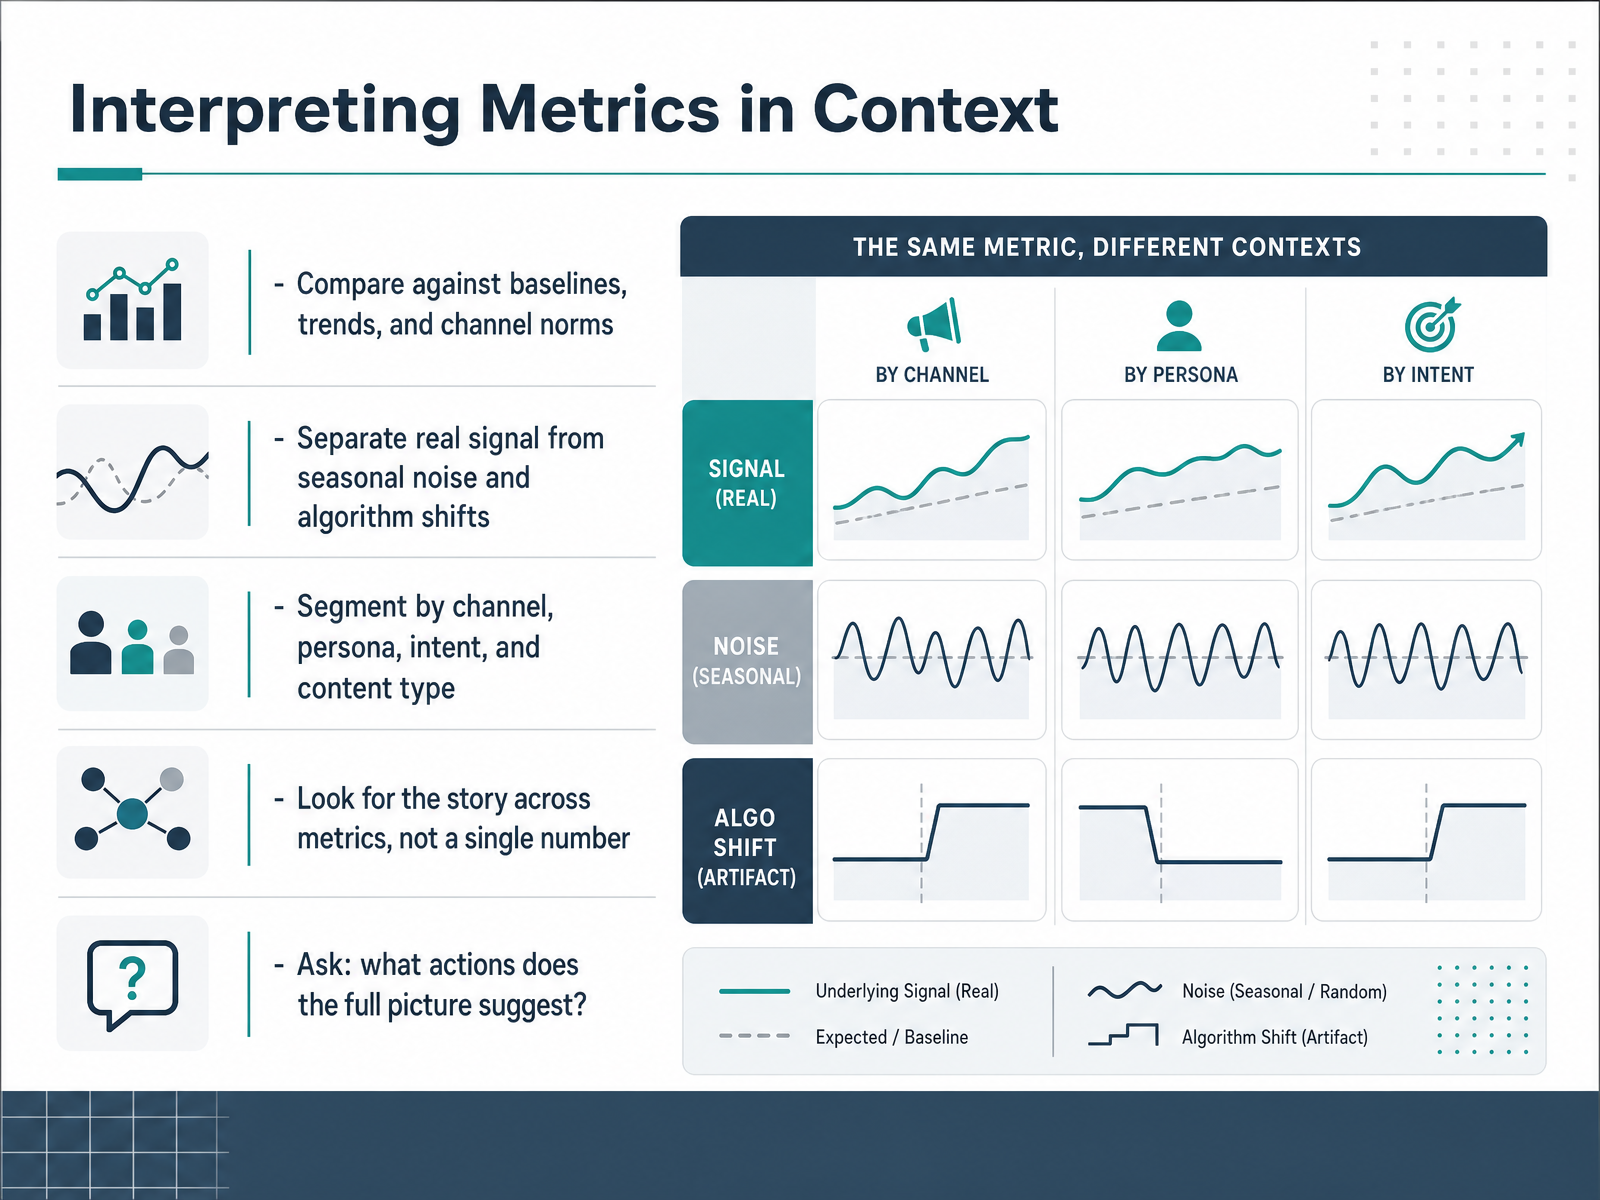
 - 07Interpreting Metrics in ContextLet's talk about how to read these numbers properly. A single metric, on its own, is rarely a verdict. It is a clue. So, first, compare against a baseline. A hundred thousand page views sounds great, until you see traffic is down from last quarter. And check the trend, not just the latest spike. Second, separate real signal from noise. Seasonal dips, an algorithm update, a viral post from a competitor. These can all distort the picture. Ask yourself what the normal pattern looks like. Third, segment your data. Don't mix organic with paid. Don't blend a top-of-funnel blog post with a bottom-of-funnel case study. They answer different questions. Look at performance by channel, by persona, and by content type. Finally, look for the story across several metrics. If page views are up, but engagement time is down, that's one story. If engagement is deep, but conversions are flat, that's another. The full picture will suggest the action. So ask, what is this data telling me to do next? That's the real question. Up next, we'll look at some common pitfalls in content measurement.
 cometly.comcometly.comtendocom.com+21 min
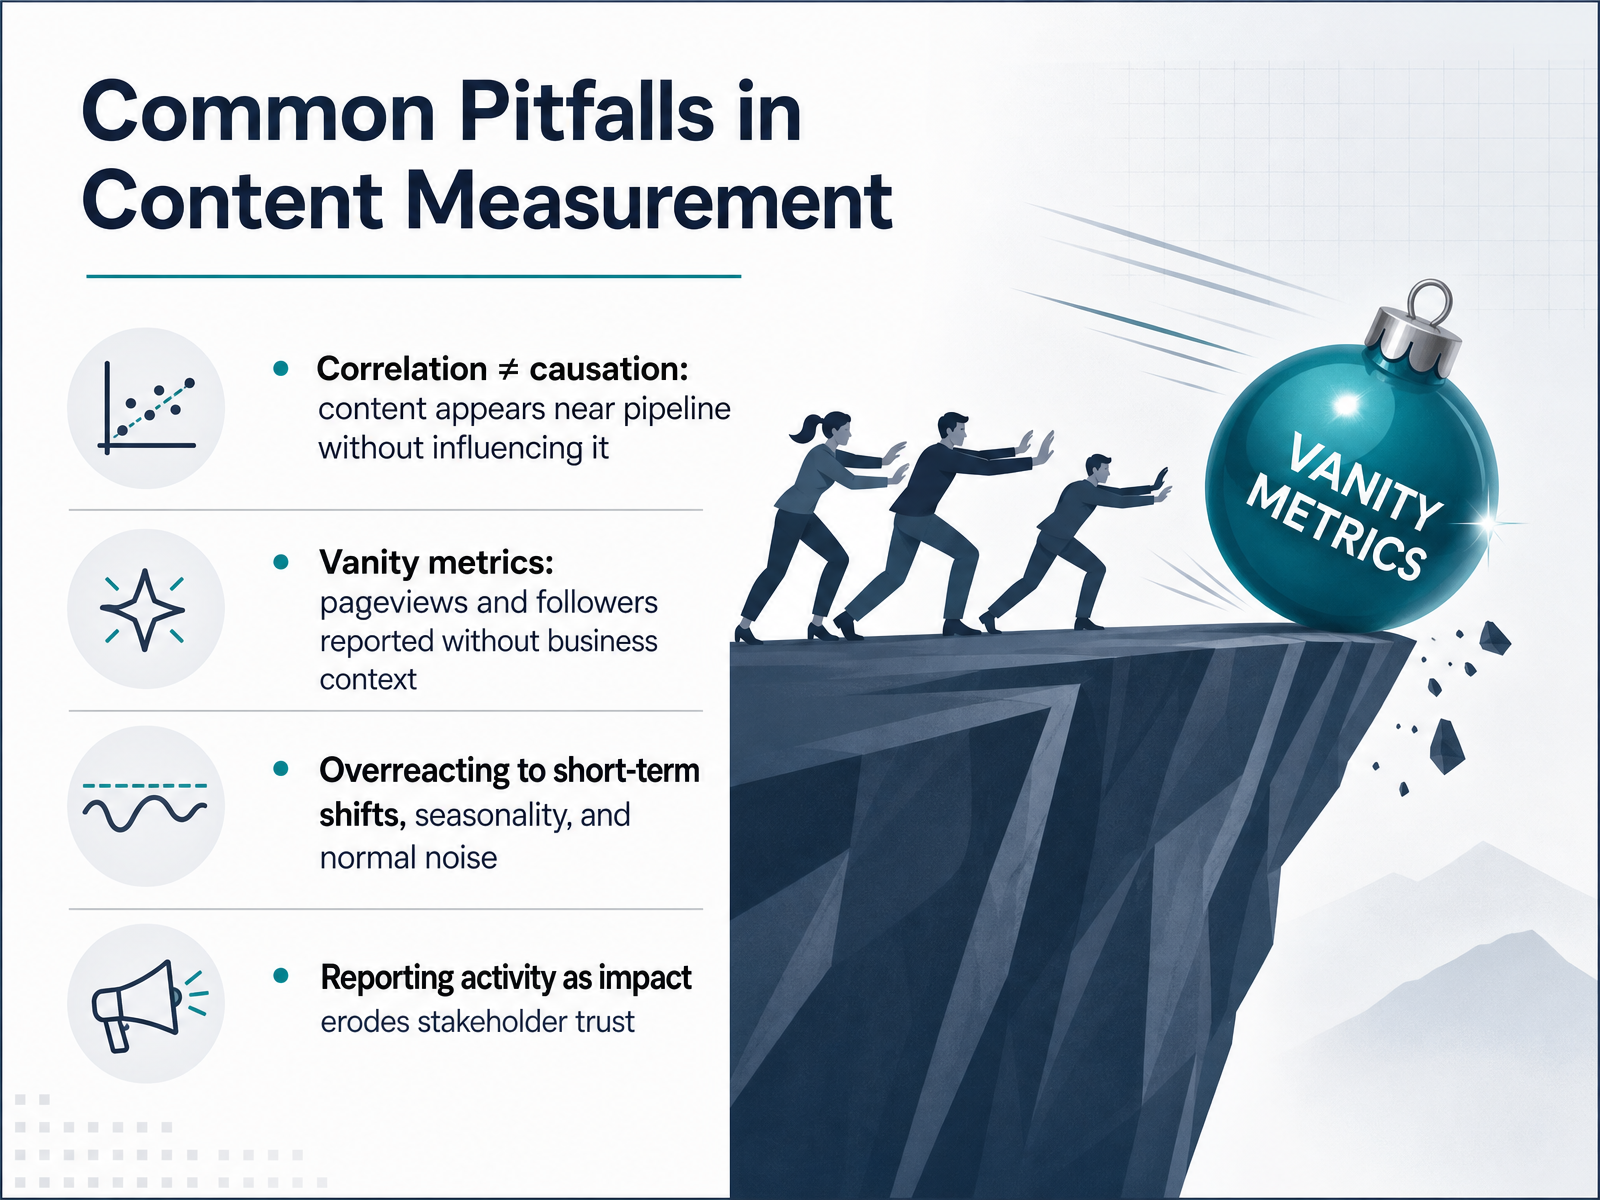
 - 08Common Pitfalls in Content MeasurementLet’s talk about the common pitfalls in content measurement, because these are the traps that quietly undermine even the most sophisticated dashboards. First: correlation is not causation. A piece of content might appear near a closed deal, but that doesn’t mean it influenced the outcome. It could just be standing next to the pipeline at a party. Be honest about proximity versus influence. Second: vanity metrics. Pageviews and follower counts feel good, but without business context, they create a false sense of performance. A post with fifty thousand views and zero pipeline is entertainment, not an asset. Third: overreacting to short-term shifts. Seasonality, holidays, and normal noise will make numbers wiggle. Don’t rewrite your strategy because one week dipped. Look at trends over the sales cycle, not the news cycle. And finally, reporting activity as impact. When you present output instead of outcomes, stakeholder trust erodes quickly. The CFO starts seeing marketing as a cost center, and every budget conversation becomes a fight. The takeaway is simple: context is everything. Pair every metric with a benchmark, a comparison period, and a decision it informs. Let’s shift now to how you choose the right metrics for your stage of maturity.
 cometly.comcometly.comtendocom.com+22 min
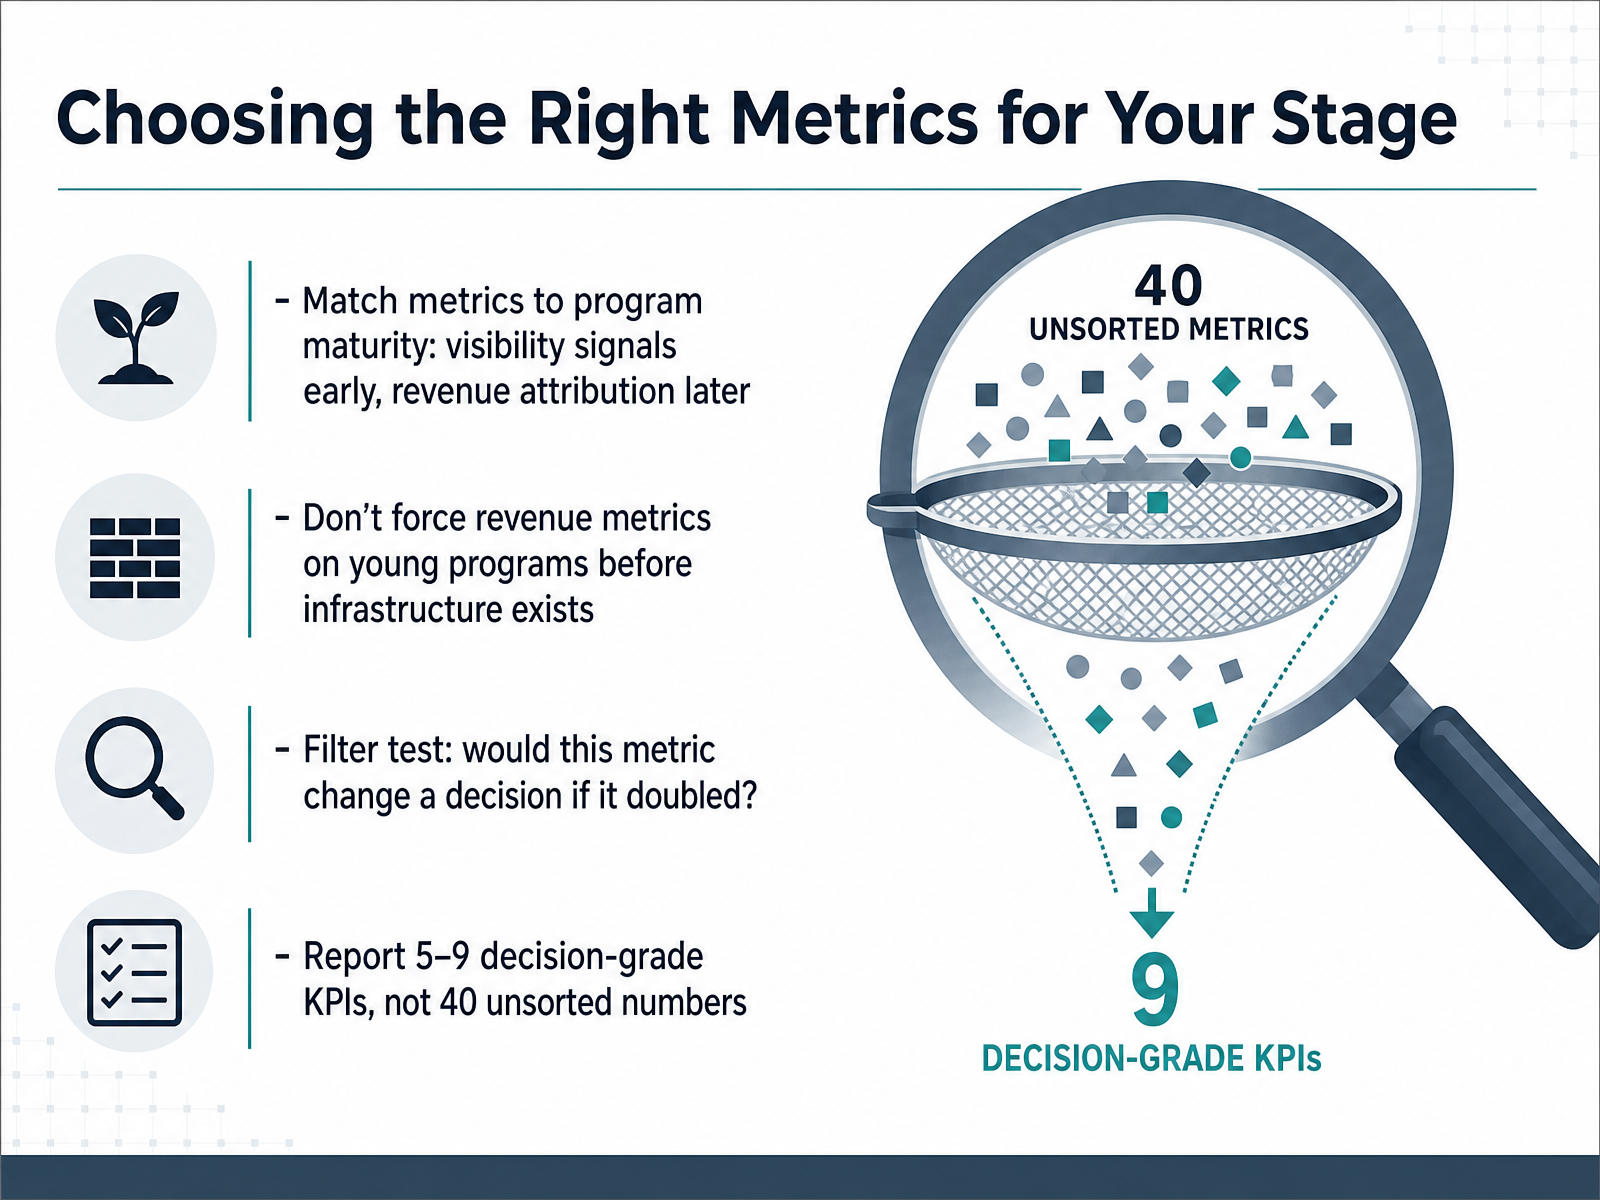
 - 09Choosing the Right Metrics for Your StageNow let's talk about choosing the right metrics for your stage. This is where many measurement strategies go off track. A program that's three months old should focus on visibility signals, like organic traffic and engagement. An eighteen-month program should be reporting on revenue contribution. Don't force revenue metrics on a young program before the infrastructure exists. Without proper CRM tagging and attribution windows, those numbers simply aren't reliable. Here's a useful filter. If a metric doubled tomorrow, would it change a decision you make? For example, if pageviews doubled but your pipeline stayed flat, would you alter your strategy? If the answer is no, you're probably tracking vanity. That simple test helps you avoid drawing conclusions from a single number. Just because a blog post got ten thousand views doesn't mean it's your best asset. You need to weigh context, audience, and campaign goals. Aim to report between five and nine decision-grade KPIs. A forty-metric report is a zero-metric report, because nobody reads it. Pick the numbers that inform your next move. Leave the rest as supporting diagnostics. Next, let's look at how to frame those numbers through storytelling with data.
 cometly.comcometly.comtendocom.com+22 min
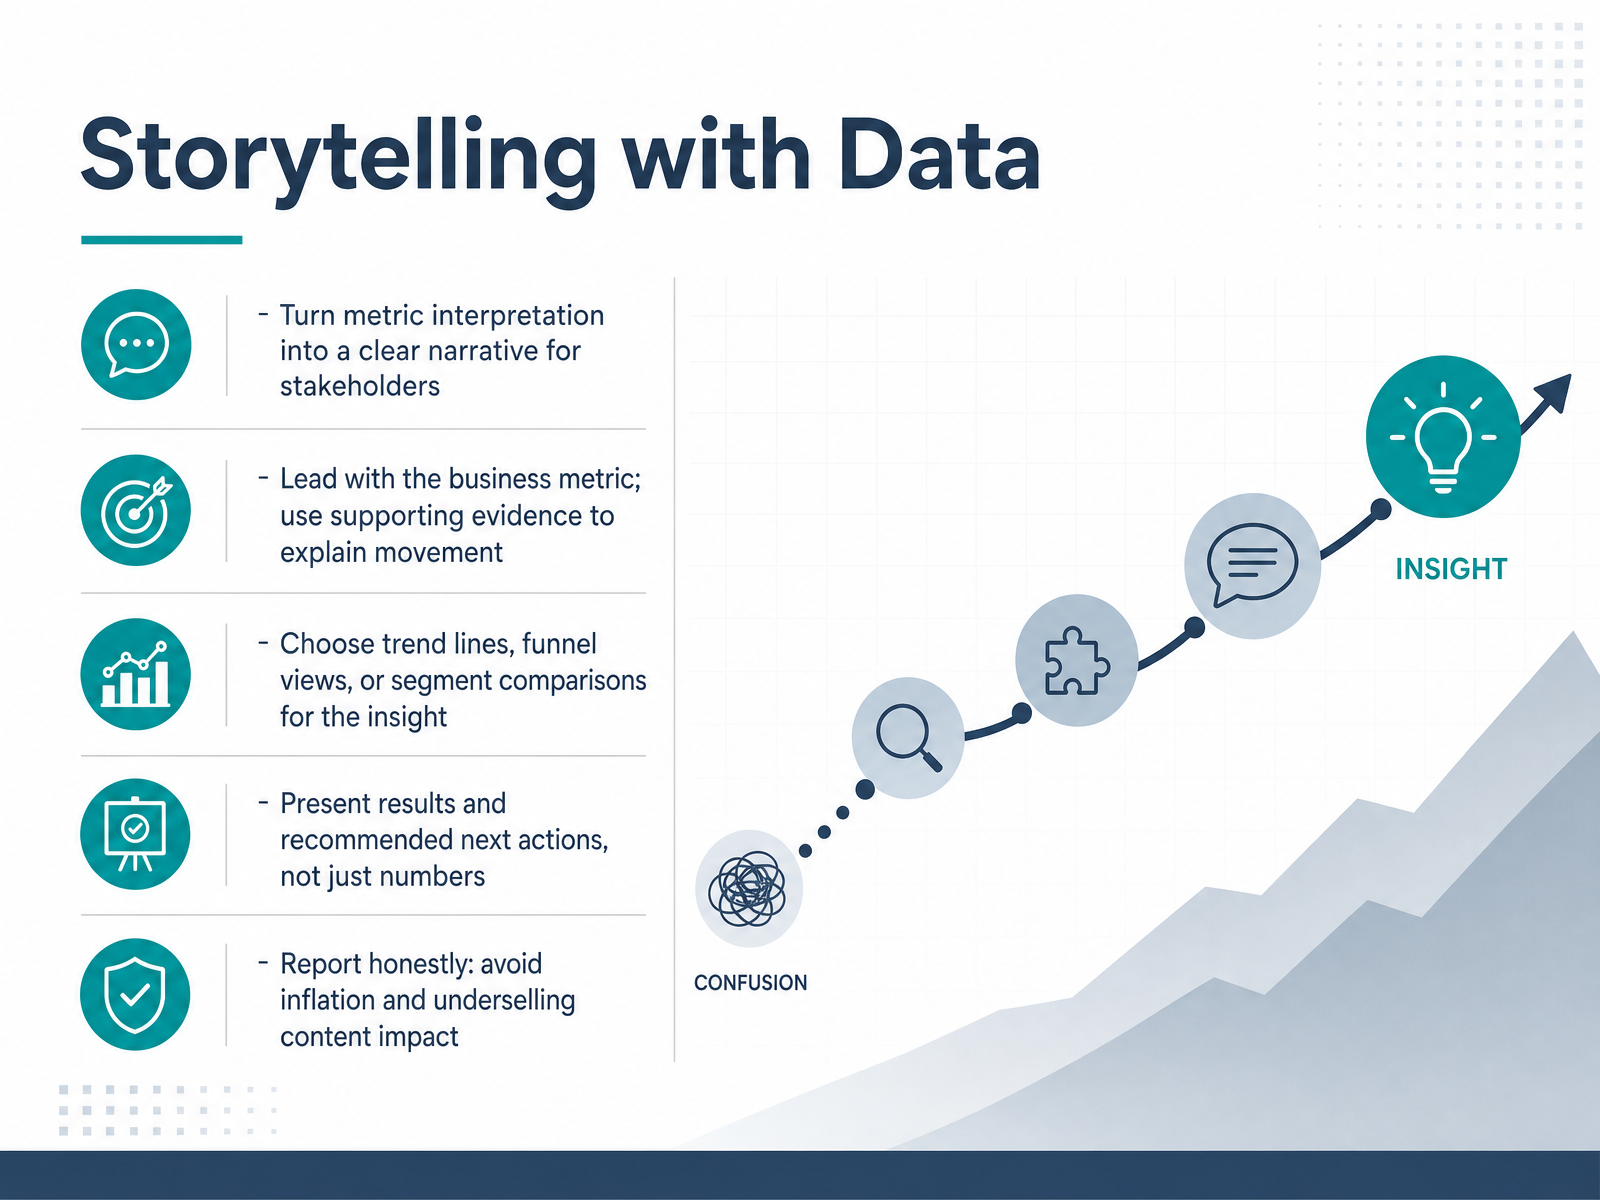
 - 10Storytelling with DataSo now we move from picking the right metrics to presenting them well. This is about storytelling with data. When you report to stakeholders, you are not handing over a spreadsheet. You are building a case for a decision. Lead with the business metric, the number that ties directly to pipeline or revenue. Then use supporting evidence to explain why it moved the way it did. Choose one clear view for the insight, whether that is a trend line, a funnel breakdown, or a comparison between segments. Present results alongside your recommended next actions. Do not just show what happened. Show what you plan to do about it. And report honestly. Resist the temptation to inflate a quiet quarter with a big vanity number, and do not undersell real impact out of caution. Both distortions break trust. The goal is a narrative that is credible, complete, and actionable. Next, let us look at a case where a single misleading metric almost derailed a winning content strategy.
 marketful.comtenspeed.iothestacc.com+21 min
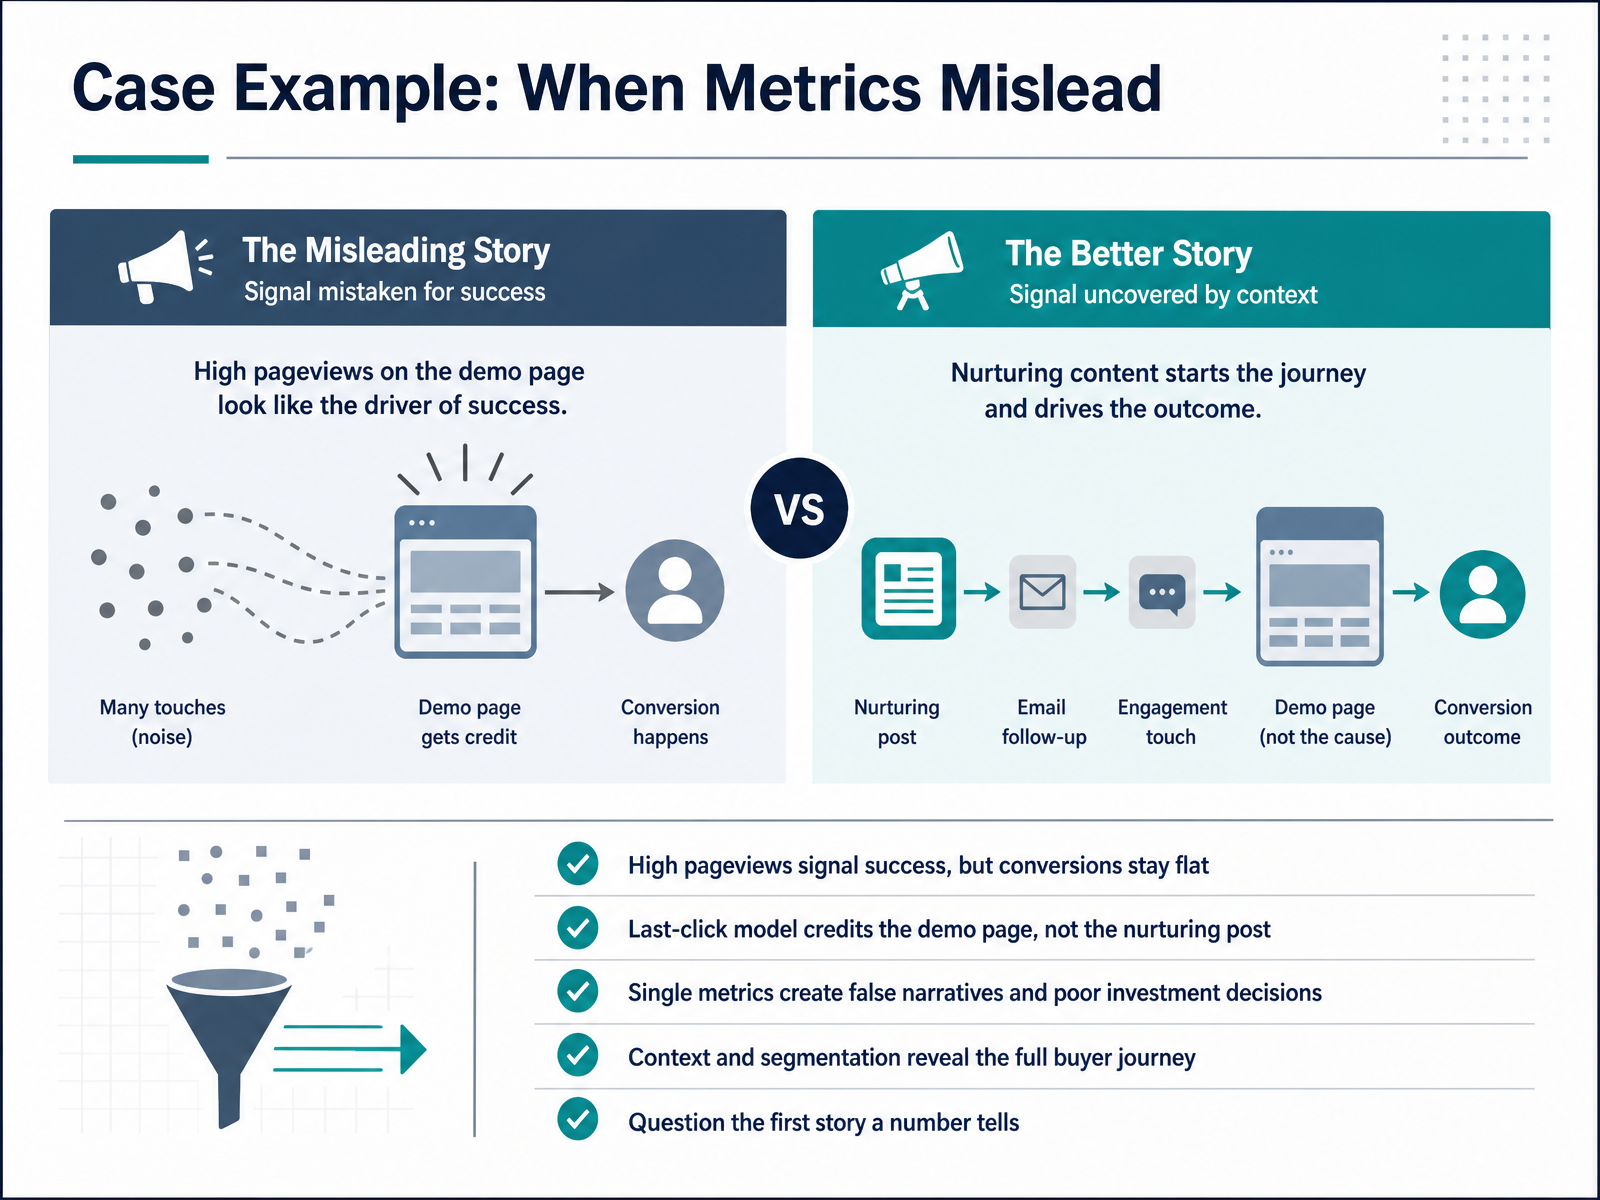
 - 11Case Example: When Metrics MisleadLet’s look at a real-world example where the numbers lied. A blog post gets thousands of pageviews. Everyone celebrates. But conversions stay flat. Why? The last-click model gives all the credit to the demo page, while the nurturing posts that built trust over months get zero credit. That’s not measurement. That’s erasure. A single metric, pageviews, created a false narrative. It led to poor investment decisions. The fix is context. Segmentation. Looking at the full buyer journey. First-touch, multi-touch, assisted conversions. When you zoom out, you see the real work happening in the middle. So, question the first story a number tells you. Ask what the metric is actually measuring. And remember, a number alone is just a headline. The context is the article. Next, let’s walk through how to correct this interpretation.
 cometly.comcometly.comtendocom.com+21 min
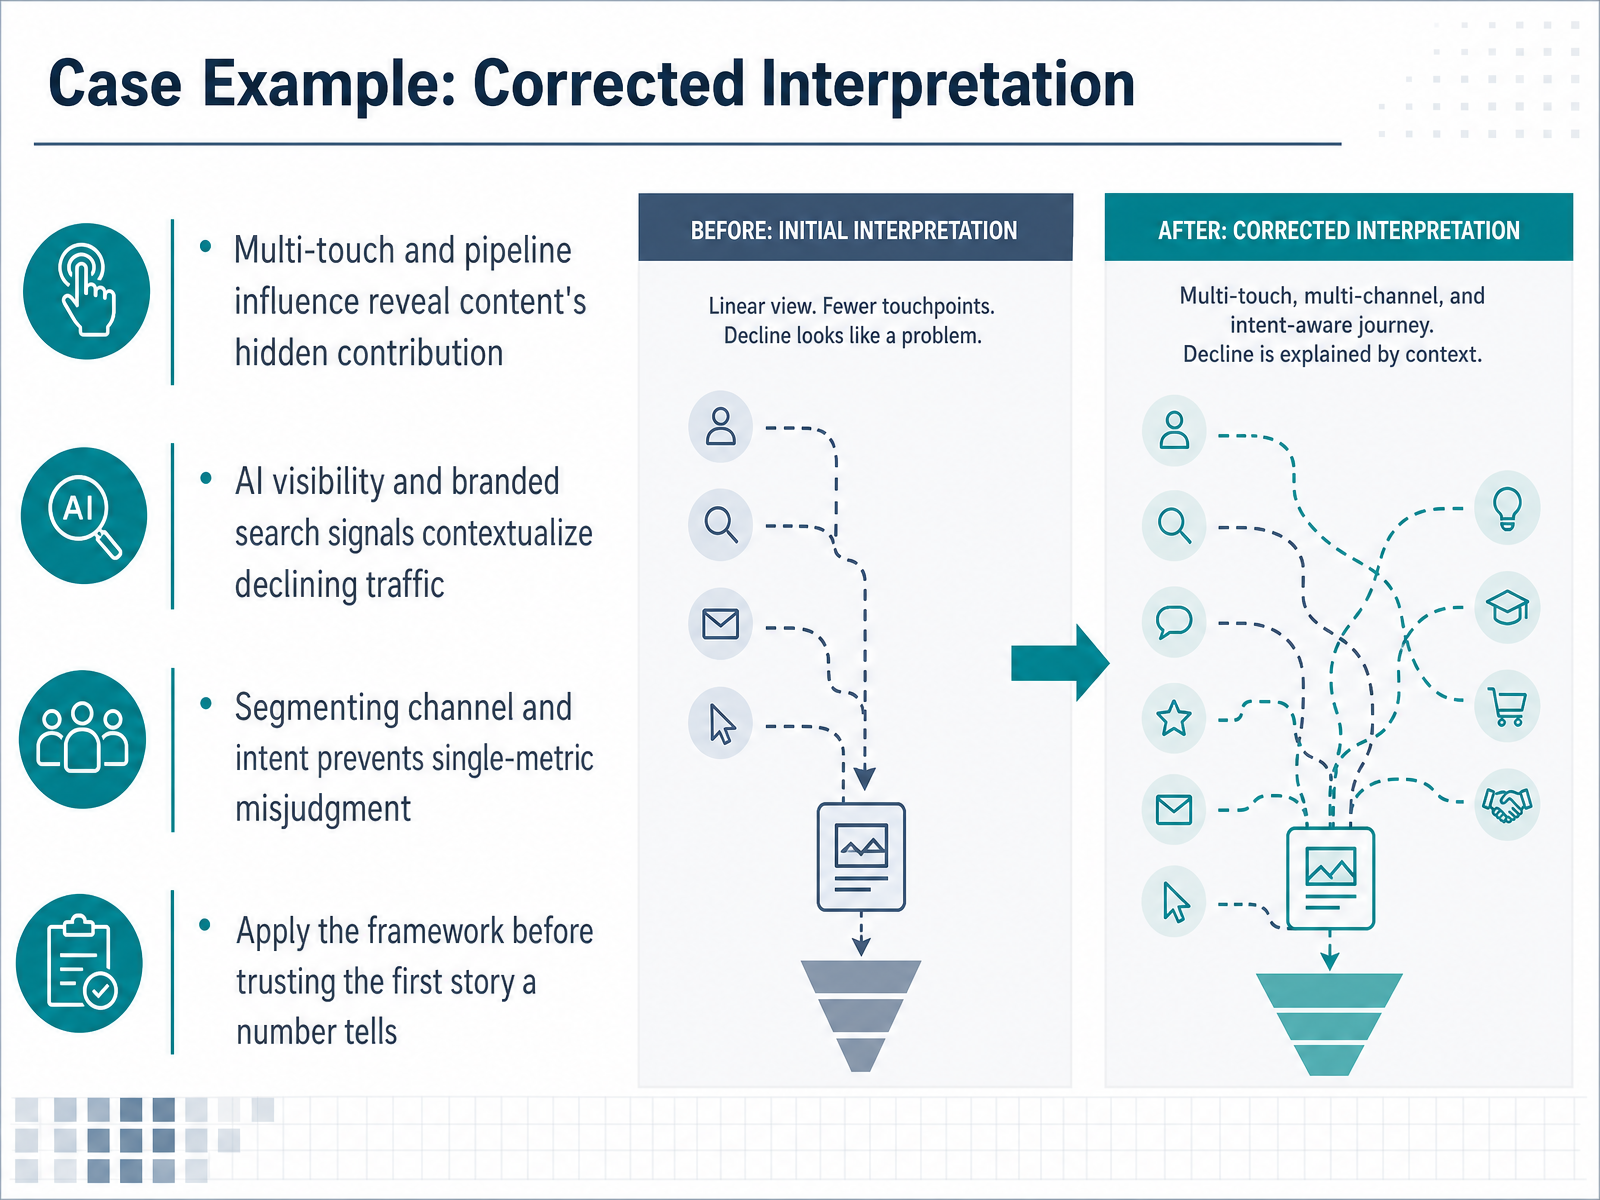
 - 12Case Example: Corrected InterpretationLet's bring this together with a real example. Imagine your blog traffic drops by twenty percent over three months, and you are in the meeting. Before you panic and cut the program, remember the framework. First, look at pipeline influence. You find that multi-touch attribution shows content is present in over half of all closed-won deals. That hidden contribution tells a very different story. Next, segment the channels. The decline is in generic informational queries, while branded search is climbing steadily. That is a signal of growing awareness, not failure. Finally, check the intent behind the numbers. The remaining traffic converts at twice the previous rate because it is reaching a more qualified audience. What looked like a disaster is actually a healthy shift in the market. The lesson is simple. Apply the framework before you trust the first story a single number tells. Now, let's look at practical strategies for ongoing measurement.
 cometly.comcometly.comtendocom.com+22 min
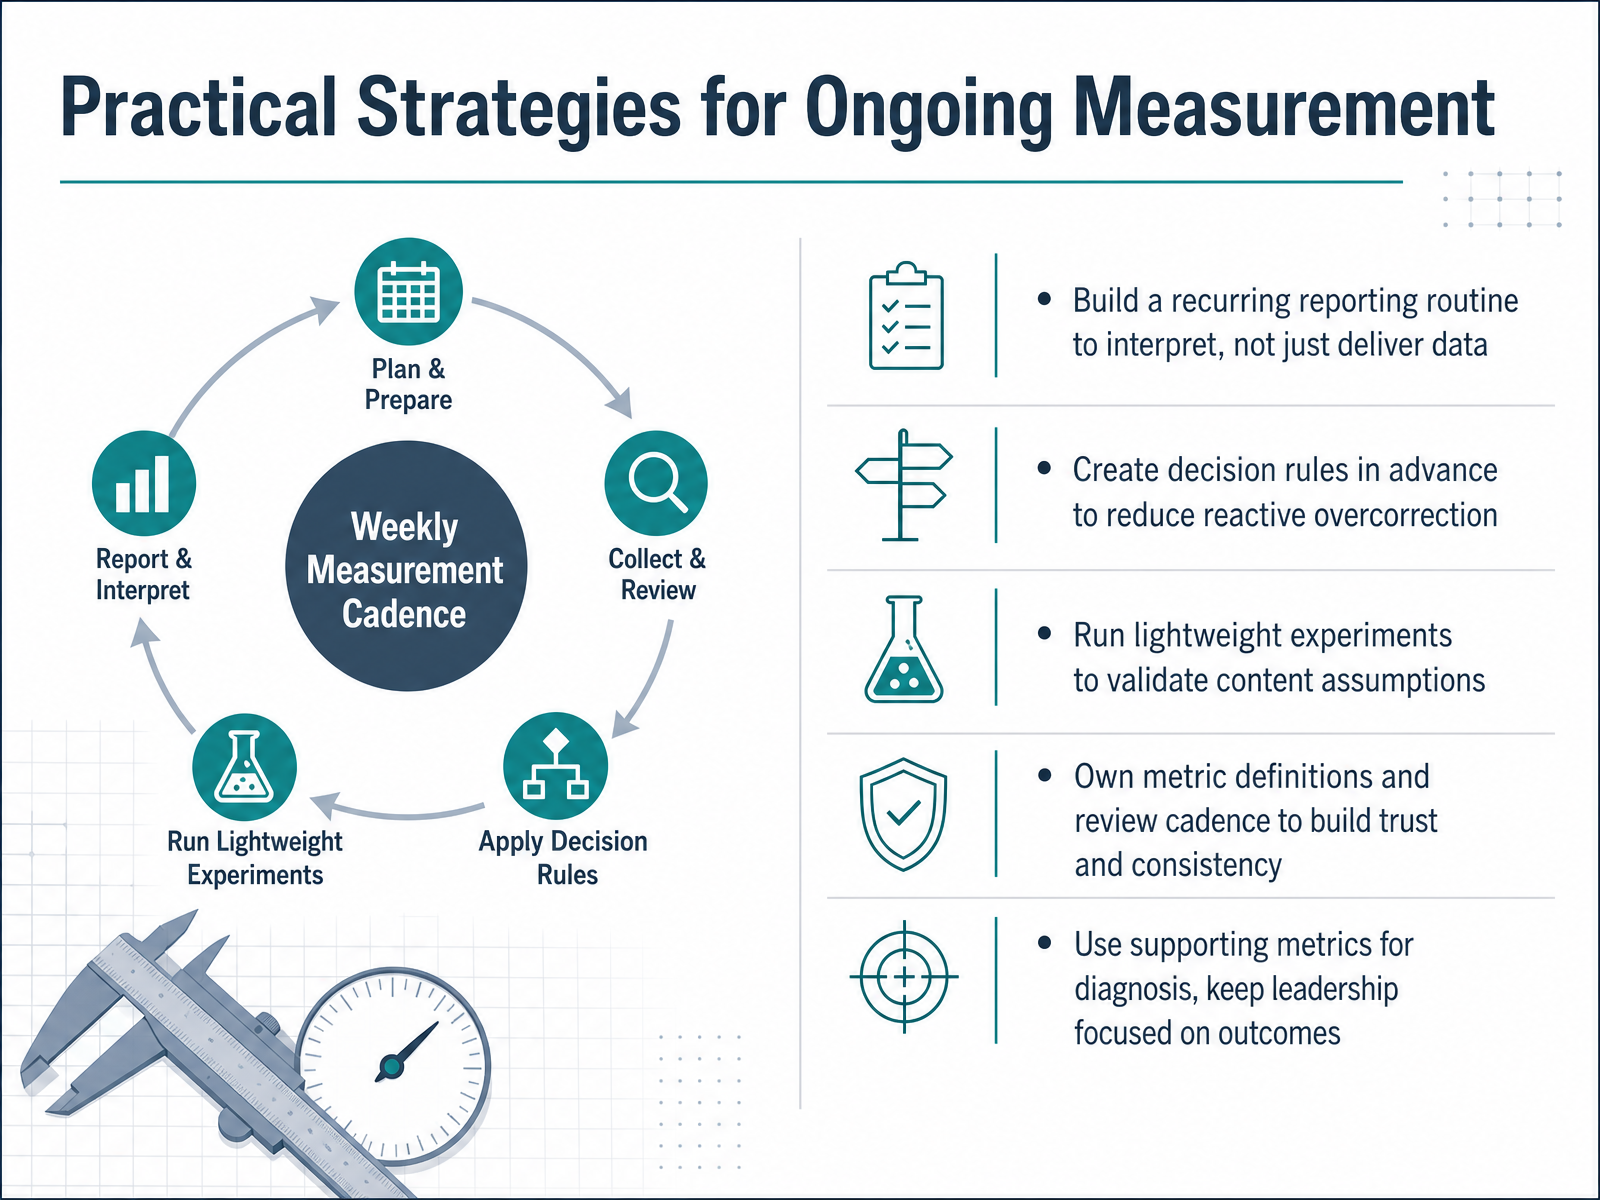
 - 13Practical Strategies for Ongoing MeasurementNow let’s turn these principles into working habits, because insights only matter when they show up on a regular rhythm. Build a recurring reporting routine where you interpret the data, not just deliver it. Pair that with decision rules made in advance, so a dip in one metric doesn't trigger a reactive overhaul. For example, if organic traffic dips but conversions hold steady, your rule might be to wait another cycle before touching anything. Next, run lightweight experiments to test your assumptions about what content works. You don't need a massive campaign, just a small A/B test to validate a hunch. Own your metric definitions and review cadence, because that consistency is what builds trust with your stakeholders. And finally, lean on supporting metrics for diagnosis, but keep leadership focused on outcomes like pipeline contribution. One number rarely tells the full story, but a steady routine ensures the story you tell is grounded in context. Up next, we’ll pull this all together into a practical action plan.
 cometly.comcometly.comtendocom.com+22 min
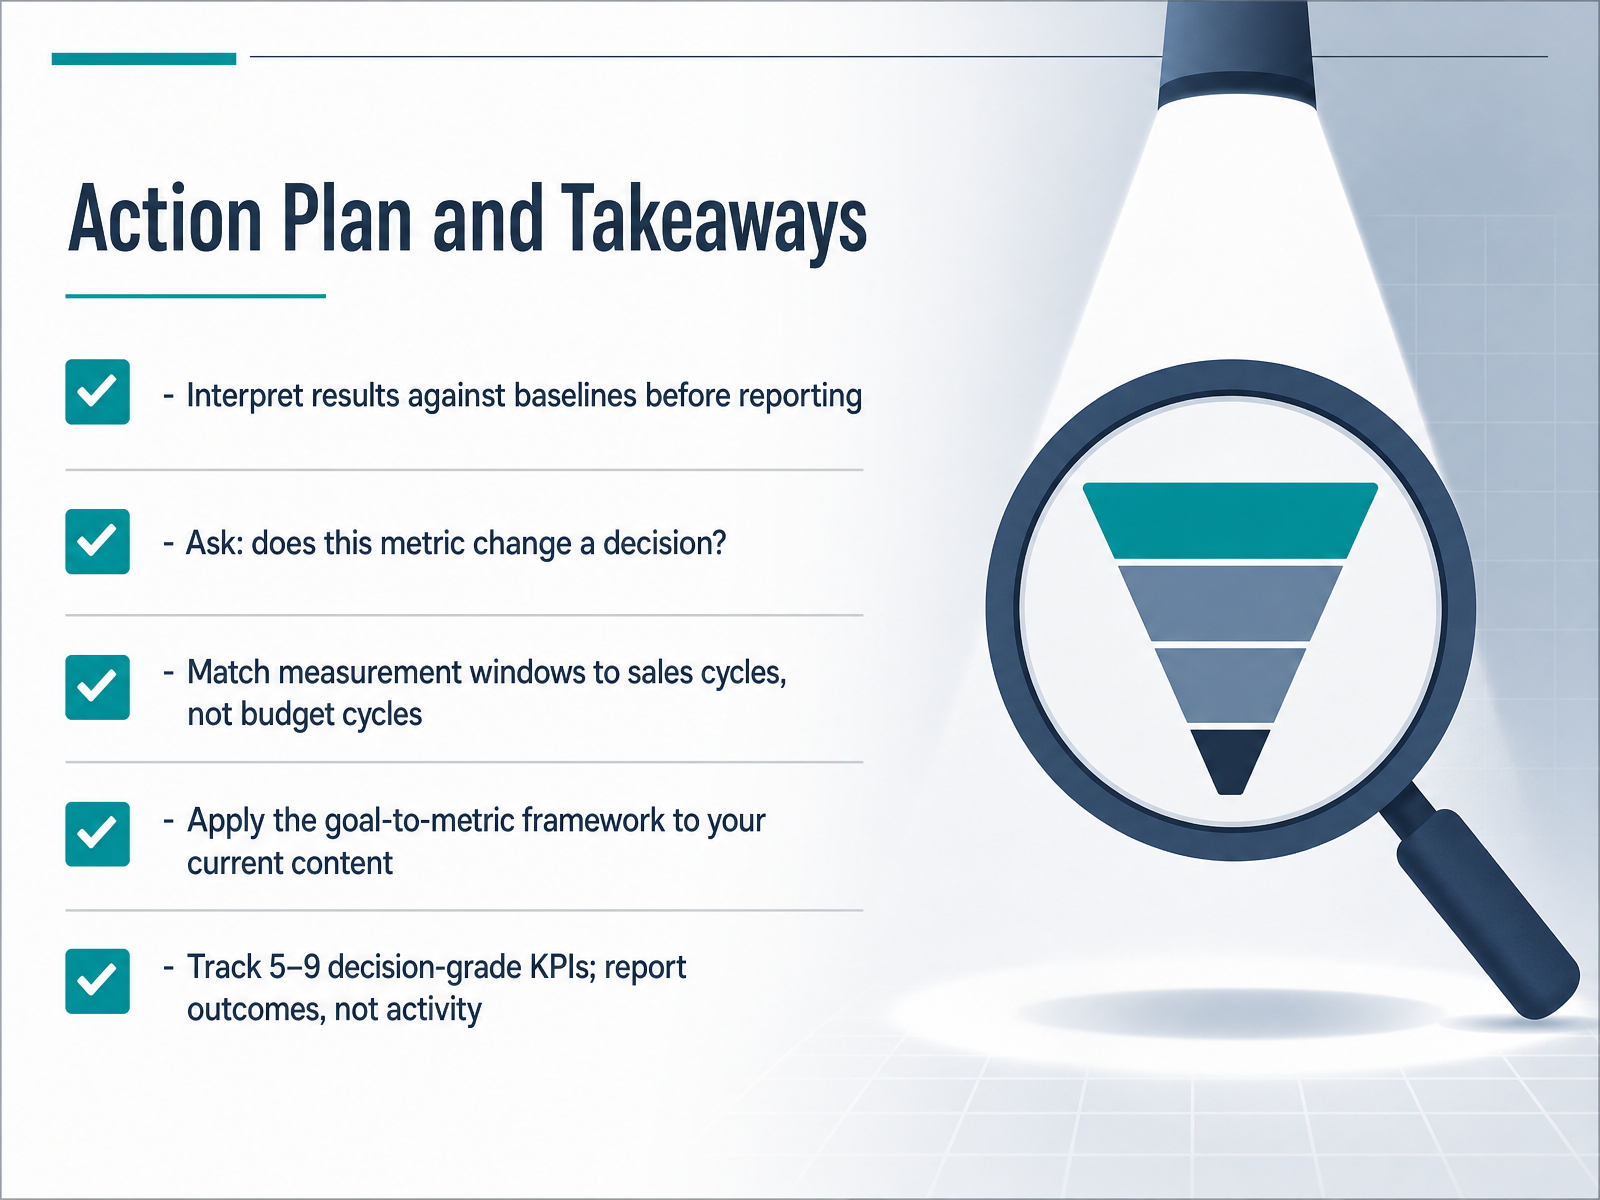
 - 14Action Plan and TakeawaysLet’s wrap this up into something you can actually use starting tomorrow. First, interpret every result against a baseline. A number alone is just a data point; it only becomes insight when you compare it to where you were before. Second, ask yourself the decision question. If this metric changed by thirty percent, would you do anything differently? If the answer is no, it’s a diagnostic, not a KPI. Third, match your measurement window to your sales cycle, not your budget cycle. If your deals take six months to close, a thirty-day report will always make your content look worse than it is. Fourth, apply the goal-to-metric framework to your own content library. Map each piece to a commercial outcome, not just a format. And finally, narrow your focus. Track five to nine decision-grade KPIs and report outcomes, not activity. Pageviews are a hobby; pipeline is a business. Thank you for your attention, and remember: the goal is not a perfect dashboard, it’s a smarter decision.
 cometly.comcometly.comtendocom.com+22 min
Take the deck with you
Download this course as a file — free, no sign-up needed.
- PDF handoutEvery slide page, ready to print or share.15 pages · 3.4 MBDownload
- Narrated PowerPointThe deck that presents itself — every slide carries the digital human's narration video.15 pages · 14.0 MBDownload
- PowerPoint slidesThe full deck as a .pptx — open it in PowerPoint, Keynote, or Google Slides.15 pages · 3.2 MBDownload
Free to use in your own training — please keep the PersonWise credit page at the end.
Have your own deck? Turn it into a course
Sources consulted
Web sources consulted while building this course.
- Content Marketing Attribution Methods: A Complete Guide — cometly.com
- Attribution For Content Marketing: Prove Your ROI! — cometly.com
- The Great Content Attribution Debate | Tendo Communications — tendocom.com
- Content Marketing ROI in a Zero-Click World (2026 Guide) — thestacc.com
- Content Marketing ROI 2026: Measurement Framework — digitalapplied.com
- Content Marketing Metrics: KPIs by Funnel Stage (2026 Guide) — marketful.com
- How to Measure Content Marketing Success in 2026 | Ten Speed — tenspeed.io
- Content Marketing KPIs: 21 to Track in 2026 (with Benchmarks) — thestacc.com
- How to Measure Content Marketing Success in 2026 | Contentia — contentia.co
- The New Rules of Measuring and Proving Content ROI — contentmarketinginstitute.com