Marketing Measurement Fundamentals
Begin
14 pages · ~28 min
Marketing Measurement Fundamentals
Learn the core principles of marketing measurement, including key metrics and frameworks, to analyze campaign performance and drive data-driven decisions.
What you’ll learn
- 01Marketing Measurement FundamentalsWelcome. This course is called Marketing Measurement Fundamentals. If you have ever stared at a dashboard and wondered which number actually tells you whether your marketing worked, you are in the right place. We are going to shift away from gut-feel decisions and move toward evidence-based choices as your data capabilities mature. By the end, you will be able to choose explainable metrics for any marketing goal and clearly separate metrics, observations, and conclusions. Think of it as moving past that common frustration where teams are stuck between just tracking pageviews and having dashboards nobody trusts. Our path forward builds in a logical sequence. We will start by setting clear goals, then progress to selecting the right metrics, forming practical observations, and arriving at defensible conclusions. Every step will prioritize explainability. Let's begin by grounding ourselves in the first link of the chain. Coming up next, we will dive into the Metric–Observation–Conclusion Chain.sitetracking.ioiabseaindia.combcg.com+22 min
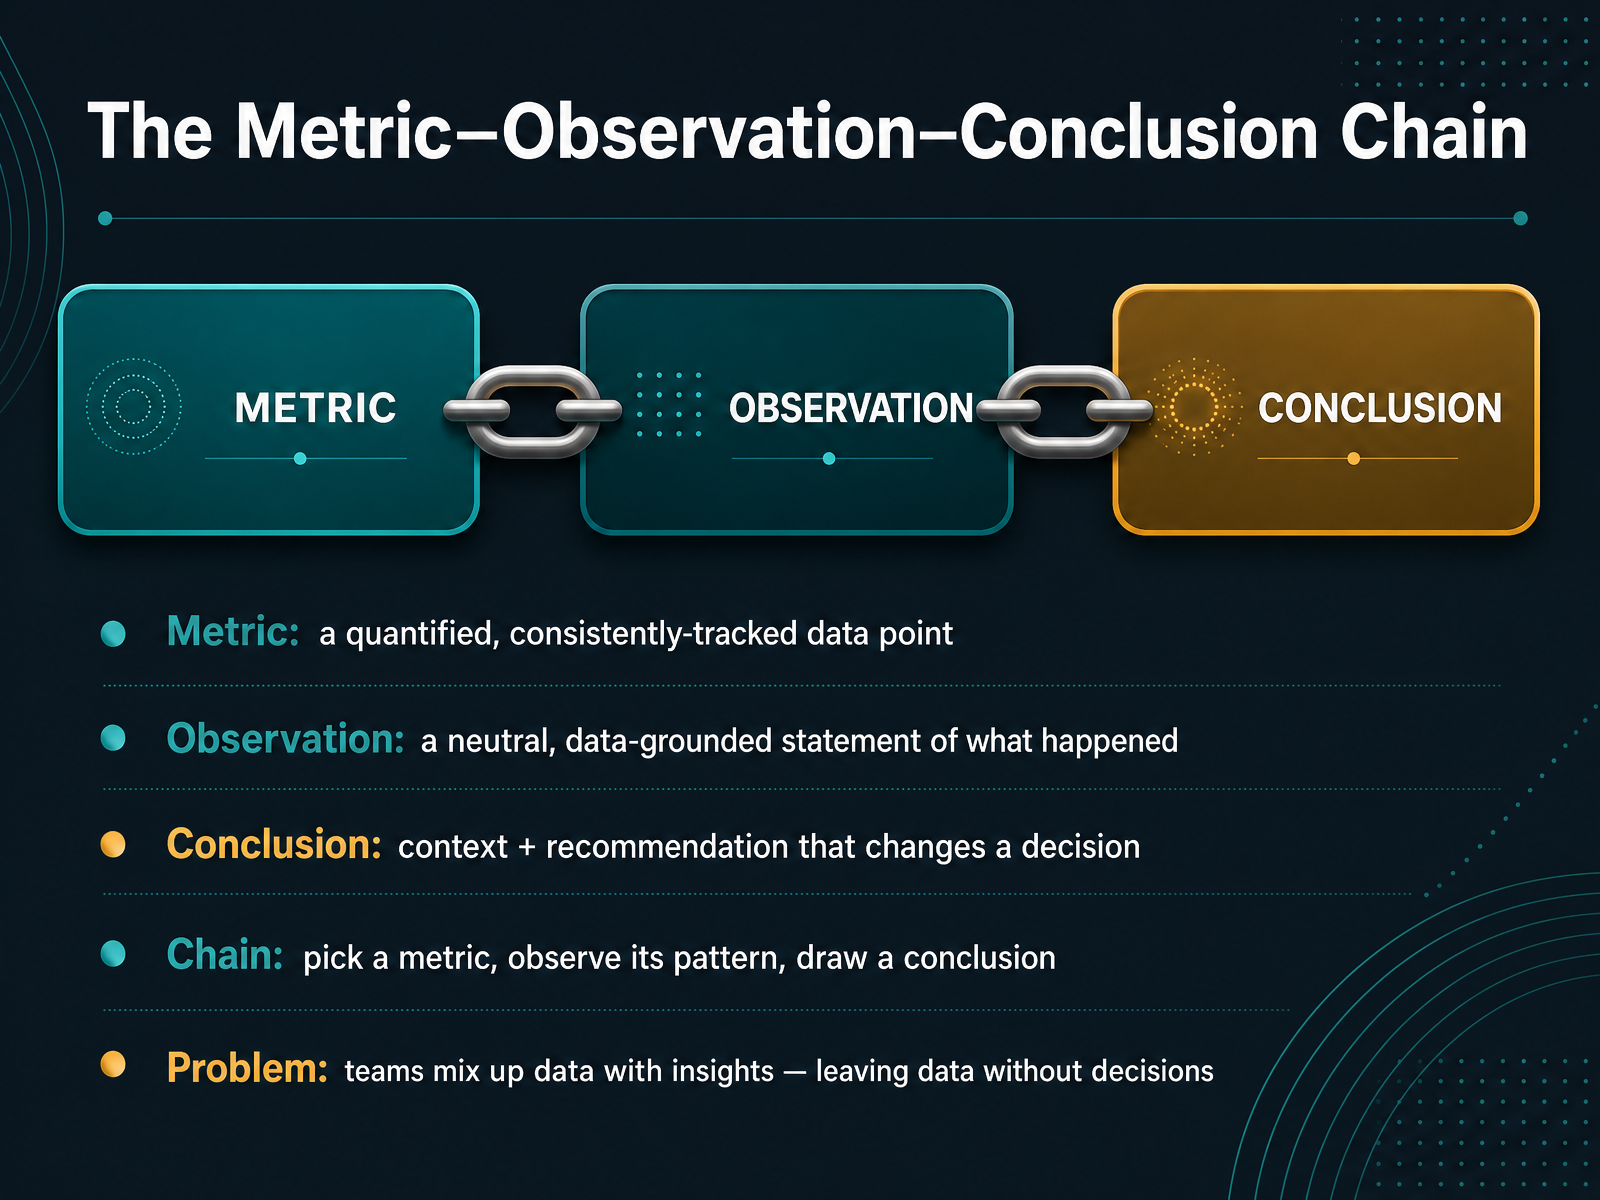
- 02The Metric–Observation–Conclusion ChainNow, let's look at the core framework that connects raw data to real decisions. We call this the Metric to Observation to Conclusion Chain. First, a metric is simply a quantified data point that you track consistently, like website visits or cost per click. It is a number, nothing more. Next, an observation is a neutral statement grounded in that data. For example, 'website visits dropped twenty percent this week.' That is just what happened, without any judgment. Finally, a conclusion adds context and a recommendation. It sounds like, 'Visits dropped because a campaign ended, so we need to activate a new channel.' Notice the shift. The conclusion changes a decision. The chain is simple. You pick a metric, observe its pattern, and draw a conclusion. The most common problem on teams is mixing these up. They treat raw data as insight and leave data points without actionable decisions. Up next, we will ground this chain in something concrete: anchoring with a clear marketing goal.
 1 min
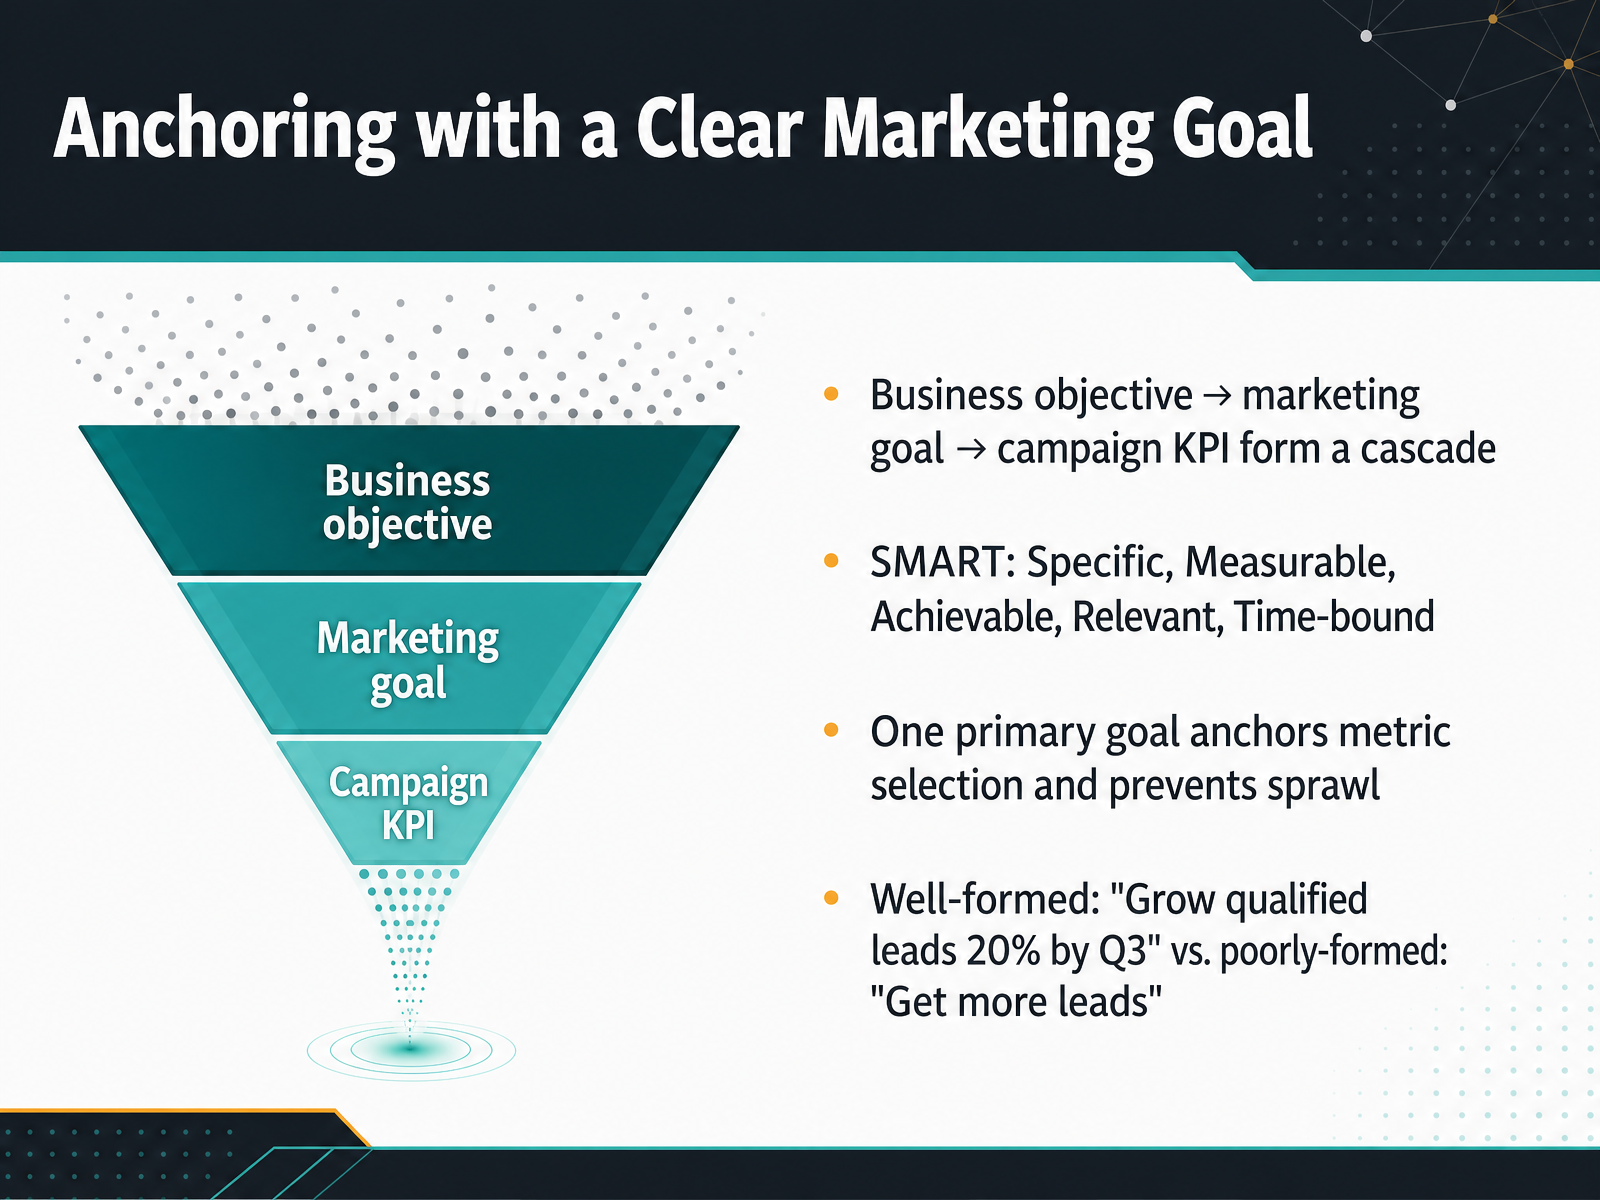
1 min - 03Anchoring with a Clear Marketing GoalLet's anchor our measurement conversation in the most critical first step: a clear marketing goal. Picture a cascade. A business objective flows down into a marketing goal, which then defines your campaign KPI. Without this chain, metrics float without purpose. The best goals follow the SMART framework. That means Specific, Measurable, Achievable, Relevant, and Time-bound. Consider two versions. A poorly formed goal says, 'Get more leads.' A well-formed goal states, 'Grow qualified leads twenty percent by Q3.' See the difference? The second version names a metric, a direction, a target, and a deadline. One primary goal anchors your metric selection and prevents measurement sprawl. When everything feels important, nothing gets measured well. Choose one outcome to drive and let that decision filter which KPIs matter. Speaking of KPIs, next we will explore how these metrics serve as building blocks.
 blazedigital.ioblog.b2bplanr.comdigitalmarketingagency.sg+22 min
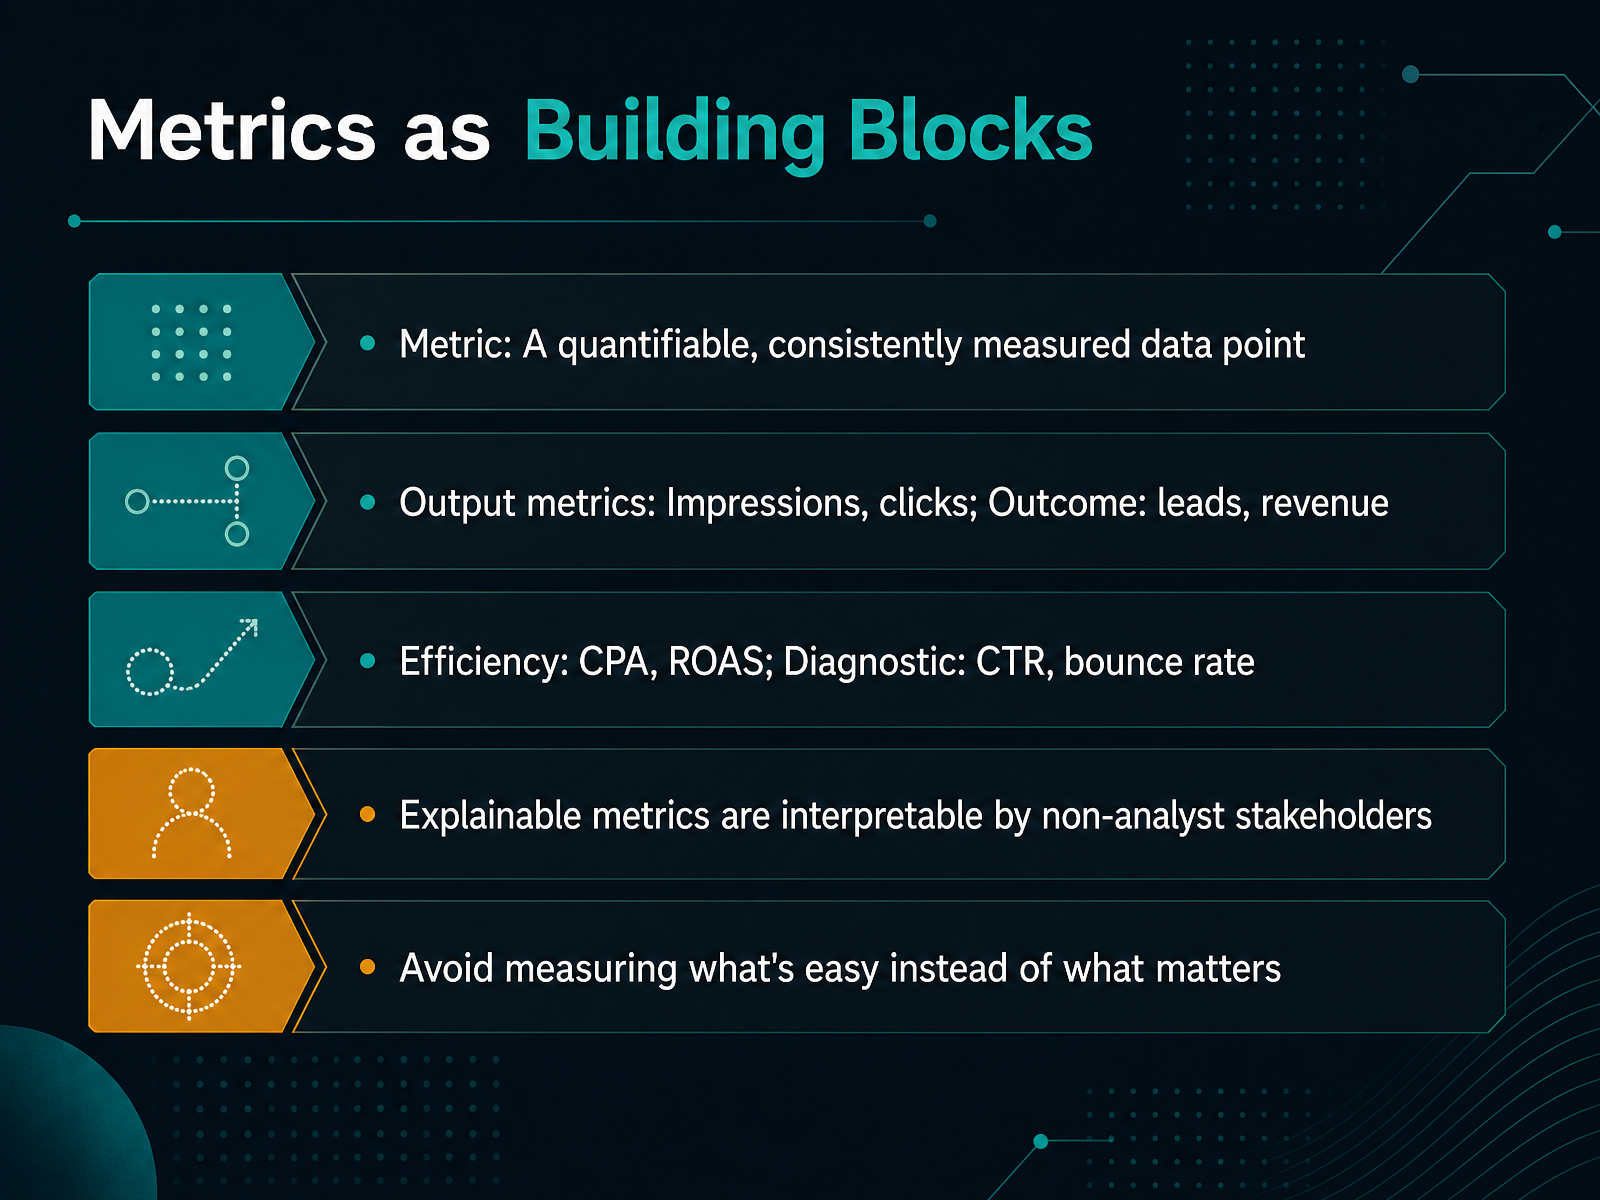
 - 04Metrics as Building BlocksNow we get to the very building blocks of measurement. A metric, at its simplest, is a quantifiable and consistently measured data point. But not all metrics serve the same purpose. We can group them into categories to make them more explainable. Think of output metrics like impressions and clicks. These tell you what your campaigns delivered. Then you have outcome metrics, like leads and revenue, which connect directly to business results. When you need to assess cost-effectiveness, you look at efficiency metrics, such as cost per acquisition, or CPA, and return on ad spend, known as ROAS. And when something looks off, you turn to diagnostic metrics, like click-through rate or bounce rate, to help you understand why. The real skill here is choosing explainable metrics. These are numbers that a non-analyst stakeholder, like a brand manager or a sales director, can understand at a glance. The most common pitfall is measuring what is easy instead of what actually matters to the business. Always tie your metric back to the goal. Next, let’s apply this thinking to observations, where we examine what the data actually says.
 sitetracking.ioiabseaindia.combcg.com+22 min
 - 05Observation: What the Data Actually SaysNow let's focus on what an observation actually is. An observation is not a list of raw numbers or dashboard widgets. Think of it as a neutral, data-grounded statement that describes a pattern you can see. The key is neutrality. You are stating what the data says, not why it happened or what to do about it. Observations typically fall into four structures. You might identify a trend, like a steady increase in weekly traffic. You could make a comparison, such as one channel outperforming another. You might spot an anomaly, like a sudden, unexplained spike in returns. Or you could confirm stability, where a metric holds steady despite external changes. Be careful of a few common traps here. One is framing noise as a real signal. Another is survivorship bias, where you only analyze the customers who stayed. And watch out for recency bias, which means giving too much weight to the most recent data point. Remember, the same weekly revenue metric can produce different valid observations depending on the context you choose. A dip could be an anomaly against a stable year, or part of a predictable seasonal trend. The observation itself just describes the fact you choose to highlight. Next, we will move from observation to action and explore how to turn these neutral statements into a meaningful conclusion.
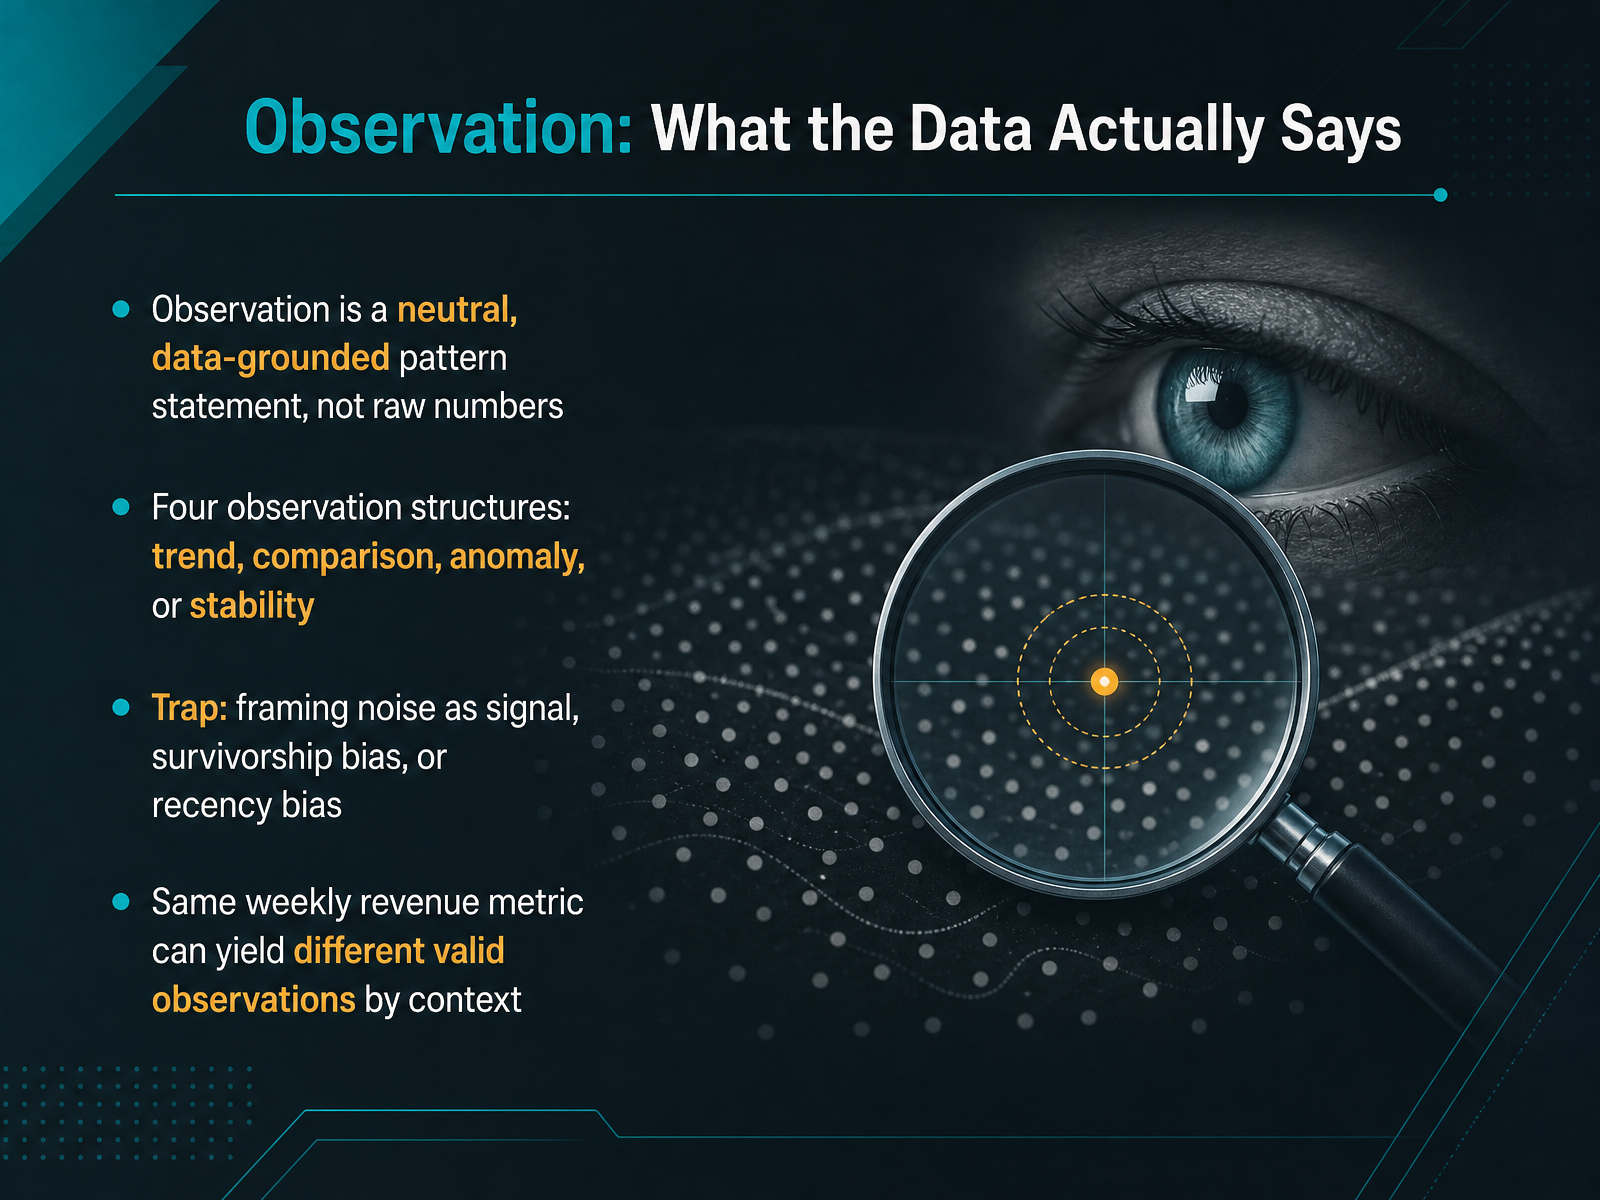 2 min
2 min - 06Conclusion: Turning Observations into ActionLet's move from observing to concluding. A conclusion is where you add causation, context, and a clear recommendation. It bridges the gap between noticing what happened and deciding what to do next. A simple litmus test for your conclusion is this: would the statement change someone's decision? If not, it is probably still an observation. Correlation is not causation. Just because two metrics move together does not automatically mean your campaign caused the change. Use honest language to frame your conclusions. Words like "suggests," "is consistent with," or "warrants further testing" signal the appropriate level of certainty. So, what is the leap you need to make? An observation tells you "what." A conclusion answers the harder questions: "so what" and "now what." It turns data into action. Next, we will see this chain in practice with a worked example.
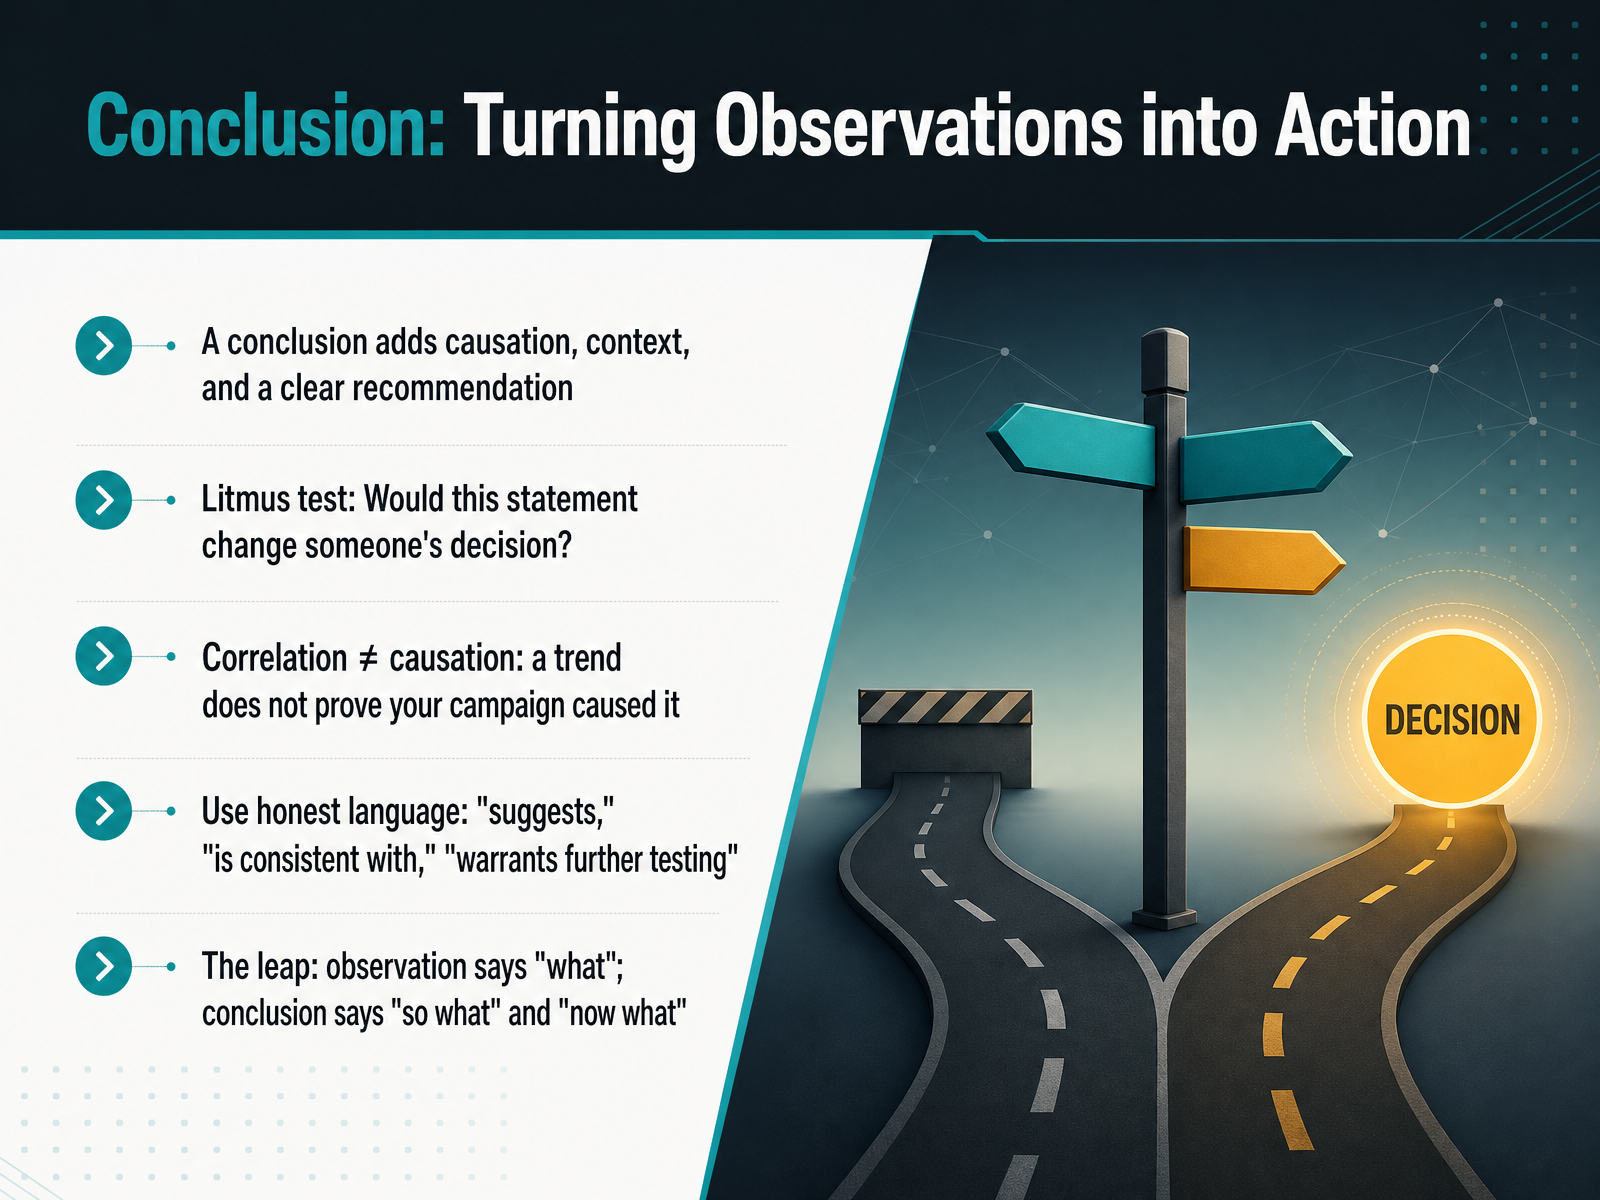 presenc.aiactivecampaign.combcg.com+21 min
 - 07The Chain in Practice: A Worked ExampleNow let's see this chain in practice with a concrete content marketing example. Imagine your goal is to increase qualified leads by twenty percent. Choose a metric that directly explains that goal—here, demo request conversion rate. Your observation is a rising trend in that conversion rate over several weeks. The conclusion you can confidently explain to stakeholders is that you should invest more in the content producing those demo requests. Now contrast this with an incorrect chain. If you select pageviews as your metric and observe a traffic spike, the tempting but unsupported conclusion is that the campaign is a success. The chain breaks because pageviews do not explain qualified lead generation. So here is your self-check: on a sheet of paper or a note, create three columns for metric, observation, and conclusion. List the links from your own campaign and ask yourself a critical question—is each link sound and explainable to a stakeholder? If you cannot connect a metric directly to the goal, the chain needs more work.
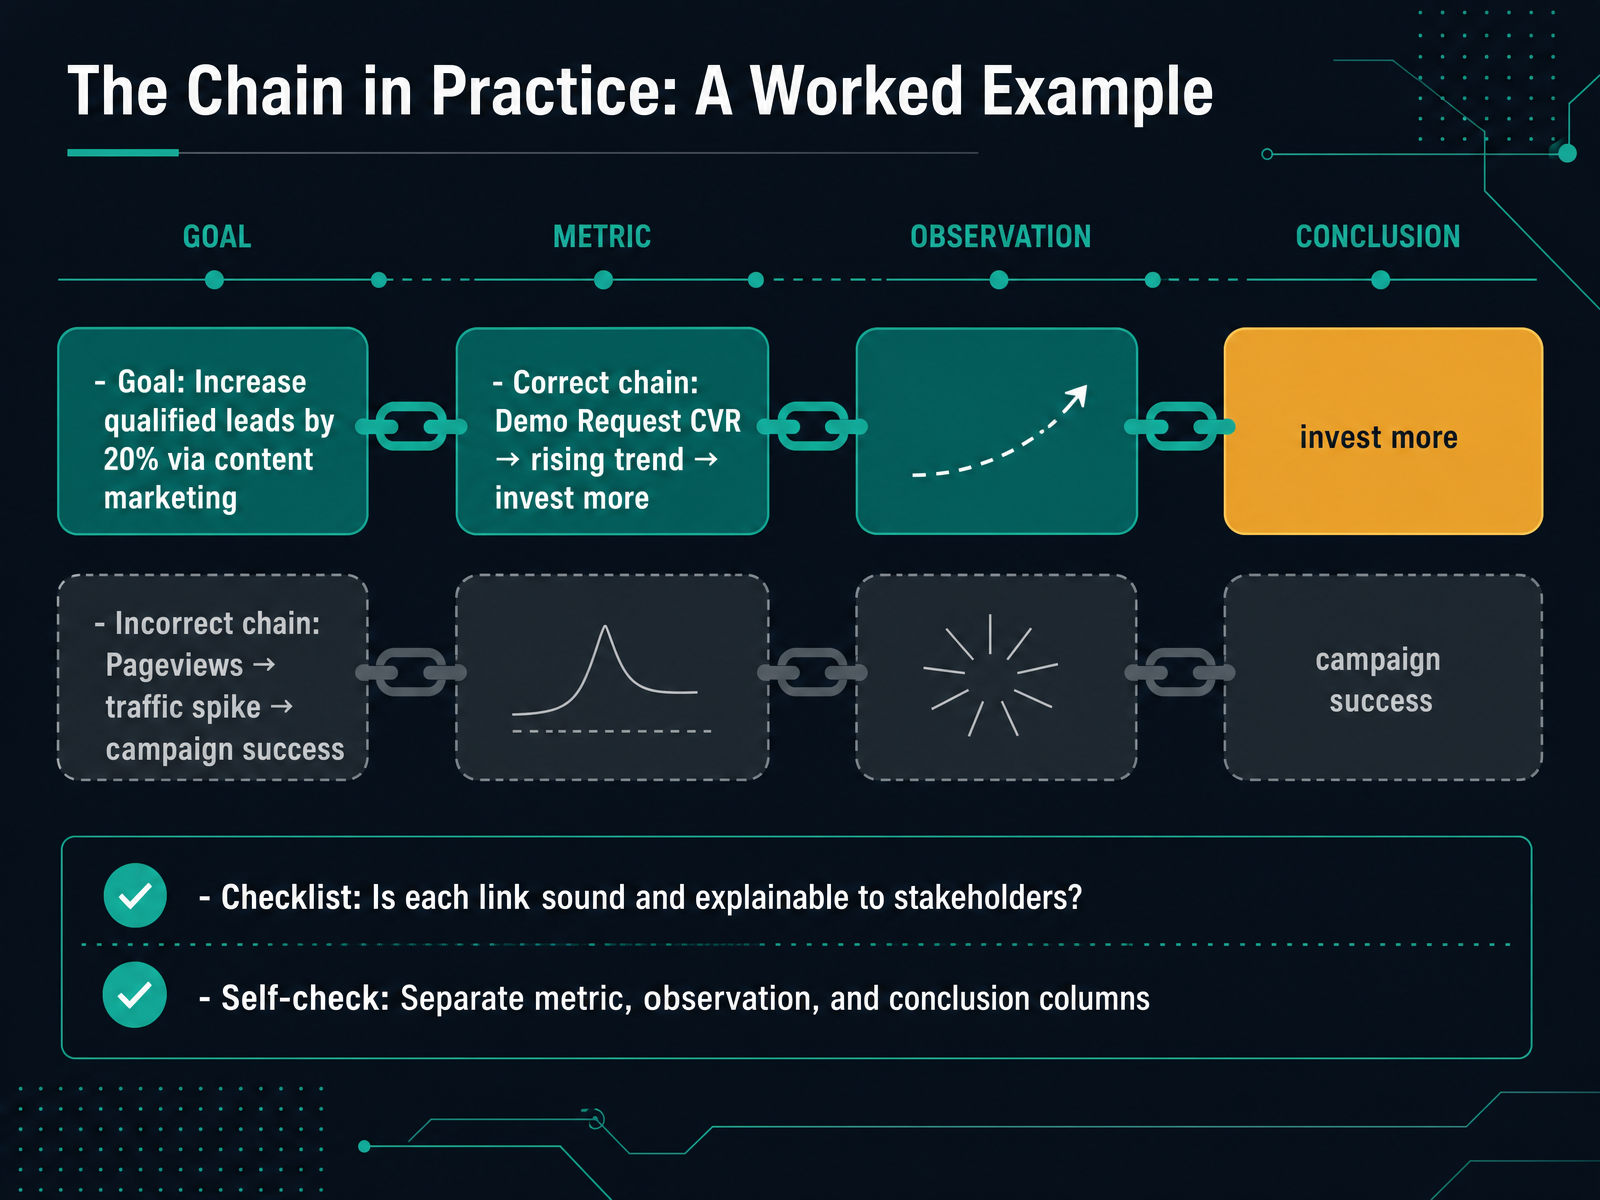 2 min
2 min - 08The Four Filters for Explainable MetricsA strong metric needs to survive four filters before it earns a place in your dashboard. Let me walk you through them. The first filter is Simplicity. Ask yourself, can a non-marketing partner hear the metric name and immediately understand what it means? If it requires a paragraph of explanation, it will not build trust across the business. The second filter is Relevance. The metric must tie directly to the marketing goal you chose, not just be interesting. A high click-through rate is irrelevant if your goal is profitable revenue. The third filter is Stability. The metric must be measured the same way across teams, channels, and time periods so you can compare performance reliably. The fourth filter is Decomposability. A strong metric can be broken down to diagnose the drivers of performance. For example, if revenue is down, you need to decompose it into traffic, conversion rate, and average order value to find the root cause. This is how you transform a flat list of numbers into a diagnostic system. Use these four filters to pressure-test every metric before you commit to it. Up next, we will contrast explainable metrics with opaque ones to sharpen your selection skills even further.
 nofluffadvisory.comdoi.orgumbrex.com+22 min
 - 09Explainable vs. Opaque MetricsNow, let's draw a crucial line between explainable and opaque metrics. Opaque metrics—like a raw data-driven attribution number or a complex model coefficient—are technically impressive, but they confuse stakeholders outside analytics. When you can't explain how a number is made, you can't defend the decision it supports. Explainable metrics, on the other hand, are simple and directly relevant. Think of cost per lead or conversion rate. Everyone grasps what they mean and why they matter. The skill we're building here is decomposition: turning a complex metric into a clear narrative. You state what the metric is, explain why it matters to the business, and describe what actually drives it. This creates defensibility. Because here's the real test: every metric you report must be defensible in a CFO-level conversation. If you can't explain it clearly to a finance partner, you shouldn't put it on a dashboard. Deconstruct complexity. Defend your work in plain language.
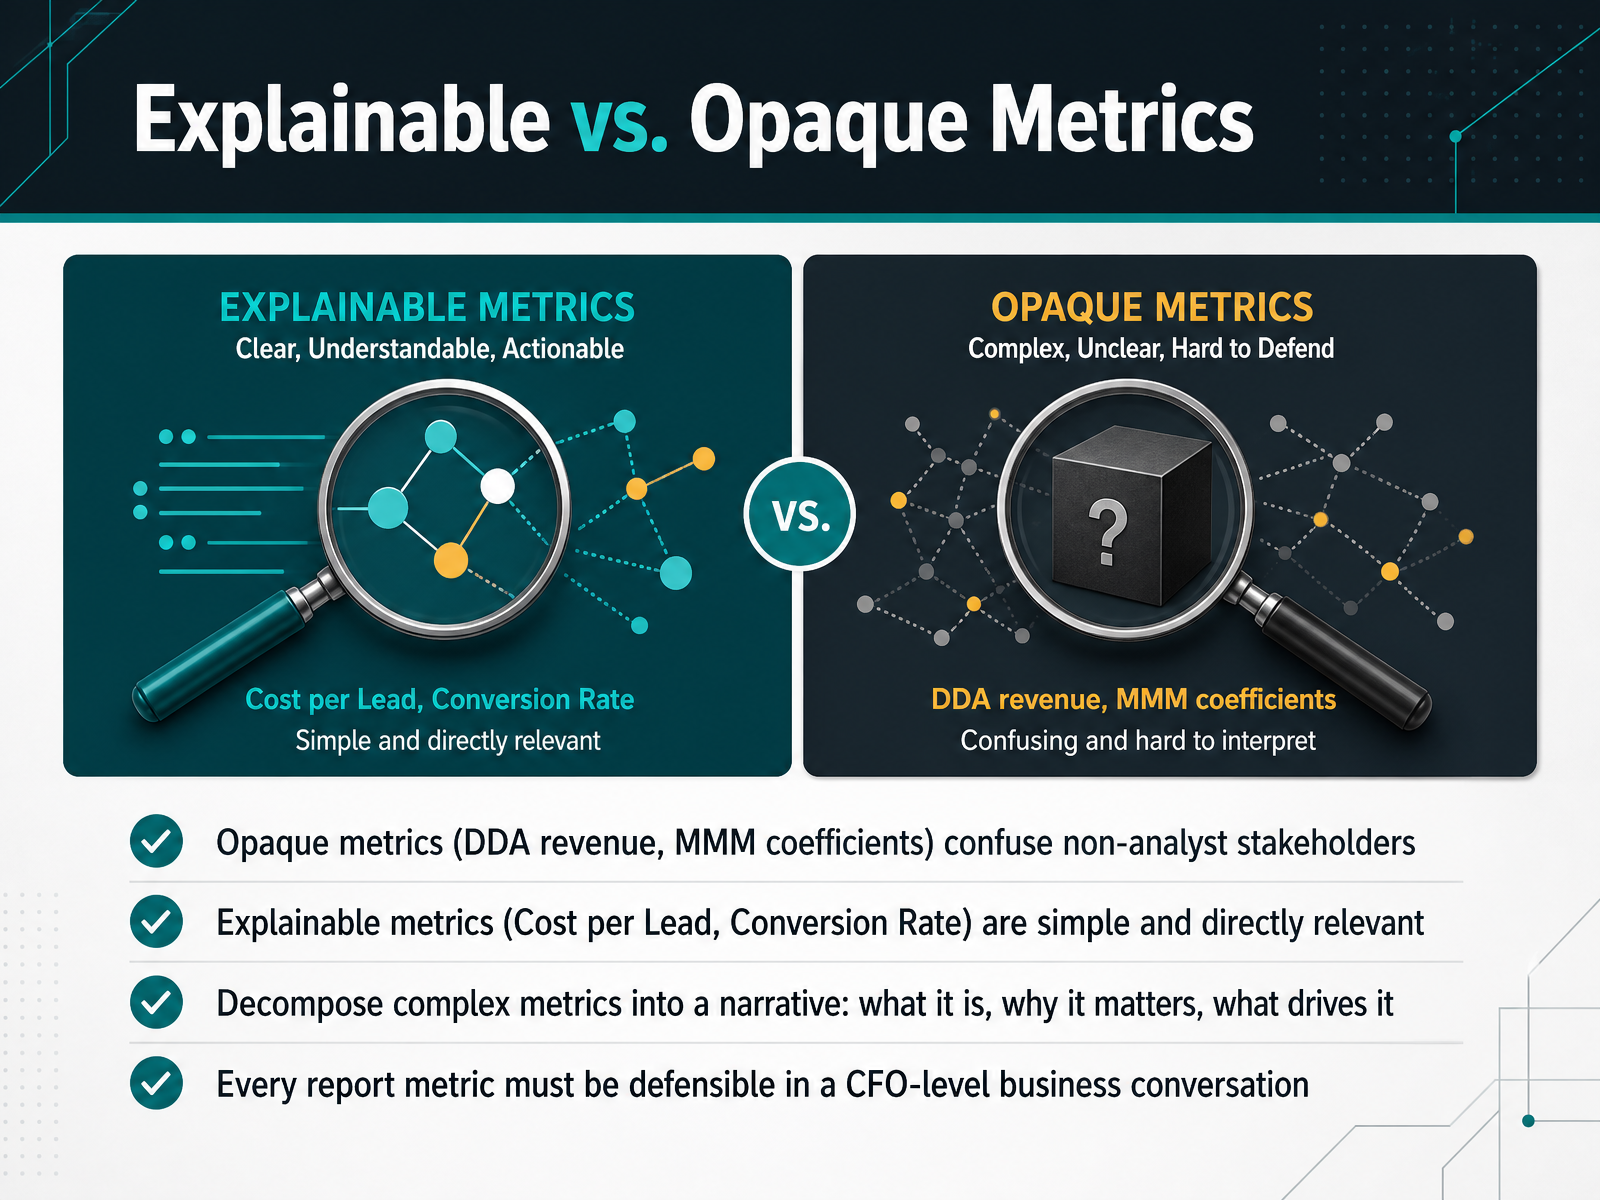 nofluffadvisory.comdoi.orgumbrex.com+21 min
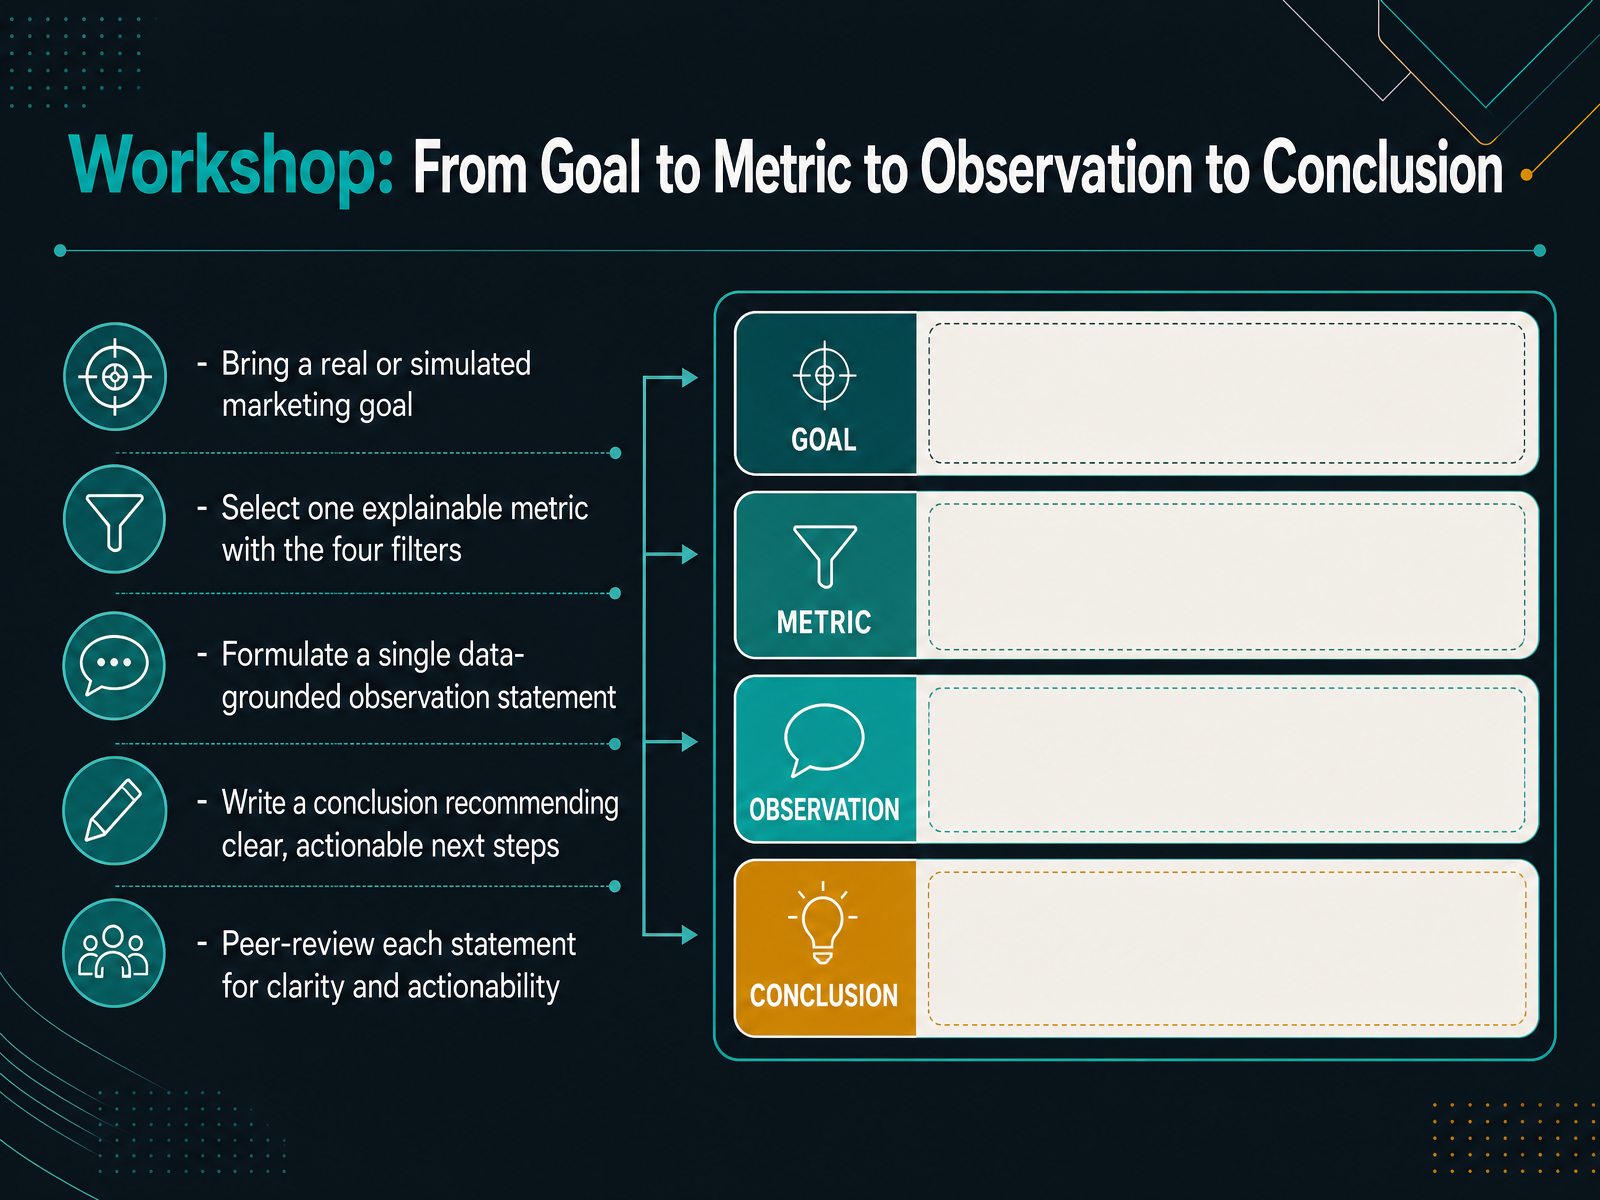
 - 10Workshop: From Goal to Metric to Observation to ConclusionNow it is time to move from concepts to application. In this workshop, you will bring a real or simulated marketing goal and put the entire framework into practice. Start by selecting one explainable metric that passes all four filters. Then, formulate a single data-grounded observation statement. Next, write a conclusion that recommends clear, actionable next steps. Finally, you will peer-review each other's statements for clarity and actionability. This is where you test whether your chosen metric truly connects execution to decision-making. Coming up next, we will examine a common trap in Mistake Number One: measuring what is easy instead of what matters.
 1 min
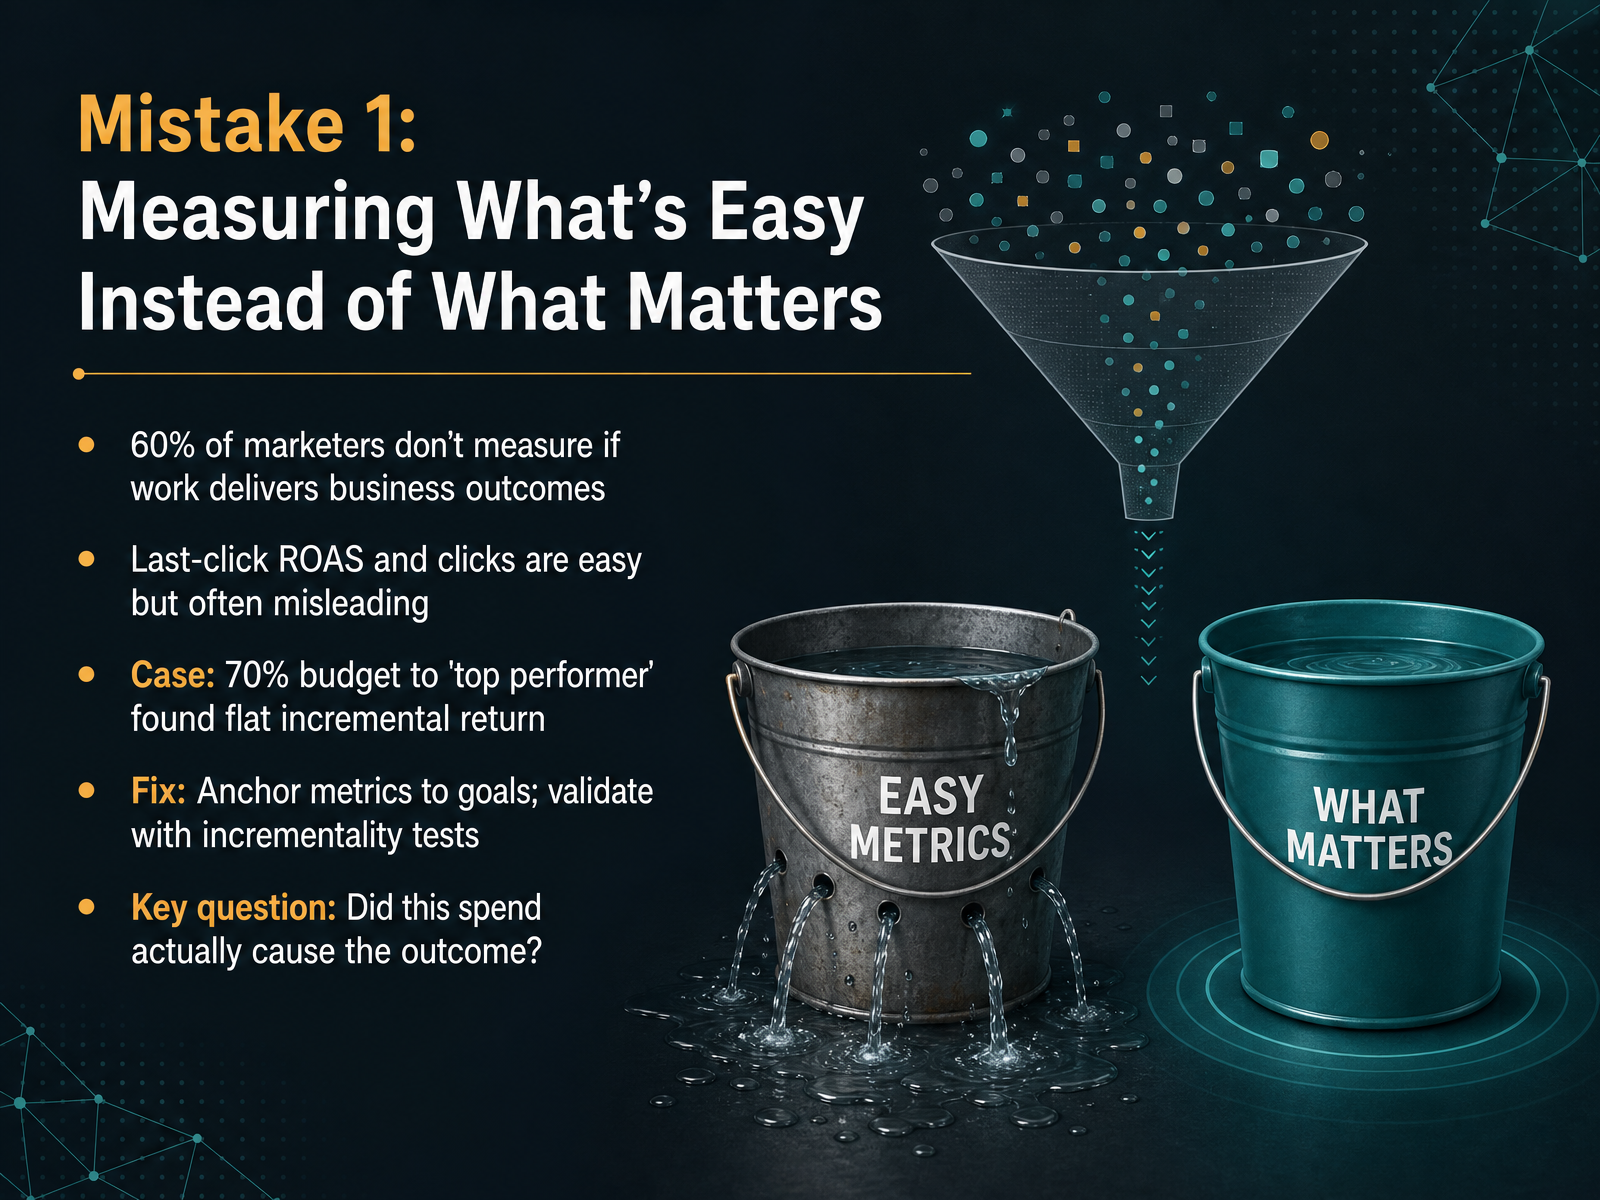
1 min - 11Mistake 1: Measuring What's Easy Instead of What MattersNow let's talk about a mistake that shows up in almost every marketing dashboard: measuring what's easy instead of what matters. A recent survey found that sixty percent of marketers don't actually measure whether their work delivers business outcomes. Instead, the go-to metrics are often last-click ROAS and clicks. Those numbers are easy to find, but they can be misleading. For example, one brand shifted seventy percent of its budget to what its dashboard called the top performer, only to find the incremental return was flat. The spend wasn't creating new demand; it was just harvesting what was already there. The fix is to anchor every metric to a real goal and validate it with incrementality tests. Always come back to one key question: Did this spend actually cause the outcome? Next, we'll look at Mistake Two: Conflating Metrics, Observations, and Conclusions.
 bcg.compresenc.aiactivecampaign.com+21 min
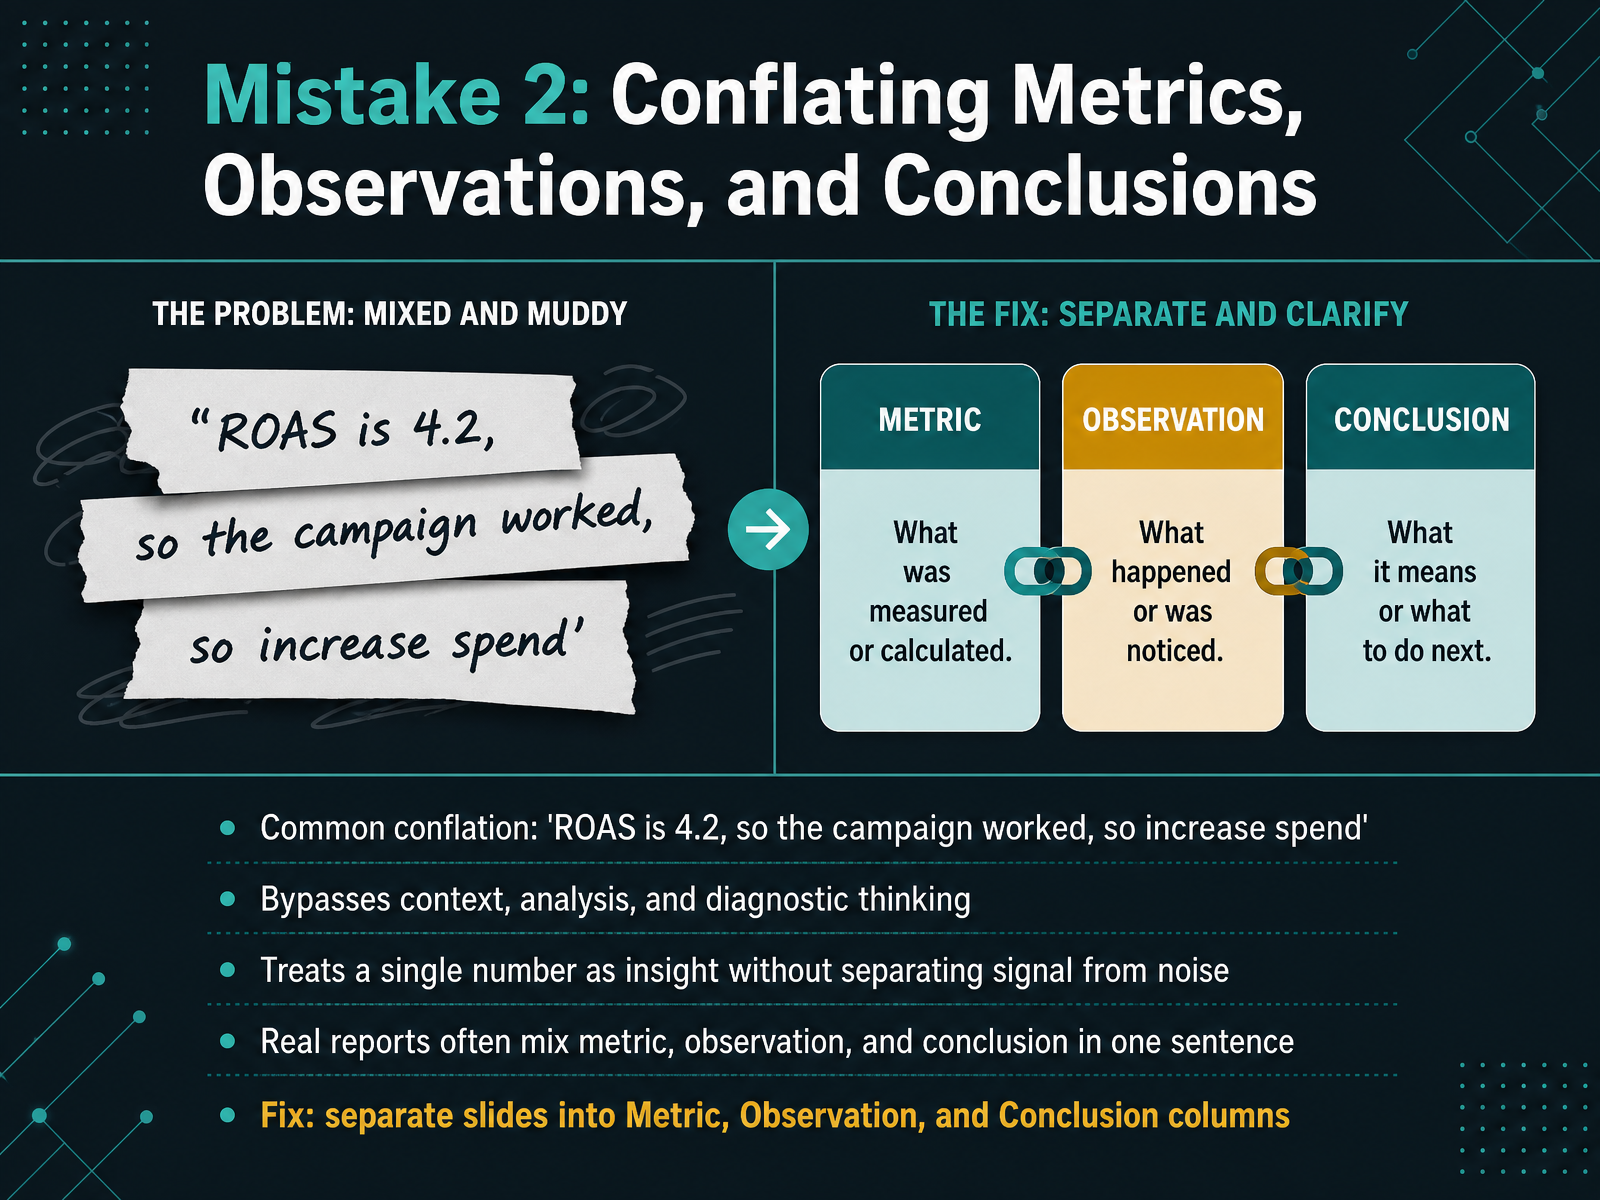
 - 12Mistake 2: Conflating Metrics, Observations, and ConclusionsNow let's look at a very common mistake: mixing up metrics, observations, and conclusions. Here's a sentence you hear all the time. 'ROAS is four point two, so the campaign worked, so we should increase spend.' That single sentence quietly skips over everything that matters. It gives you no context, no analysis, and no real diagnostic thinking. It treats a single number as if it is the whole story, without separating genuine signal from background noise. In real reports, teams often cram a metric, an observation, and a conclusion into one line. That makes it impossible to know where the data ends and the opinion begins. The fix is simple. Break your thinking into three separate columns: Metric, Observation, and Conclusion. Write the clean number first. Then add what you notice. Only then state what you recommend. This keeps your reasoning transparent and testable. Next up, we'll tackle Mistake Three: over-relying on a single number.
 bcg.com2 min
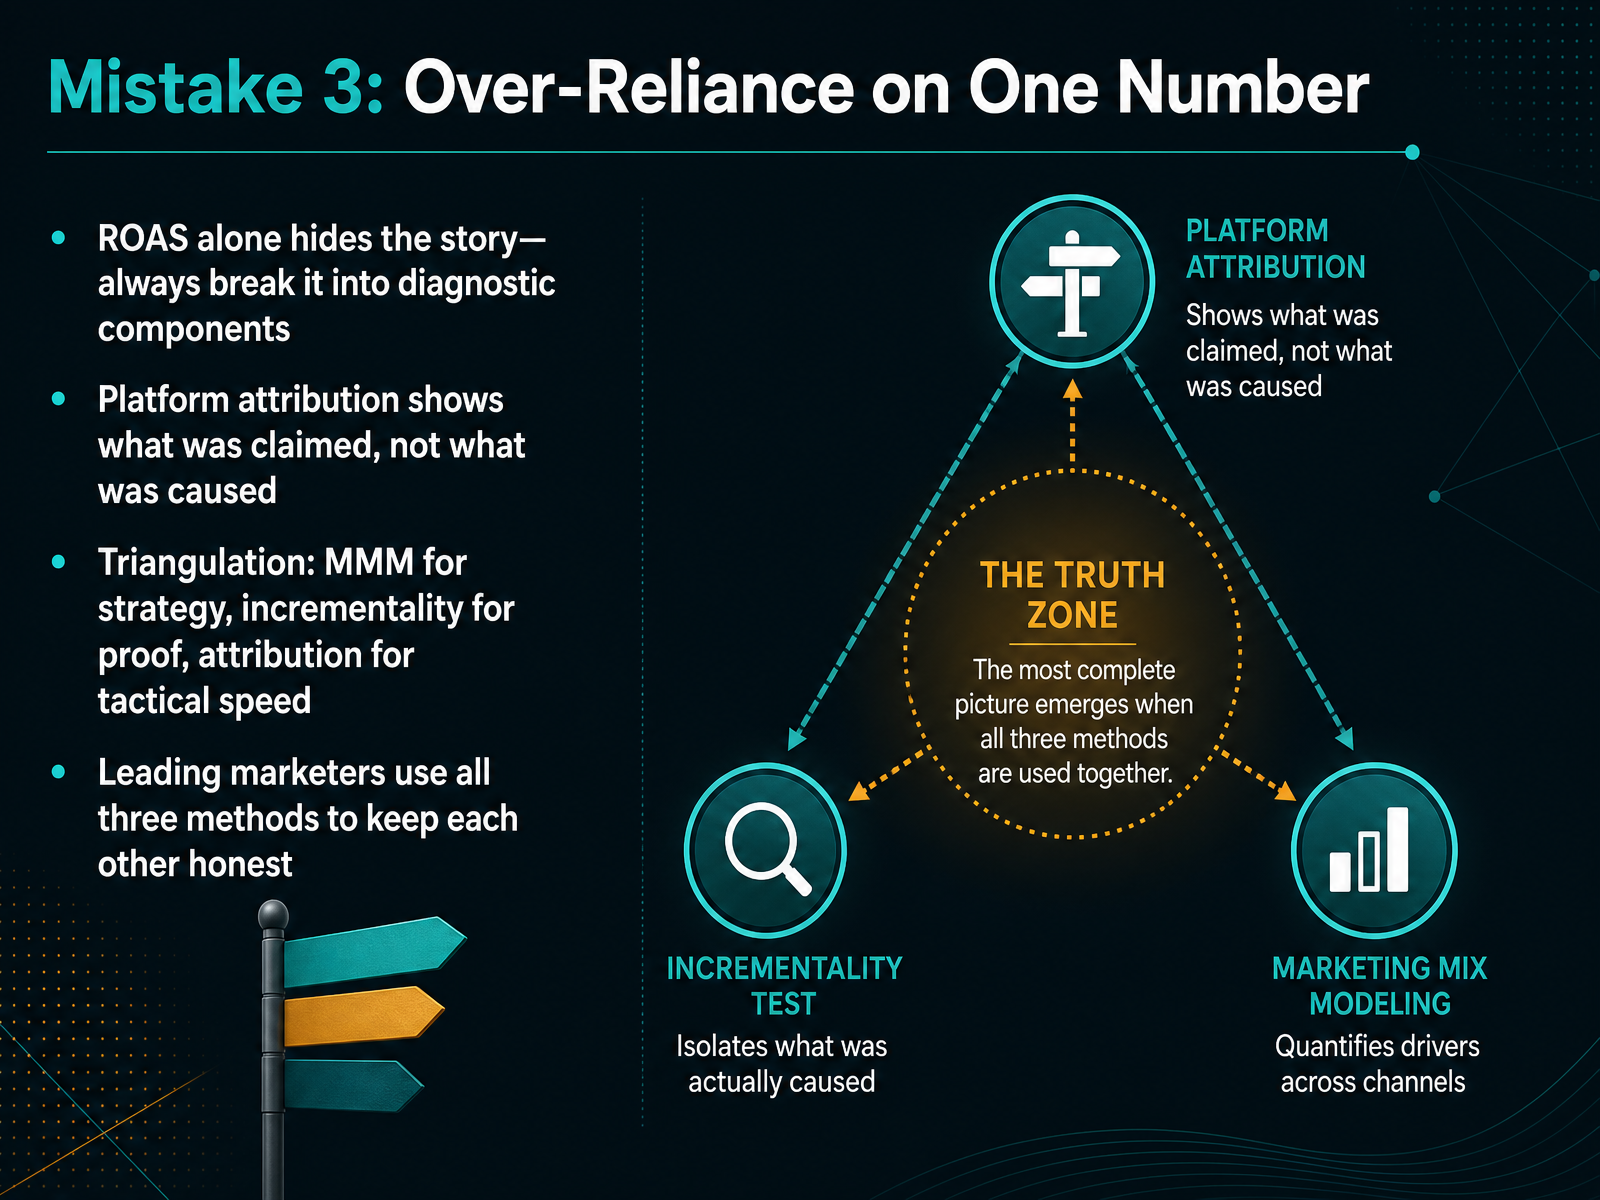
 - 13Mistake 3: Over-Reliance on One NumberNow let's address a very common trap: relying too heavily on a single number like ROAS. Platform-reported ROAS is convenient, but it hides the real story. To understand true performance, you must break it down into diagnostic components. Ask yourself, what part of that return was truly incremental? Remember, platform attribution shows you what was claimed, not what was actually caused. A conversion claim is not the same as a causal proof. Leading marketers solve this with triangulation. They use a portfolio view from Marketing Mix Modeling for strategy, controlled incrementality tests for causal proof, and tactical attribution for real-time optimization. Each method keeps the others honest. Without all three, you are left with a single, often inflated, view of the truth. Think of it as a system of checks and balances for your budget. Now, let's bring everything together with the key takeaways and next steps.
 bcg.compresenc.aiactivecampaign.com+21 min
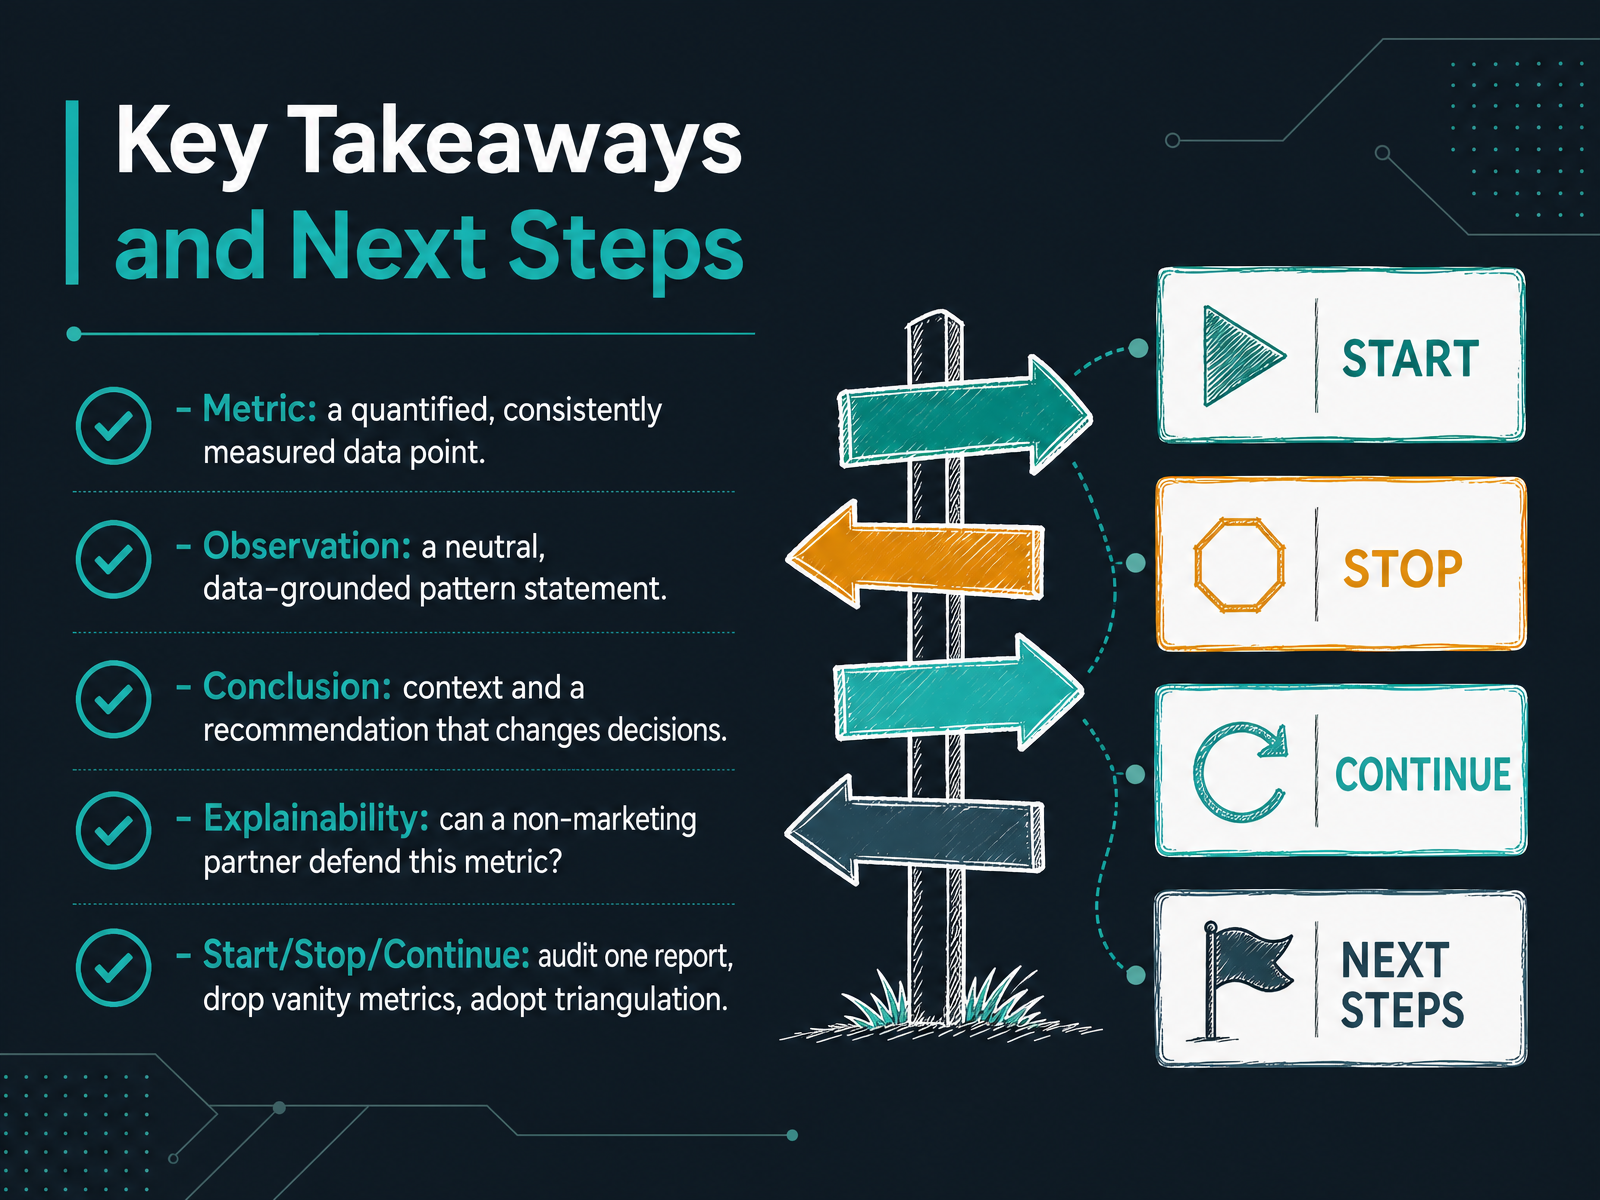
 - 14Key Takeaways and Next StepsLet's tie everything together. A metric is a quantified data point you measure the same way every time. An observation is a neutral pattern statement grounded in that data. And a conclusion adds context and a recommendation that should change decisions. For explainability, always ask: could a non-marketing partner defend this metric and what it means? If the answer is no, simplify. Here's your start, stop, continue. Start by auditing one existing report. Stop tracking vanity metrics that feel good but don't inform decisions. Continue by adopting triangulation, using at least three metrics to illuminate a single goal. Thank you for your time and for bringing your analytical thinking to this session. You now have a framework to choose metrics that earn trust and drive action. Go put it to work.
 1 min
1 min
Take the deck with you
Download this course as a file — free, no sign-up needed.
- PDF handoutEvery slide page, ready to print or share.15 pages · 3.4 MBDownload
- Narrated PowerPointThe deck that presents itself — every slide carries the digital human's narration video.15 pages · 13.3 MBDownload
- PowerPoint slidesThe full deck as a .pptx — open it in PowerPoint, Keynote, or Google Slides.15 pages · 3.3 MBDownload
Free to use in your own training — please keep the PersonWise credit page at the end.
Have your own deck? Turn it into a course
Sources consulted
Web sources consulted while building this course.
- Marketing Measurement Maturity Model: 5-Level Framework - SiteTracking — sitetracking.io
- IAB SEA+India’s Measurement Maturity Framework Whitepaper — iabseaindia.com
- Six Steps to More Effective Marketing Measurement — bcg.com
- The 4 Stages of a Marketing Measurement Maturity Model — liveramp.com
- Marketing Measurement: Navigating the Path to Measurement Maturity | mediasense — media-sense.com
- How to Set Marketing Goals for Your Business — blazedigital.io
- Marketing Goals vs Objectives vs KPIs: Why the Distinction Matters in B2B — blog.b2bplanr.com
- Marketing Objectives: Types, Examples & SMART Guide - DMA — digitalmarketingagency.sg
- Marketing plan objectives: How-to guide | Keen — keends.com
- Marketing Goals and Objectives Step by Step | Model Reef — modelreef.io
- Causal Inference for Marketing Measurement | Presenc AI — presenc.ai
- Correlation vs. Causation: What it Means in Marketing — activecampaign.com
- How Measurement is Evolving in Next-Best Action — bcg.com
- Causal Inference in Marketing: Moving Beyond Correlation with Propensity Scores and Instrumental Variables - Georg Keferböck — keferboeck.com
- Correlation vs Causation: Learn the Difference — amplitude.com
- Attention Isn’t Enough—The Future of Marketing is Relevance — No Fluff Advisory — nofluffadvisory.com
- Developing and Validating the R IF C Marketing Protocol. Clarity Framework: R + (I × F) = C — doi.org
- Track Success with Marketing KPI Tree Framework — umbrex.com
- Metric Trees for Marketing Teams - KPI Tree — kpitree.co
- The Marketing Measurement Framework - QRY — weareqry.com