Web Analytics in Digital Marketing
Begin
14 pages · ~28 min
Web Analytics in Digital Marketing
This course teaches digital marketers the core concepts, purpose, and practical examples of web analytics for measuring and improving online marketing performance.
What you’ll learn
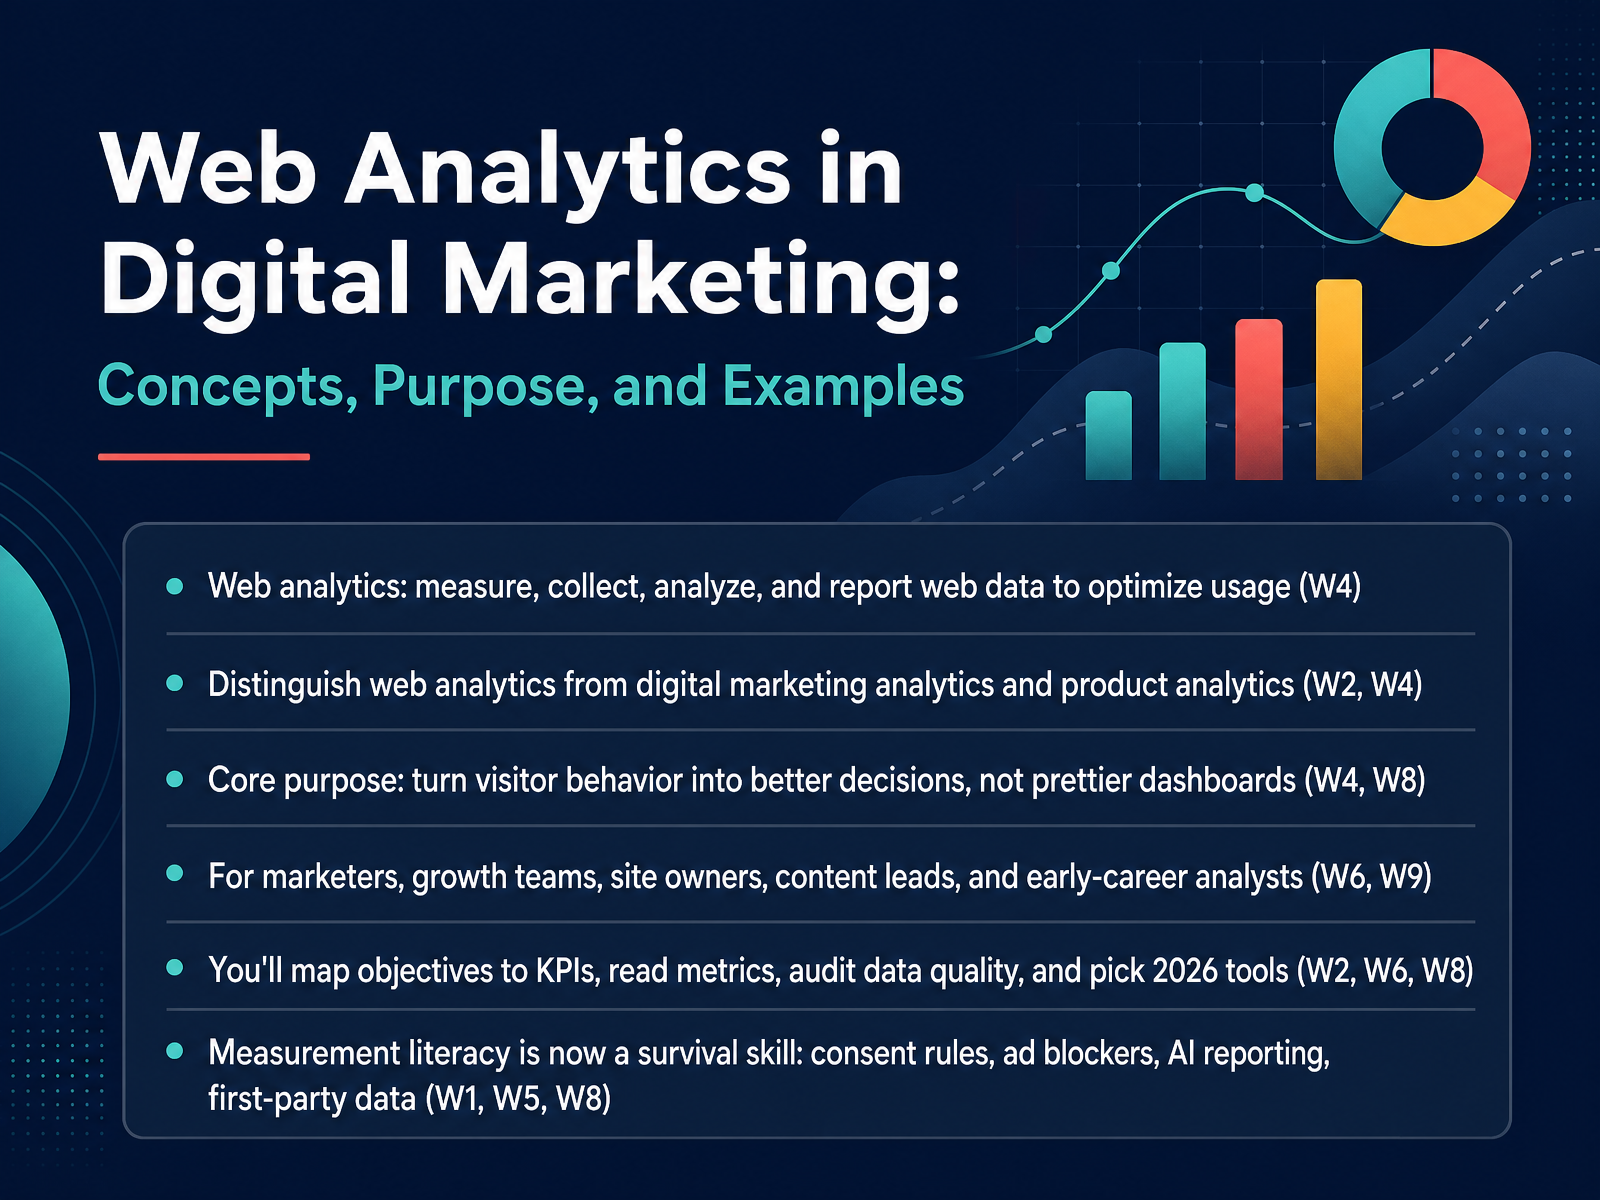
- 01Web Analytics in Digital Marketing: Concepts, Purpose, and ExamplesWelcome. I'm glad you're here. This course is about web analytics in digital marketing, and our goal is simple. By the end, you'll know how to turn visitor behavior into better decisions, not just prettier dashboards.
So what is web analytics? It's the measurement, collection, analysis, and reporting of web data to understand and optimize how people use your site. That includes page views, clicks, form submissions, and purchases.
One quick distinction. Web analytics focuses on your website. Digital marketing analytics covers all your channels. Product analytics focuses on behavior inside a logged-in product. Related, but not the same.
This matters because without measurement, every marketing decision is a guess. For marketers, growth teams, site owners, content leads, and early-career analysts, measurement literacy is now a survival skill. Consent rules, ad blockers, AI reporting, and first-party data all shape what your numbers actually show.
In this course, you'll map objectives to key performance indicators, read core metrics, audit data quality, and pick the right tools. Let's start with why measurement matters, from traffic to decisions.techtarget.comen.wikipedia.orgcontentsquare.com+22 min
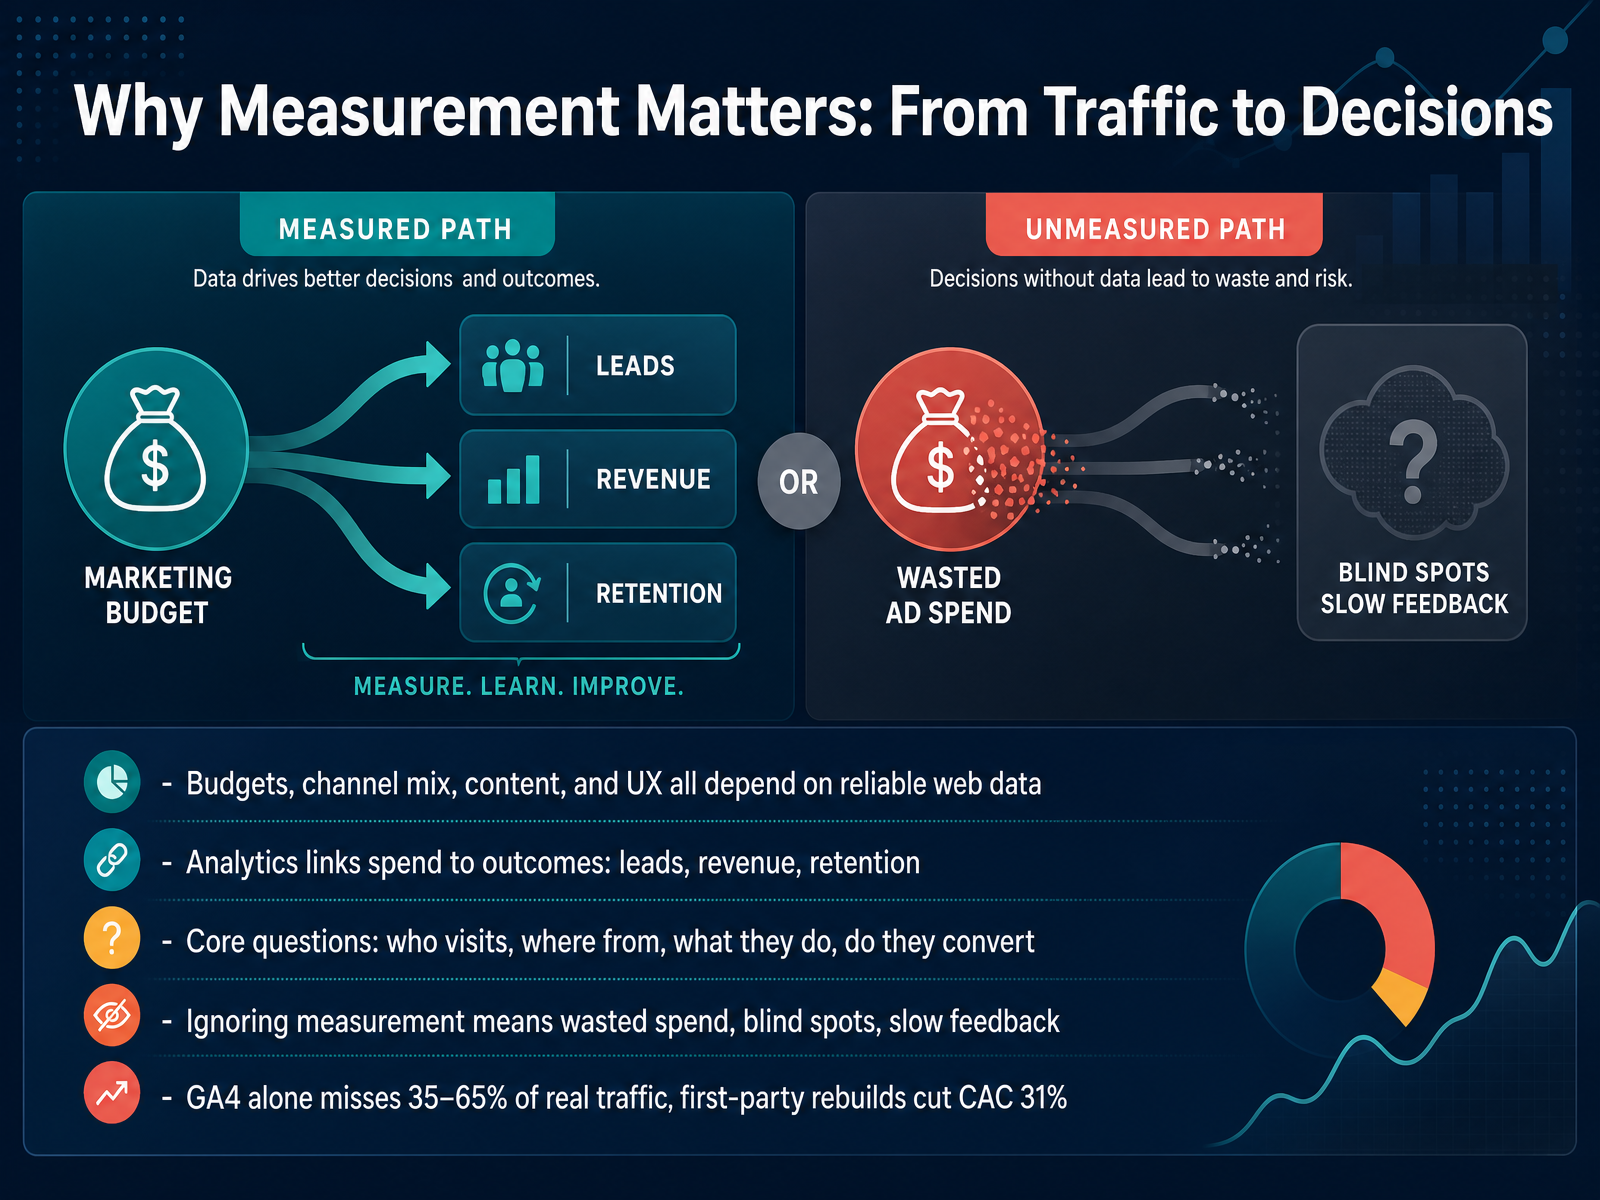
- 02Why Measurement Matters: From Traffic to DecisionsLet's talk about why measurement actually matters. Budgets, channel mix, content, and user experience all depend on reliable web data. Without it, you are guessing. Analytics links your spend to real outcomes. Leads, revenue, and retention. It answers four core questions. Who visits, where they come from, what they do, and whether they convert. Ignore measurement, and you get wasted spend, blind spots, and slow feedback. Here is the part that surprises people. GA4 alone can miss thirty-five to sixty-five percent of your real traffic, thanks to ad blockers and consent rejection. Teams that rebuild on first-party data have cut customer acquisition cost by thirty-one percent. So the takeaway is simple. Measurement is not a report you file. It is the evidence behind every decision you make. Next, let's cover core concepts and terminology.
 techtarget.comen.wikipedia.orgcontentsquare.com+21 min
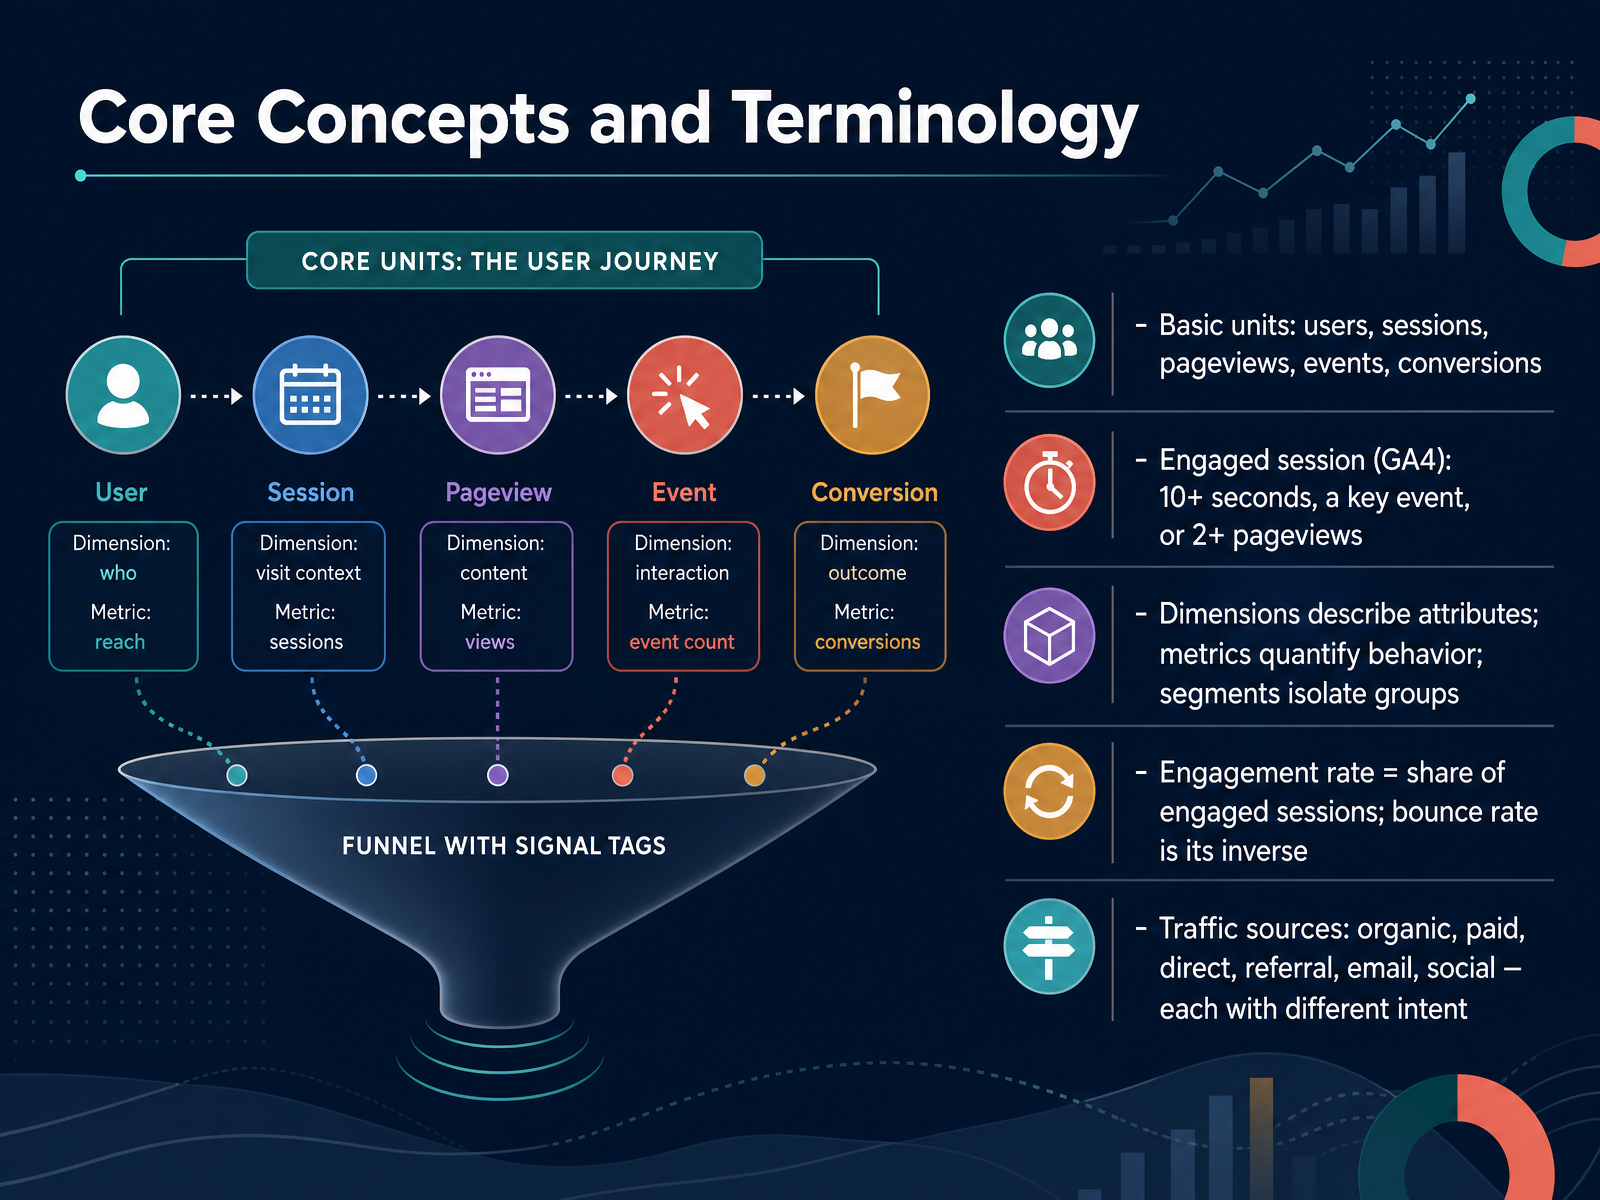
 - 03Core Concepts and TerminologyNow let's lock down the core concepts and terminology, because these are the words you'll use every day. Start with the basic units. Users are the people. Sessions are their visits. Pageviews count pages loaded. Events capture any interaction, like a click or a video play. Conversions, called key events in GA4, are the actions you actually care about. Next, the engaged session. In GA4, a session counts as engaged if it lasts ten seconds or longer, triggers a key event, or includes two or more pageviews. It only needs one of those three. Then three terms you'll hear constantly. Dimensions describe attributes, like which page or which channel. Metrics quantify behavior, like how many sessions. Segments isolate groups, like mobile users only. Engagement rate is the share of engaged sessions. Bounce rate is simply its inverse. If engagement is seventy percent, bounce is thirty. Finally, traffic sources. Organic, paid, direct, referral, email, and social. Each one carries different intent, so read them separately, never averaged together. That's your vocabulary. Next, how Web Analytics Works: From Data Collection to Reporting.
 techtarget.comen.wikipedia.orgcontentsquare.com+22 min
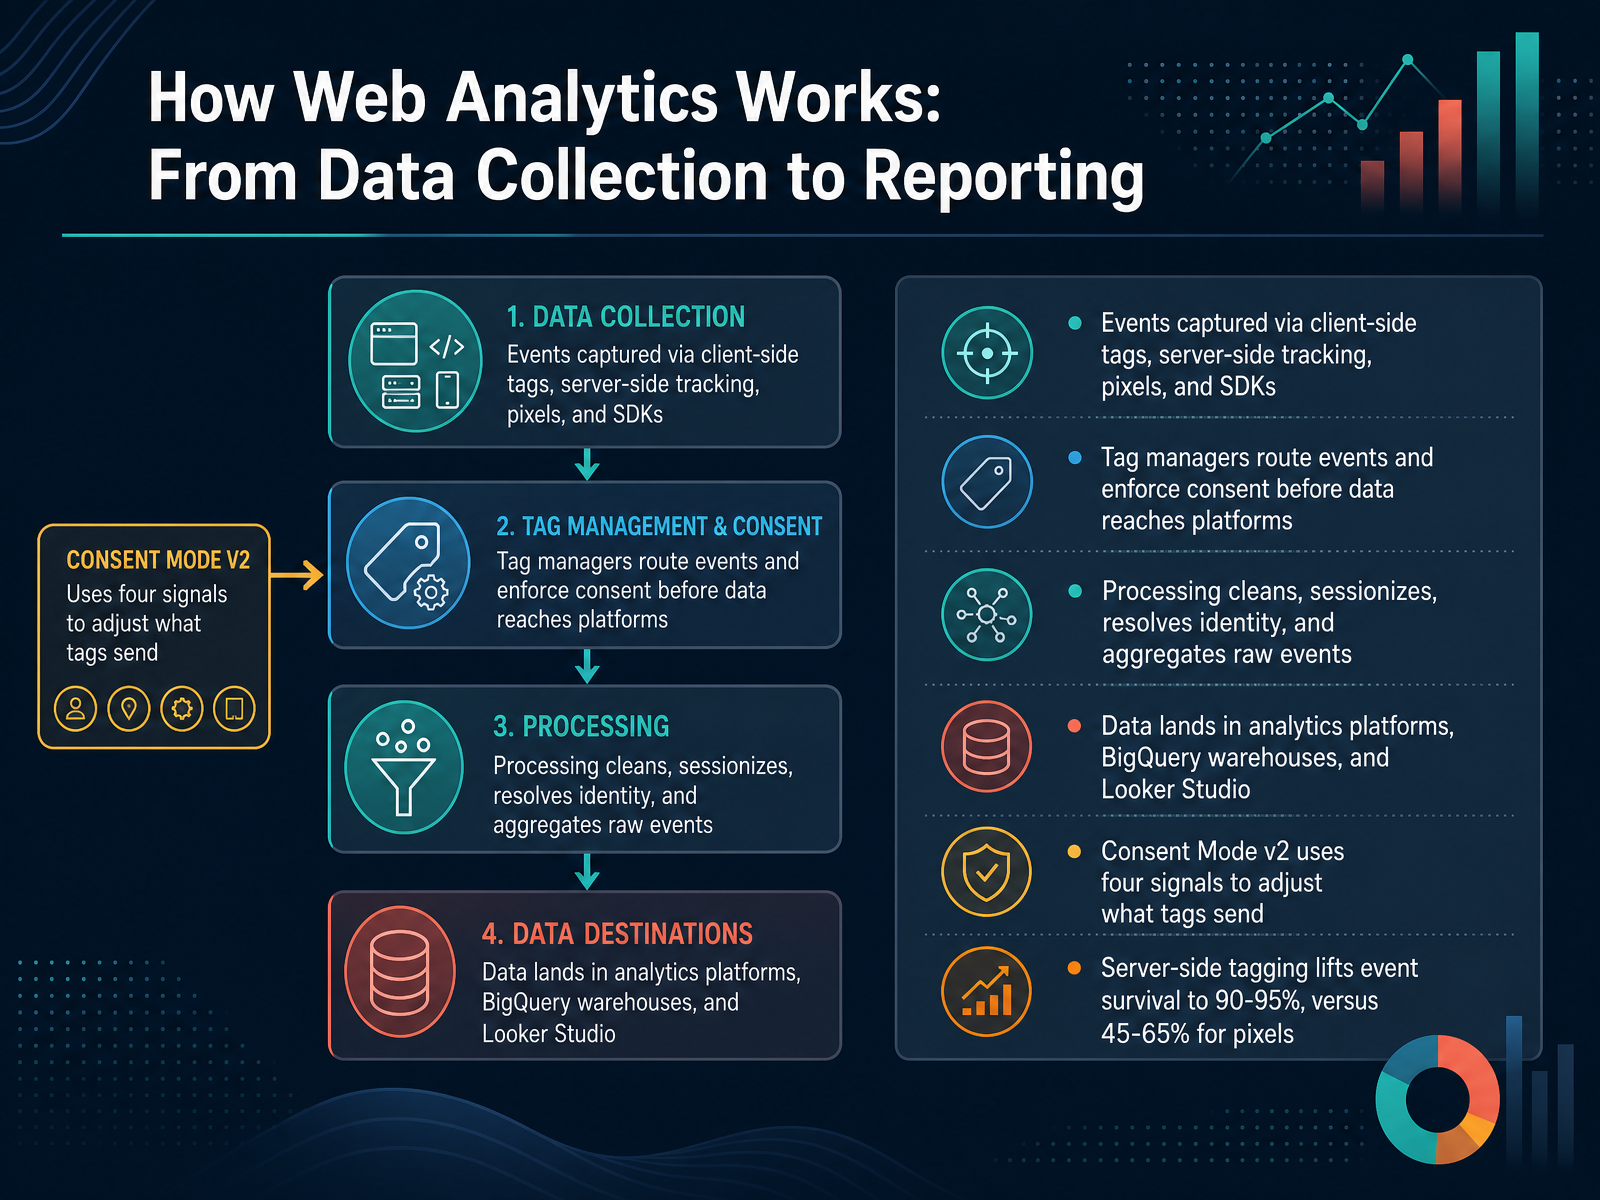
 - 04How Web Analytics Works: From Data Collection to ReportingLet's walk through how web analytics actually works, from the moment a user clicks to the moment you open a report. First, data collection. Events are captured through client-side tags in the browser, server-side tracking, pixels, and software development kits, or SDKs, for apps. Next, tag managers act as the traffic controller. They route those events and enforce consent before any data reaches a platform. Then processing happens. The system cleans the data, groups activity into sessions, resolves identity across devices, and aggregates raw events into usable numbers. From there, data lands in analytics platforms, BigQuery warehouses, and Looker Studio dashboards. One thing to know: Consent Mode version two uses four signals to adjust what tags are allowed to send. And server-side tagging lifts event survival to ninety to ninety-five percent, compared with forty-five to sixty-five percent for browser pixels. That gap is why so many teams are moving server-side now. Next, let's look at the 2026 measurement stack, the tools and platforms you'll actually choose from.
 techtarget.comen.wikipedia.orgcontentsquare.com+21 min
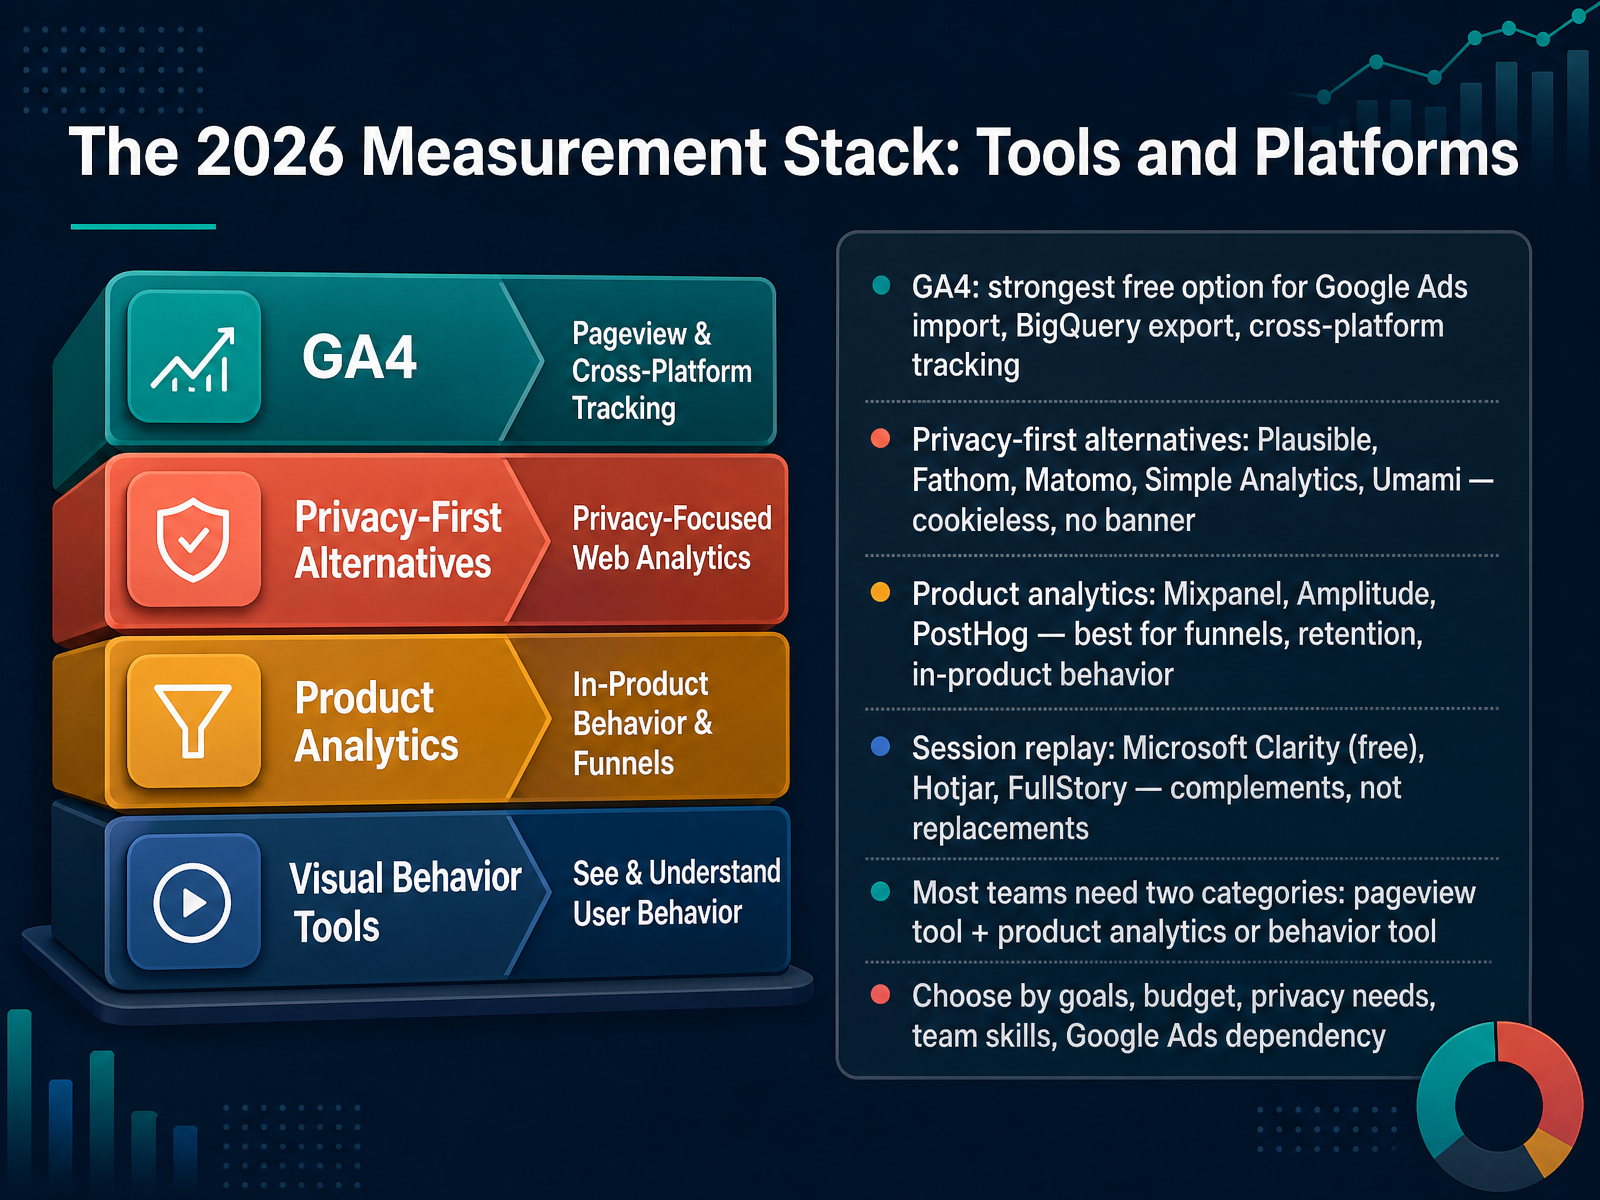
 - 05The 2026 Measurement Stack: Tools and PlatformsNow let's look at the tools themselves, grouped by the job they do. GA4 is still the strongest free option, especially if you run Google Ads. Conversion import is one click, the BigQuery export gives you raw unsampled data, and cross-platform tracking covers web and app. Next, privacy-first tools like Plausible, Fathom, Matomo, Simple Analytics, and Umami are cookieless, so in most jurisdictions you don't need a consent banner. Then product analytics, such as Mixpanel, Amplitude, and PostHog. These are best for funnels, retention, and in-product behavior. Session replay sits alongside them, with Microsoft Clarity as the free option, plus Hotjar and FullStory. Treat replay as a complement, not a replacement. Here's the practical rule. Most teams need two categories, a pageview tool plus either product analytics or a behavior tool. Choose by your goals, budget, privacy needs, team skills, and Google Ads dependency. Next, we'll turn these choices into concrete goals, events, and KPIs.
 bootstrap.buildmurtazarangwala.comdatasaas.co+22 min
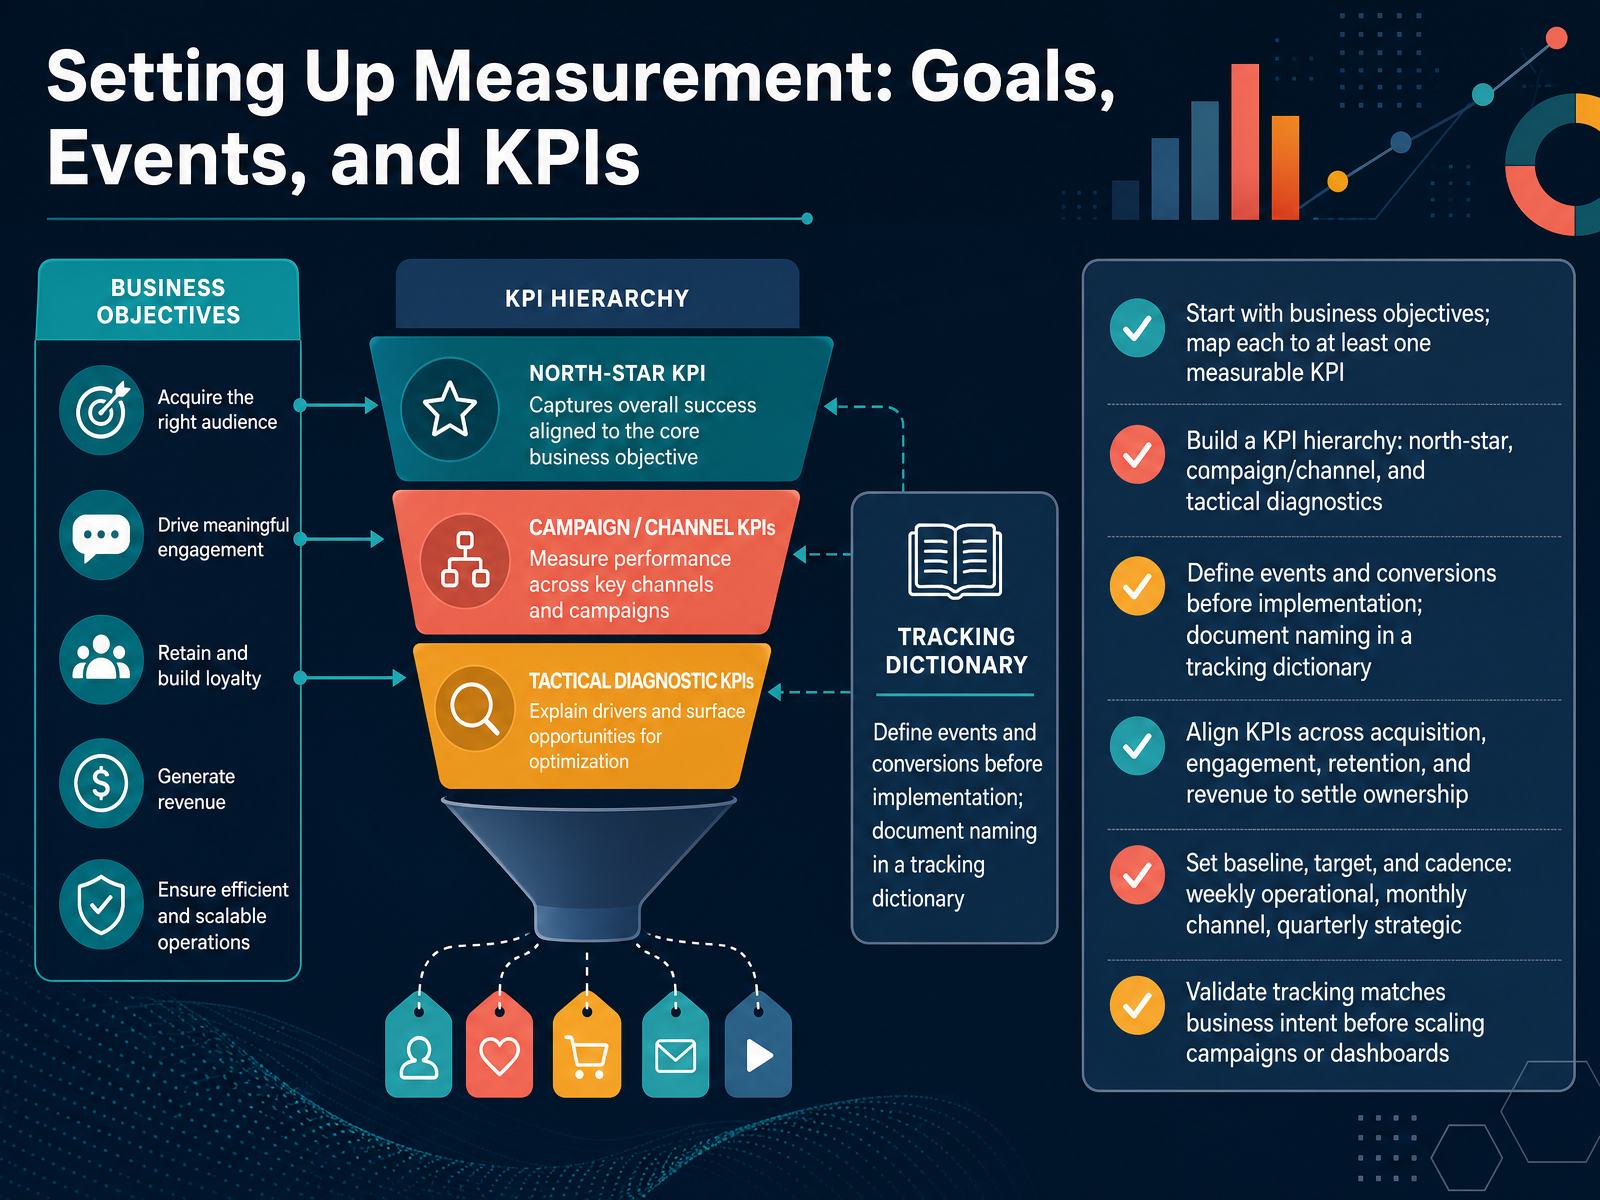
 - 06Setting Up Measurement: Goals, Events, and KPIsNow let's talk about setting up measurement properly. This is where most teams go wrong, because they start with tools instead of decisions. Begin with your business objectives, then map each one to at least one measurable KPI. If the objective is growing revenue, your KPI might be customer lifetime value or new revenue by channel. Next, build a KPI hierarchy. You want a north-star metric, campaign and channel KPIs underneath it, and tactical diagnostics at the bottom. North-star metrics drive budget allocation. Channel metrics like return on ad spend guide your channel mix. Tactical metrics like landing page conversion rate help you troubleshoot, but they should never drive budget on their own. Before implementation, define your events and conversions, and document the naming in a tracking dictionary. That document becomes your single source of truth. Align your KPIs across acquisition, engagement, retention, and revenue so ownership is clear. Then set a baseline, a target, and a cadence. Weekly for operational checks, monthly for channel reviews, quarterly for strategy. Finally, validate that your tracking matches business intent before you scale campaigns or dashboards. Bad data scaled is just expensive confusion. Reading Reports Without Fooling Yourself.
 trackingplan.comthegray.companymodelreef.io+22 min
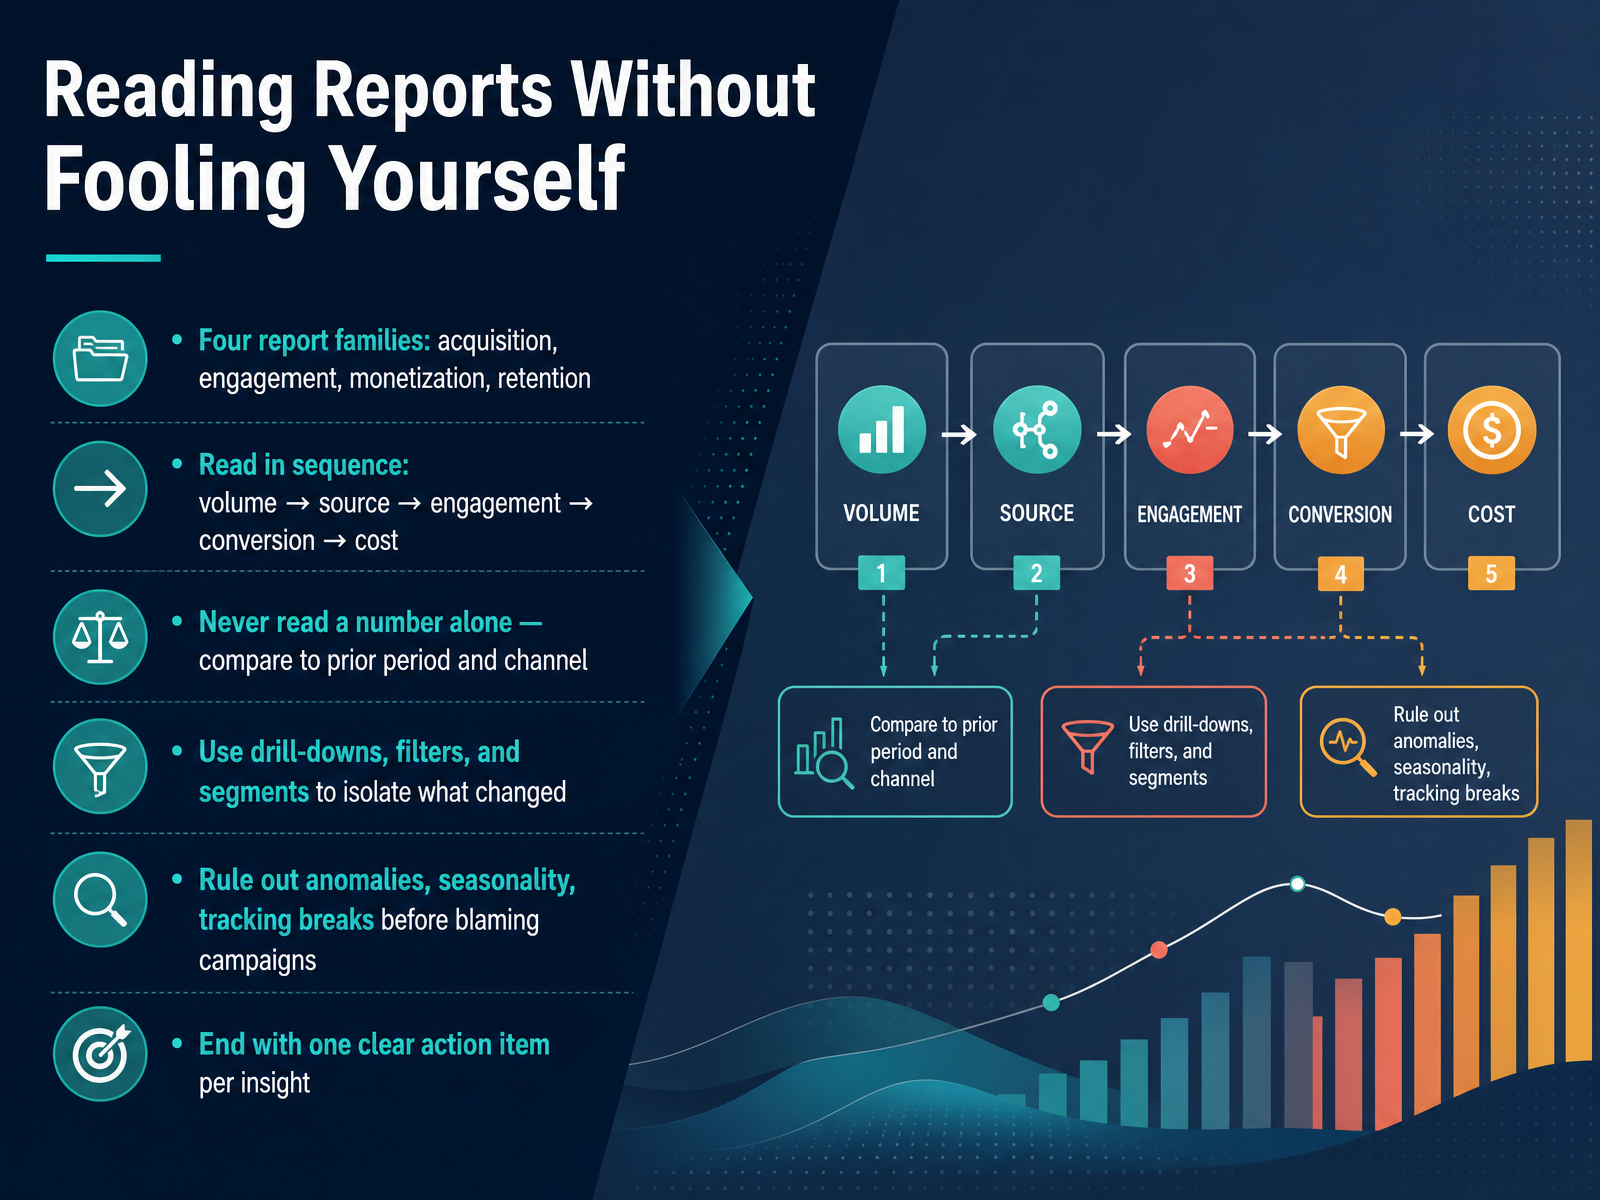
 - 07Reading Reports Without Fooling YourselfNow let's talk about reading reports without fooling yourself. Think of your reports in four families: acquisition, engagement, monetization, and retention. That mirrors the customer journey, how people arrive, what they do, how value is created, and whether they come back. Read them in sequence: volume first, then source, engagement, conversion, and cost. And never read a number alone. Always compare it to the prior period and the channel that produced it. A forty percent traffic jump means nothing until you know it came from one campaign in one country. Use drill-downs, filters, and segments to isolate what actually changed. Before you blame a campaign, rule out the usual suspects: tracking breaks, seasonality, or a one-day anomaly. If tracking broke, the story is wrong no matter how confident the summary sounds. Then finish with one clear action item per insight. If a chart does not lead to a decision, it probably does not belong in your primary view. Let's see this in practice with a real ecommerce funnel and checkout optimization example.
 livesession.iouxcam.comscribble.network+22 min
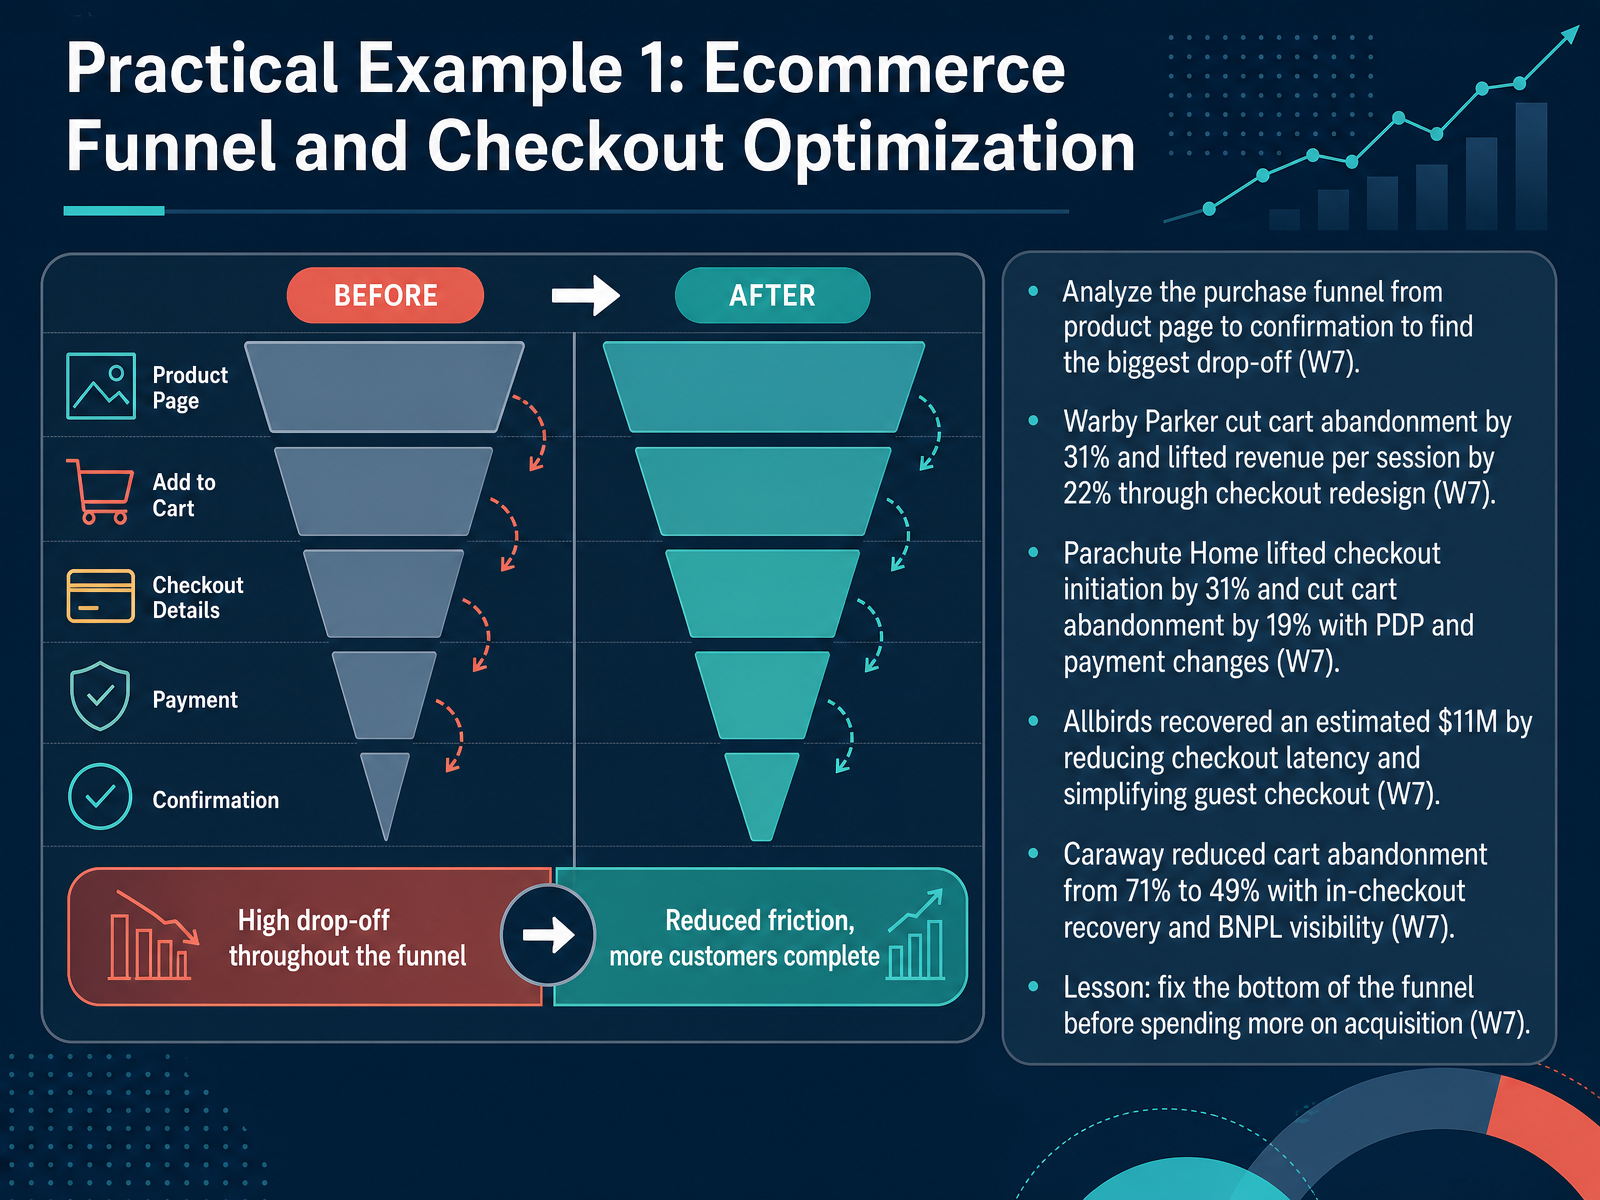
 - 08Practical Example 1: Ecommerce Funnel and Checkout OptimizationLet's walk through a real funnel example. Take an ecommerce brand and map every step from product page to order confirmation. Find where the biggest drop-off happens, because that's usually where the money is hiding. Warby Parker redesigned checkout and cut cart abandonment by thirty-one percent, while lifting revenue per session by twenty-two percent. Parachute Home improved the product page and payment options, raising checkout initiation by thirty-one percent and reducing abandonment by nineteen percent. Allbirds simplified guest checkout and cut load time, recovering an estimated eleven million dollars. Caraway used in-checkout recovery and buy now, pay later visibility to bring abandonment down from seventy-one percent to forty-nine percent. The lesson is simple. Fix the bottom of your funnel before you spend more on acquisition. Next, we'll look at content, paid media, and lead generation.
 1 min
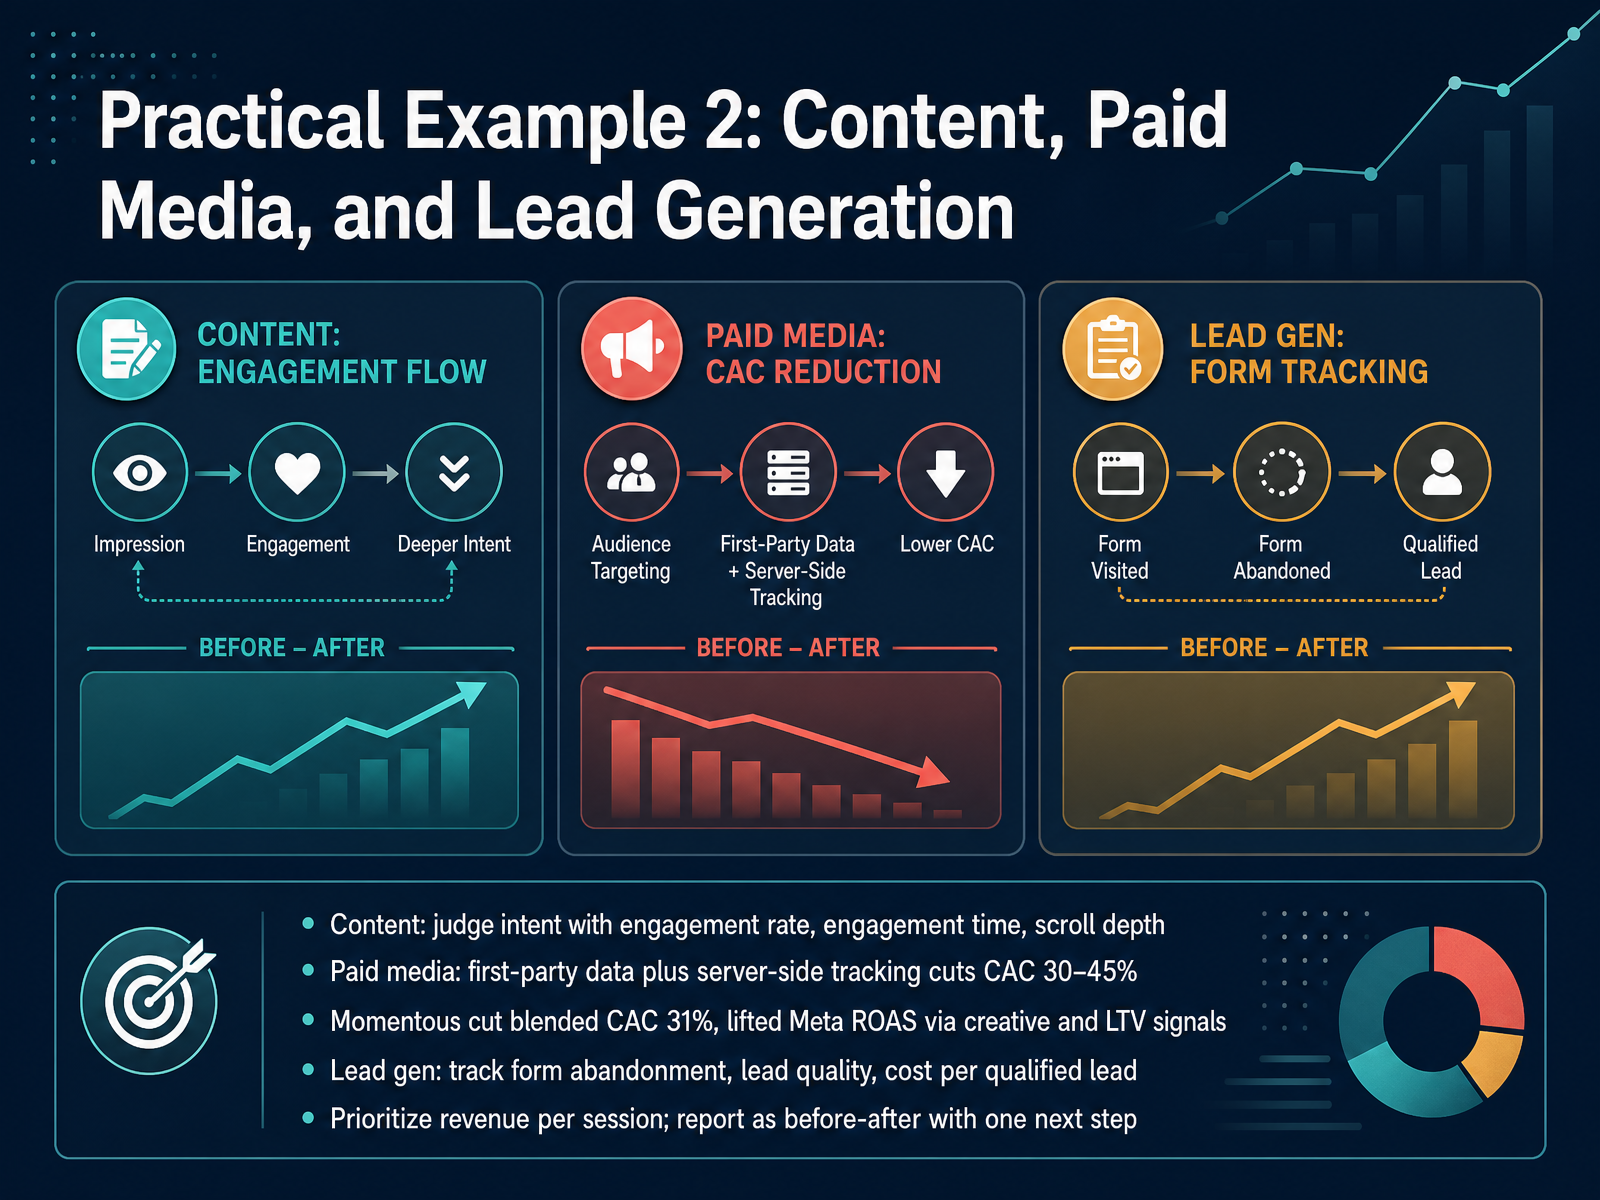
1 min - 09Practical Example 2: Content, Paid Media, and Lead GenerationNow let's put this into practice with a second example covering content, paid media, and lead generation. For content, judge intent with engagement rate, engagement time, and scroll depth. Remember, engagement rate is the share of sessions lasting ten seconds or more, with two or more page views, or with a key event. Look at those together, not in isolation. On paid media, first-party data plus server-side tracking typically cuts customer acquisition cost by thirty to forty-five percent. One good reference here is Momentous, which cut blended customer acquisition cost by thirty-one percent and lifted Meta return on ad spend by feeding creative and lifetime value signals back into the platform. For lead generation, track form abandonment, lead quality, and cost per qualified lead, not just raw form fills. Across all three, prioritize revenue per session, and report results as a simple before-and-after with one clear next step. That keeps the conversation focused on decisions, not dashboards. Let's move on to common pitfalls and data quality.
 livesession.iouxcam.comscribble.network+22 min
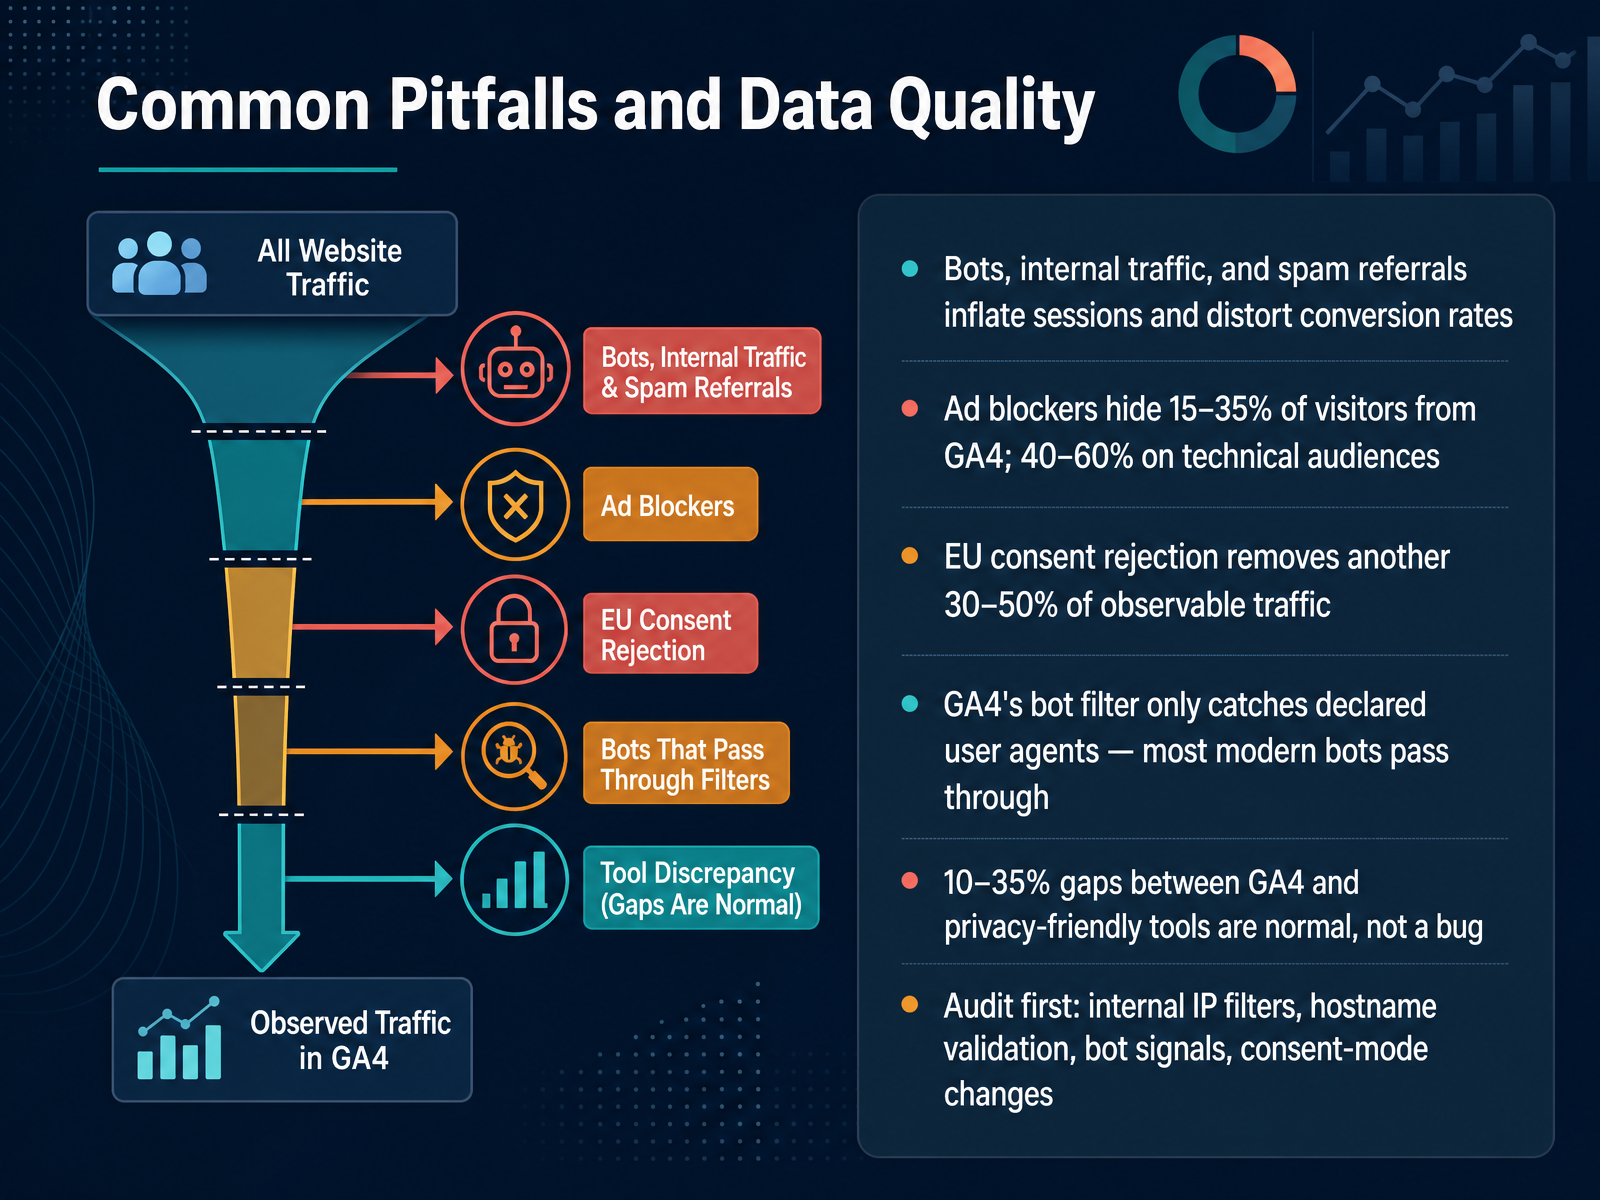
 - 10Common Pitfalls and Data QualityNext, let's talk about the pitfalls that quietly corrupt your data. Bots, internal traffic, and spam referrals inflate sessions and drag your conversion rates down. Ad blockers hide fifteen to thirty-five percent of visitors from GA4, and on technical audiences, that can reach forty to sixty percent. In the EU, consent rejection removes another thirty to fifty percent of observable traffic. GA4's bot filter only catches declared user agents, so most modern bots pass straight through. And a ten to thirty-five percent gap between GA4 and a privacy-friendly tool is normal, not a bug. So audit first. Check your internal IP filters, validate hostname, look for bot signals, and review consent-mode changes. Those four checks usually explain most of the gap. Next, we will look at privacy, consent, and the first-party data shift.
 1 min
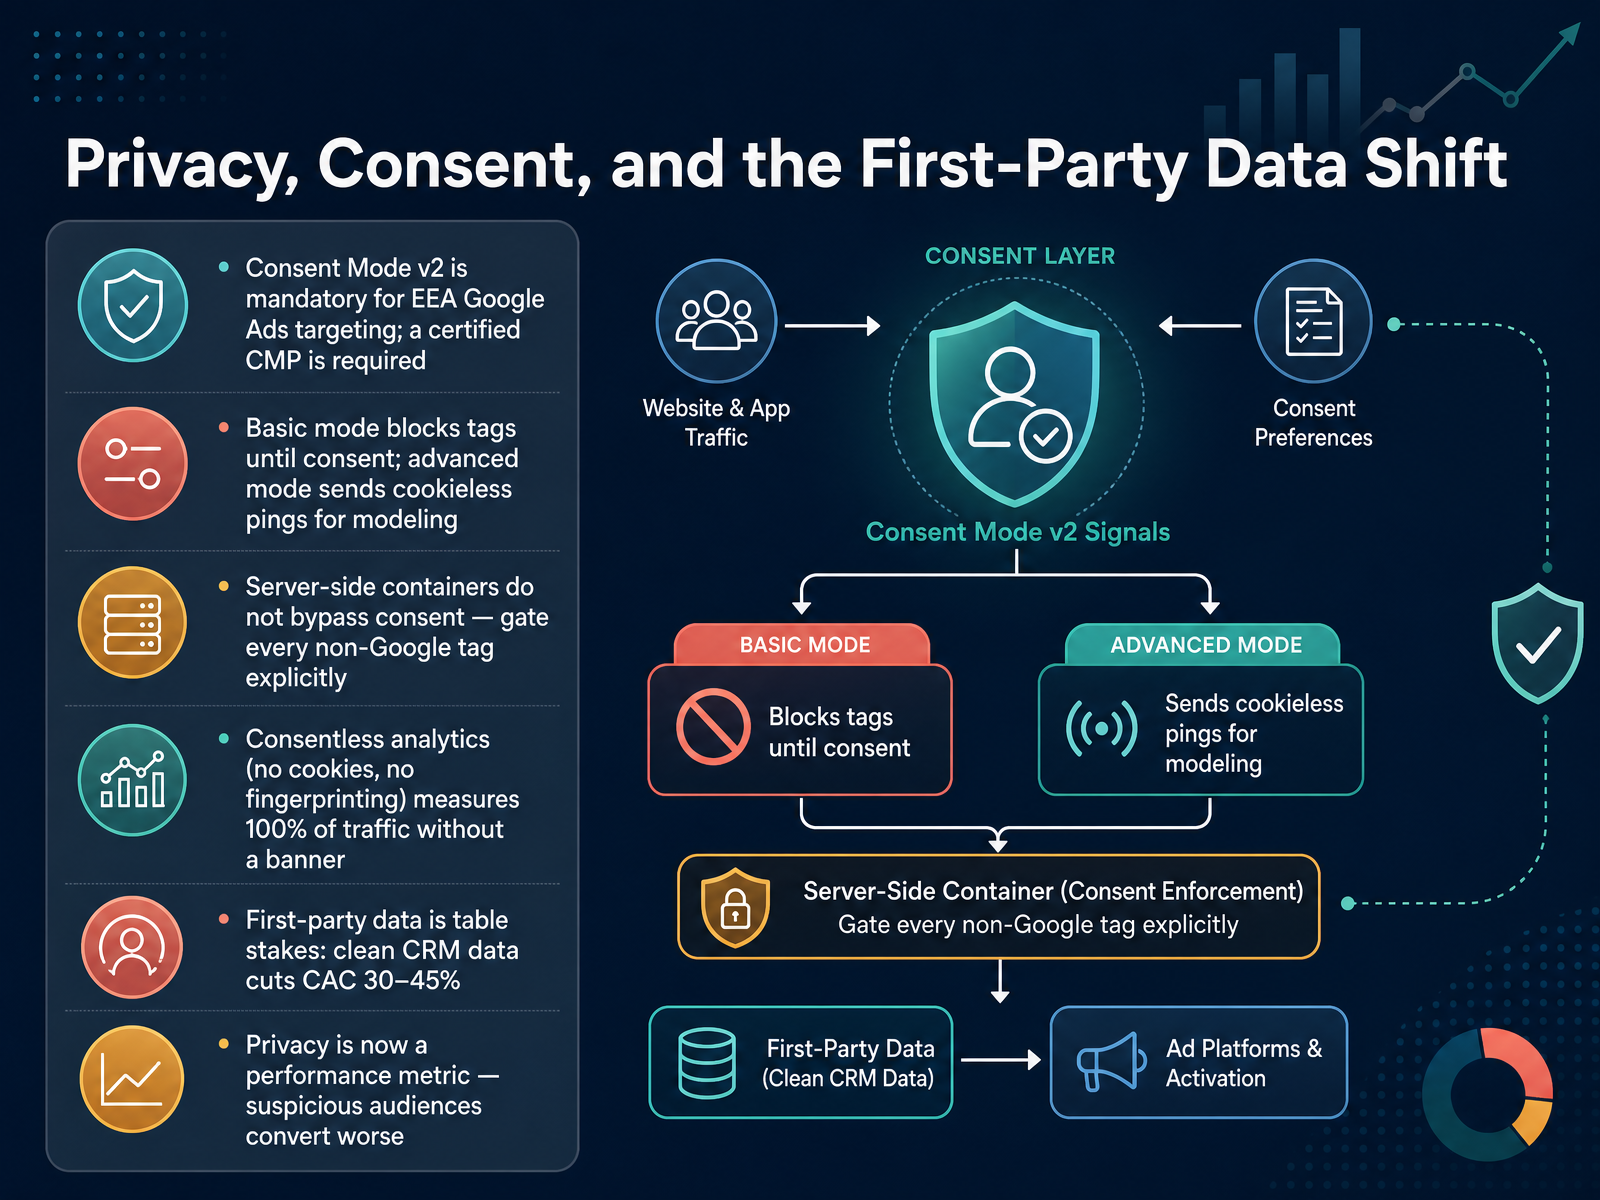
1 min - 11Privacy, Consent, and the First-Party Data ShiftNext, let's talk about privacy, consent, and the first-party data shift. In the European Economic Area, Consent Mode version two is mandatory for Google Ads targeting, and you need a certified consent management platform, or CMP. Here's the core distinction. Basic mode blocks all tags until the user consents, so you get zero data from anyone who declines. Advanced mode sends cookieless pings instead, which feed Google's modeling and help recover some of that lost signal. A common mistake is assuming server-side containers bypass consent. They do not. Google tags honor consent signals automatically, but every non-Google tag, like Meta or TikTok, must be explicitly gated. If you skip that step, you are sending data for users who said no. There's also a smart alternative for measurement. Consentless analytics uses no cookies, no fingerprinting, and no personal identifiers, so it does not require a banner and still measures one hundred percent of your traffic. Finally, first-party data is now table stakes. Clean CRM data can cut customer acquisition cost by thirty to forty five percent, and privacy is a genuine performance metric. Suspicious audiences simply convert worse. So audit your consent setup and gate every tag. Coming up next, AI, Automation, and What Is Changing in 2026.
 2 min
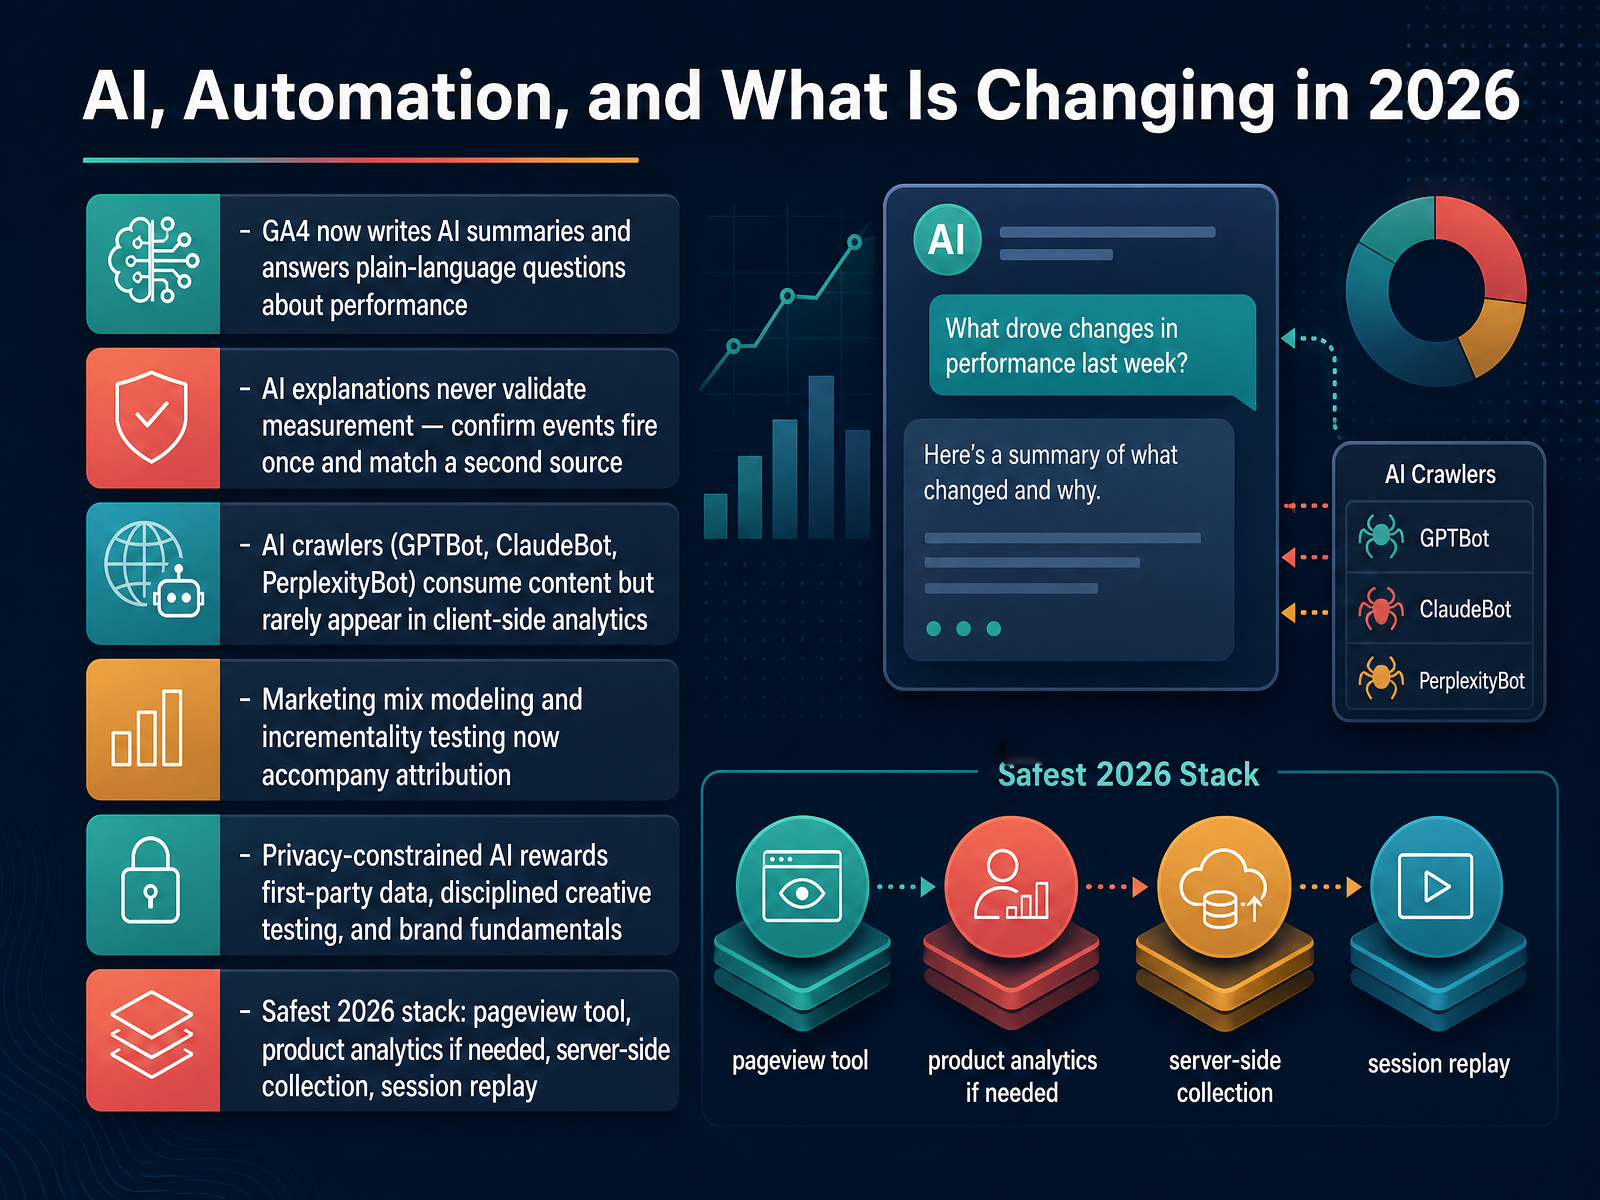
2 min - 12AI, Automation, and What Is Changing in 2026Let's talk about what is actually changing in 2026. First, GA4 now writes AI summaries and answers plain-language questions about performance. That is genuinely useful. But here is the catch. An AI explanation never validates your measurement. It sounds equally confident whether your tracking is clean or your conversion event has been double firing since June. So before you act, confirm three things. Events fire once and map to the right action. Your date range and attribution setting match what you meant. And the number roughly agrees with a second source, like your CRM. Second, AI crawlers such as GPTBot, ClaudeBot, and PerplexityBot consume your content but rarely appear in client-side analytics. They live in server logs. Third, attribution alone is no longer enough. Marketing mix modeling and incrementality testing now sit alongside it. Fourth, privacy-constrained AI rewards first-party data, disciplined creative testing, and brand fundamentals. And the safest 2026 stack looks like this. A pageview tool, product analytics if you need it, server-side collection, and session replay. Next, let's put this into practice with a hands-on audit.
 livesession.iouxcam.comscribble.network+22 min
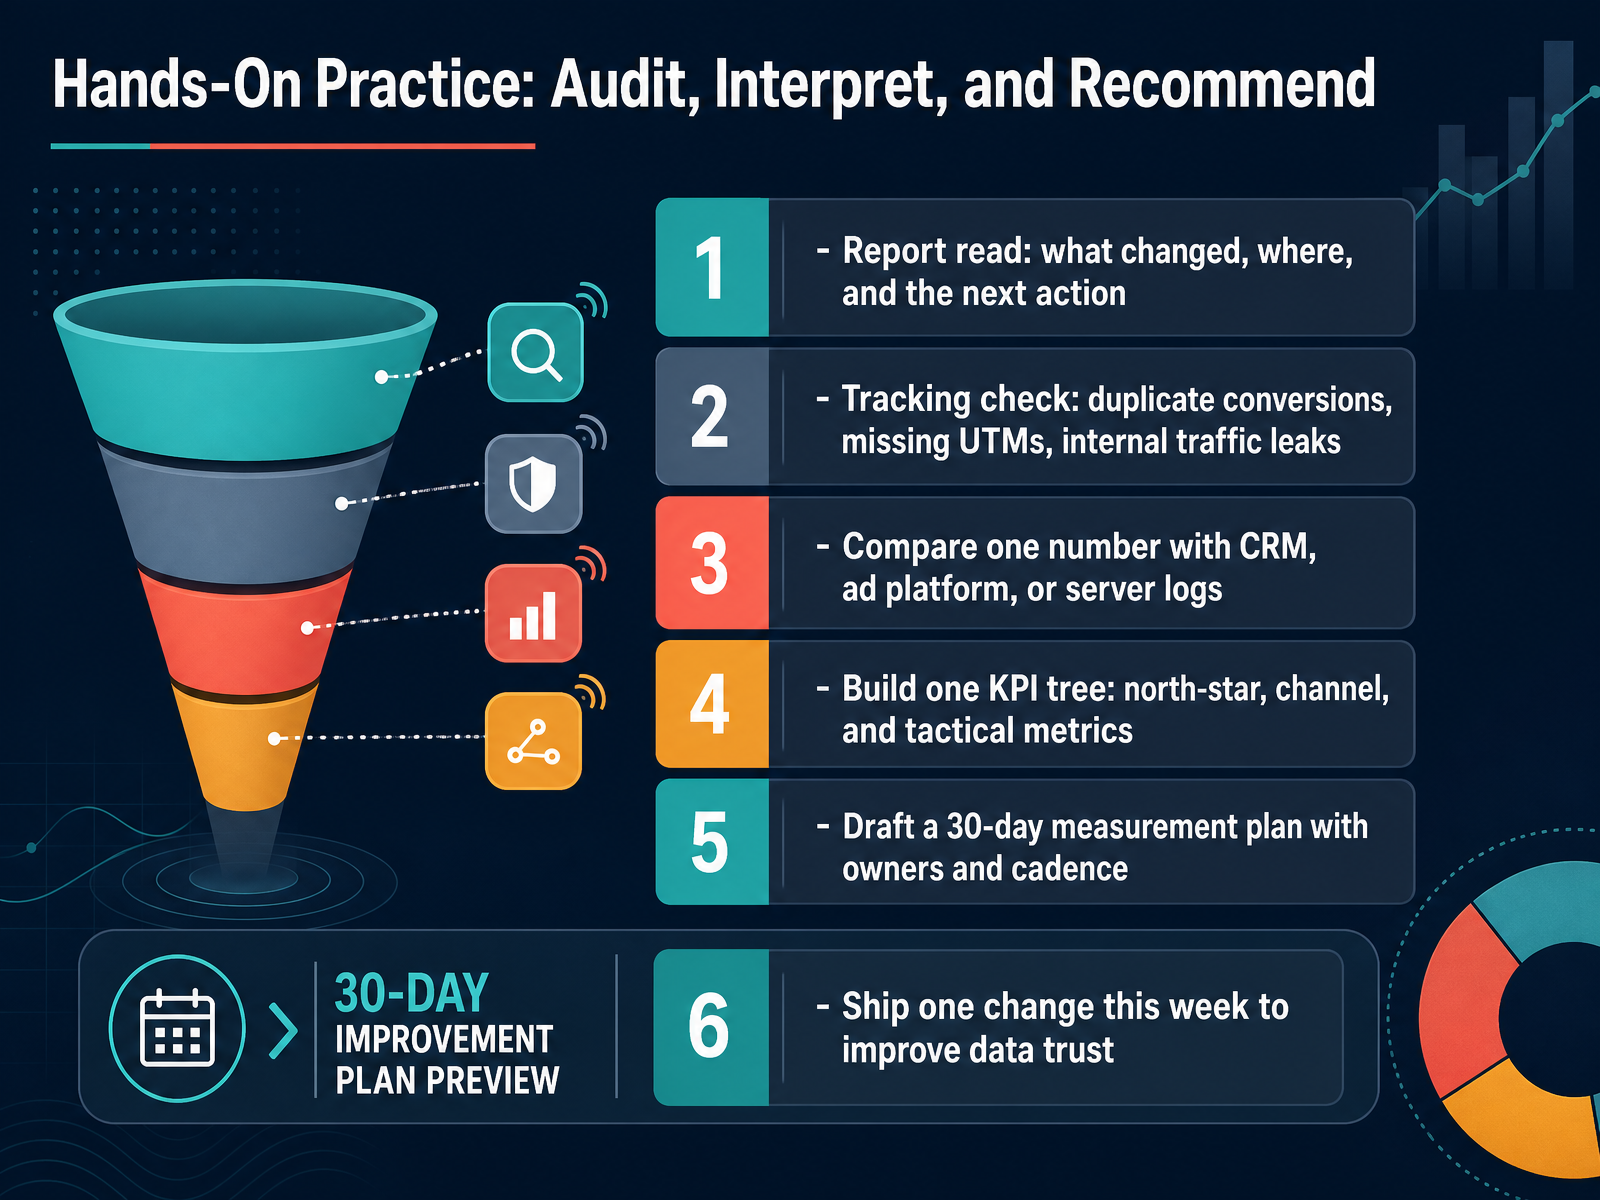
 - 13Hands-On Practice: Audit, Interpret, and RecommendNow let's put this into practice with a short audit routine you can run this week. Start with the report read. Ask three questions. What changed, where did it change, and what is the next action? Then check your tracking. Look for duplicate conversions, missing UTMs, and internal traffic leaking into your reports. Next, take one number and compare it with a second source, like your C R M, an ad platform, or server logs. If they disagree, fix tracking before you trust the story. Then build one K P I tree. Your north-star metric at the top, channel metrics in the middle, tactical metrics at the bottom. Write a thirty-day measurement plan with owners and a review cadence. And ship one change this week that improves data trust. Next, let's look at next steps, learning paths, and resources.
 livesession.iouxcam.comscribble.network+21 min
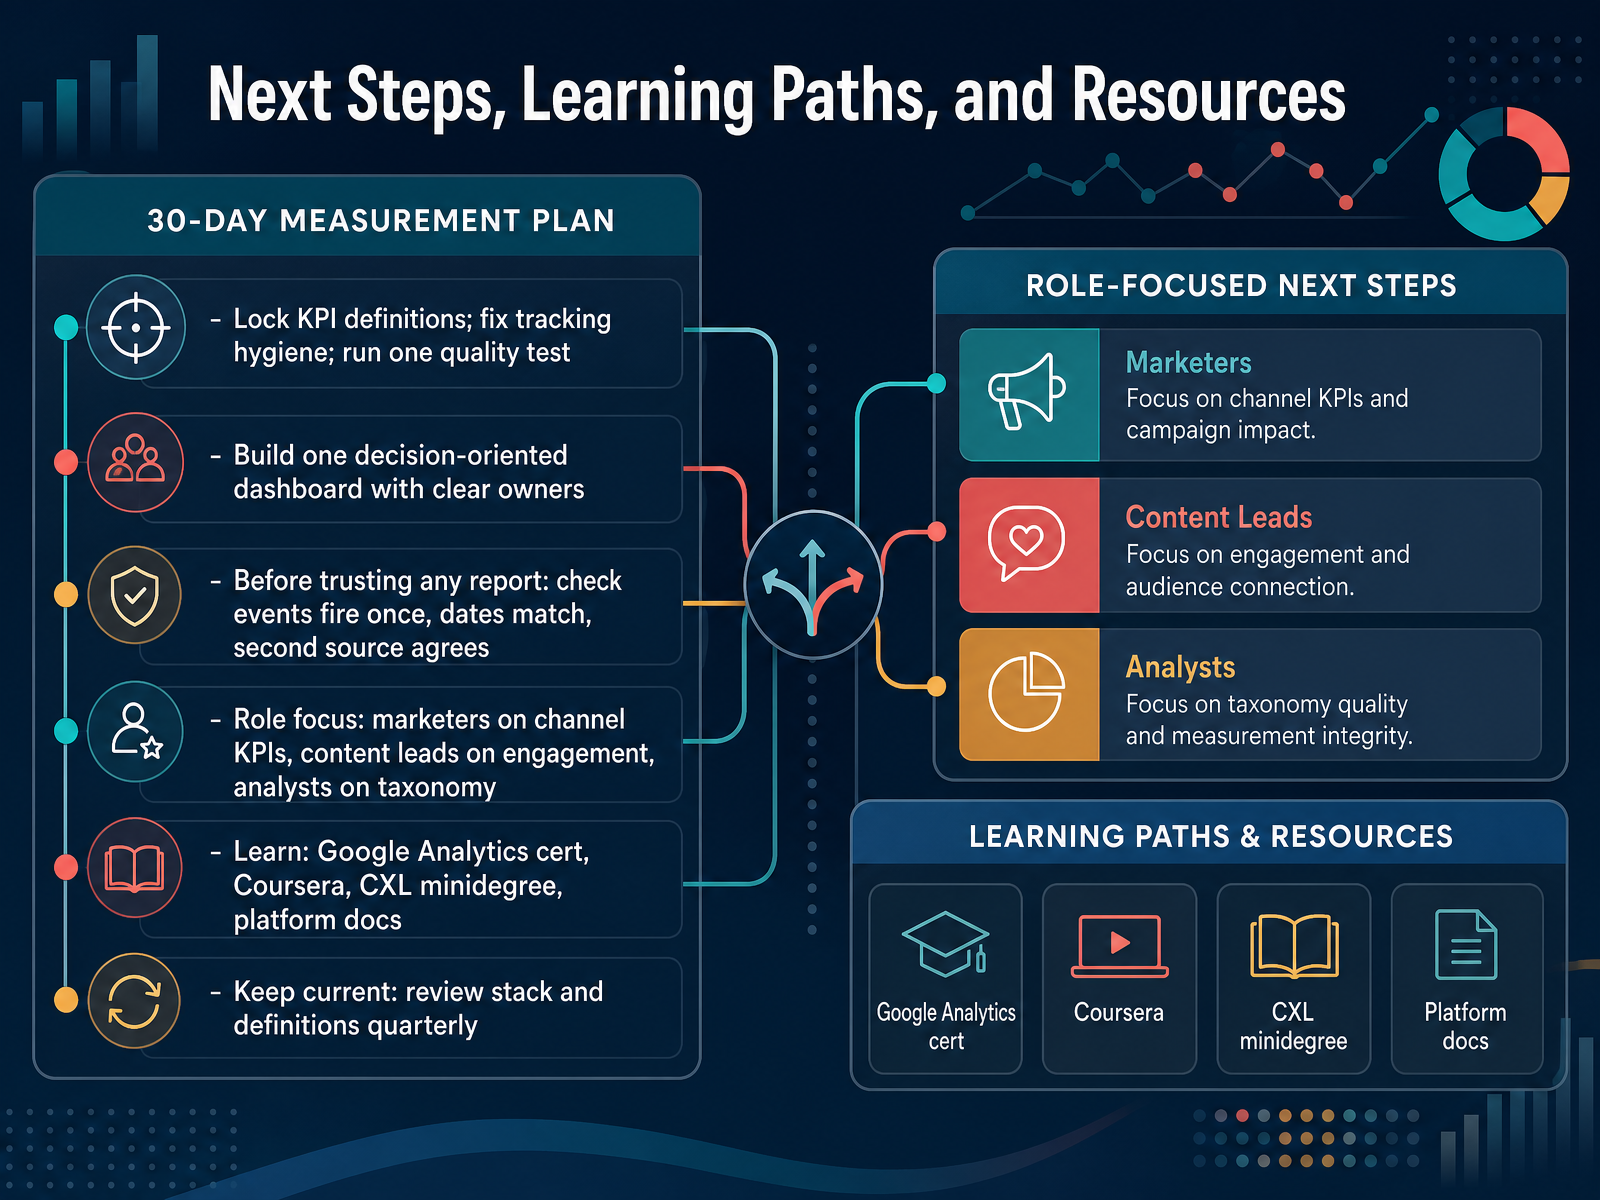
 - 14Next Steps, Learning Paths, and ResourcesSo let's land this. You don't need a perfect analytics stack to start. You need four moves. First, lock your KPI definitions, fix tracking hygiene, and run one quality test. Second, build one decision-oriented dashboard with a clear owner. Before you trust any report, check three things: events fire once, dates match, and a second source agrees, like your C R M or payment dashboard. Assign role focus too. Marketers own channel K P Is, content leads own engagement, analysts own taxonomy. For learning, the Google Analytics certification is your fastest win. Coursera, the C X L mini degree, and platform docs go deeper. And keep this current. Review your stack and definitions every quarter, because tracking drifts quietly, and old logic can make clean numbers lie. You now know what web analytics is, why it matters, and how to act on it. Thank you for sticking with me through all fourteen slides. Take one of those four moves this week, fix a definition, test an event, ship a dashboard, and let the data earn its keep. You've got this.
 trackingplan.comthegray.companymodelreef.io+22 min
Take the deck with you
Download this course as a file — free, no sign-up needed.
- PDF handoutEvery slide page, ready to print or share.15 pages · 3.9 MBDownload
- Narrated PowerPointThe deck that presents itself — every slide carries the digital human's narration video.15 pages · 16.1 MBDownload
- PowerPoint slidesThe full deck as a .pptx — open it in PowerPoint, Keynote, or Google Slides.15 pages · 3.8 MBDownload
Free to use in your own training — please keep the PersonWise credit page at the end.
Have your own deck? Turn it into a course
Sources consulted
Web sources consulted while building this course.
- What is web analytics? | Definition from TechTarget — techtarget.com
- Web analytics — en.wikipedia.org
- What is Web Analytics and Why Is It Important in 2026? — contentsquare.com
- What is web analytics? How it works, metrics & tools — usermaven.com
- Web Analytics Guide 2026: GA4, Tools & Setup — valiotti.com
- 10 Best Web Analytics Tools in 2026 (Tested and Compared) — bootstrap.build
- GA4 Alternatives in 2026: An Honest Comparison | Murtaza Rangwala — murtazarangwala.com
- Best Google Analytics Alternatives in 2026 (Plausible, Fathom, Matomo & More) — DataSaaS — datasaas.co
- Best Web Analytics Tools 2026 Q1 — 35 Tested… | TopChoiceFor — topchoicefor.com
- 9 Best Google Analytics Alternatives in 2026 (Free & Paid, Compared) | CodeIllusion — codeillusion.io
- Build a marketing measurement plan that drives results | Trackingplan — trackingplan.com
- How to Create a Marketing Measurement Plan (Template Included!) — thegray.company
- Marketing Measurement Framework | Model Reef — modelreef.io
- UPDATED TwG_CMO_CFO_Media_Effectiveness_Guide — thinkwithgoogle.com
- Digital Marketing and Measurement Model: Web Analytics — kaushik.net
- How to Create a Web Analytics Report That Actually Drives Decisions | LiveSession — livesession.io
- Web Analytics Reporting Best Practices and Example ... — uxcam.com
- How to Analyze Google Analytics & Google Ads Data in 2026 — scribble.network
- The Ultimate Google Analytics 4 Reporting Guide: Turning Data into ROI in 2026 — we-interactive.com
- How to Interpret Google Analytics 4 Data Like a Pr |... — influenceflow.io