Begin
14 pages · ~28 min
Marketing Analytics Learning Workflow
Learn a practical workflow for marketing analytics, from data to insights, designed for marketers and analysts who want to build job-ready analytics skills.
A digital instructor presents all 14 pages. Hold “Ask” at any point and ask out loud — the answer comes from this course. No sign-up needed.
What you’ll learn
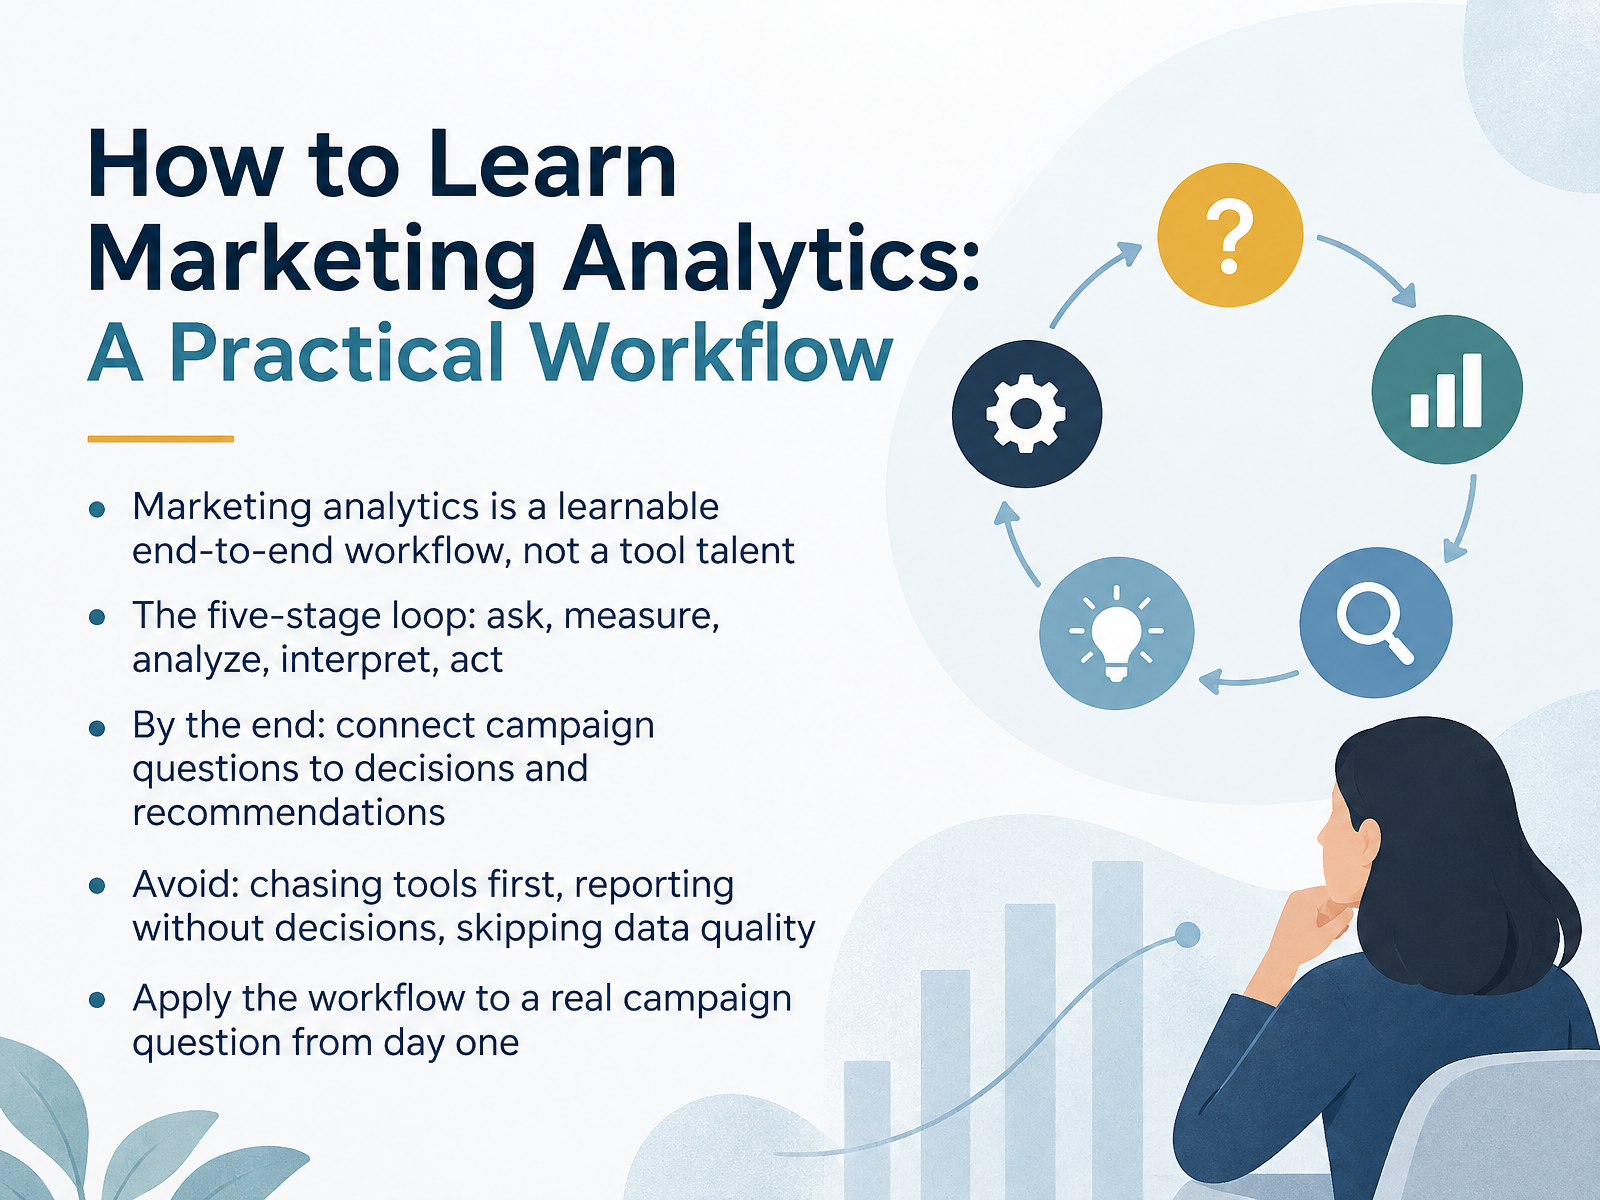
- 01How to Learn Marketing Analytics: A Practical WorkflowWelcome. I'm glad you're here, because marketing analytics is one of those skills people assume they need a special talent for. You don't. It's a learnable end-to-end workflow, not a tool or a personality trait. In this course, we'll walk through a five-stage loop: ask, measure, analyze, interpret, and act. By the end, you'll be able to connect a real campaign question to a clear decision and a recommendation. Along the way, we'll avoid three common traps: chasing tools before questions, reporting without a decision attached, and skipping data quality checks. Here's your first instruction. Pick one campaign question you're facing this week, such as which channel deserves the next dollar, and keep it beside you as we go. Now let's look at the five-stage workflow at a glance.kingdatalab.comgithub.commeasureu.com+22 min
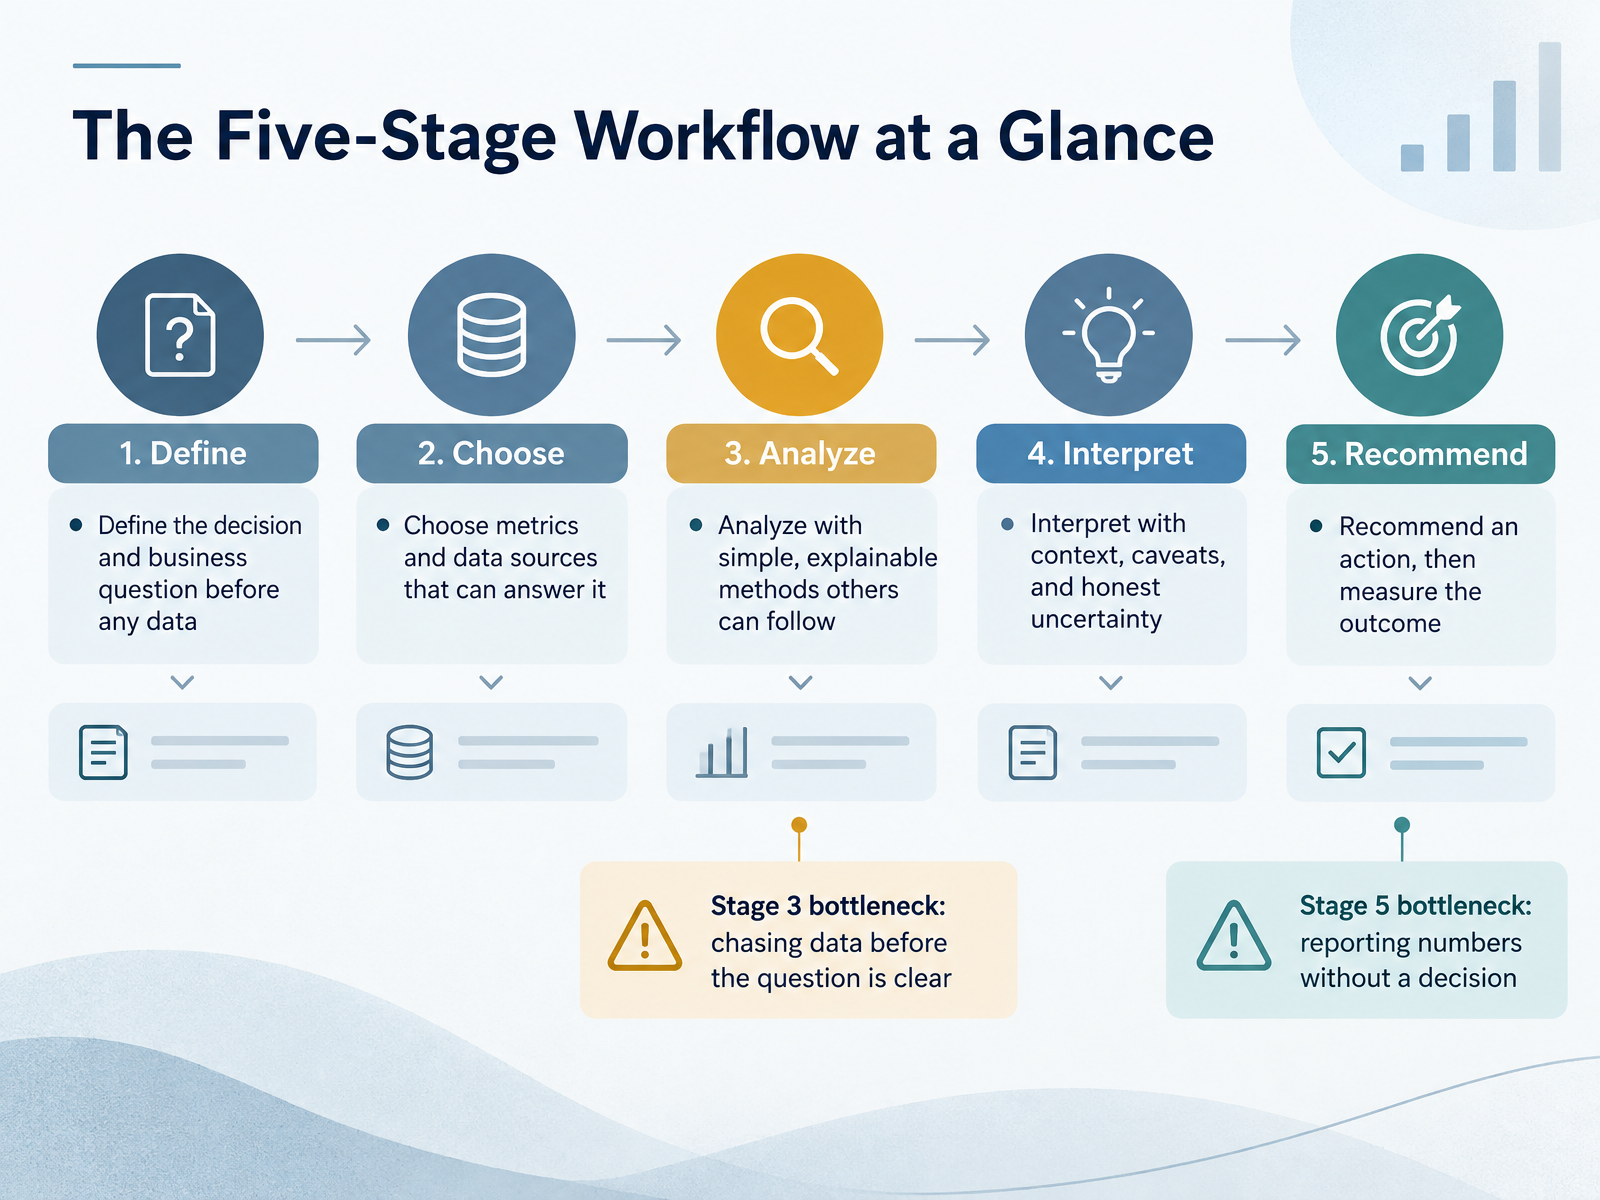
- 02The Five-Stage Workflow at a GlanceLet's look at the full workflow, so you can see where each step fits. It has five stages. First, define the decision and business question before you touch any data. Second, choose the metrics and data sources that can actually answer it. Third, analyze with simple, explainable methods others can follow. Fourth, interpret with context, caveats, and honest uncertainty. Fifth, recommend an action, then measure the outcome. Two bottlenecks catch most teams. Stage three fails when people chase data before the question is clear. Stage five fails when reports show numbers without a decision attached. Here is a workplace example. A team asks which channel to fund next quarter. That decision drives the metric, the data pull, and the recommendation. A good test is simple. If a number cannot change a decision, it probably does not belong on the first page. Keep the chain visible: question, data, decision. Now let's start with the decision, not the dashboard.
 kingdatalab.comgithub.commeasureu.com+22 min
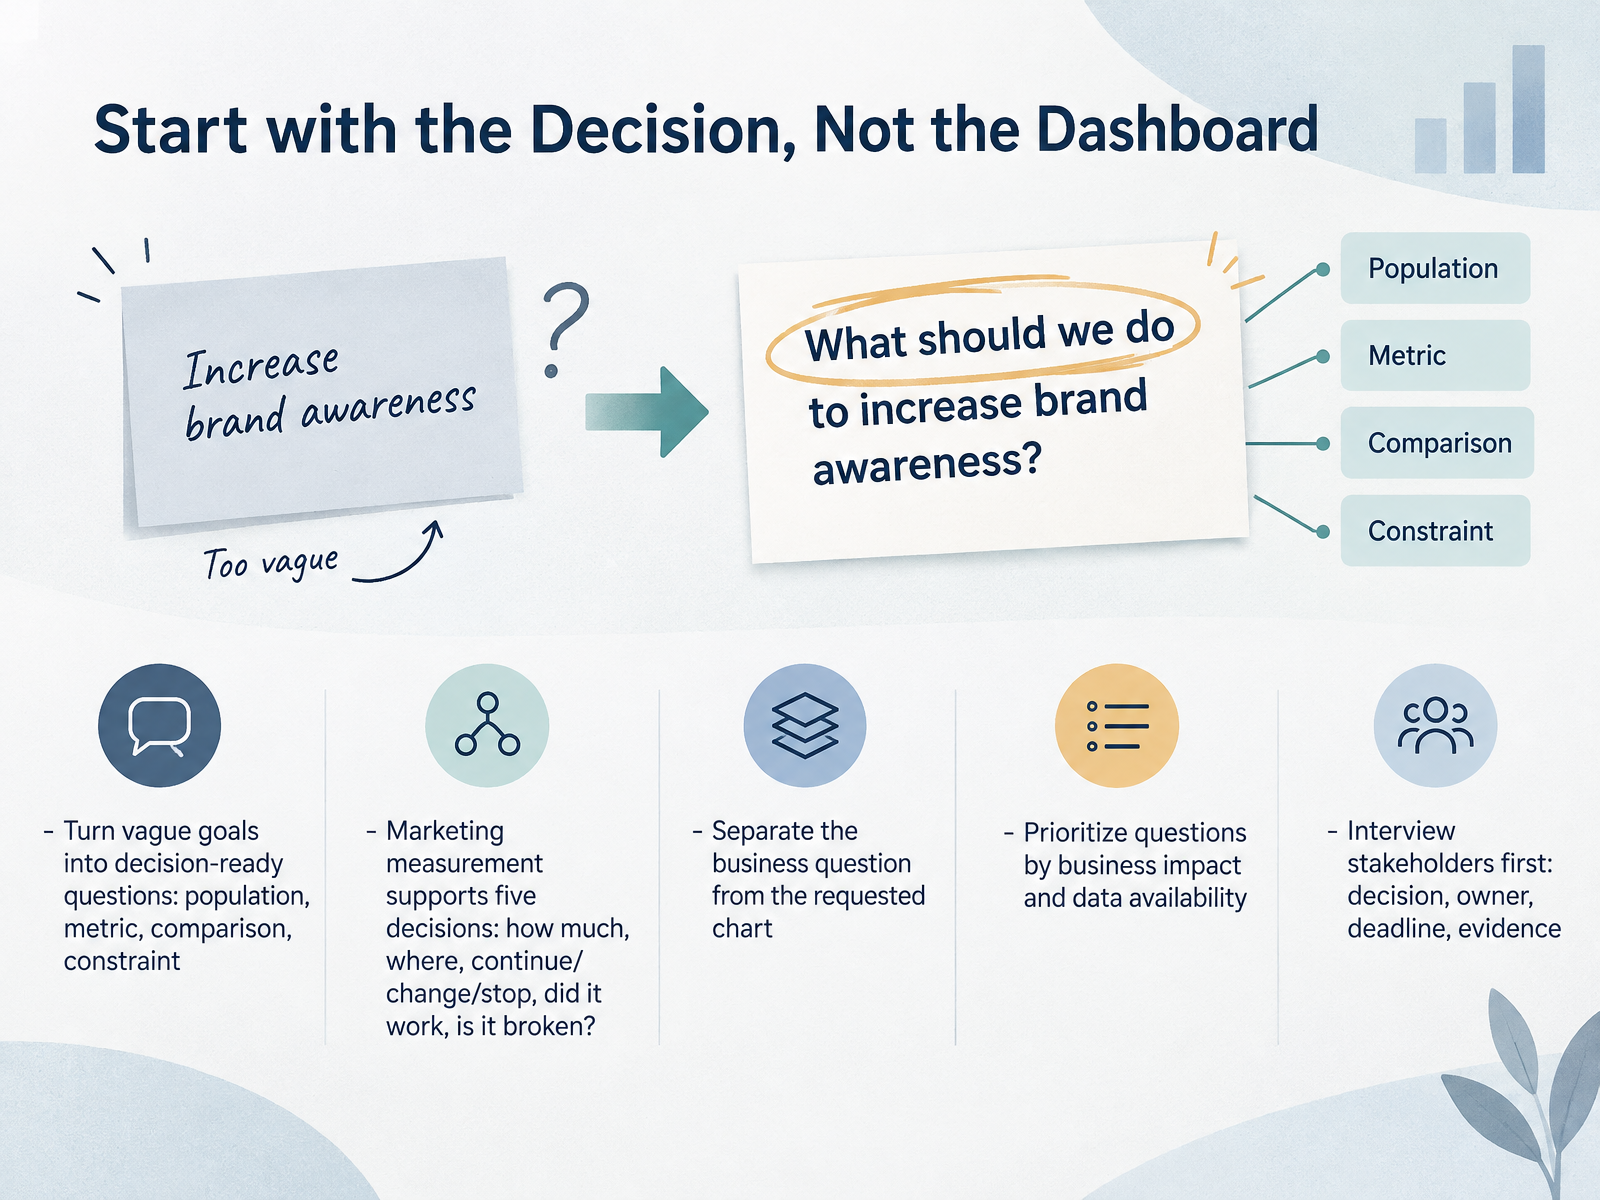
- 03Start with the Decision, Not the DashboardNow let's talk about where the analytics workflow really begins. Start with the decision, not the dashboard. A vague goal like grow the business is not answerable. Turn it into a decision-ready question that names the population, the metric, the comparison, and the constraint. For example, is our acquisition of new customers increasing at a cost our margin can support? Marketing measurement supports five decisions: how much to spend, where to spend it, whether to continue, change, or stop an activity, whether a change worked, and whether something is broken. Next, separate the business question from the chart someone requested. If you are new to analytics, that separation can feel unclear, and that is normal. Ask what action the number would change. Then prioritize questions by business impact and data availability. Finally, interview stakeholders first, and confirm the decision, the owner, the deadline, and the evidence needed. That short conversation saves weeks of reporting. Next, we will look at Metrics and Data Sources: Building Your Measurement Map.
 kingdatalab.comgithub.commeasureu.com+22 min
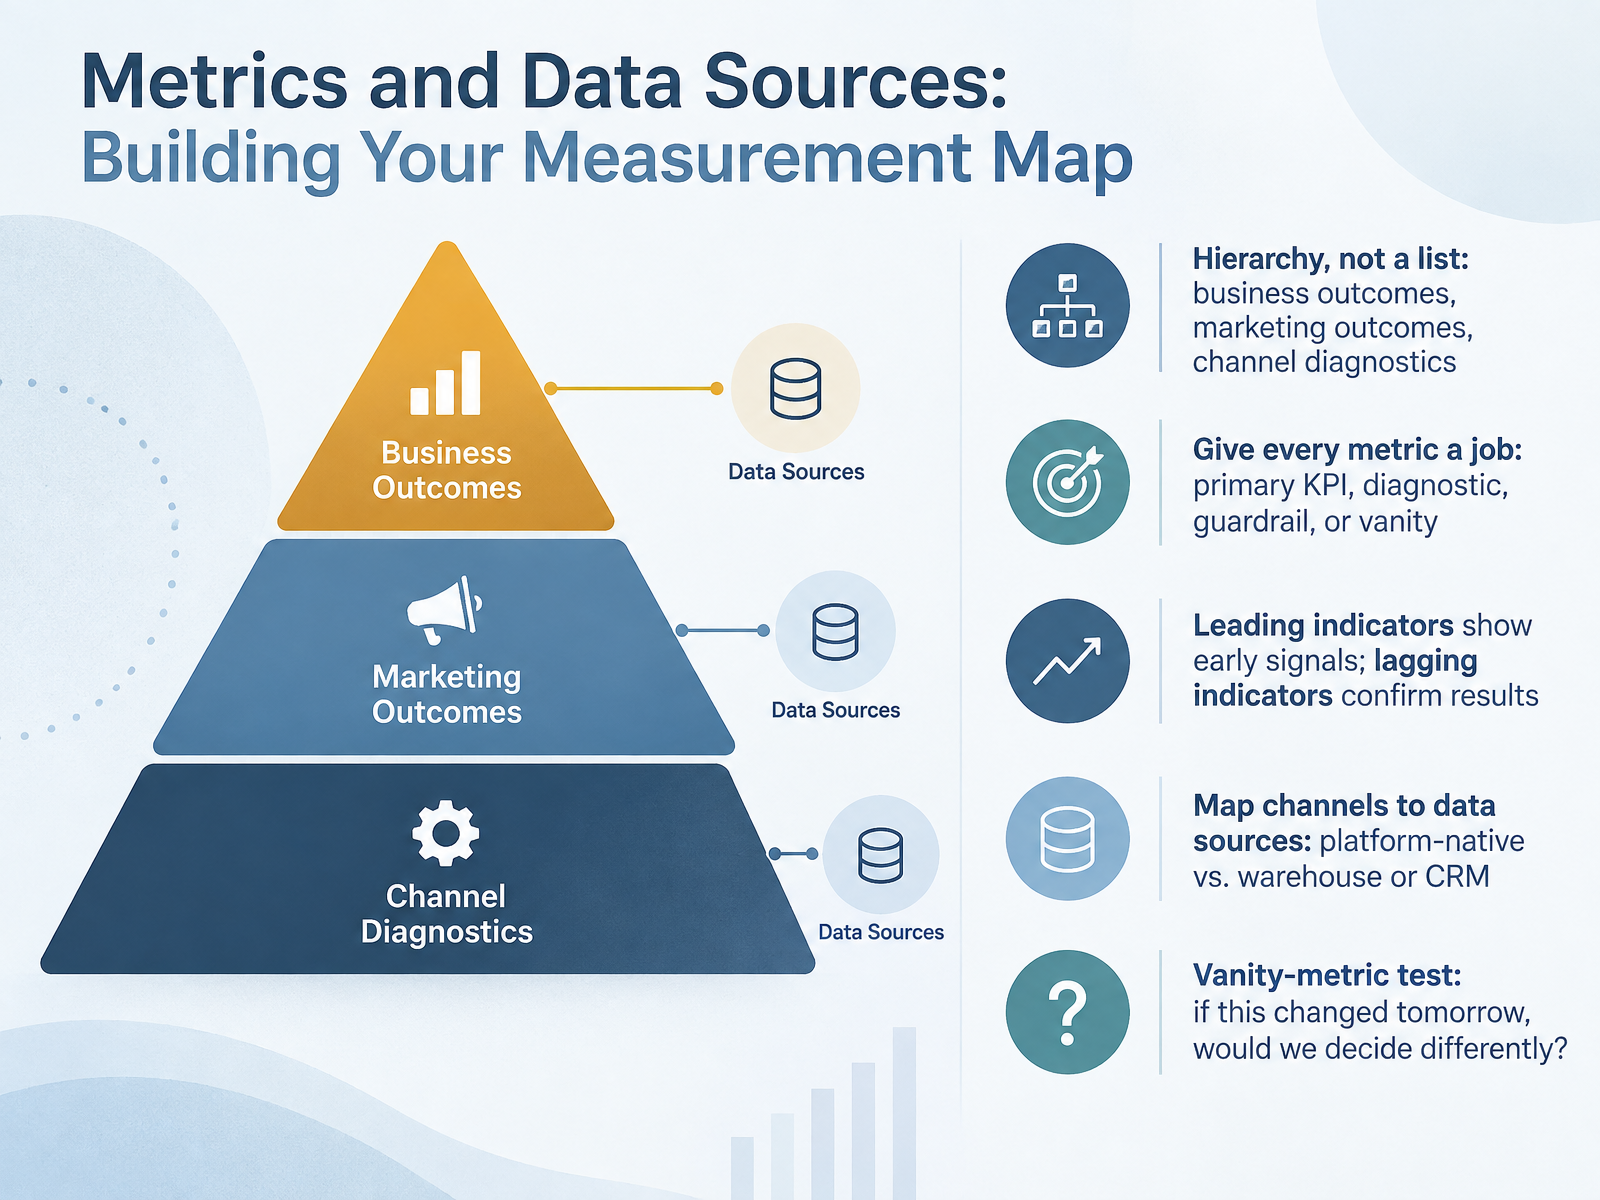
- 04Metrics and Data Sources: Building Your Measurement MapNow let's build your measurement map. Think hierarchy, not a list. Business outcomes sit at the top, marketing outcomes come next, and channel diagnostics sit at the bottom. For example, revenue at the top, cost per lead in the middle, click-through rate below. Next, give every metric a job. It can be a primary KPI, a diagnostic, a guardrail, or a vanity metric. A guardrail protects you from winning badly, like rising unsubscribe rates. Then separate leading from lagging indicators. Leading indicators show early signals, such as demo requests. Lagging indicators confirm results, such as closed revenue. Finally, map each channel to its data source, whether platform-native or your warehouse or CRM. And apply the vanity-metric test. If this changed tomorrow, would we decide differently? If not, demote it. Pause here and assign one job to each metric on your map. Next, we'll cover data quality and tracking basics.
 umbrex.comsmokesignal.techgtmtools.io+22 min
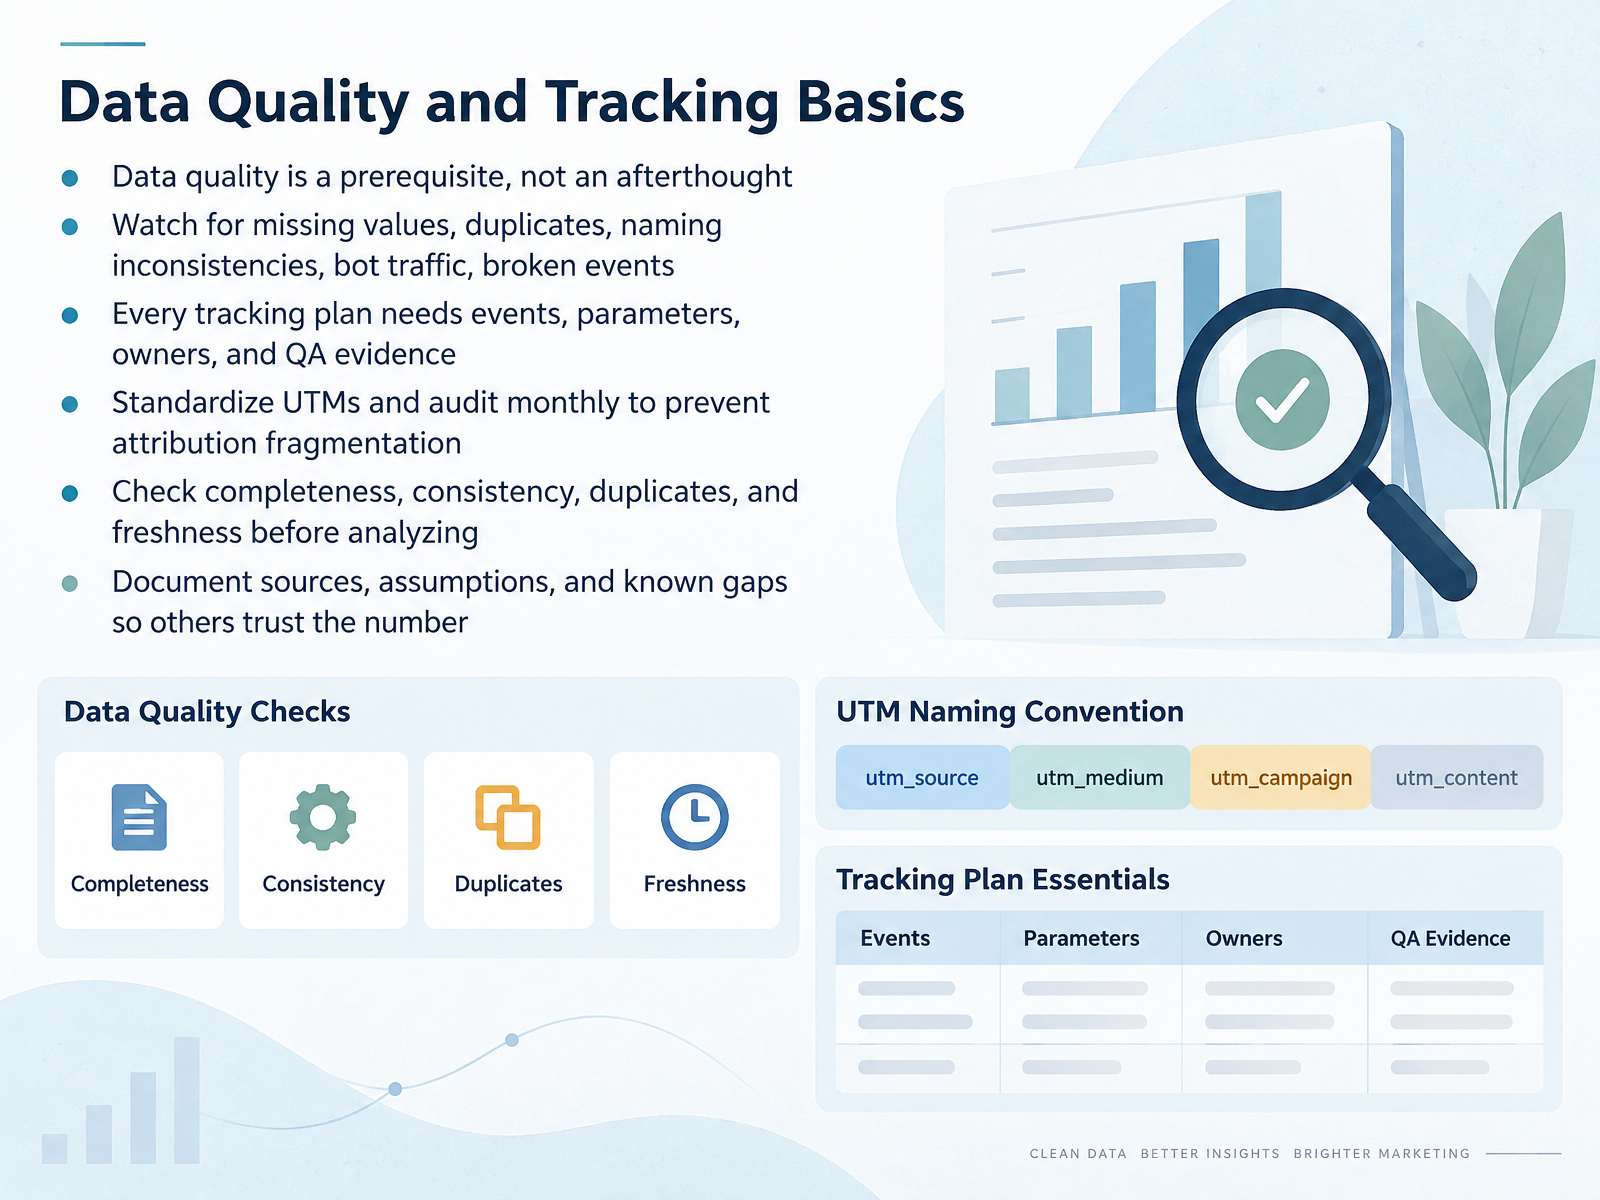
- 05Data Quality and Tracking BasicsNext, let's talk about data quality and tracking basics. Data quality is a prerequisite, not an afterthought. If you feel unsure about analytics, that's normal, and the fix is concrete: check your data before you trust any number. Watch for missing values, duplicate records, naming inconsistencies, bot traffic, and broken events. For example, if Facebook and facebook appear as two sources, your attribution splits. Every tracking plan needs four things: events, parameters, owners, and QA evidence. Standardize your UTM parameters, then audit them monthly to prevent attribution fragmentation. Before you analyze, check completeness, consistency, duplicates, and freshness. Finally, document your sources, assumptions, and known gaps so others trust the number. That documentation is what turns a spreadsheet into evidence. Next, we'll look at core analysis moves for marketers.
 trackingplan.comtrackingplan.comcutt.ly+21 min
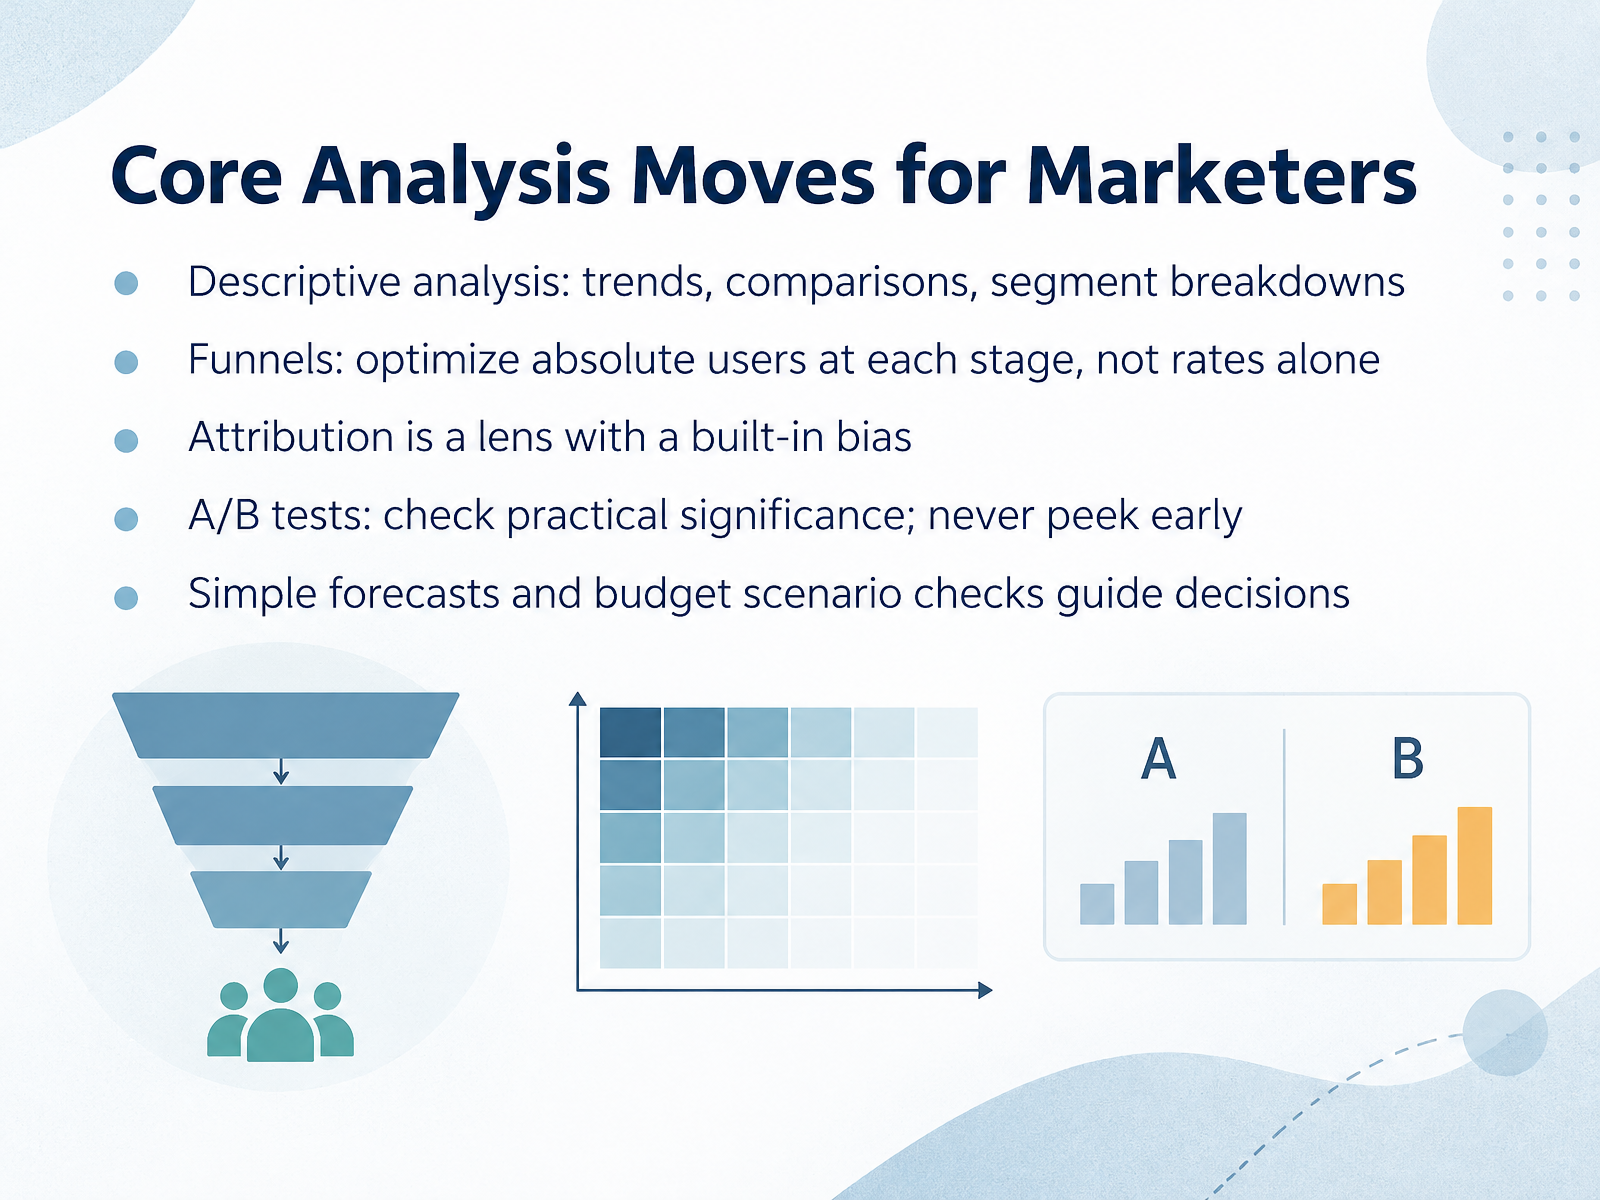
- 06Core Analysis Moves for MarketersNow let's walk through the core analysis moves you will use most often as a marketer. First, descriptive analysis: calculate trends over time, compare channels, and break results down by segment. For example, compare conversion rates for new versus returning visitors. Second, funnels. Optimize the absolute number of users reaching each stage, not just the rates. A lower signup rate can still mean more activated users. If analytics feels fuzzy here, start with one funnel and count real users, stage by stage. Third, treat attribution as a lens with a built-in bias. Last-click credits closing, first-click credits discovery, so never cut budget on a single model alone. Fourth, in A/B tests, check practical significance, meaning whether the lift is large enough to matter for the business, and never peek early or stop the moment results look good. Fifth, use simple forecasts and budget scenario checks to guide decisions, such as modeling a ten percent spend shift before committing. Next, we will look at reading evidence honestly when your numbers disagree.
 marketing-mix.netmeasured.comcheapmmm.com+22 min
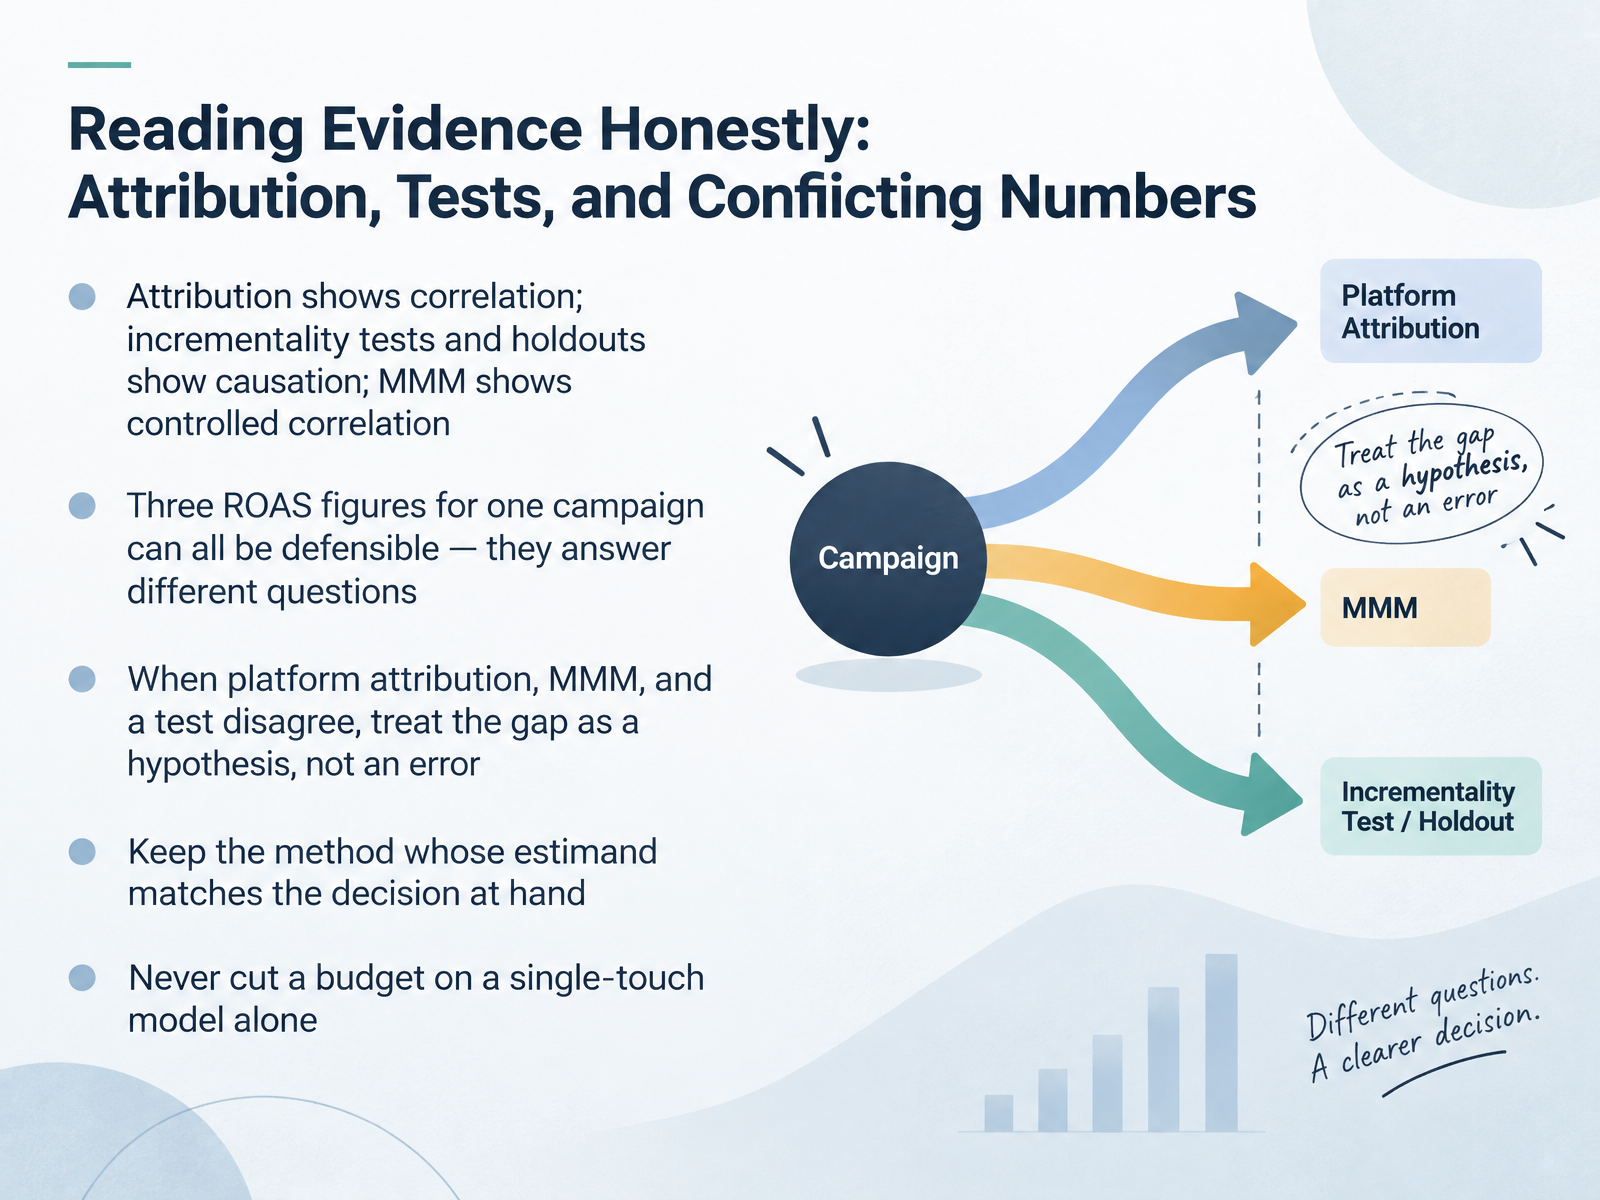
- 07Reading Evidence Honestly: Attribution, Tests, and Conflicting NumbersNext, let's talk about reading evidence honestly. Attribution shows correlation, meaning which channels customers touched before converting. Incrementality tests and holdouts show causation, meaning what would have happened without the ad. Marketing mix modeling shows controlled correlation.
Here's the key point. Three ROAS figures for one campaign can all be defensible, because they answer different questions. For example, a search campaign might show an attributed ROAS of 6.2, an incremental ROAS of 1.8 from a holdout test, and an MMM ROAS of 2.4. None of these is automatically wrong.
When platform attribution, MMM, and a test disagree, treat the gap as a hypothesis, not an error. Keep the method whose estimand matches the decision at hand. That means asking what effect, on whom, compared to what, and for which decision. And never cut a budget based on a single-touch model alone.
So the practical habit is simple. Match the method to the question, then compare results with care. From here, we'll look at how to take these findings and turn them into recommendations.
 marketing-mix.netmeasured.comcheapmmm.com+22 min
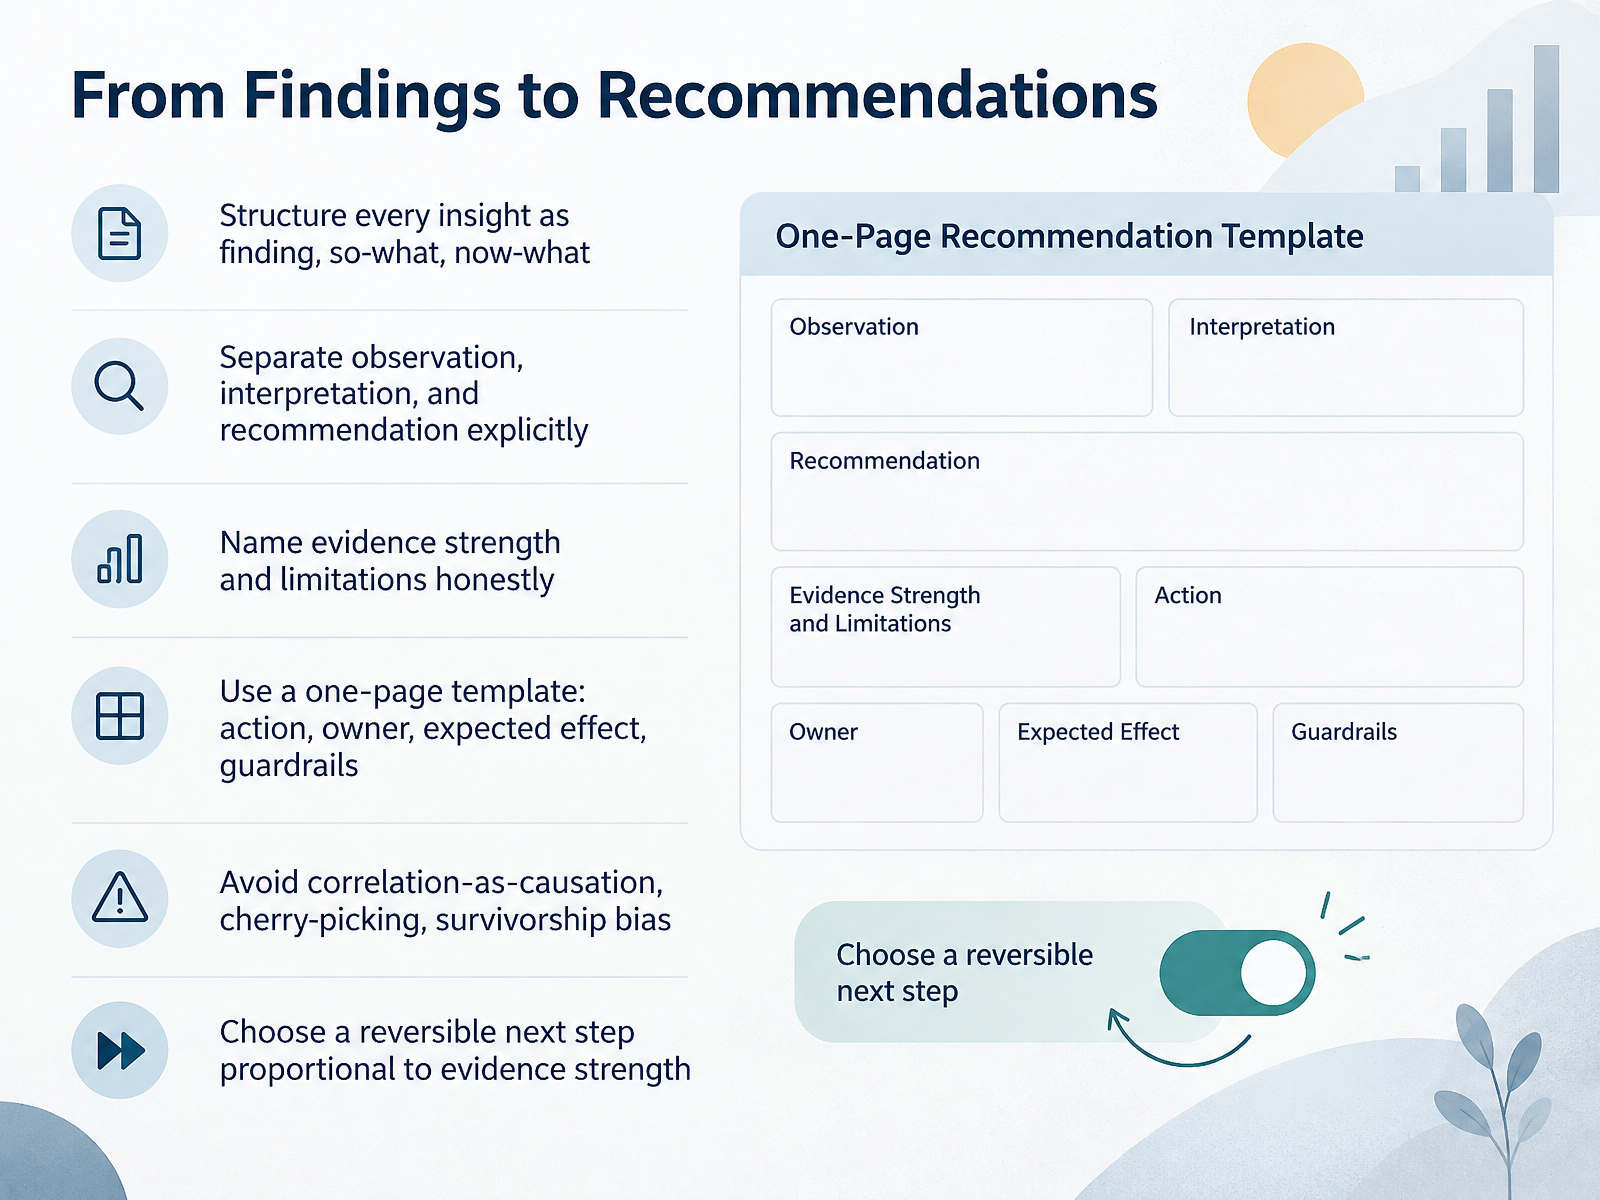
- 08From Findings to RecommendationsNow let's turn your findings into recommendations. Structure every insight in three parts: the finding, the so-what, and the now-what. For example: landing page conversions dropped twelve percent, which puts pipeline at risk this quarter, so we will test a shorter form. Keep observation, interpretation, and recommendation separate and clearly labeled. Name your evidence strength and limitations honestly. Then fill a one-page template: action, owner, expected effect, and guardrails. Avoid common traps like treating correlation as causation, cherry-picking results, and survivorship bias. Finally, choose a reversible next step proportional to your evidence. If you feel unsure about making recommendations, start with a small test you can undo. Next, we will apply this in the Practice Loop: Build a Portfolio Workflow Project.
 kingdatalab.comgithub.commeasureu.com+21 min
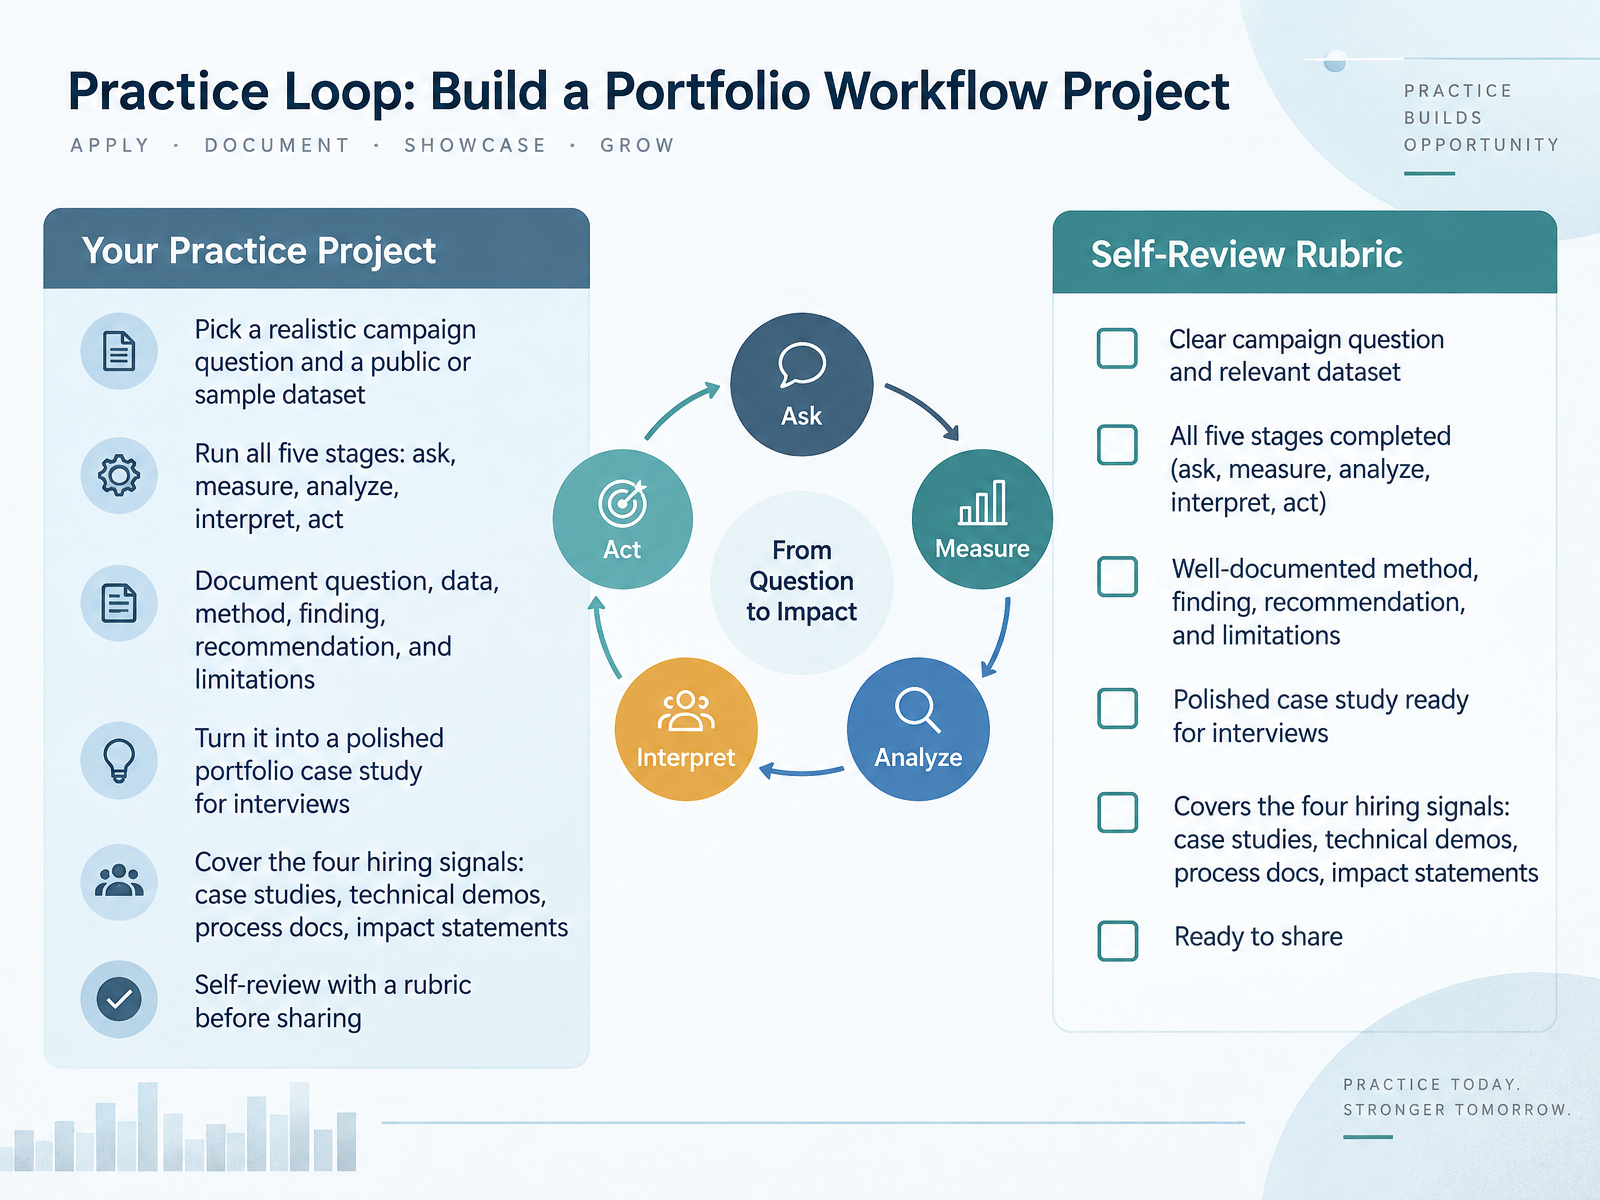
- 09Practice Loop: Build a Portfolio Workflow ProjectNow let's put the workflow into practice by building a portfolio project. Start by choosing a realistic campaign question and a public or sample dataset, such as a Kaggle campaign performance file. Then run all five stages in order: ask, measure, analyze, interpret, and act. As you go, document six things: the question, the data, the method, the finding, the recommendation, and the limitations. If you feel unsure whether your work is good enough, remember that a clear process matters more than a perfect result. Next, turn the project into a polished case study for interviews. Make sure it covers the four hiring signals: case studies, technical demos, process documentation, and impact statements. Finally, self-review against a rubric before you share it. That short loop turns practice into proof of your ability. Next, we'll look at tools and a ninety-day learning roadmap.
 2 min
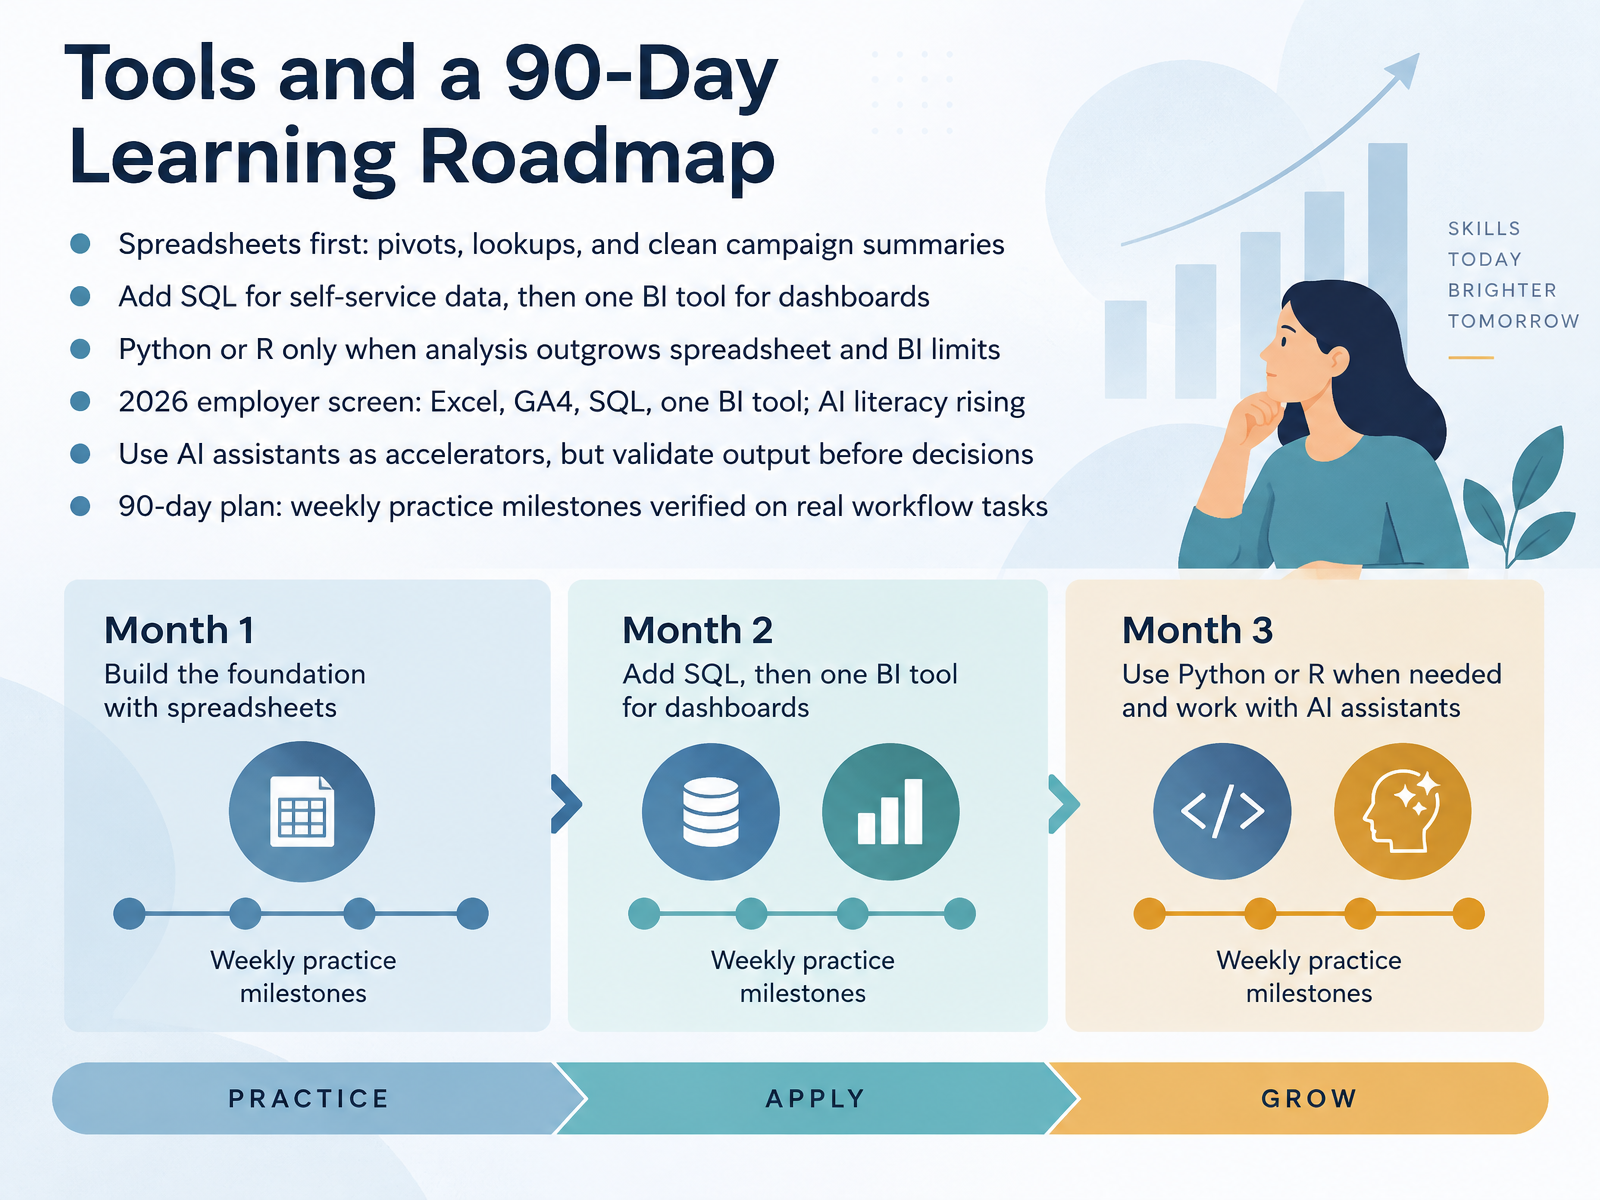
- 10Tools and a 90-Day Learning RoadmapNow let's talk tools, and a realistic learning order. Start with spreadsheets. Practice pivot tables, lookups, and building clean campaign summaries, because Excel and Sheets still appear in most entry-level job postings. Next, add SQL so you can pull your own data, then learn one business intelligence tool for dashboards. Add Python or R only when analysis outgrows spreadsheets and BI. The 2026 employer screen is Excel, GA4, SQL, and one BI tool, with AI literacy rising fast. Use AI assistants to accelerate your work, but validate their output before it informs a decision. Here's your ninety-day plan. Set weekly practice milestones, and verify each one on a real workflow task. For example, week one, rebuild a campaign summary from raw exports. Week four, write a SQL query that returns channel-level cost per lead. Week eight, publish one dashboard your team actually uses. Small weekly checkpoints on real work beat a long list of tutorials. Next, we'll look at working with teams and sustaining a learning loop.
 2 min
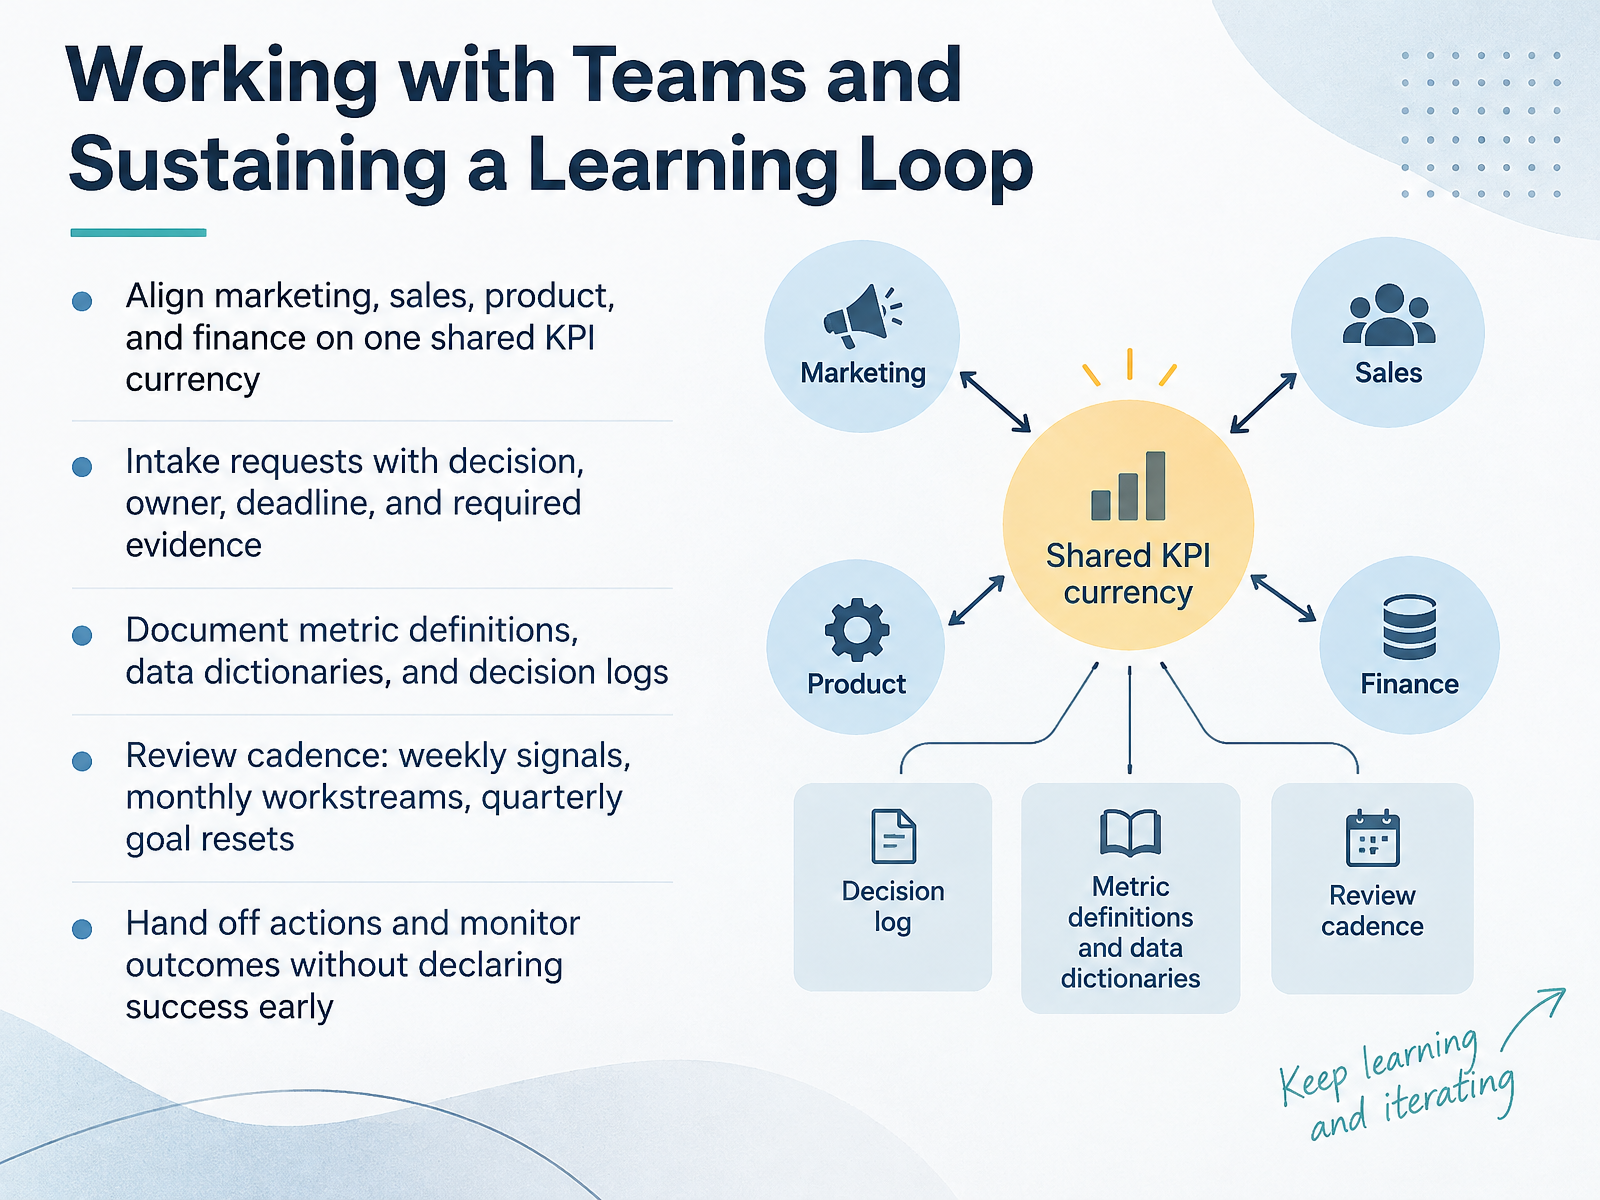
- 11Working with Teams and Sustaining a Learning LoopNow let's look at how to work with teams and keep learning going. Start by agreeing on one shared KPI currency across marketing, sales, product, and finance. That means one agreed version of each core metric, like cost per qualified lead. Next, intake requests with four details: the decision, the owner, the deadline, and the required evidence. For example, a request might ask whether to shift budget from paid search to email by next Friday. Then document your definitions, data dictionaries, and decision logs so answers stay consistent. Set a review cadence: weekly signals, monthly workstreams, and quarterly goal resets. Finally, hand off actions and monitor outcomes without declaring success too early. If you feel unsure about your role in this loop, start small: write down one metric definition and one open decision today. Next, we'll cover role expectations and career realities for early-career analysts.
 kingdatalab.comgithub.commeasureu.com+22 min
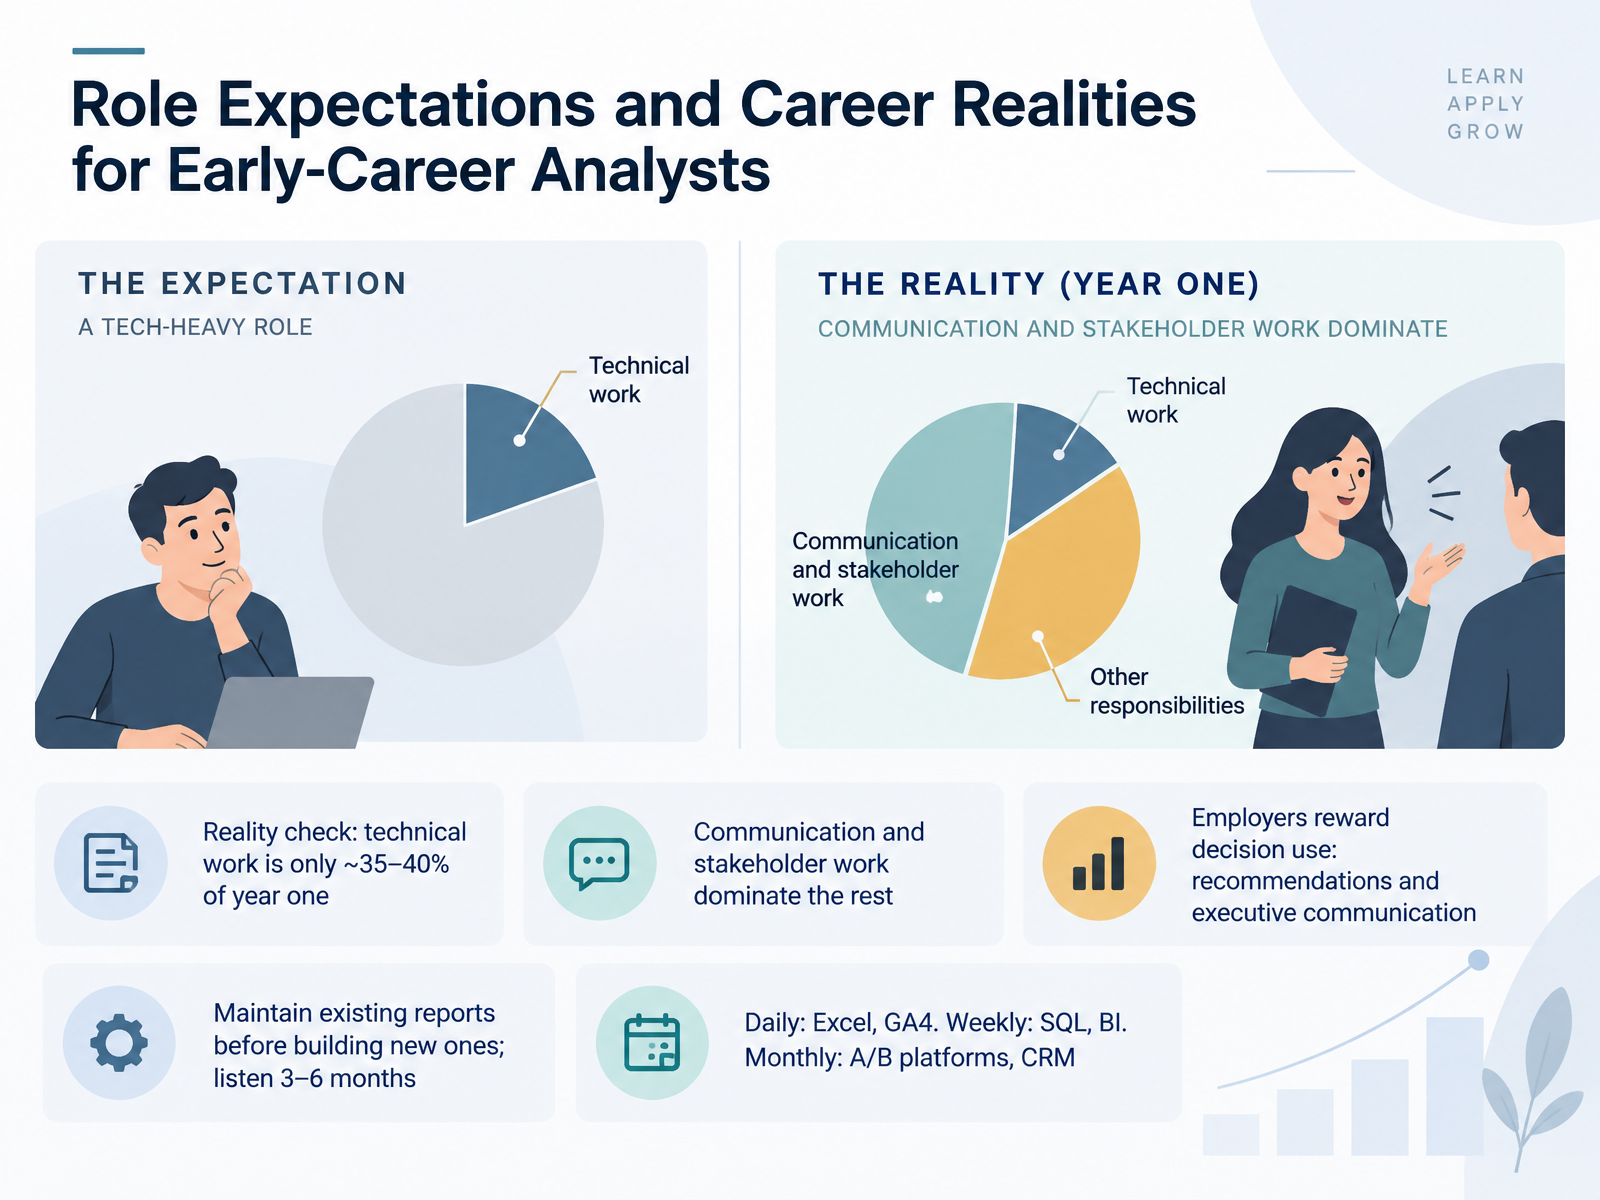
- 12Role Expectations and Career Realities for Early-Career AnalystsNow let's talk about what to expect in your first role. You may worry that your technical skills are not strong enough yet. Actually, technical work is only about thirty-five to forty percent of year one. Most of your time goes to communication and stakeholder work, translating data into language non-analysts understand. Employers reward decision use. They want clear recommendations and executive communication, not just dashboards. So maintain existing reports before building new ones, and listen for three to six months before pushing big ideas. Here is a simple routine. Daily, use Excel and G A four. Weekly, practice SQL and your BI tool. Monthly, explore A B testing platforms and CRM systems. Start with the daily tools, then expand. Next, we will walk through a worked example, one question from start to finish.
 1 min
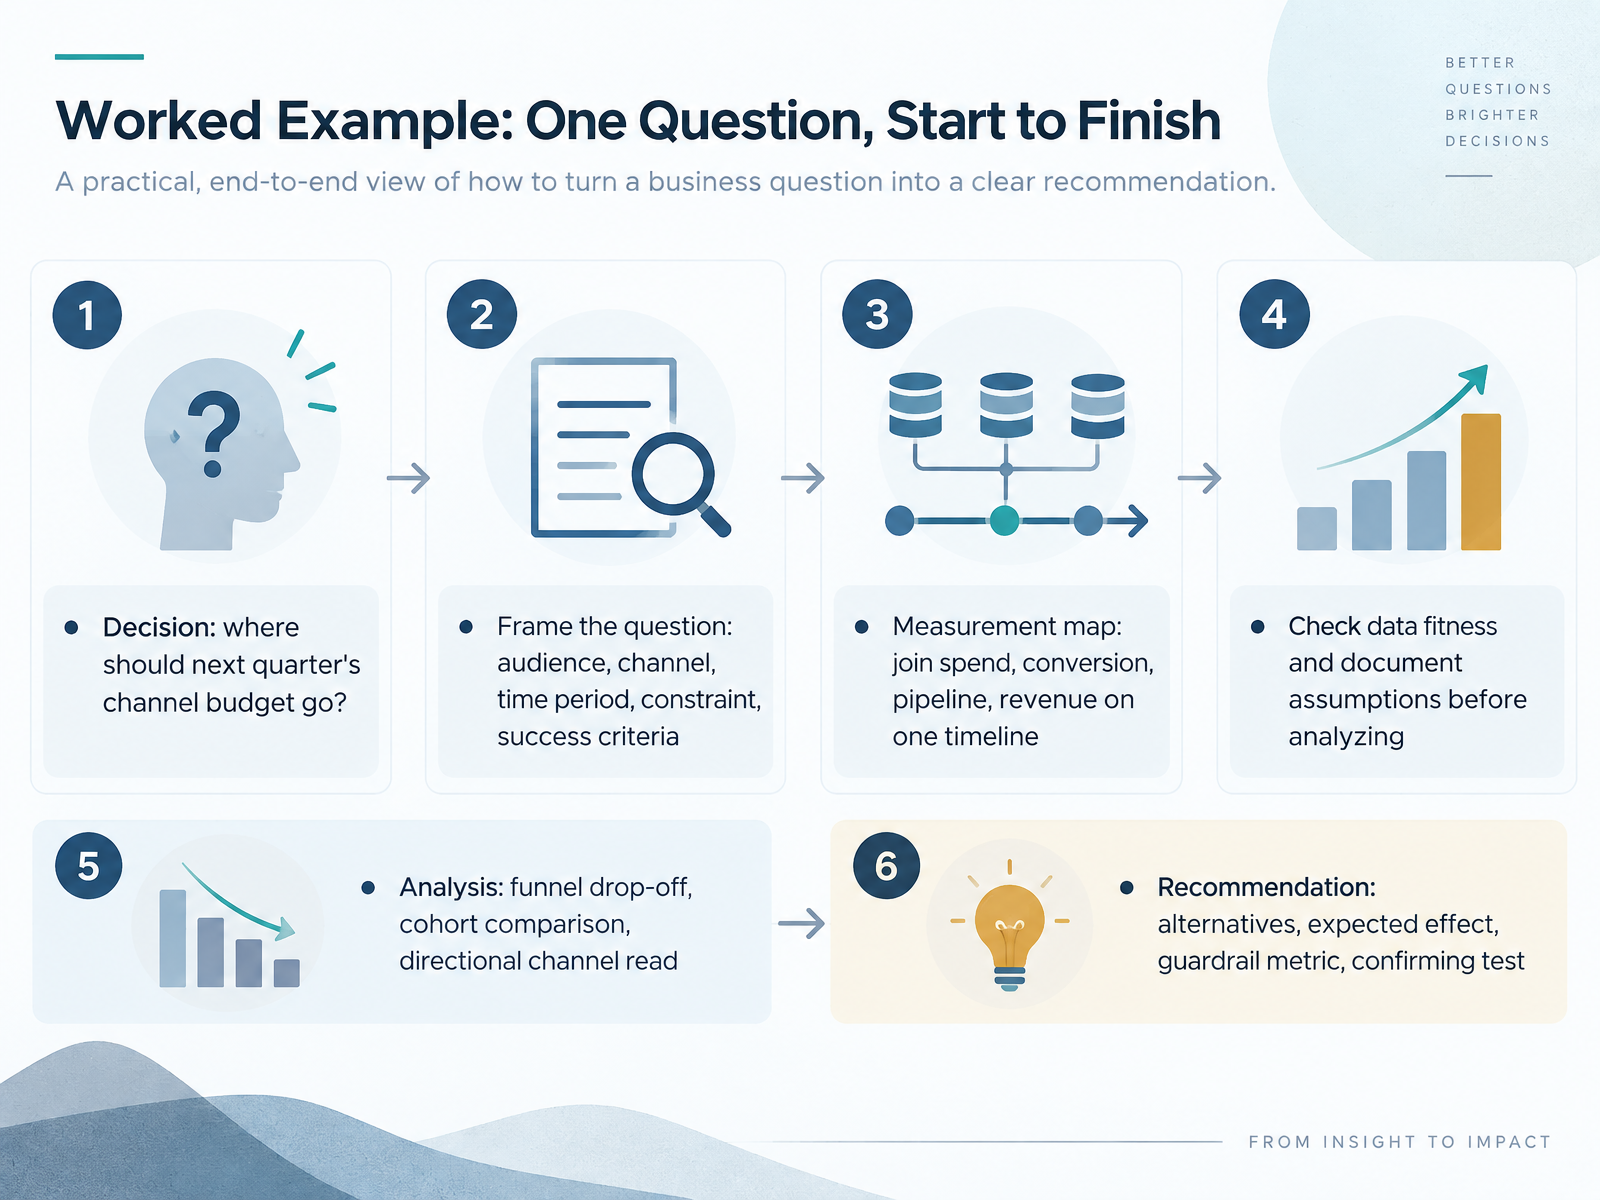
- 13Worked Example: One Question, Start to FinishLet's walk through one question from start to finish. Suppose your team must decide where next quarter's channel budget should go. Start by framing the question: who is the audience, which channels, what time period, what constraint, and what success looks like. Next, build a measurement map. Join spend, conversion, pipeline, and revenue on one shared timeline. Then check data fitness and write down your assumptions before you analyze anything. In the analysis, look at funnel drop-off, compare cohorts, and read each channel directionally. Some analysts worry this is too much rigor for one budget call. It isn't. Just document one assumption per source this week. Finally, write the recommendation: alternatives, expected effect, one guardrail metric, and a confirming test. Let's move on to your next step, where you run this workflow yourself this week.
 kingdatalab.comgithub.commeasureu.com+22 min
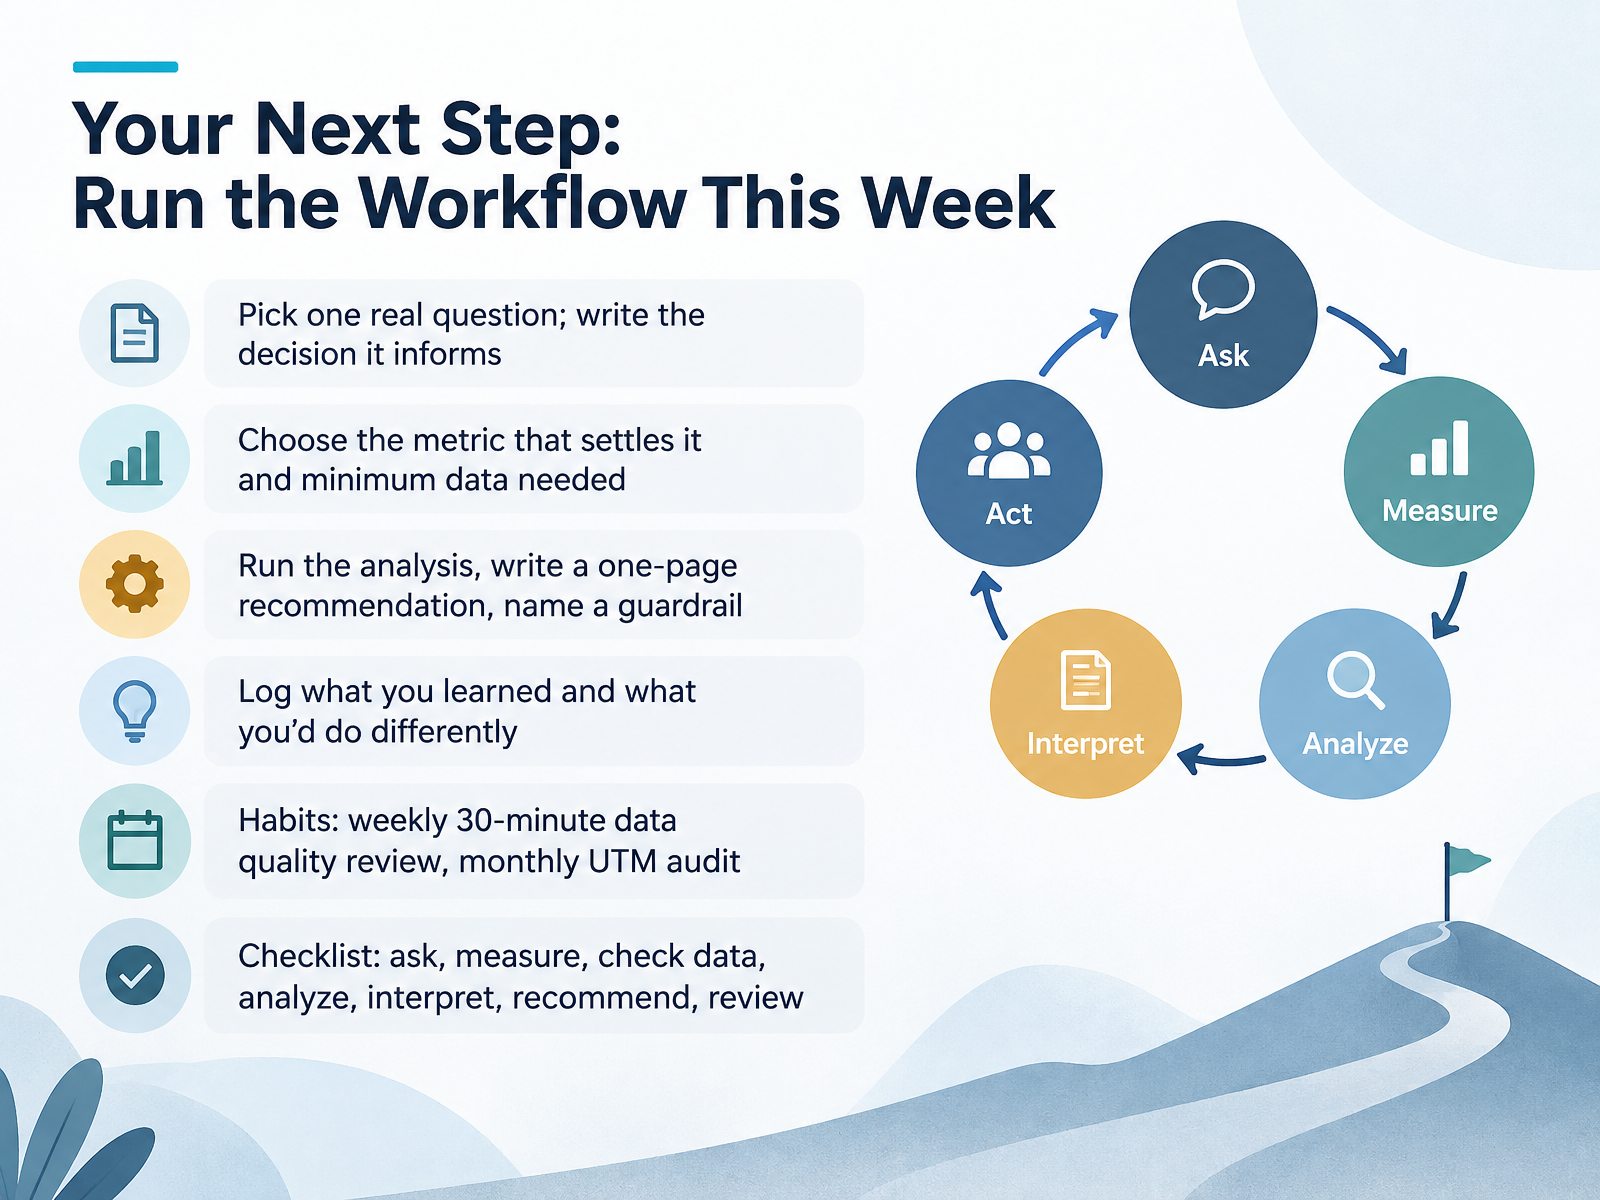
- 14Your Next Step: Run the Workflow This WeekLet's close with your next step: run this workflow once, this week. Start by picking one real question, and write down the decision it informs. Then choose the single metric that settles it, and the minimum data you actually need. It's normal to feel unsure here. That's why you start small, with one question instead of a full dashboard. Next, run the analysis, write a one-page recommendation, and name one guardrail metric, so you don't win one number by breaking another. Afterward, log what you learned and what you'd do differently. Build two habits: a thirty-minute weekly data quality review, and a monthly U T M audit. And keep this checklist handy: ask, measure, check data, analyze, interpret, recommend, review. Thank you for working through this course with me. You now have a repeatable process, so pick that one question and start this week. You've got this.
 kingdatalab.comgithub.commeasureu.com+22 min
Take the deck with you
Download this course as a file — free, no sign-up needed.
- PDF handoutEvery slide page, ready to print or share.15 pages · 3.3 MBDownload
- Narrated PowerPointThe deck that presents itself — every slide carries the digital human's narration video.15 pages · 13.1 MBDownload
- PowerPoint slidesThe full deck as a .pptx — open it in PowerPoint, Keynote, or Google Slides.15 pages · 3.2 MBDownload
Free to use in your own training — please keep the PersonWise credit page at the end.
Have your own deck? Turn it into a course
Sources consulted
Web sources consulted while building this course.
- Marketing Measurement Framework | Free Template & Checklist — kingdatalab.com
- .agents/skills/marketing/analytics/SKILL.md — github.com
- The Measurement Marketing Framework — Used by 50,000+ Marketers | MeasureU — measureu.com
- Interactive MMM Workflow | Complete 9-Step Guide — redam94.github.io
- How to Measure Marketing Performance: A Practical Framework | Herm.io — herm.io
- Drive Performance with Leading and Lagging Indicators — umbrex.com
- Marketing KPI Monitoring Framework | Smoke Signal | Smoke Signal — smokesignal.tech
- How to Build a Marketing KPI Framework: North Star Metrics, Funnel Benchmarks, and Dashboard Design | GTM Tools — gtmtools.io
- 15 marketing KPIs to track & how to choose the right ones — blog.hubspot.com
- Crucial Marketing KPIs Your Team Needs To Track in 2026 — pipeline.zoominfo.com
- Data Quality Governance Guide for Analytics Teams | Trackingplan — trackingplan.com
- Data monitoring best practices for reliable analytics | Trackingplan — trackingplan.com
- How to Build a UTM Strategy for Your Entire Marketing Stack — cutt.ly
- UTM Governance: The Framework That Stops Broken Attribution for Good | UTMStandard — utmstandard.com
- https://mixpanel-docs.mintlify.app/data-ingestion/best-practices — mixpanel-docs.mintlify.app
- Marketing methods: a comparator by decision and evidence — marketing-mix.net
- Incrementality vs Attribution vs MMM: Decision Tree — measured.com
- How to Interpret Marketing Mix Modeling Results<!-- --> | CheapMMM Blog — cheapmmm.com
- Open-Source Media and Marketing Mix Modeling: Practice-Oriented Overview, Challenges, Opportunities | Customer Needs and Solutions | Springer Nature Link — link.springer.com
- Structural Estimation of Marketing Mix Model Parameters from Geo-Experiments — arxiv.org