Organizing the Periodic Table
Begin
13 pages · ~26 min
Organizing the Periodic Table
This training introduces the periodic table's structure and organization, helping learners understand how elements are classified by properties and atomic number.
What you’ll learn
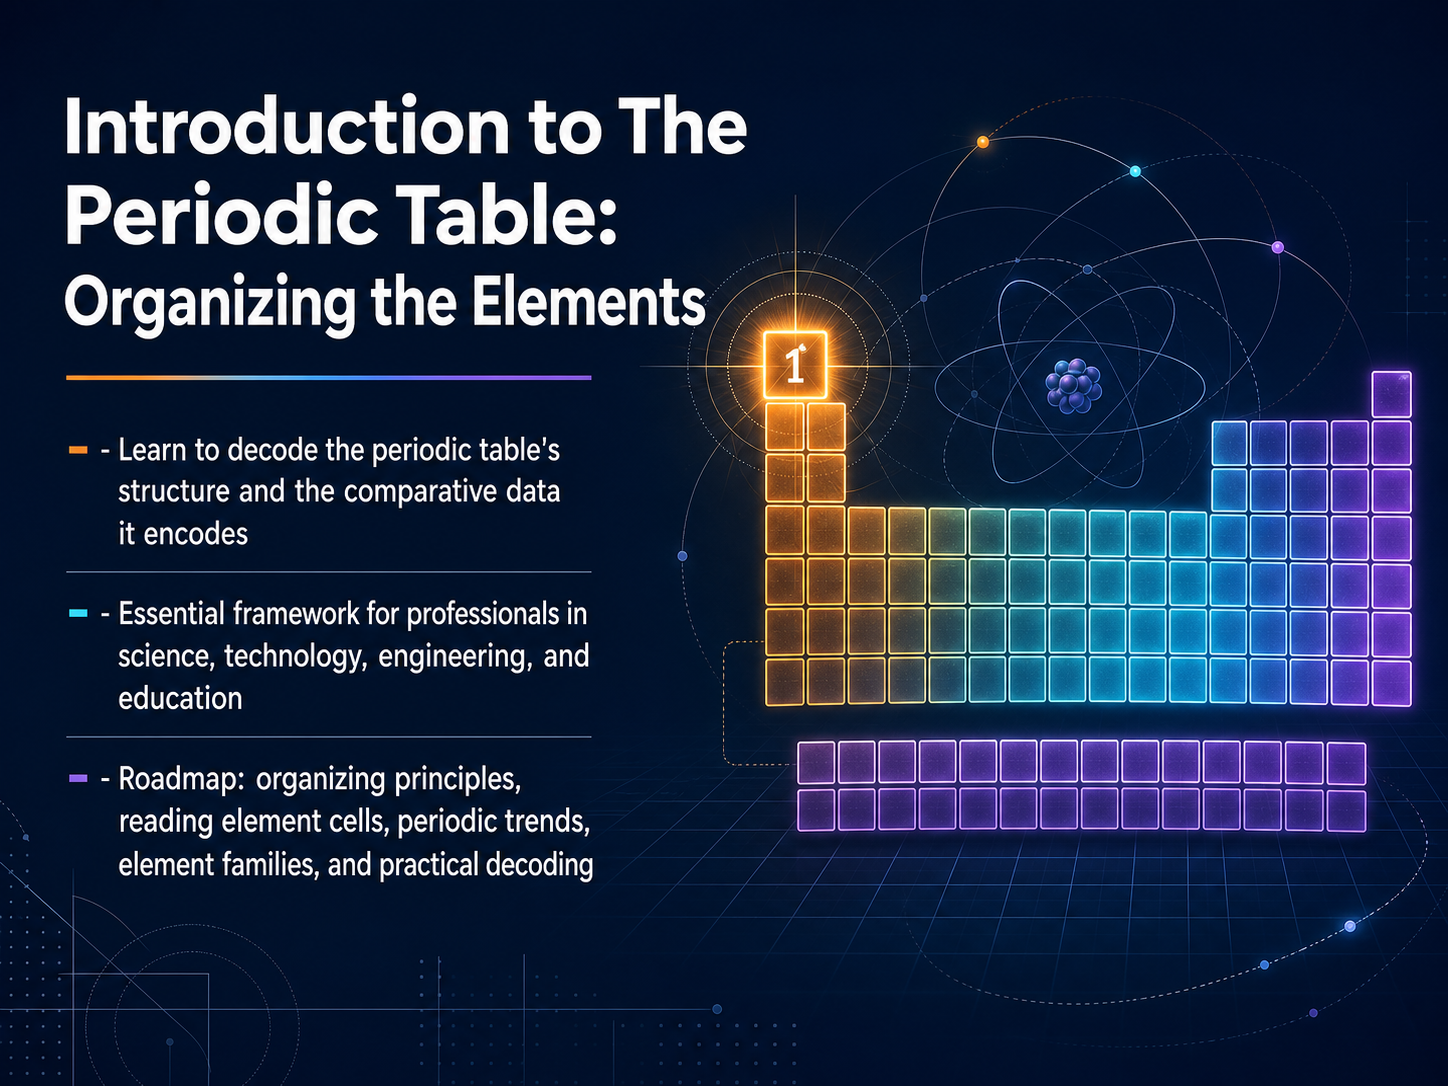
- 01Introduction to The Periodic Table: Organizing the ElementsWelcome. Today we are going to walk through a system that organizes all known matter: the periodic table. It looks dense at first, but think of it as a logical map, not a wall of random numbers. By the end of this course, you will be able to decode its layout and read the comparative data hidden in plain sight. This skill is an essential framework for professionals in science, technology, engineering, and education. Our roadmap is straightforward. We will start with the organizing principles that give the table its shape. Then I will show you exactly how to read an element cell and what each number tells you. From there we will track periodic trends that repeat like a rhythm across the rows, and we will sort the table into element families that share a chemical personality. Finally, we will put it all together with practical decoding. Next, we will look at why this arrangement marks such a profound shift in scientific thinking, focusing on its historical significance and modern relevance.iupac.orgiupac.orgiupac.org+22 min
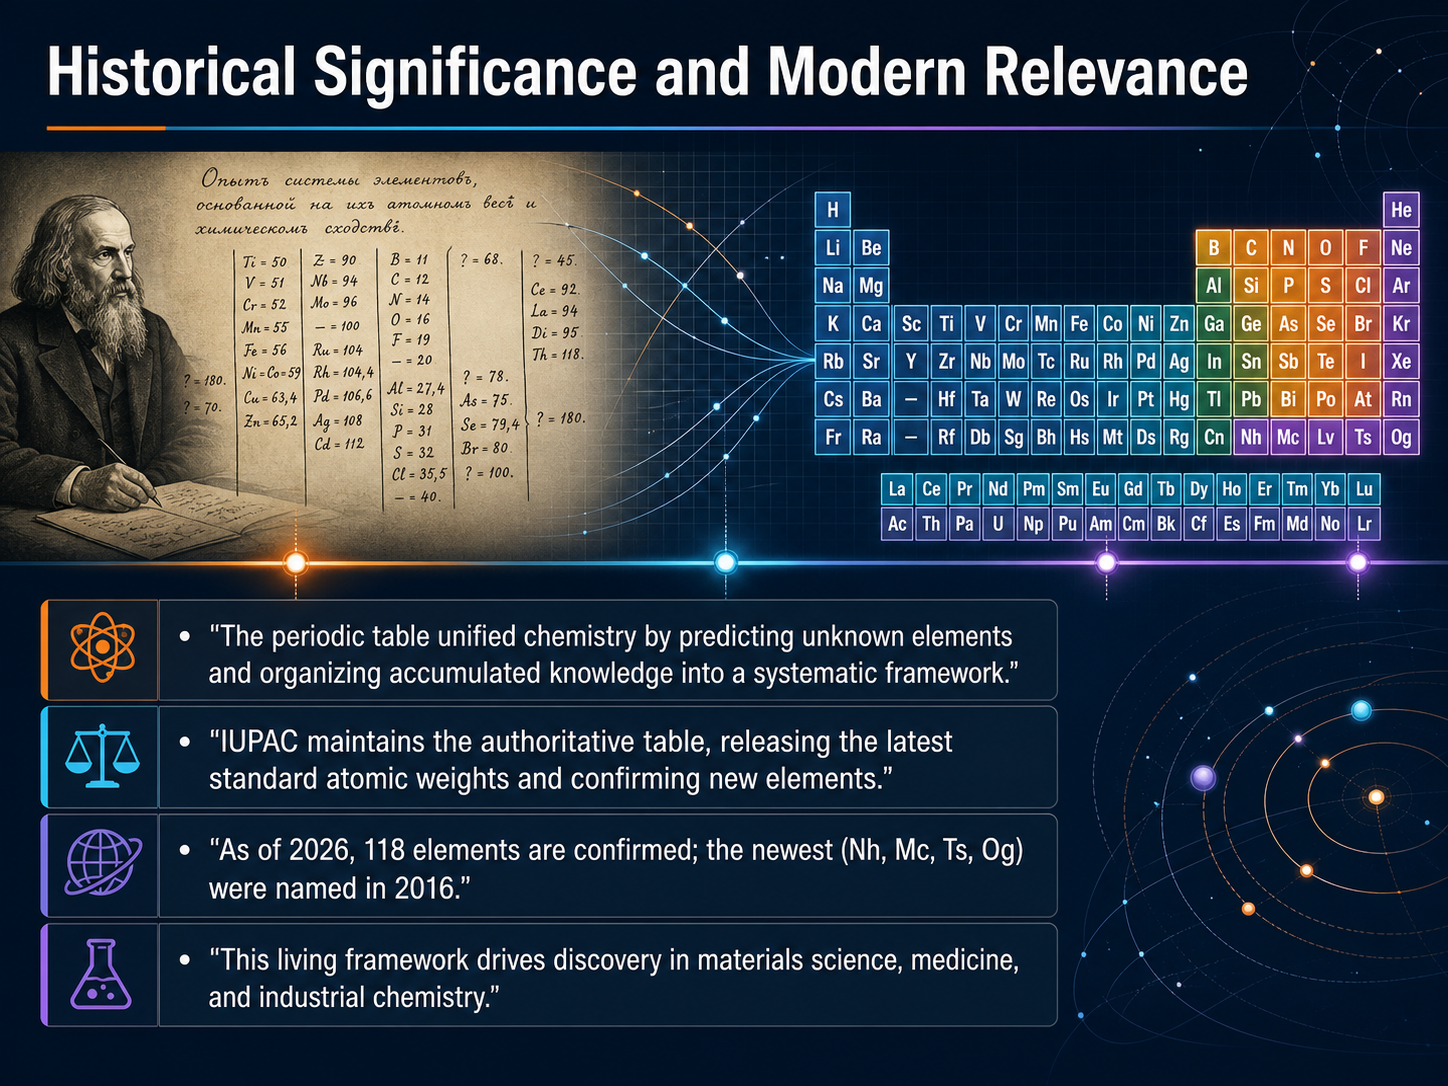
- 02Historical Significance and Modern RelevanceNow let's consider why this chart remains so important, more than one hundred fifty years after its creation. The periodic table did something remarkable. It unified chemistry. Before its existence, facts about elements were scattered and disjointed. The table pulled all that accumulated knowledge into one systematic framework. Even more impressive, it predicted the existence and properties of elements that had not yet been discovered. Those blank spaces in the early tables guided chemists to real discoveries. Today, the International Union of Pure and Applied Chemistry, or IUPAC, serves as the official authority. IUPAC maintains the definitive table, releases the latest standard atomic weights, and confirms the discovery of any new elements. As of twenty twenty-six, there are one hundred eighteen confirmed elements. The newest additions, Nihonium, Moscovium, Tennessine, and Oganesson, were officially named in twenty sixteen. This is not a static historical document. It is a living framework that actively drives discovery in fields like materials science, medicine, and industrial chemistry. The structure you are about to learn is the very tool scientists use to innovate. Next, we will break down that core organizing principle: the atomic number.
 iupac.orgiupac.orgiupac.org+22 min
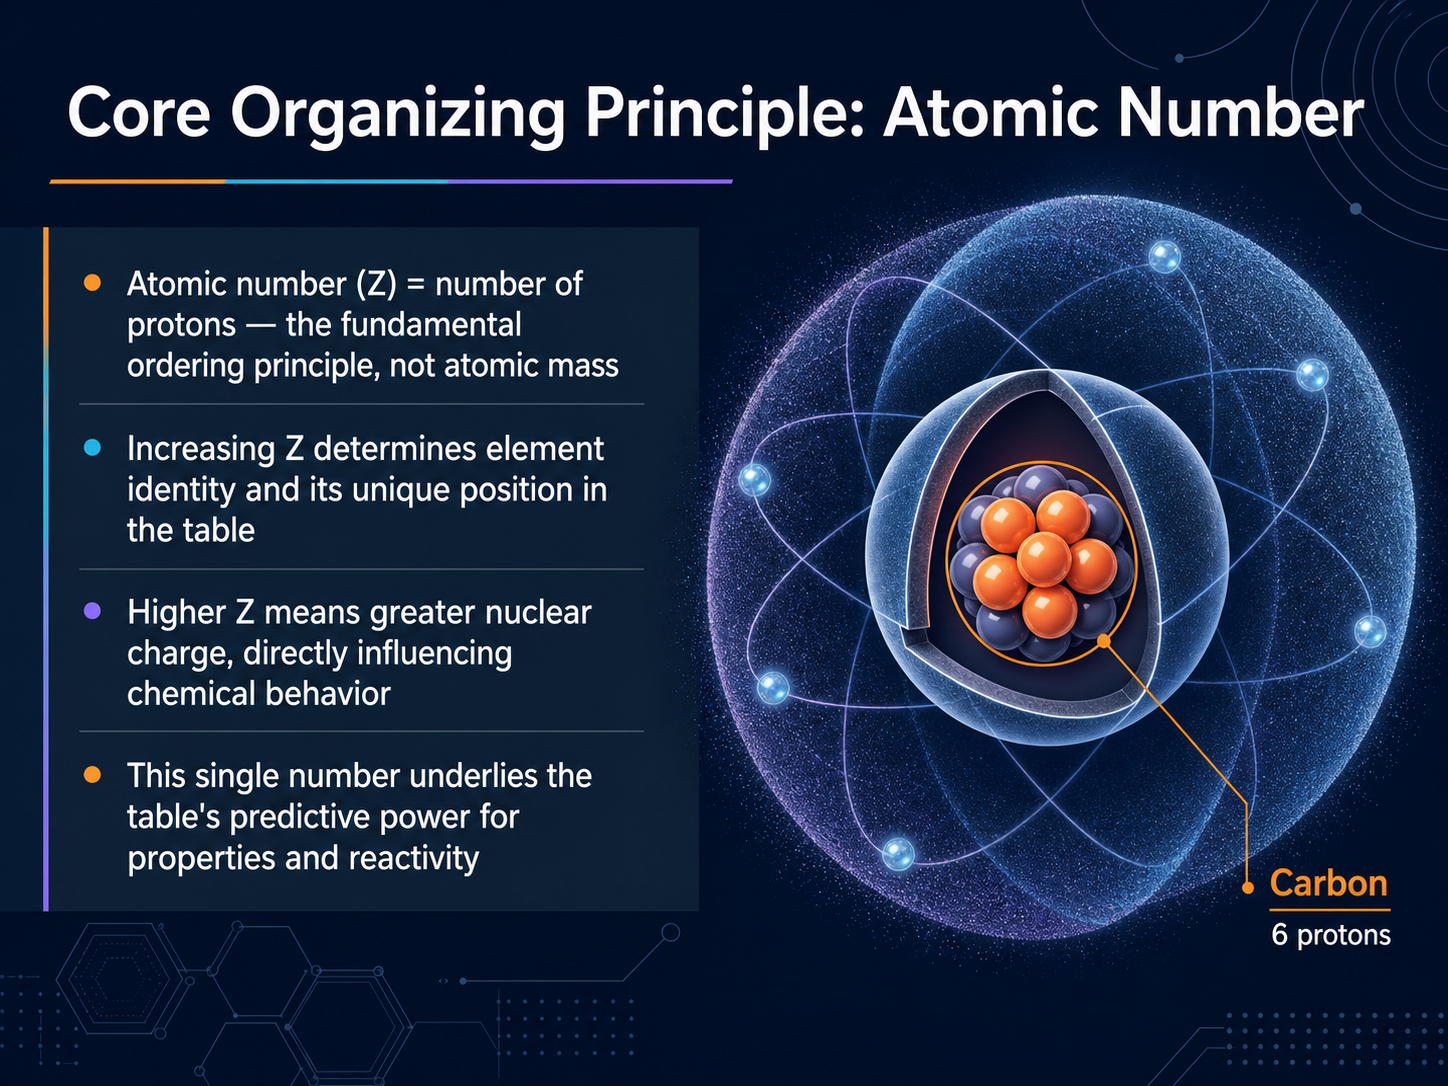
 - 03Core Organizing Principle: Atomic NumberNow let’s look at the core organizing principle of the table: the atomic number. The atomic number, often written as Z, equals the number of protons in an atom’s nucleus. That single number is what defines an element, not its atomic mass. As the atomic number increases, the element’s identity changes, and so does its unique position in the table. A higher atomic number also means a greater nuclear charge, which directly shapes how the element behaves chemically. Once you grasp that the whole table is ordered by this one number, much of its predictive power becomes clear. Properties, reactivity, and even the shape of the table itself all follow from the atomic number. Let’s build on that foundation and look next at how the table is organized into periods, groups, and the IUPAC numbering system.
 iupac.orgiupac.orgiupac.org+21 min
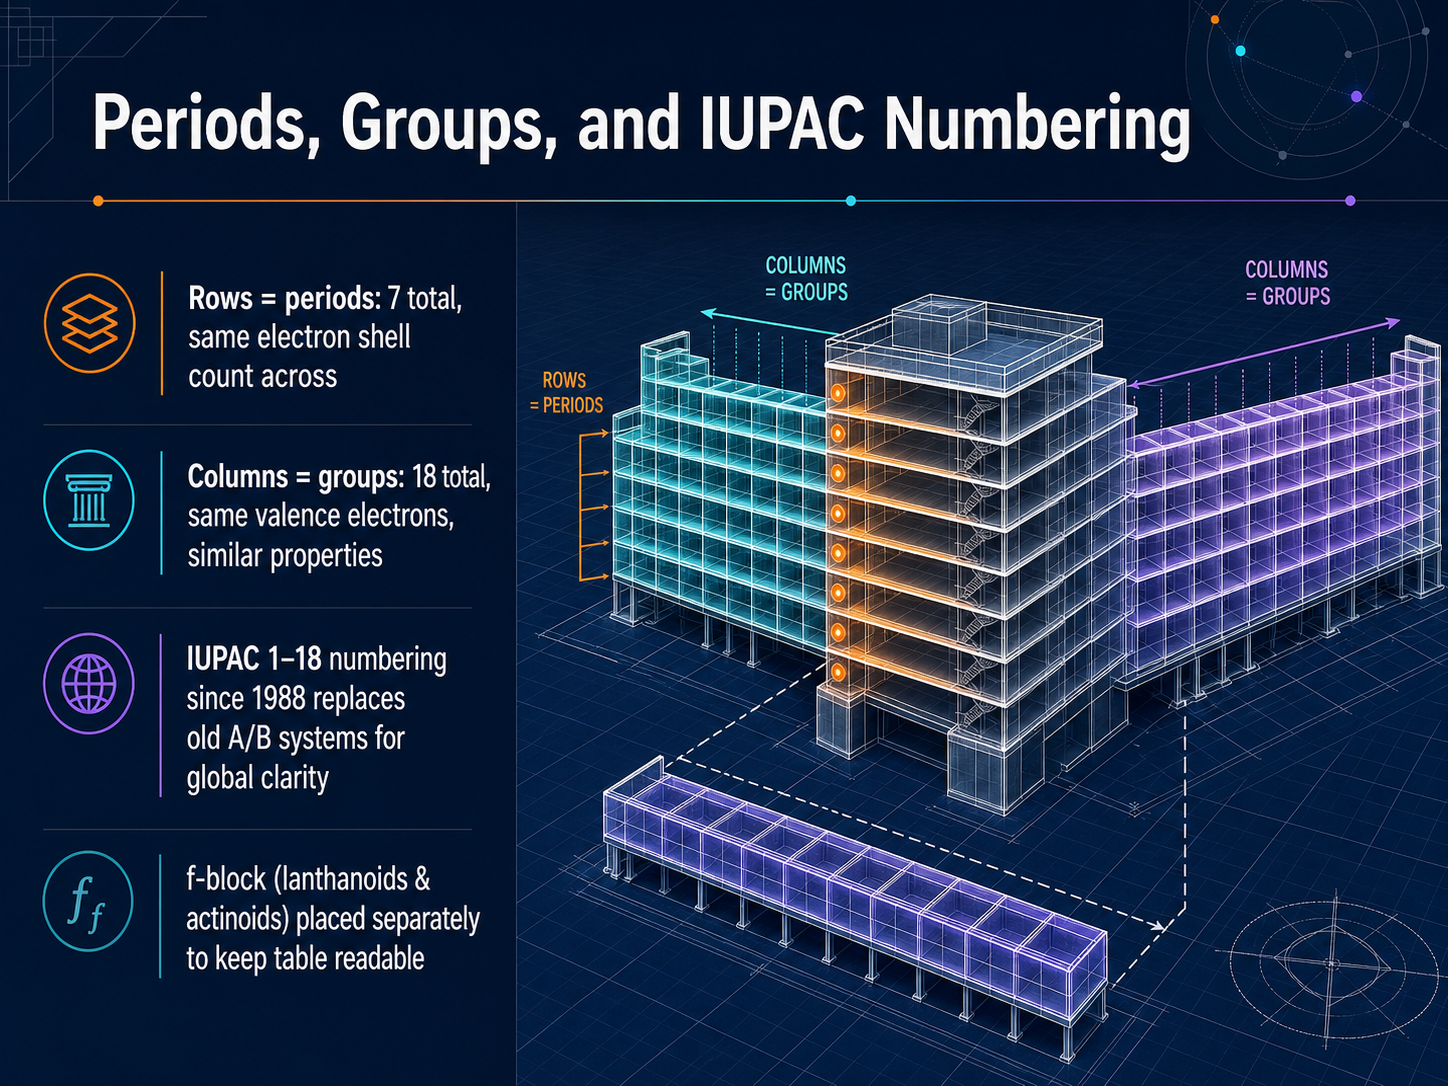
 - 04Periods, Groups, and IUPAC NumberingLet’s break down the grid itself. The horizontal rows are called periods. There are seven periods in total, and every element in the same period has the same number of electron shells. Think of it like floors in a building: the higher the floor, the more shells the atoms have. The vertical columns are called groups. There are eighteen groups. Elements in the same group share the same number of valence electrons, which gives them very similar chemical behavior. To avoid confusion, IUPAC established a simple numbering system in 1988, labeling the groups one through eighteen from left to right. This replaced older A and B systems that varied between regions, so now chemists everywhere speak a single, clear language. You will also notice two rows set apart at the bottom. This is the f-block, containing the lanthanoids and actinoids. We place them separately to keep the main table readable and compact. In the next slide, we will zoom in by reading a single element cell.
 iupac.orgpublications.iupac.orgmoureu.iupac.org+22 min
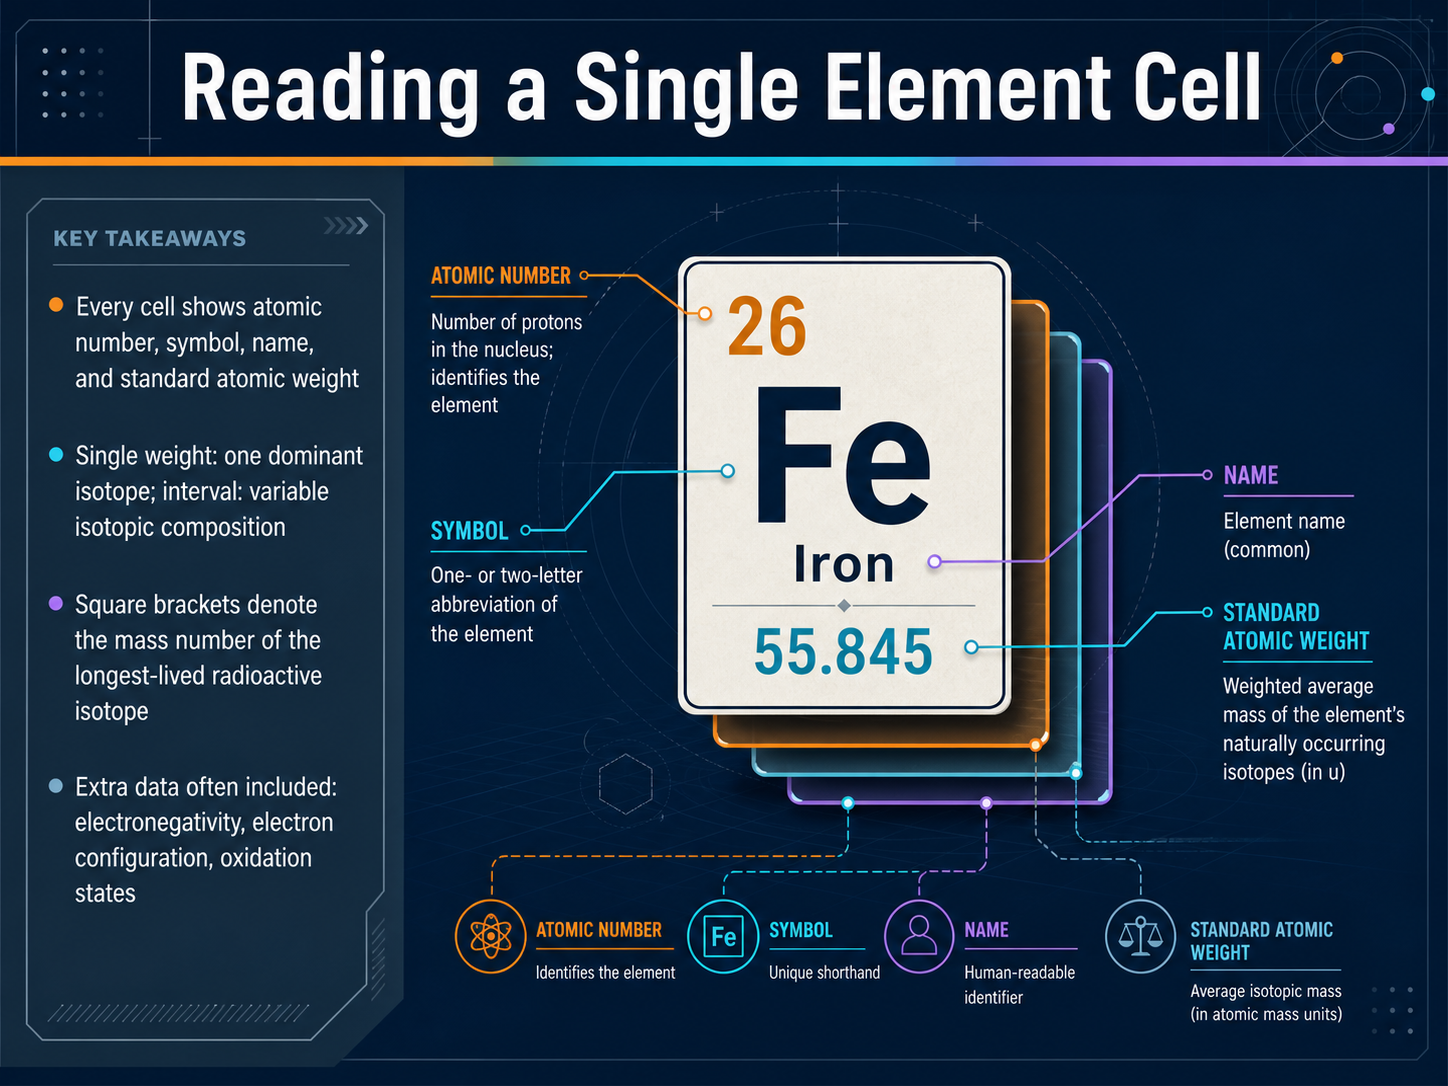
 - 05Reading a Single Element CellNow let's zoom in on a single element cell and learn how to read it. Every cell on the periodic table is a small data card for one element. First, you'll see the atomic number, usually a large integer at the top. That tells you the number of protons. Next comes the element symbol, one or two letters, with the first always capitalized. Below the symbol is the full element name. The fourth piece of core data is the standard atomic weight. You'll notice two main formats here. A single value with an uncertainty, like plus or minus a small number, means one dominant isotope determines the weight. An interval in square brackets, like two numbers with a semicolon, means the element's isotopic composition varies in nature, so the weight is a range. For radioactive elements with no characteristic terrestrial abundance, the mass number of the longest-lived isotope is listed inside brackets. Many tables also include extra data: electronegativity, a measure of how strongly an atom attracts electrons; electron configuration, written with numbers and letters; and common oxidation states, shown as charges. When you can read these few lines, every cell becomes a quick-reference profile. Next, we will look at electron configuration and the s, p, d, f blocks to see how those configurations shape the table's structure.
 iupac.orgiupac.orgiupac.org+22 min
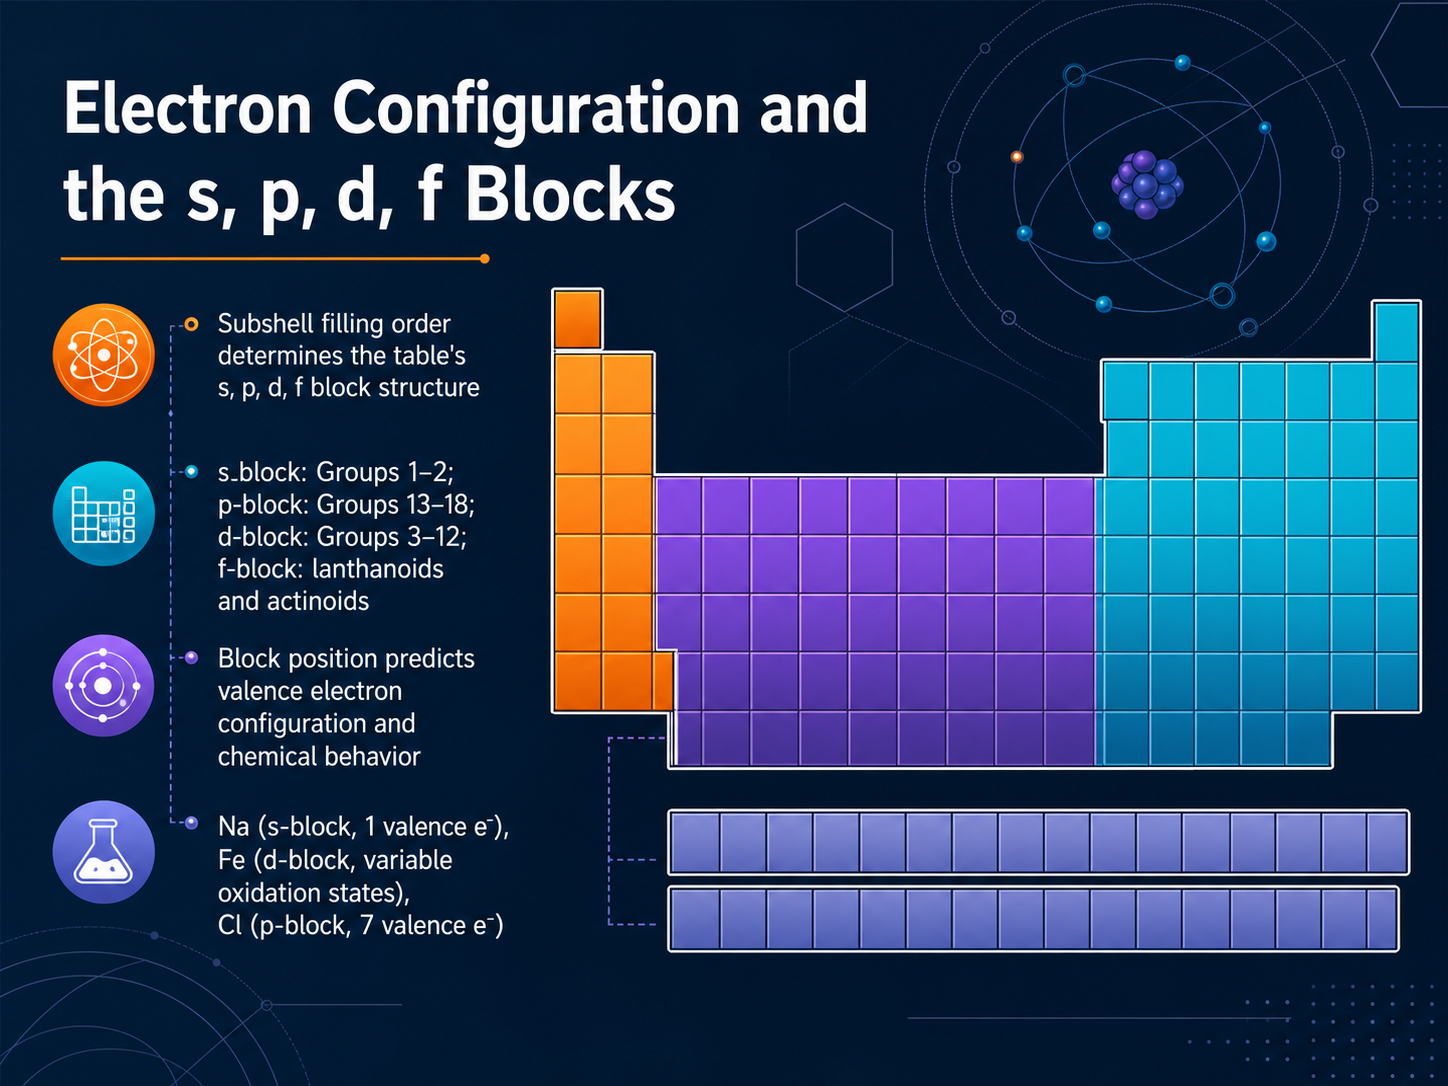
 - 06Electron Configuration and the s, p, d, f BlocksMoving deeper into the table's logic, let's look at electron configuration and the s, p, d, f blocks. The shape of the periodic table is not random. It is a direct map of the order in which electron subshells fill up. We divide the table into four main blocks. The s-block covers Groups 1 and 2. The p-block spans Groups 13 through 18. The d-block occupies the transition metals in Groups 3 to 12. And the f-block is those two rows usually set apart at the bottom, the lanthanoids and actinoids. Where an element sits in these blocks instantly predicts its valence electron configuration and its chemical personality. For example, sodium sits in the s-block. It has just one valence electron, which makes it highly reactive. Iron sits in the d-block. Its electrons can be lost from different subshells, giving it variable oxidation states and making it a classic catalyst. Chlorine sits in the p-block with seven valence electrons. It needs only one more to complete its shell, so it greedily pulls electrons from other atoms. Simply by locating an element in its block, you can anticipate a great deal about how it will behave. Let's use that block awareness as we move into our next topic, atomic radius.
 periodic-table.rsc.orgzperiod.apptabperiodic.com+22 min
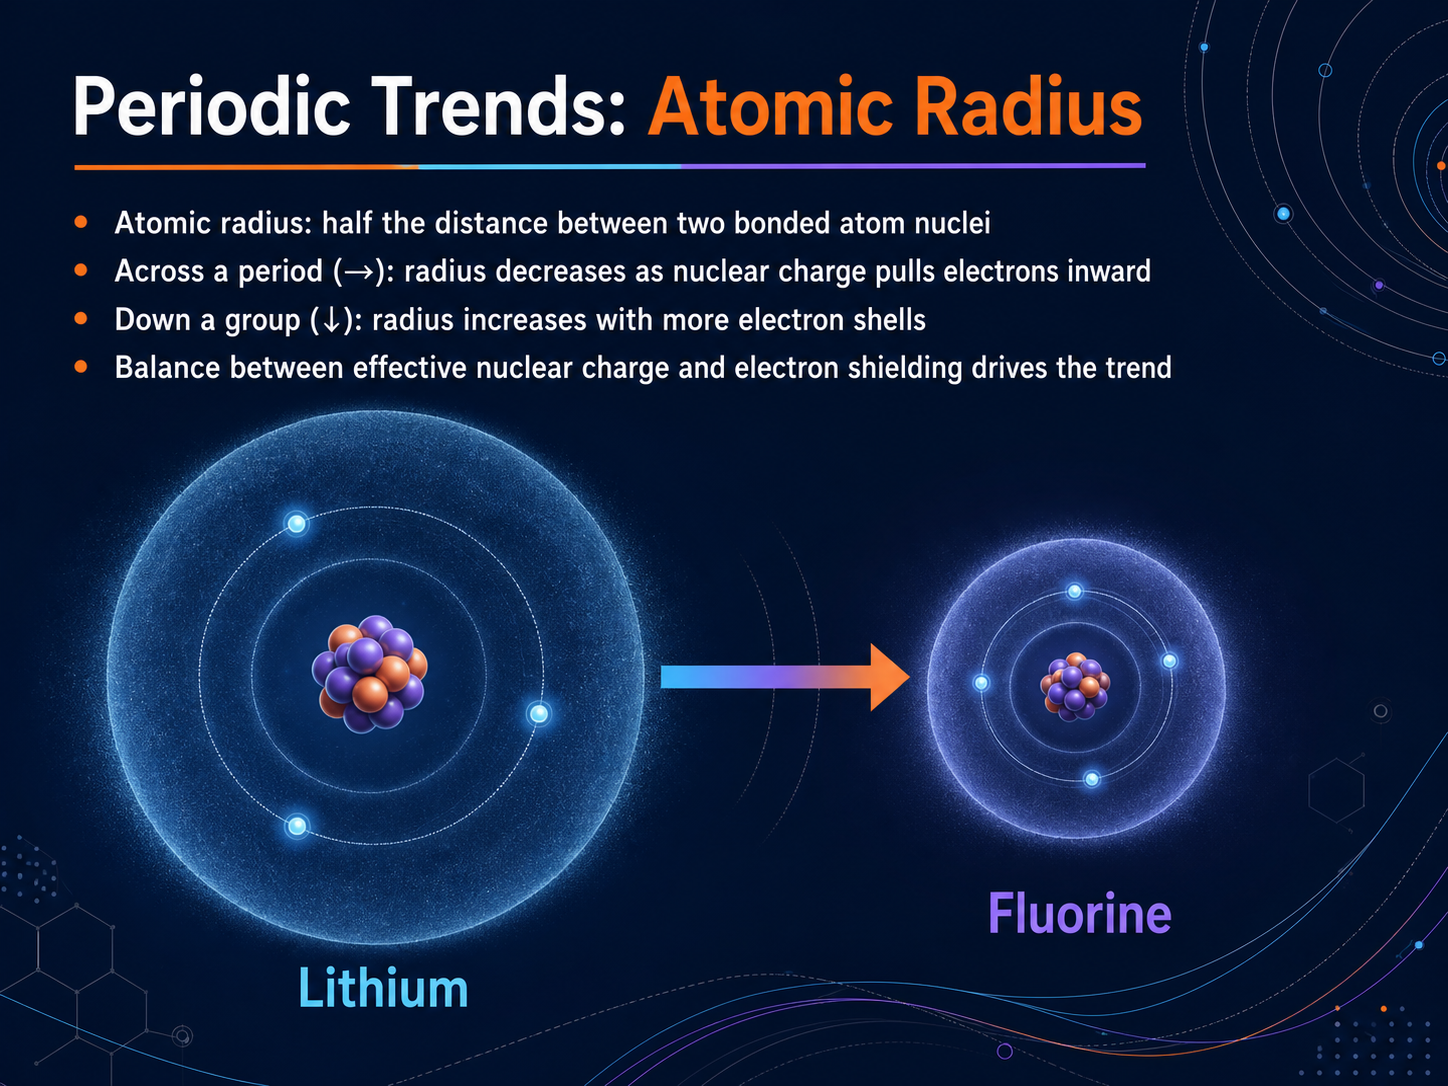
 - 07Periodic Trends: Atomic RadiusNow let's talk about a clear, predictable pattern called atomic radius. Simply put, atomic radius is half the distance between the nuclei of two bonded atoms of the same element. Imagine two identical spheres touching each other - the radius is the distance from the center of one nucleus to the point where the two spheres meet. As we move across a period from left to right, the atomic radius actually decreases. Why? Because we are adding protons to the nucleus, pulling the same number of electron shells in tighter. The increasing nuclear charge wins, drawing electrons closer. But when we move down a group, the radius increases. Each row down adds a whole new electron shell, making the atom physically larger despite the growing nucleus. So the trend is a tug-of-war between two forces: effective nuclear charge pulling inward, and electron shielding pushing outward. Across a period, charge dominates. Down a group, new shells dominate. This balance drives everything we will discuss next. Speaking of which, let's build on this idea and look at ionization energy and electronegativity.
 periodic-table.rsc.orgzperiod.apptabperiodic.com+22 min
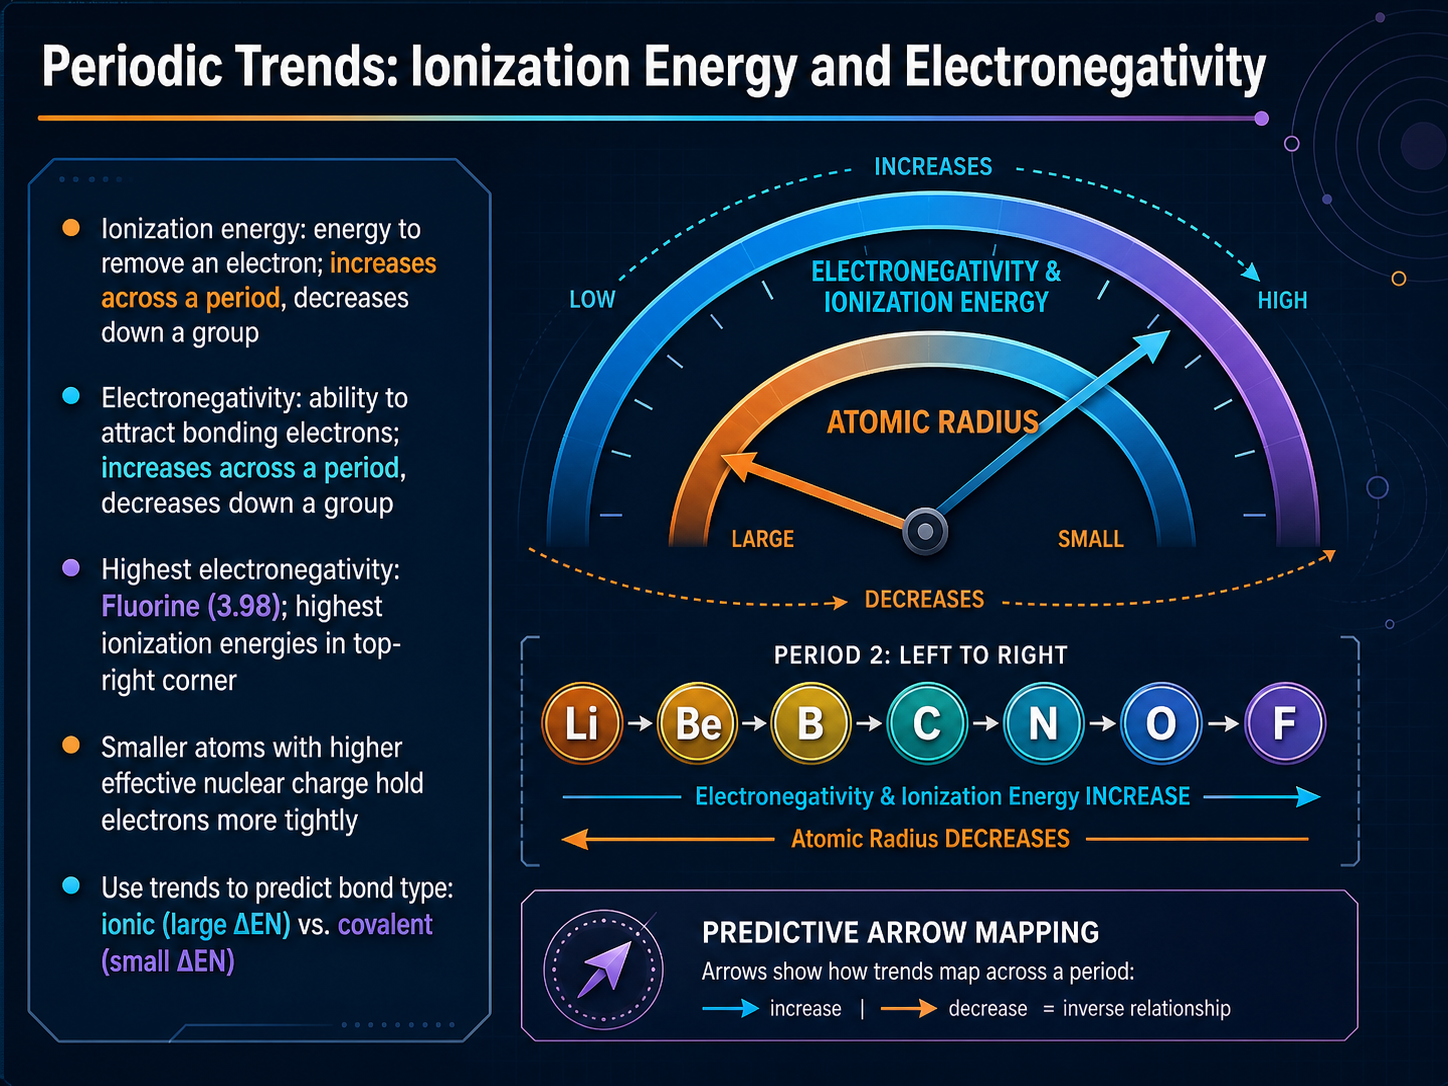
 - 08Periodic Trends: Ionization Energy and ElectronegativityNow let's look at two more trends that move across the table in the same direction. Ionization energy is the amount of energy it takes to remove an electron from an atom. As we move from left to right across a period, ionization energy increases. As we go down a group, it decreases. Why? Because smaller atoms with a higher effective nuclear charge hold their electrons more tightly. Think of it as a stronger grip that makes the electron harder to pull away. Electronegativity follows the same pattern. It measures how strongly an atom attracts electrons when it forms a chemical bond. It increases across a period and decreases down a group. The highest electronegativity belongs to fluorine, at three point nine eight. In general, the highest ionization energies are found in the top right corner of the table. These trends are practical. They let us predict bond types. A large difference in electronegativity between two atoms suggests an ionic bond. A small difference suggests a covalent bond. Understanding these patterns transforms the periodic table into a map of how atoms will interact. Next, we will see how these individual trends give entire element families their shared properties.
 periodic-table.rsc.orgzperiod.apptabperiodic.com+22 min
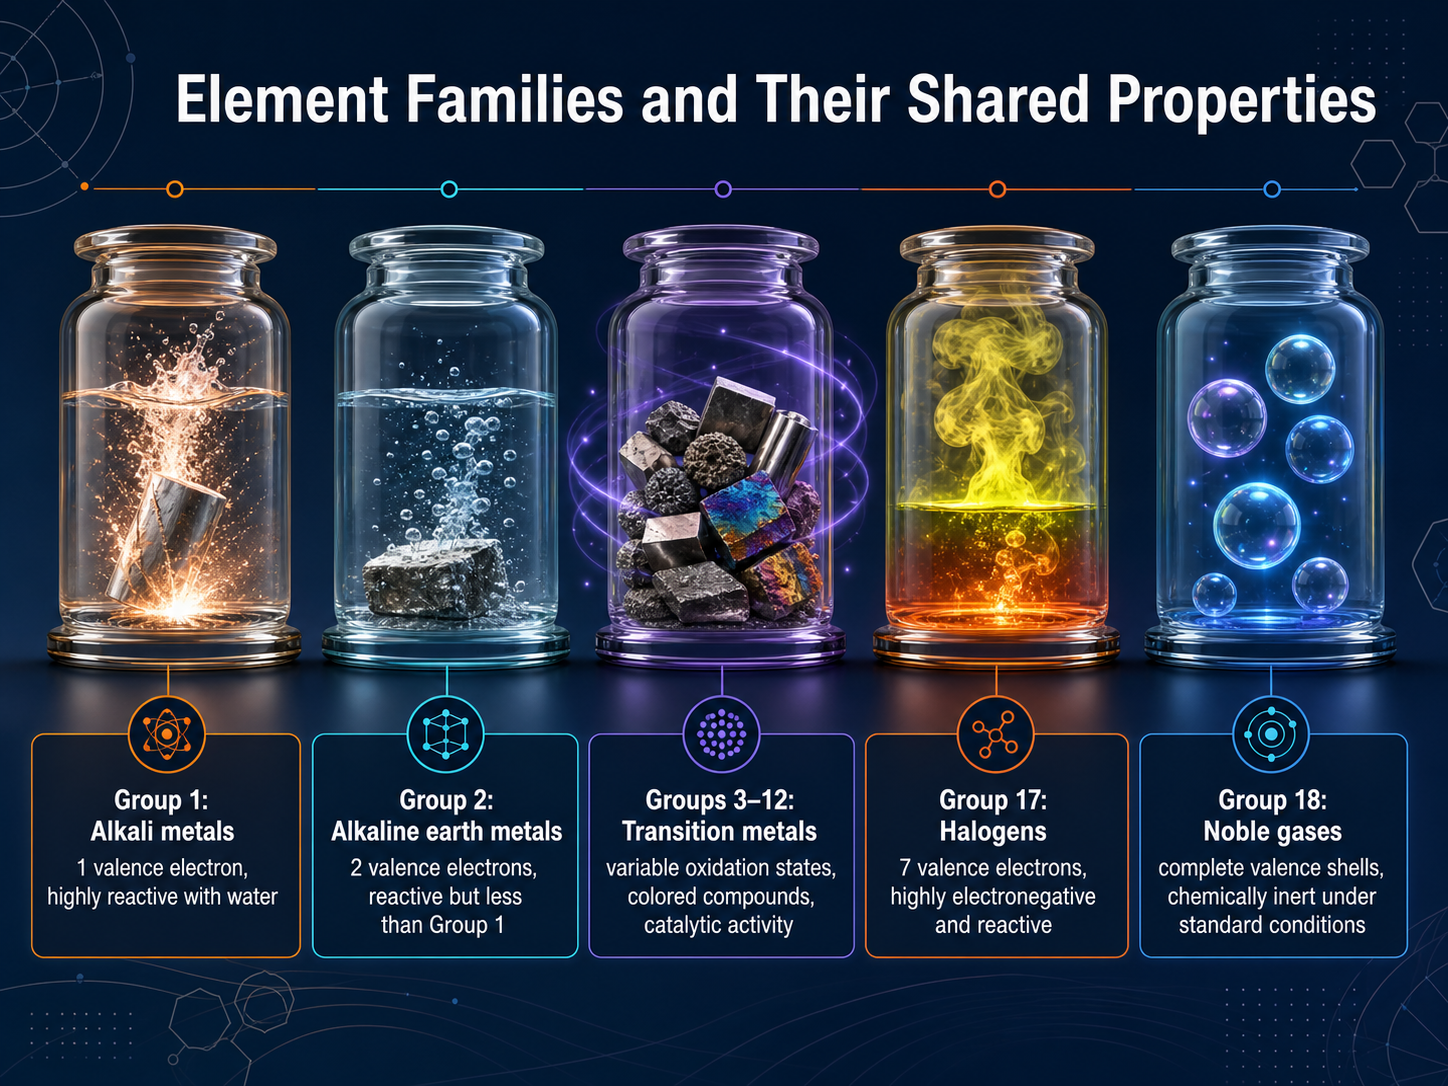
 - 09Element Families and Their Shared PropertiesNow we step back and look at whole columns, which we call families or groups. Let's start on the far left. Group 1 is the alkali metals. They each have just one valence electron, so they give it away very easily. That makes them extremely reactive, especially with water. One group over is Group 2, the alkaline earth metals. They have two valence electrons. They are still reactive, but noticeably less than Group 1. In the middle of the table, Groups 3 through 12 are the transition metals. These are the workhorses of chemistry. Many can form ions with different charges, they often make brightly colored compounds, and they are widely used as catalysts that speed up chemical reactions without being used up themselves. Now jump almost all the way to the right, to Group 17, the halogens. They have seven valence electrons, just one short of a full shell. This makes them highly electronegative and very eager to grab an electron. Finally, the calm family at the far right, Group 18, the noble gases. Their outer shell is completely full, so they are chemically inert under standard conditions. Let's clear up a few common mistakes next.
 periodic-table.rsc.orgzperiod.apptabperiodic.com+22 min
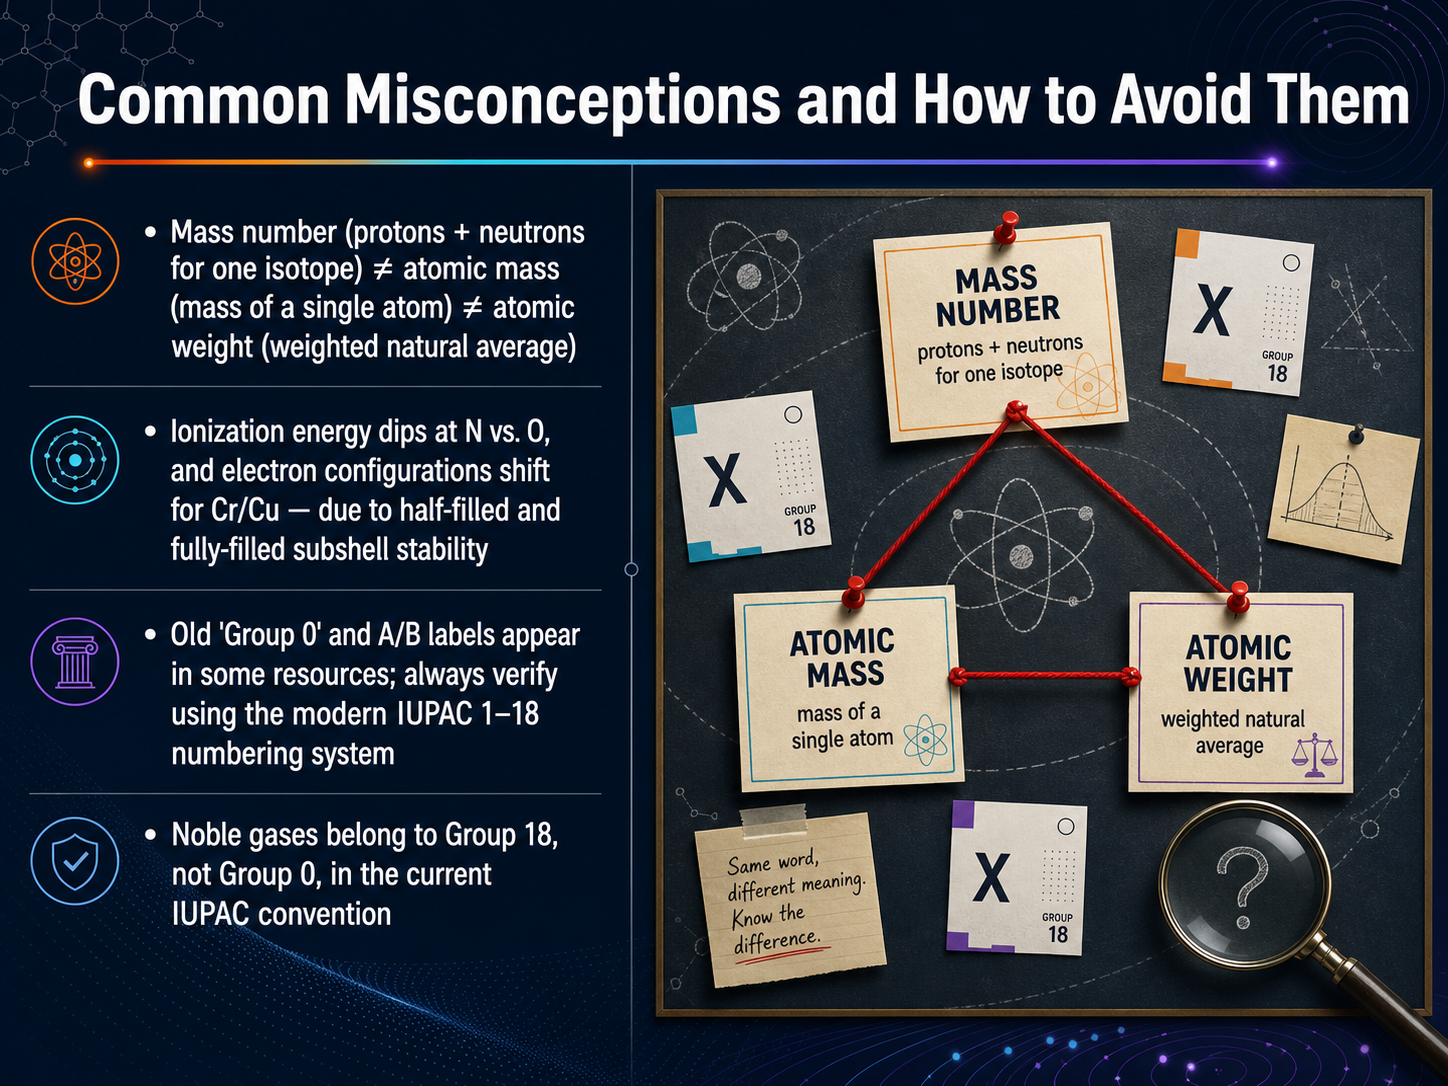
 - 10Common Misconceptions and How to Avoid ThemLet's clear up a few points that often cause confusion, even for experienced learners. First, watch your vocabulary with mass. Mass number—the total of protons and neutrons for one specific isotope—is not the same thing as atomic mass, which is the mass of a single atom. And neither of those is the same as atomic weight. Atomic weight is the weighted average of all the naturally occurring isotopes of an element. So, when you read tables, always confirm which of these three you are really looking at. Next, trends don't always move in perfect straight lines. You might expect ionization energy to simply increase across a row, but notice that nitrogen actually sits slightly higher than oxygen. This happens because half-filled and fully-filled subshells are unusually stable. You see the same principle with electron configurations—chromium and copper shift an electron to create that extra stability. Finally, a historical note. You will sometimes see older resources label the noble gases as 'Group 0' or use 'A' and 'B' lettering. Those systems are outdated and inconsistent globally. The modern I U P A C standard simply numbers the columns one through eighteen, so remember, the noble gases are officially Group 18. These small distinctions keep the entire organizational map accurate. Now that we have a clear reading of the map, let's move on and see how this powerful tool guides us through real material selections.
 iupac.orgpublications.iupac.orgmoureu.iupac.org+22 min
 - 11Applying the Periodic Table to Real-World Material DecisionsWith the logic of the table in place, let's see how it guides real-world material choices. The position of an element tells you a lot about its reactivity, stability, toxicity, and cost. For example, transition metals in the middle of the table tend to resist corrosion, which is why you find them in structural applications. The metalloids along the staircase line, like silicon, enable semiconductor design because their conductivity can be tuned. Today, these chemical rules are combined with powerful AI. In a recent municipal water project, an AI platform screened nearly three million lead-free solder compositions in just eleven days, narrowing the field to a few dozen high-probability candidates. That is work that would have taken centuries using traditional methods. But the lesson for us is that computation is only the first step. Every AI prediction must still be validated by physical lab experiments. The periodic trends give you a map; AI helps you read it faster, but the final answer always comes from the bench.
 sustainableatlas.orgpubs.rsc.orgf1000research.com+22 min
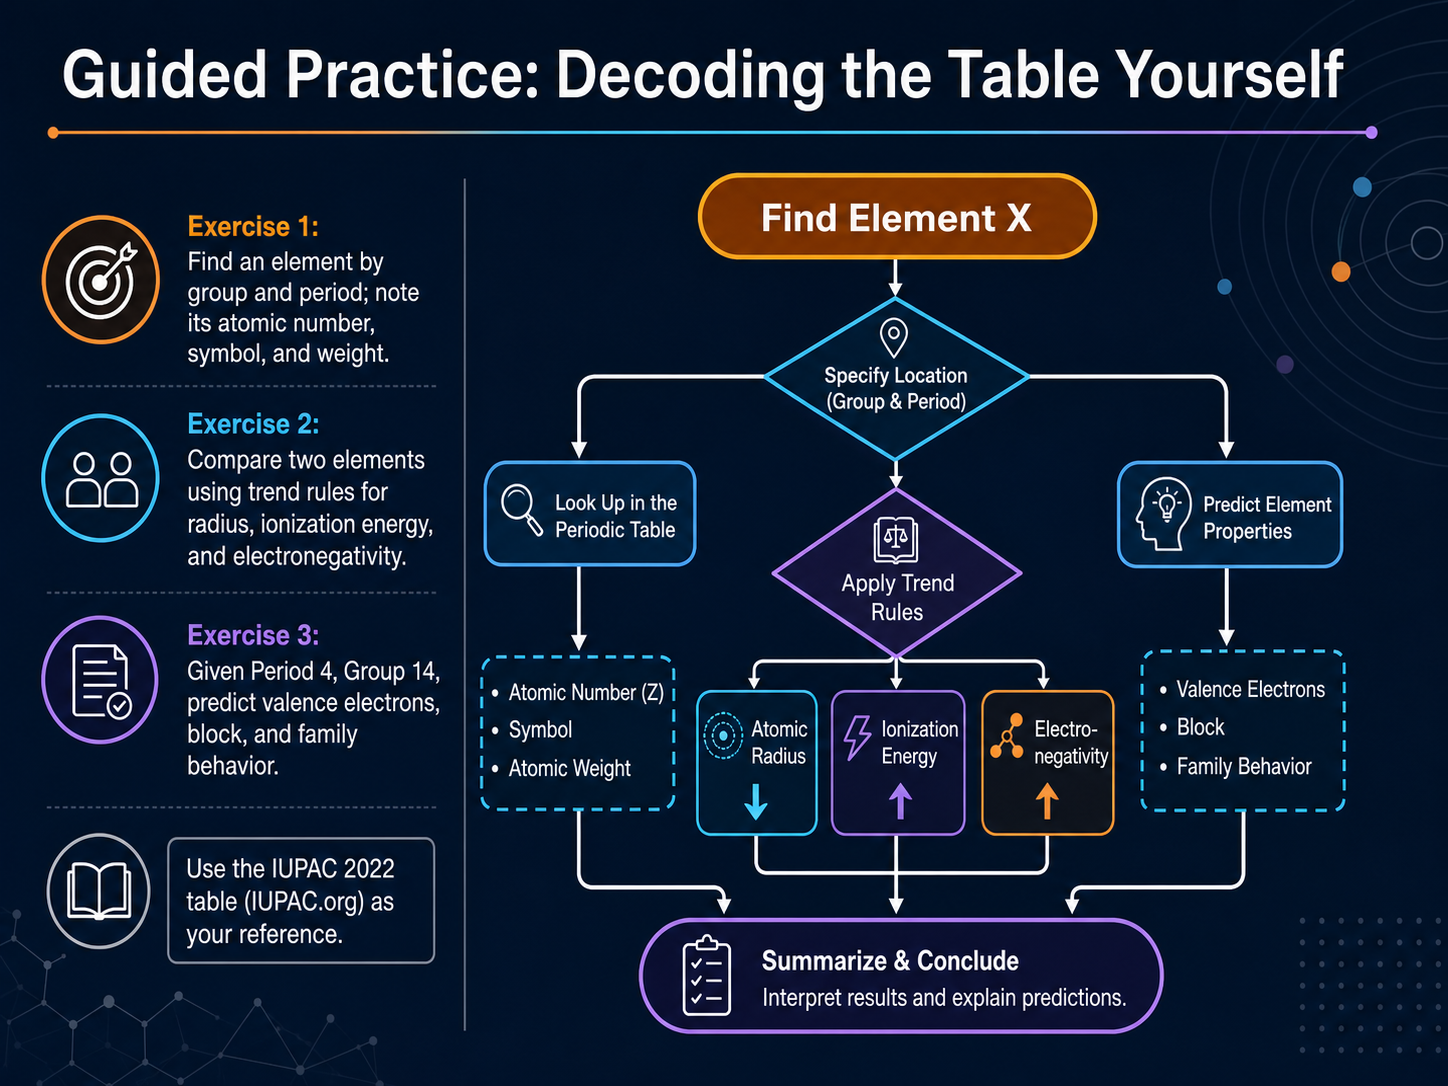
 - 12Guided Practice: Decoding the Table YourselfNow it’s your turn to decode the table directly. This guided practice uses the official IUPAC twenty twenty-two table, which you can download from IUPAC dot org as your reference. First, pick an element by its group and period, then note its atomic number, symbol, and standard atomic weight. Let the table’s grid be your map: group numbers run down the columns, period numbers run across the rows. Second, choose two elements and compare them using the trend rules we discussed. Predict which one has the larger atomic radius, the higher ionization energy, and the greater electronegativity. Check your predictions against published values on the table. Third, find the element in period four, group fourteen. Count its valence electrons, identify its p-block position, and describe the chemical behavior you would expect from that family. Work slowly and let the pattern emerge. When you’re ready, we’ll consolidate these skills with key takeaways and continuing resources.
 iupac.orgiupac.orgiupac.org+22 min
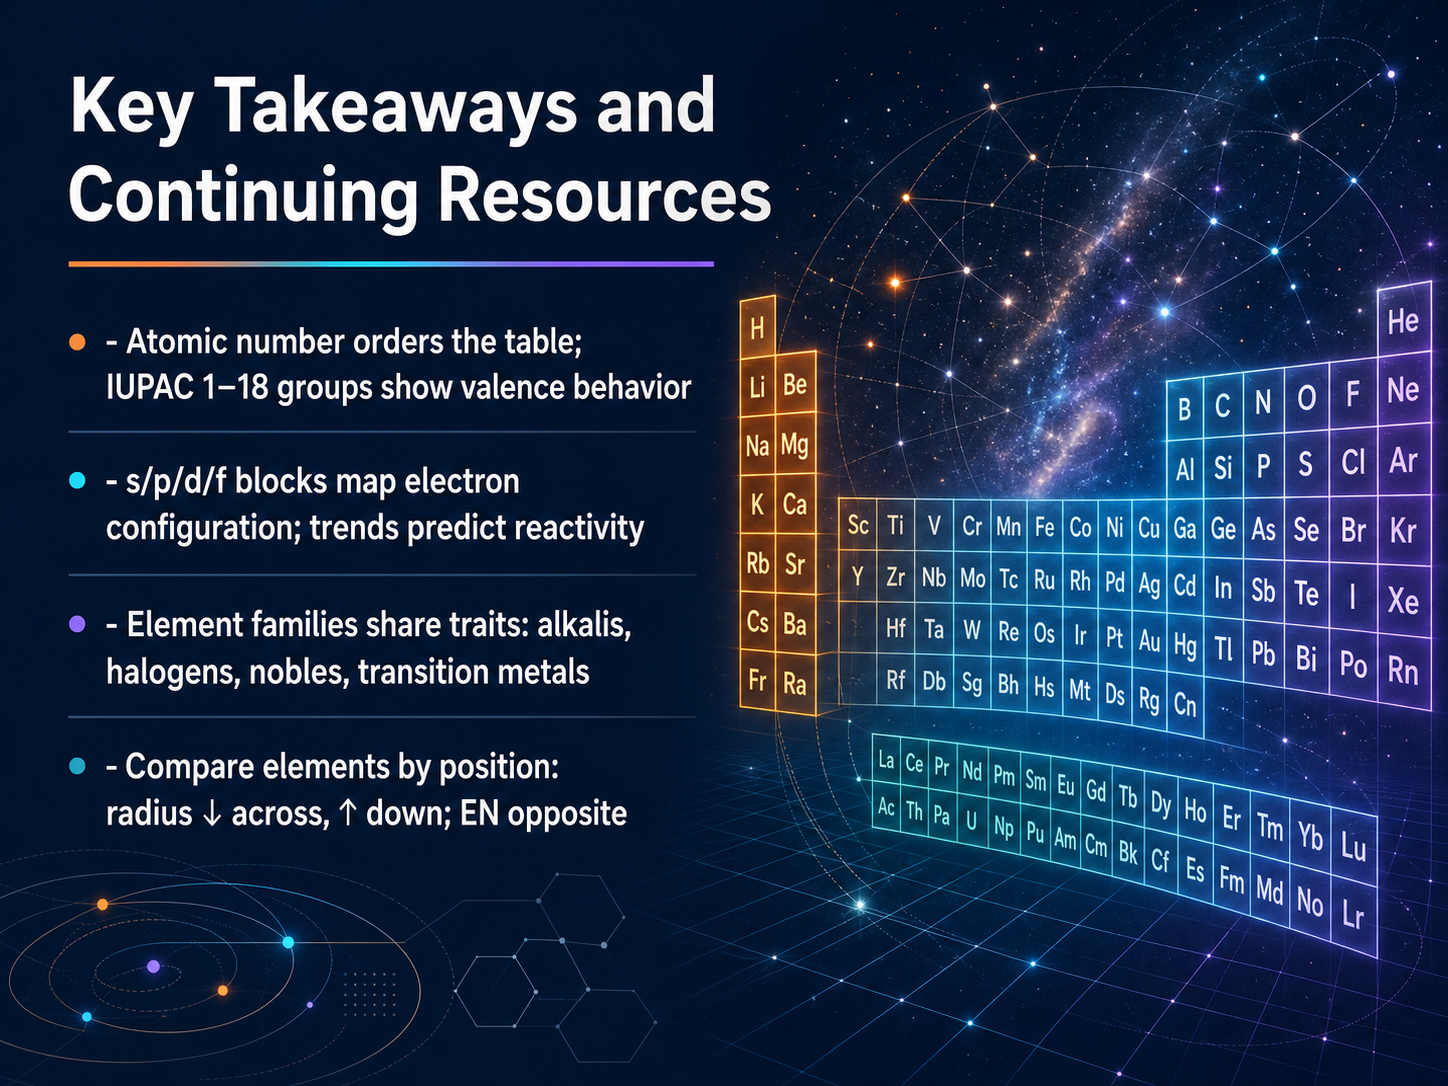
 - 13Key Takeaways and Continuing ResourcesThis brings us to the end of our map across the periodic table. Let's briefly review what we've covered. First, the foundation: elements are arranged by increasing atomic number. That number is the count of protons in the nucleus. The IUPAC one-to-eighteen group system then organizes these elements into columns based on their valence electrons. Second, we looked at the larger blocks: s, p, d, and f. These blocks are a visual map of electron configuration and help you predict trends in reactivity. Third, element families share common traits. The alkali metals, halogens, noble gases, and transition metals each have their own signature behavior that you can now recognize at a glance. Finally, you can compare any two elements just by their positions. Move across a period and the atomic radius shrinks. Move down a group and it grows. Electronegativity follows the opposite pattern, increasing across and decreasing down. You now have a system rather than a list of facts. I encourage you to explore an interactive table, like the ones from the Royal Society of Chemistry, to reinforce these patterns. Thank you for joining me, and keep exploring.
 periodic-table.rsc.orgzperiod.apptabperiodic.com+22 min
Take the deck with you
Download this course as a file — free, no sign-up needed.
- PDF handoutEvery slide page, ready to print or share.14 pages · 4.2 MBDownload
- Narrated PowerPointThe deck that presents itself — every slide carries the digital human's narration video.14 pages · 13.4 MBDownload
- PowerPoint slidesThe full deck as a .pptx — open it in PowerPoint, Keynote, or Google Slides.14 pages · 4.1 MBDownload
Free to use in your own training — please keep the PersonWise credit page at the end.
Have your own deck? Turn it into a course
Sources consulted
Web sources consulted while building this course.
- Periodic Table of Elements - IUPAC | International Union of Pure and ... — iupac.org
- https://iupac.org/wp-content/uploads/2022/07/IUPAC_Periodic_Table-04May22_CRA.pdf — iupac.org
- IUPAC Periodic Table of the Elements and Isotopes (IPTEI) for the Education Community - IUPAC | International Union of Pure and Applied Chemistry — iupac.org
- International Union of Pure and Applied Chemistry > Periodic Table of the Elements — media.iupac.org
- Periodic Table - archives - IUPAC | International Union of Pure and ... — iupac.org
- Chemistry International -- Newsmagazine for IUPAC — publications.iupac.org
- International Union of Pure and Applied Chemistry > Periodic Table of the Elements — moureu.iupac.org
- NEW NOTATIONS IN THE PERIODIC TABLE — publications.iupac.org
- periodic table group numbers — chemguide.co.uk
- Periodic Table – Royal Society of Chemistry — periodic-table.rsc.org
- Zperiod: Interactive Periodic Table (118 Elements, 3D Atom Models) — zperiod.app
- Periodic Table 2026 - Complete, Updated, Online, and 3D Interactive — tabperiodic.com
- Interactive Periodic Table — 118 Elements + Details | RECATOOLS — Practical Tools. Trusted Intelligence. — recatools.com
- Interactive Periodic Table — periodictable.space
- Case study: AI for materials discovery & green chemistry — a city or utility pilot and the results so far | Sustainability Atlas — sustainableatlas.org
- A graph-based approach to selection of feasible compositions for compositionally graded alloy design - Digital Discovery (RSC Publishing) DOI:10.1039/D6DD00006A — pubs.rsc.org
- Material Selection Method Based on Health,... | F1000Research — f1000research.com
- AI-accelerated materials discovery - Enterprise AI Case Studies — case-studies.ai
- CMC | Data-Driven Screening of High-Performance Interconnect Materials: Integrating Graph Learning with Engineering Safety Constraints — techscience.com