Marketing Analytics: Patterns and Pitfalls
Begin
14 pages · ~28 min
Marketing Analytics: Patterns and Pitfalls
This course helps marketers identify common analytics patterns, evaluate their strengths, and avoid pitfalls when interpreting marketing data. Ideal for analysts and marketing professionals.
What you’ll learn
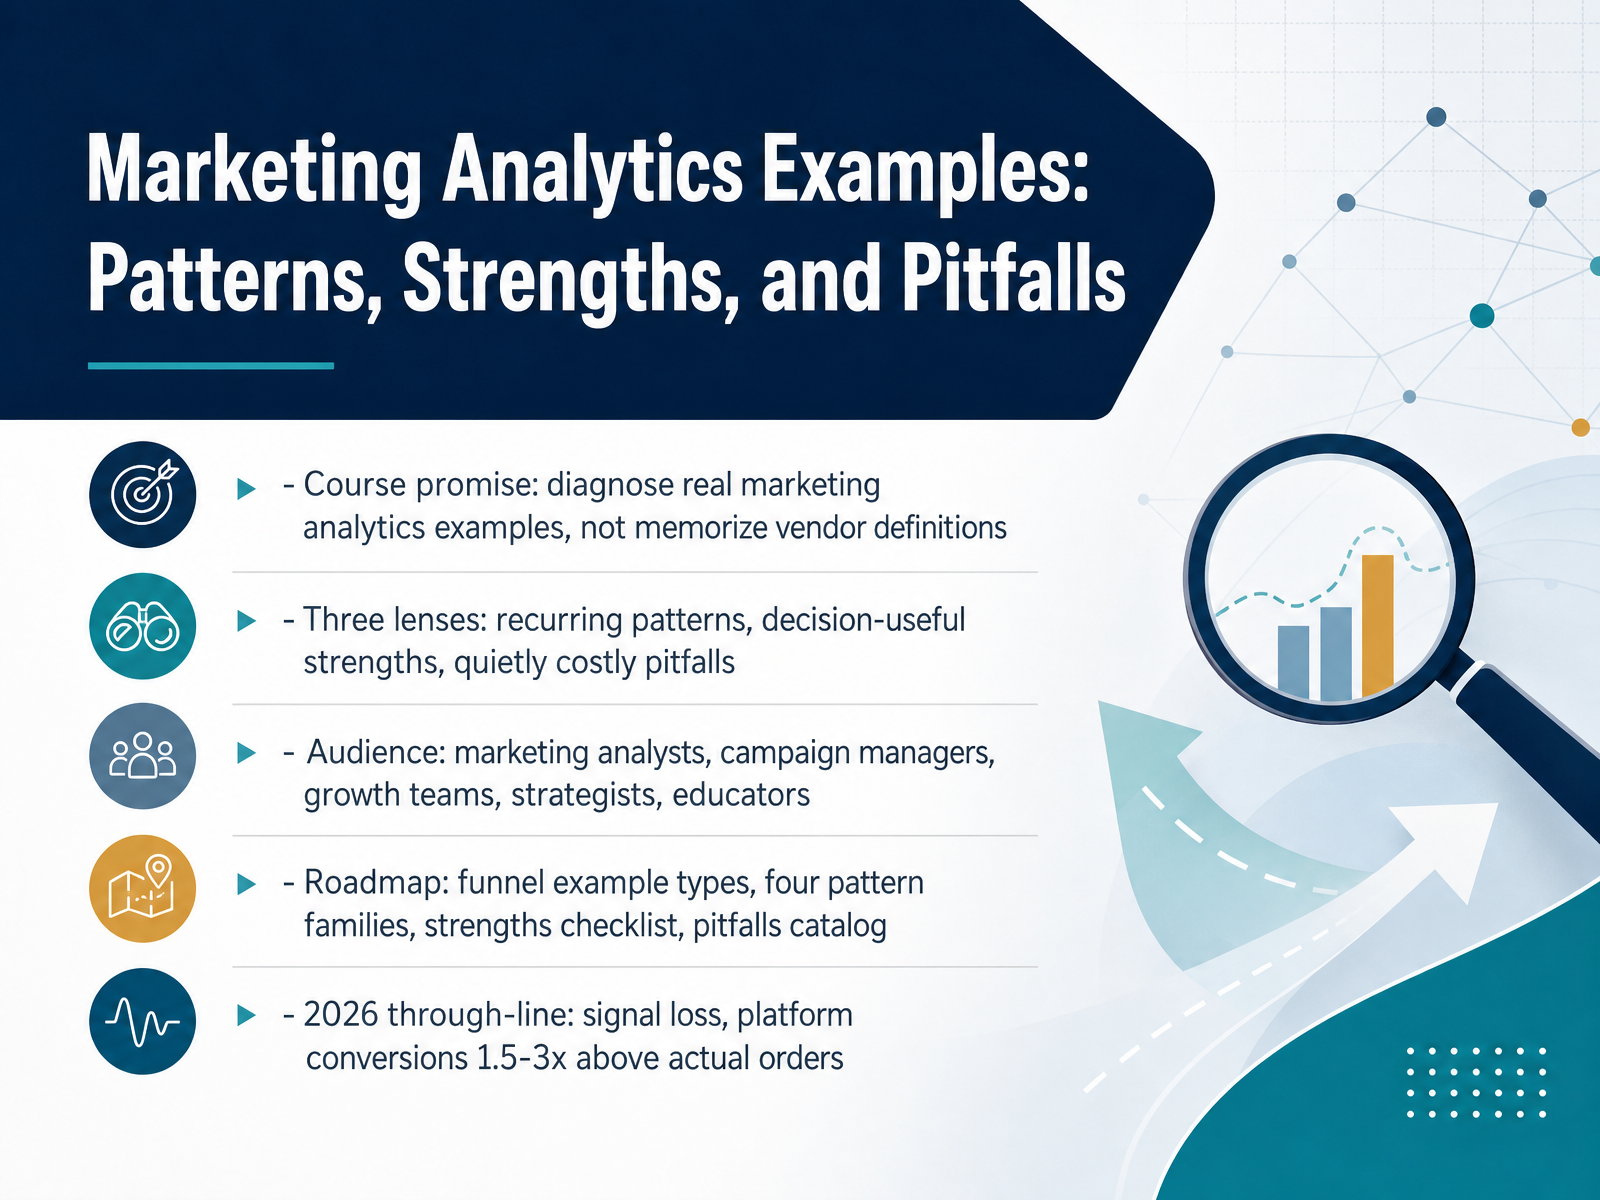
- 01Marketing Analytics Examples: Patterns, Strengths, and PitfallsWelcome. This course is called Marketing Analytics Examples: Patterns, Strengths, and Pitfalls. Our goal here is diagnostic, not definitional. We are going to look at real examples and ask what the data actually supports, rather than memorizing vendor phrasing.
We will use three lenses. First, recurring patterns: what shows up again and again in tracked journeys. Second, decision-useful strengths: where analytics genuinely improves a budget or creative call. Third, quietly costly pitfalls: the errors that look like insight. You are analysts, campaign managers, growth teams, strategists, and educators, so we will name the decision at stake, the metric that matters, and the conditions under which a claim holds. We will not pretend correlation is causation, and we will flag sample bias and noisy tests as they appear.
A through-line for 2026: signal loss is real. Platform-reported conversions routinely run one point five to three times above actual orders. Keep that in mind as we work through funnel example types, four pattern families, a strengths checklist, and a pitfalls catalog.
Let's start with why examples beat definitions.houseofmartech.comchillmetrics.cosaasanalytics.io+22 min
- 02Why Examples Beat DefinitionsLet's talk about why examples beat definitions. Definitions shift by vendor, team, and context, so two analysts can argue all day about the same metric and never touch the actual decision. Examples expose the assumptions behind shared vocabulary. Here's the distinction that matters. A pattern is a repeatable structure, not just a statistic. And failure modes repeat predictably. Last-click attribution, for instance, systematically over-credits bottom-funnel channels, which is why pitfalls teach faster than wins. So test any example against three questions. What question are we answering? What data actually supports it? And what decision flips if the answer changes? If no decision flips, the number is decorative. Keep those three questions in hand as we move into core example types across the marketing funnel.
 trustmedia.ioprooflytics.iodatadrivenmarketer.me+21 min
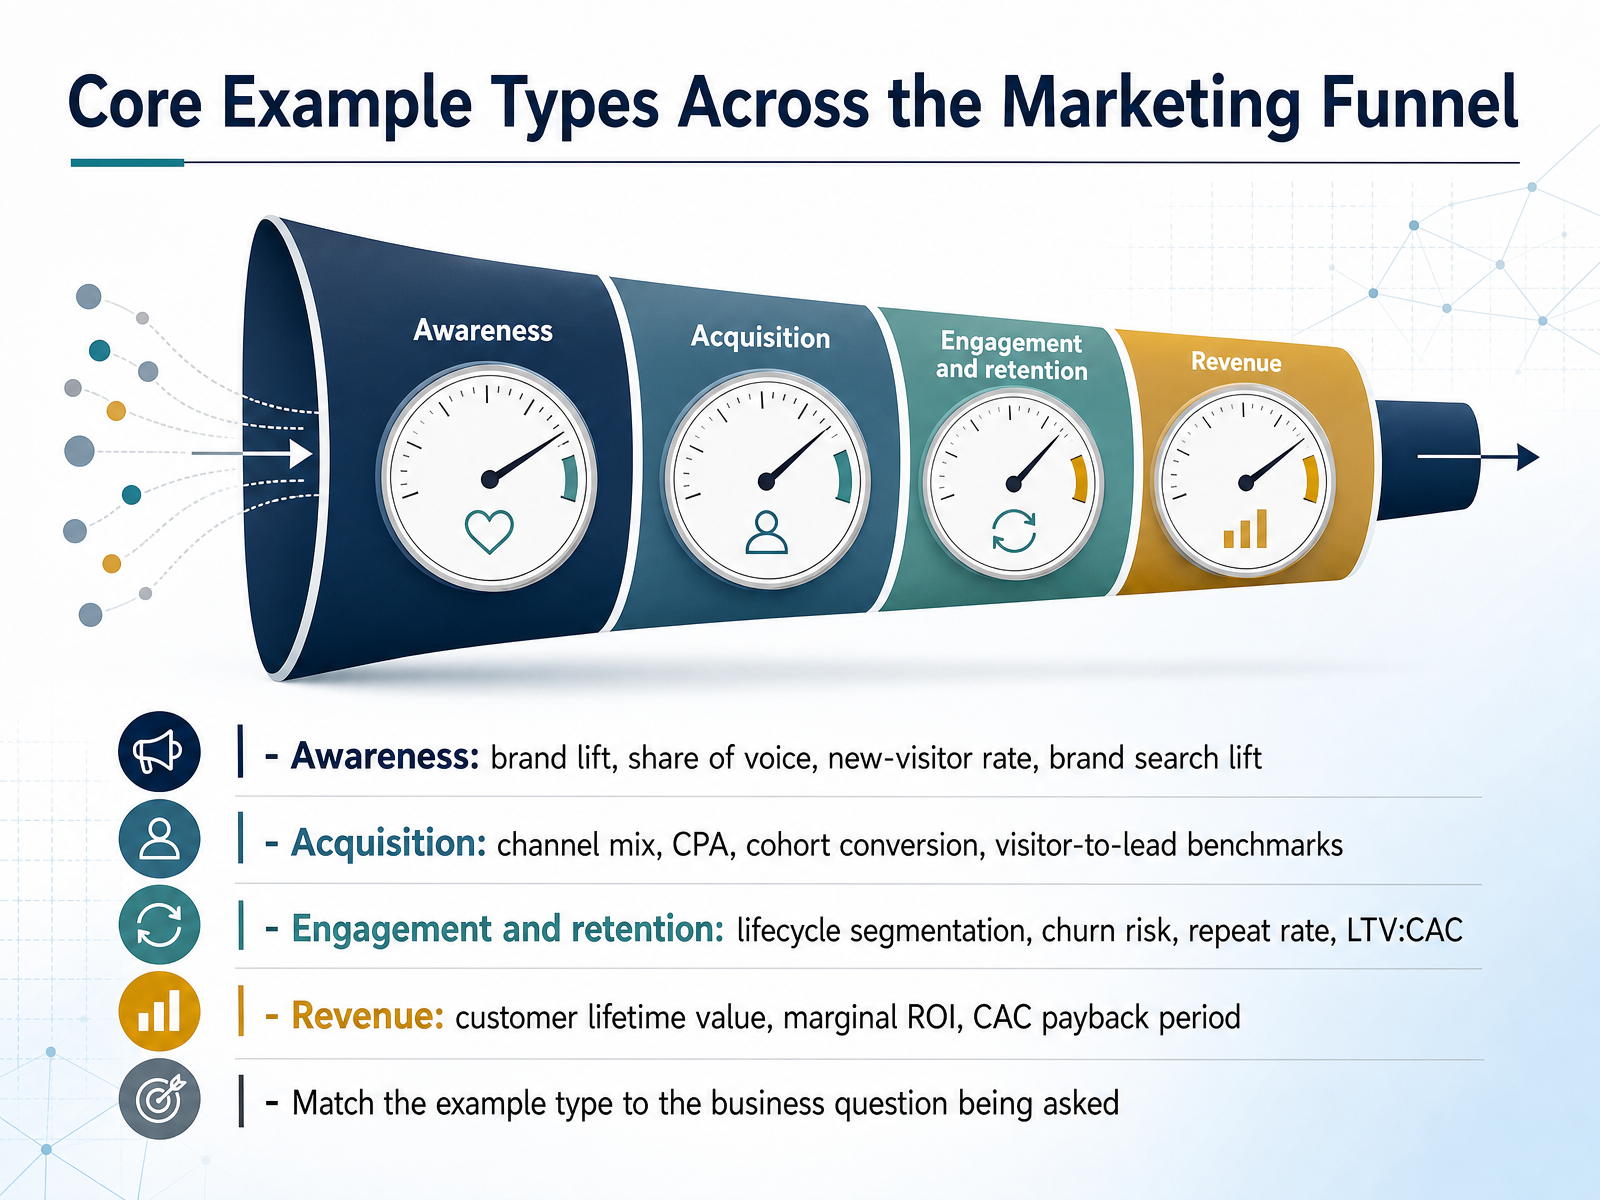
 - 03Core Example Types Across the Marketing FunnelLet's walk through the core example types you'll actually encounter across the funnel. At the awareness stage, direct conversion attribution is weak, so lean on leading indicators: brand lift, share of voice, new-visitor rate, and brand search lift. Brand search volume often moves before revenue does, which makes it a useful early read. In acquisition, you're comparing channel mix, cost per acquisition, cohort conversion, and visitor-to-lead benchmarks. Then engagement and retention: lifecycle segmentation, churn risk, repeat rate, and the ratio of lifetime value to customer acquisition cost. At the revenue stage, you're working with customer lifetime value, marginal return on investment, and CAC payback period. One caution throughout: these are patterns, not proof of causation. Treat them as diagnostic signals, and match the example type to the business question you're actually asking. Next, we'll look at Pattern 1: Attribution and Channel Mix Examples.
 ad-times.comcometly.comcentricdxb.com+22 min
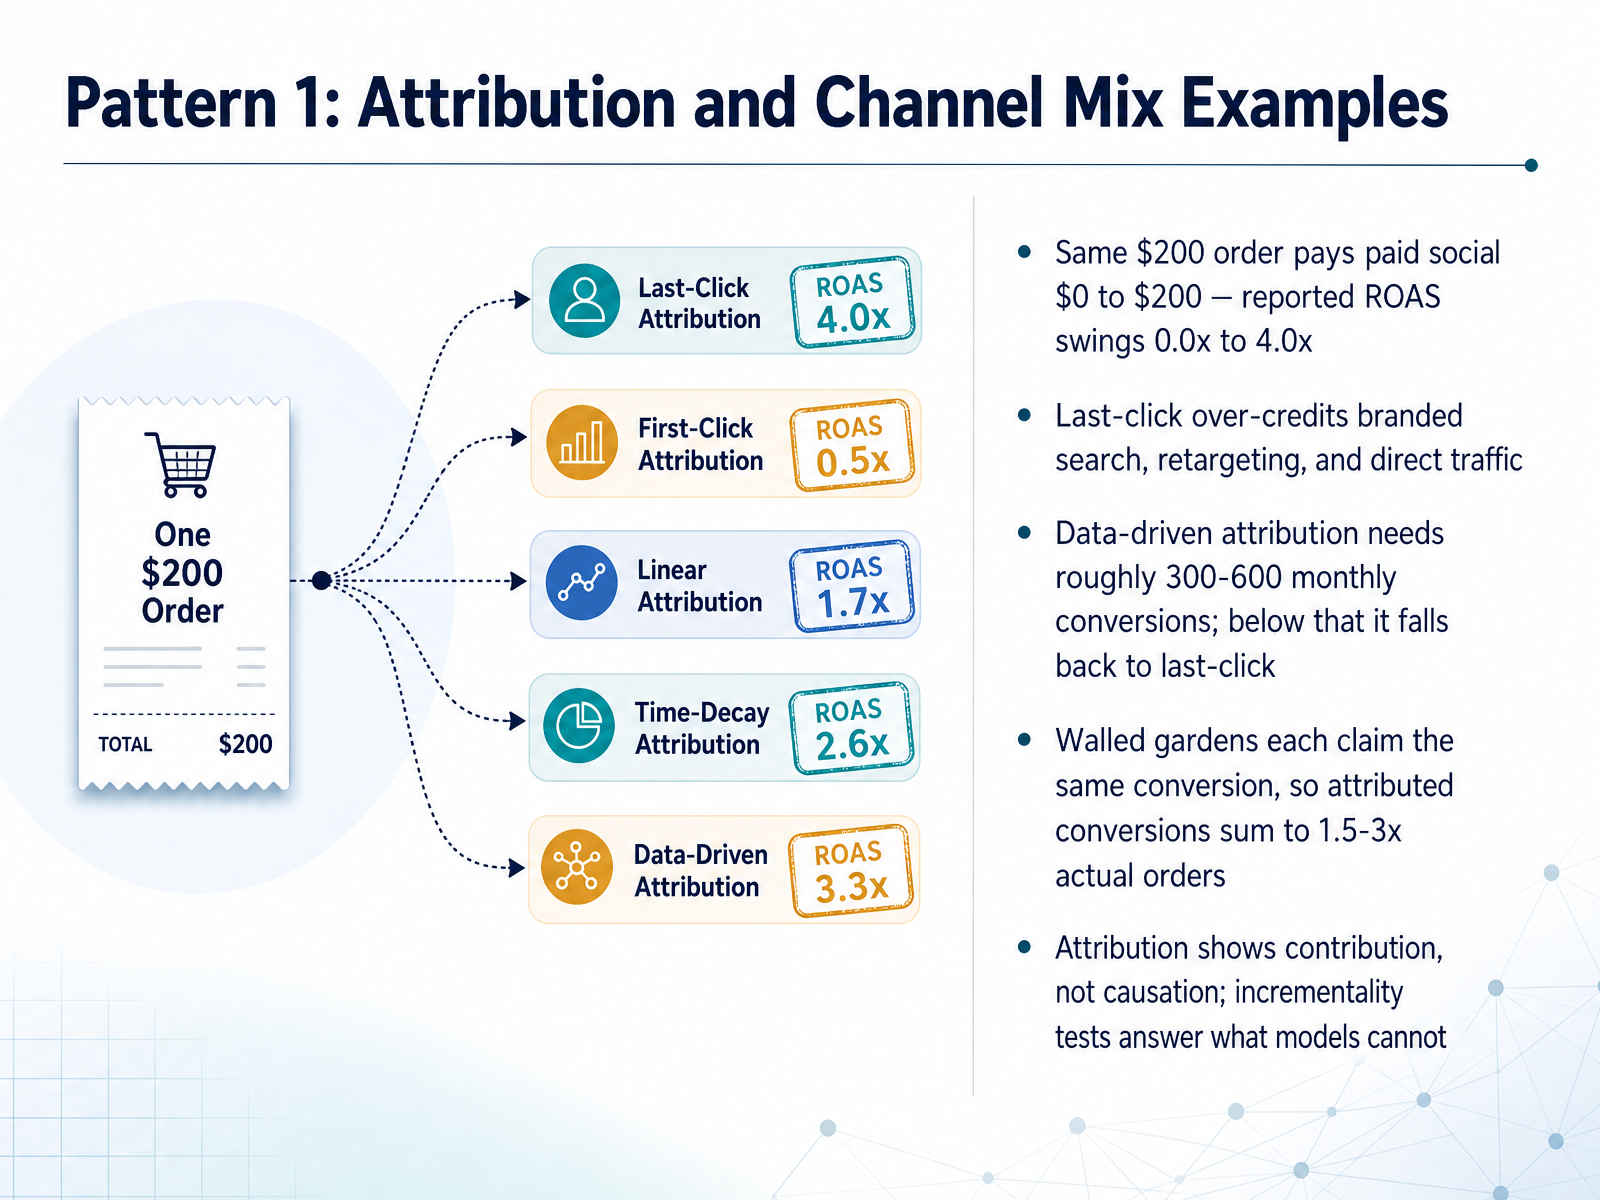
 - 04Pattern 1: Attribution and Channel Mix ExamplesLet's look at our first pattern: attribution and channel mix. The decision at stake is budget allocation, so watch how much the model itself moves the number. Take one two-hundred-dollar order. Depending only on which attribution model you pick, paid social gets credited anywhere from zero to the full two hundred dollars. Reported return on ad spend swings from zero to four x on identical spend. Last-click makes it worse. It over-credits branded search, retargeting, and direct traffic, because those capture demand that already existed. Data-driven attribution needs roughly three hundred to six hundred monthly conversions. Below that, it quietly falls back to last-click. Then there's the walled garden problem. Each platform claims the same conversion, so attributed conversions sum to one and a half to three times your actual orders. So treat attribution as a contribution signal, not proof of causation. Incrementality tests answer what models cannot. Next, we'll see what that misallocation costs in practice, in Attribution Example in Practice: Budget Misallocation.
 houseofmartech.comchillmetrics.cosaasanalytics.io+22 min
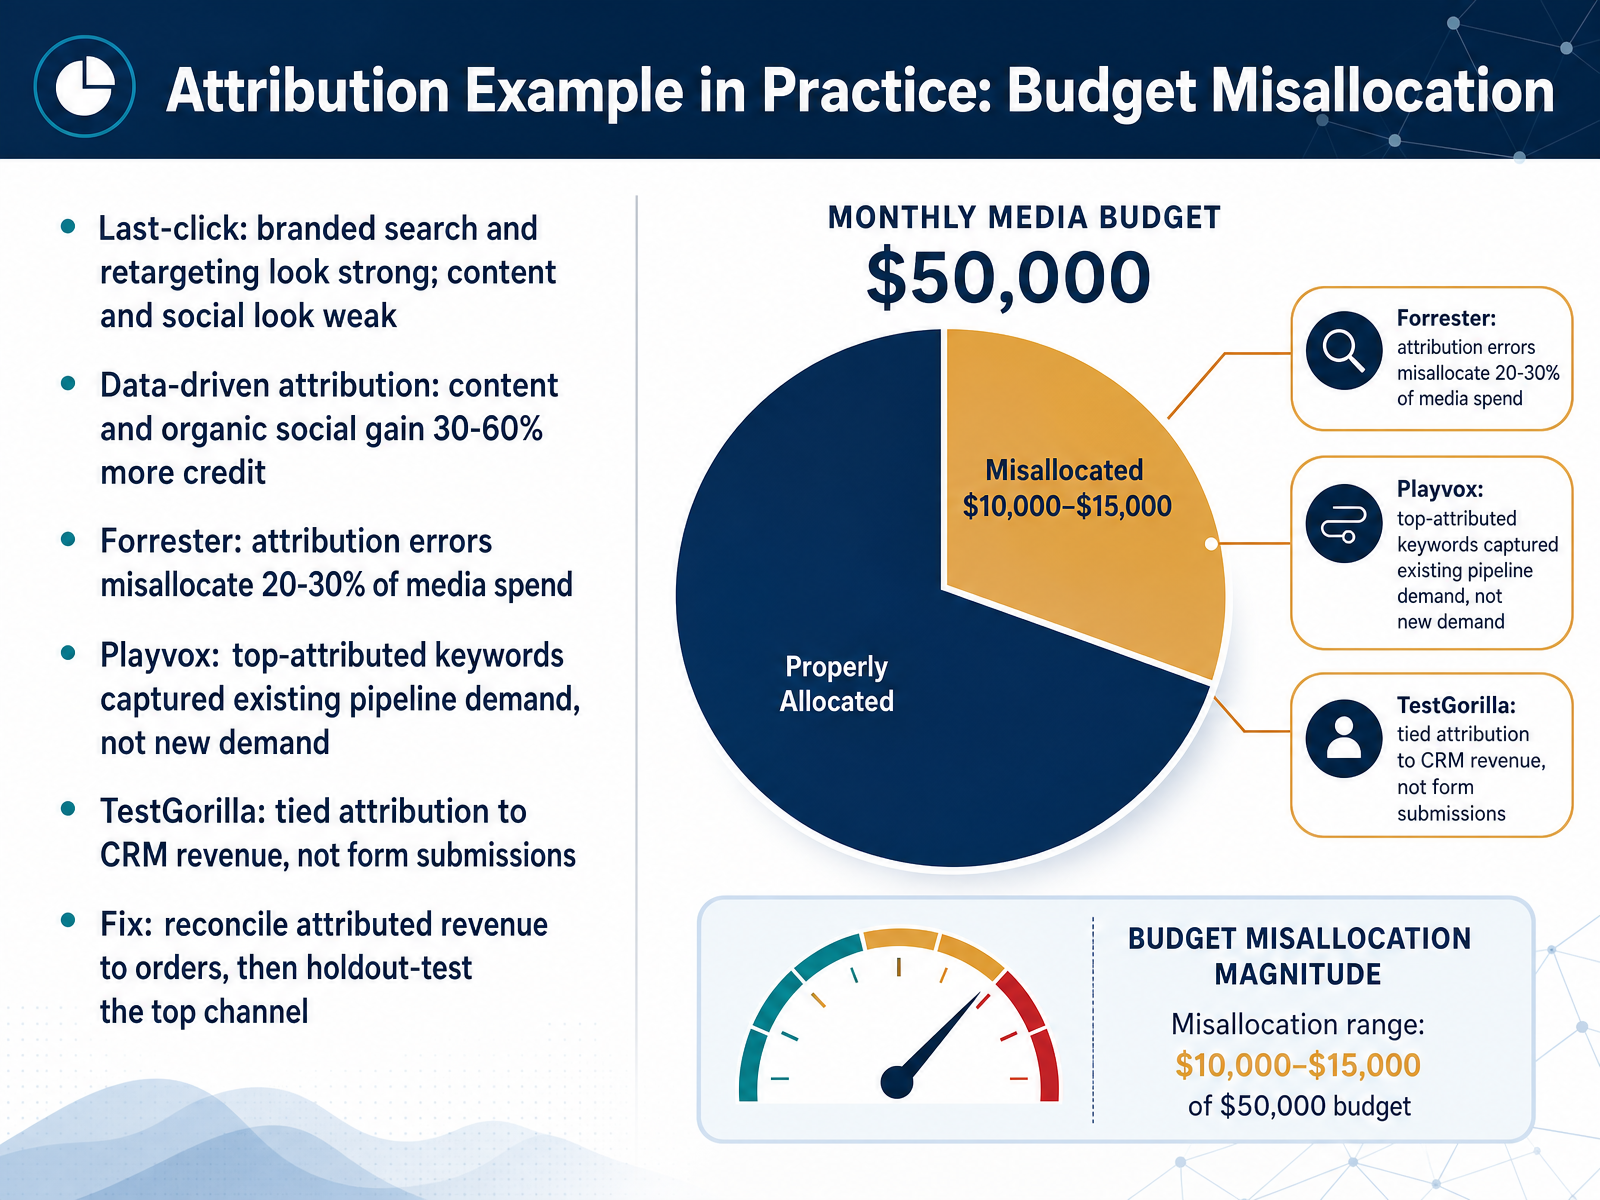
 - 05Attribution Example in Practice: Budget MisallocationLet's look at how attribution goes wrong in practice: budget misallocation. Under last-click, branded search and retargeting look strong, while content and organic social look weak. That is a structural distortion, not a performance result, because those bottom-of-funnel channels are simply present when demand already exists. Shift to data-driven attribution, and content and organic social typically gain thirty to sixty percent more credit. Forrester estimates attribution errors misallocate twenty to thirty percent of media spend. Playvox found their top-attributed keywords were capturing existing pipeline demand rather than creating new demand. TestGorilla fixed this by tying attribution to CRM revenue instead of form submissions. So here is the move: reconcile attributed revenue to actual orders, then holdout-test your top channel. That is how you separate correlation from causation. Next, Pattern 2: Experimentation and A/B Test Examples.
 houseofmartech.comchillmetrics.cosaasanalytics.io+22 min
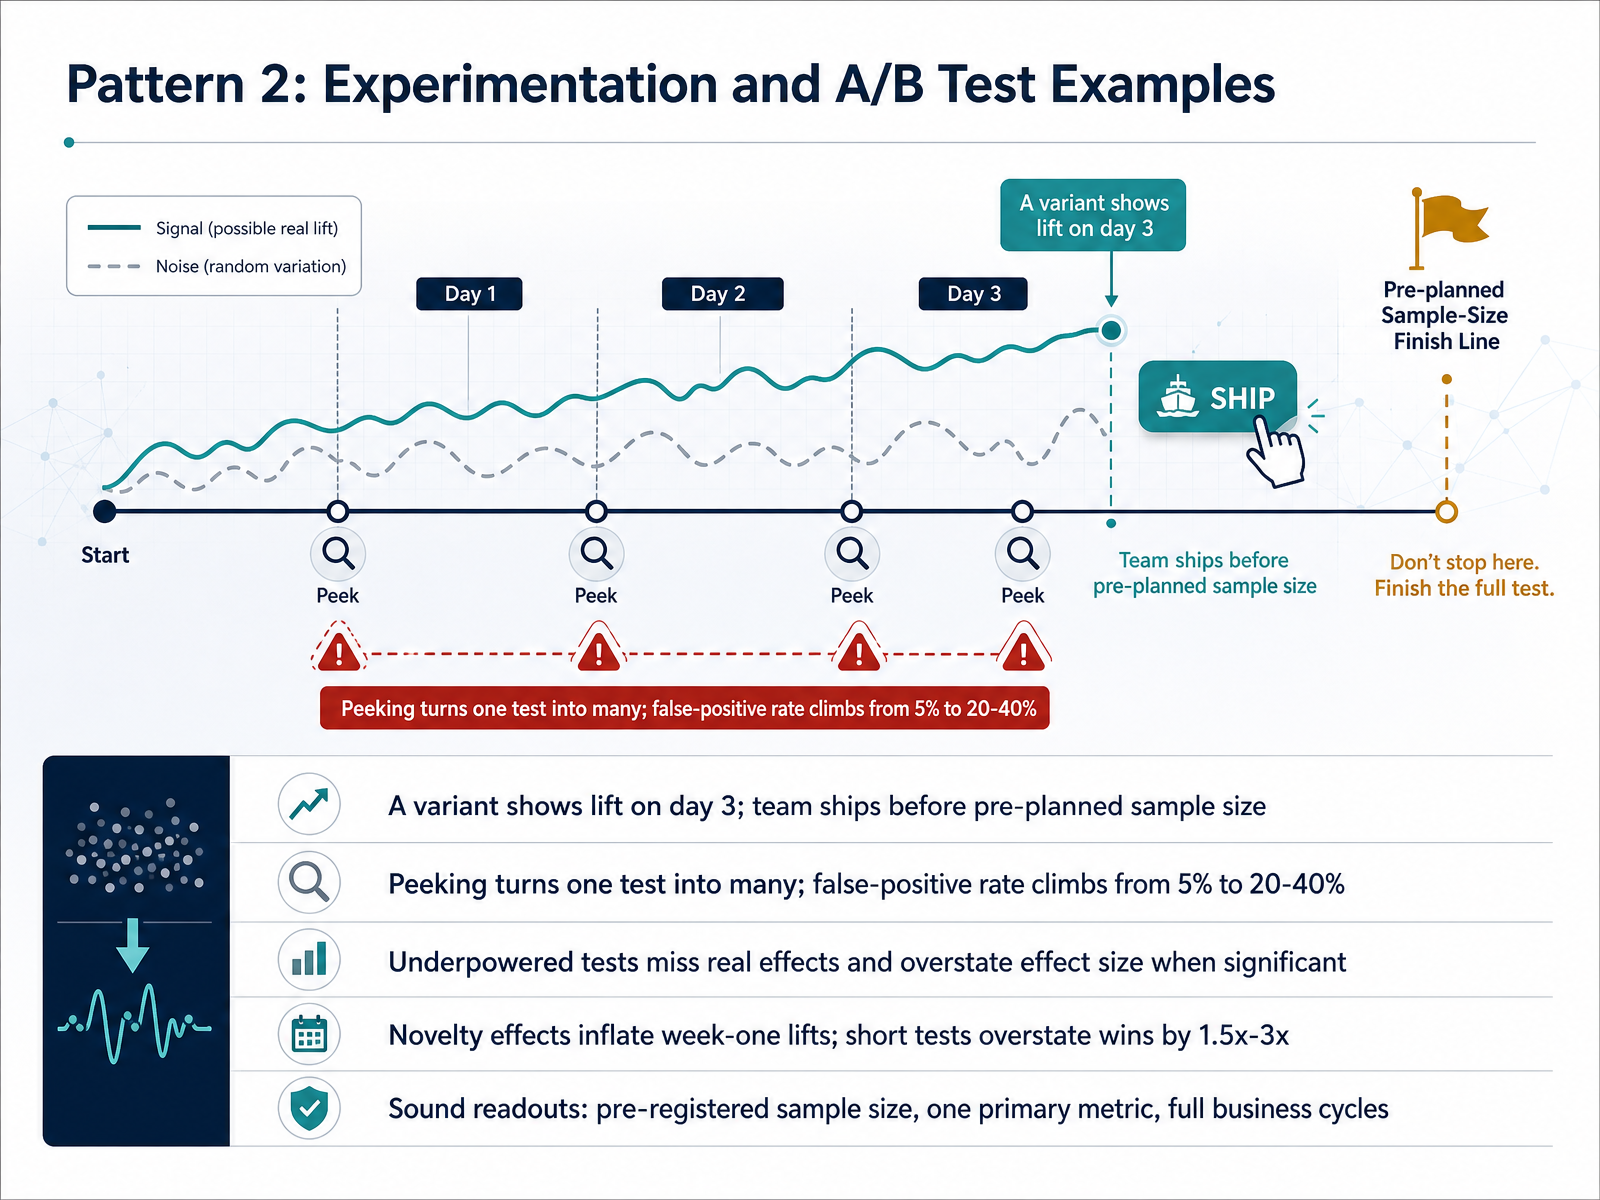
 - 06Pattern 2: Experimentation and A/B Test ExamplesNow let's look at a second pattern, where experimentation mistakes quietly manufacture wins. Say a variant shows lift on day three. The team ships before the pre-planned sample size. That's peeking. Peeking turns one test into many looks, and the false-positive rate climbs from about five percent to somewhere between twenty and forty percent, depending on how often you check. Underpowered tests cut the other way. They miss real effects, and when they do reach significance, the effect size is systematically overstated. That's the winner's curse. Novelty effects are just as common. A noticeable change spikes in week one because returning users are curious, then fades. On familiar surfaces, short tests can overstate wins by roughly one and a half to three times. So what does a sound readout look like? Pre-register your sample size. Commit to one primary metric. And run full business cycles, at least two weeks, so novelty and weekly seasonality wash out. Next, let's cover readout patterns involving segments, ratios, and stopping rules.
 dataexpertise.inalijabbary.comatticusli.com+22 min
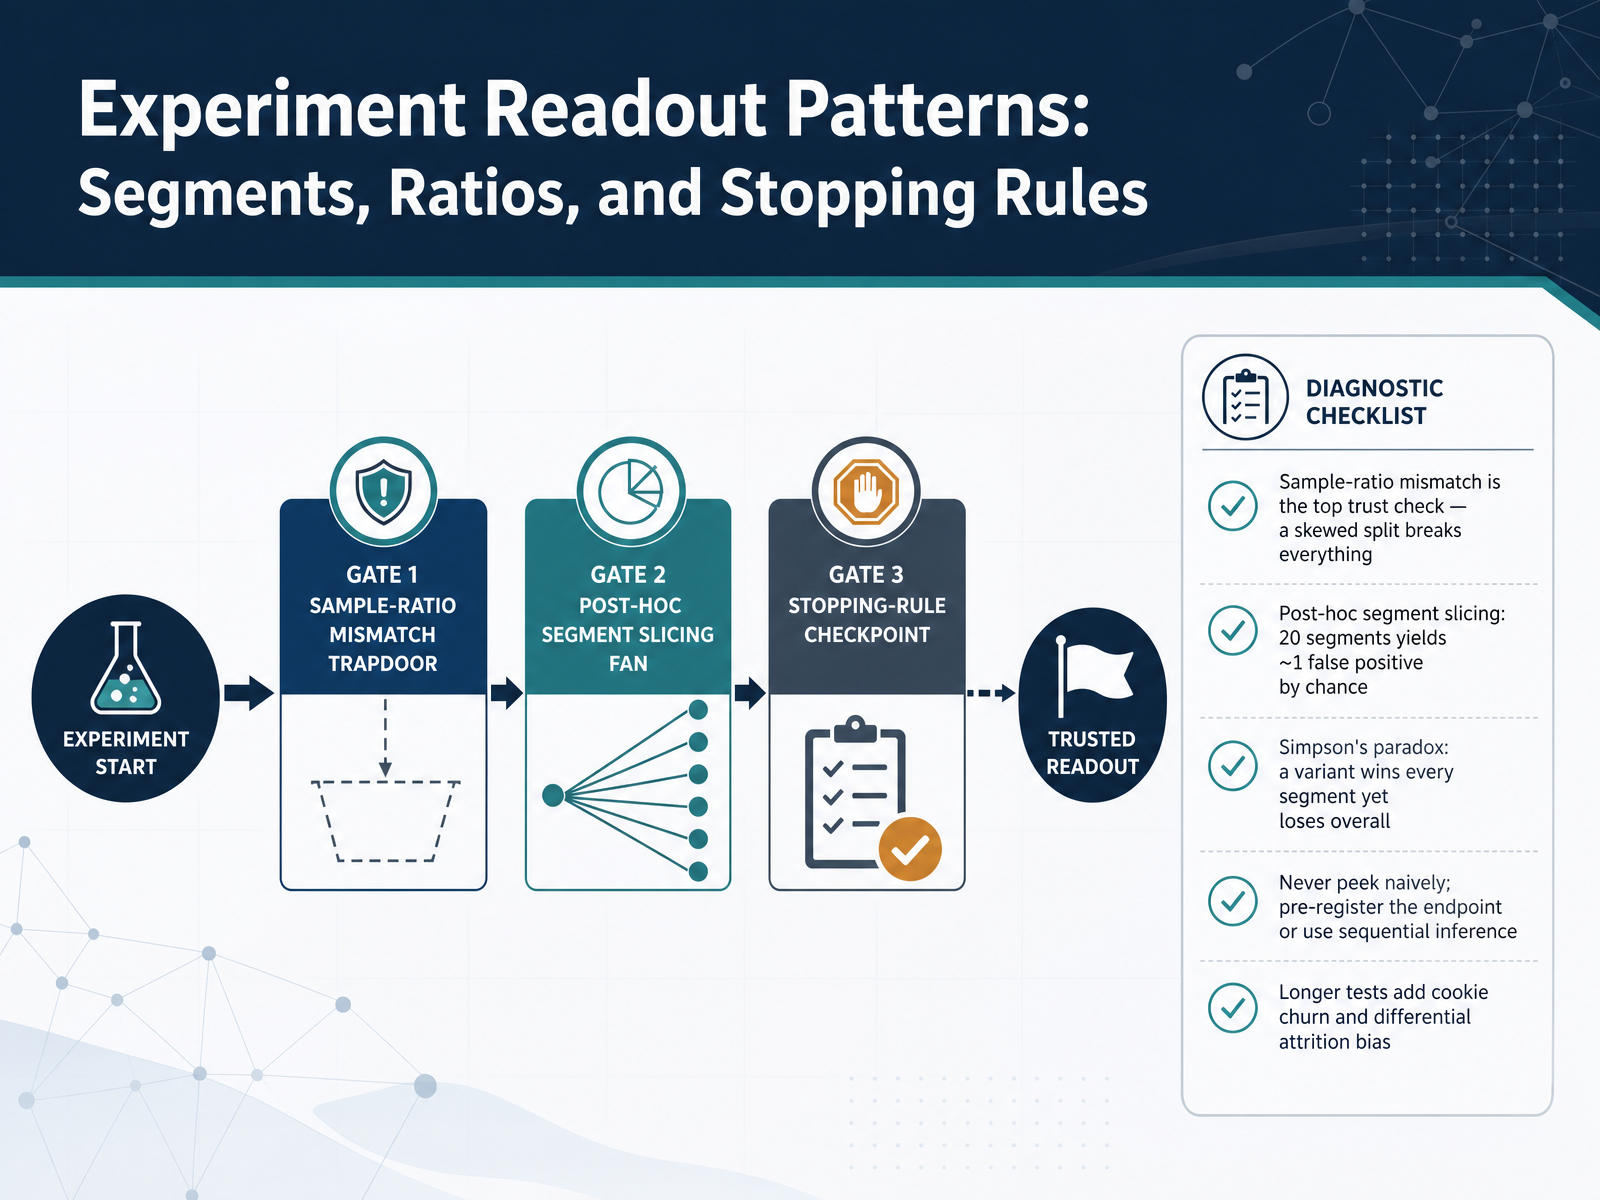
 - 07Experiment Readout Patterns: Segments, Ratios, and Stopping RulesNow let's talk about experiment readout patterns. Start with the trust check that outranks everything else: sample-ratio mismatch. If your split is skewed, assume broken randomization and fix it before you read a single metric. Next, post-hoc segment slicing. Slice twenty ways and you should expect roughly one false positive by chance. That is not insight, it is roulette. Treat those slices as hypotheses for your next test, never as a result to ship today. Then there is Simpson's paradox, where a variant wins inside every segment yet loses overall, because the segments are mixed in different proportions. Check traffic composition across arms before you celebrate or panic. On stopping rules, do not peek naively. Run twenty unadjusted looks on a null effect and your false-positive rate climbs well past the five percent you signed up for. Either pre-register your endpoint and wait for it, or use sequential inference built for continuous monitoring. Finally, longer tests are not free. Cookie churn and differential attrition can bias who is left in the sample, so match duration to the change. Pattern 3: Customer Segmentation and Lifecycle Examples.
 dataexpertise.inalijabbary.comatticusli.com+22 min
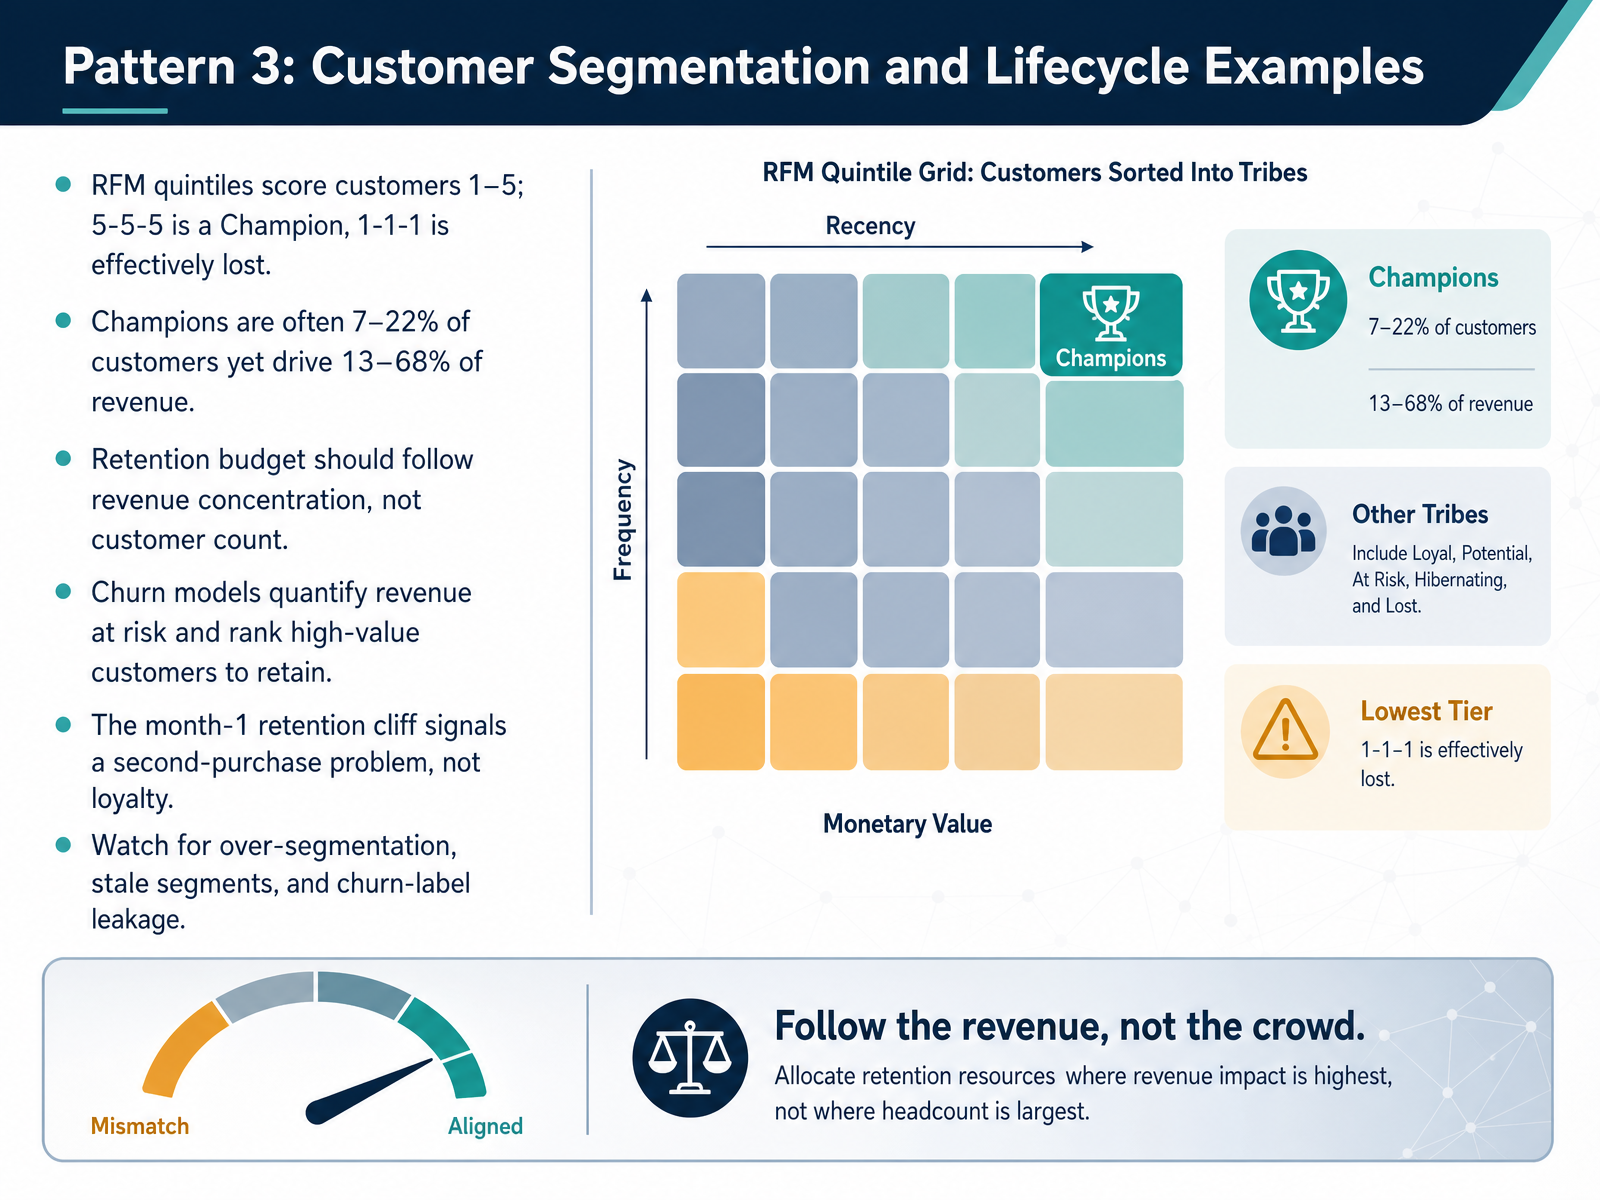
 - 08Pattern 3: Customer Segmentation and Lifecycle ExamplesNow let's look at pattern three: customer segmentation and lifecycle. Start with RFM. Quintiles score every customer from one to five on recency, frequency, and monetary value. Five-five-five is a Champion, and one-one-one is effectively lost. Here is the decision at stake: where do you put retention budget? Follow revenue concentration, not customer count. In one UK retailer, Champions were twenty-two percent of customers but drove sixty-eight percent of revenue. In a Brazilian marketplace, Champions were seven percent of customers and still generated thirteen percent of revenue. So the range is wide, but the direction is consistent. Churn models add the forward view. They quantify revenue at risk and rank high-value customers worth saving. One project flagged twelve point three million reais at risk with a model at zero point seven one ROC AUC. Then watch the retention curve. A month-one cliff signals a second-purchase problem, not loyalty. Fix onboarding before building a loyalty program. Finally, guard against three pitfalls: over-segmentation, stale segments, and churn-label leakage, where recency quietly predicts your own target. Next, we put this into practice with the LTV-by-churn matrix.
 2 min
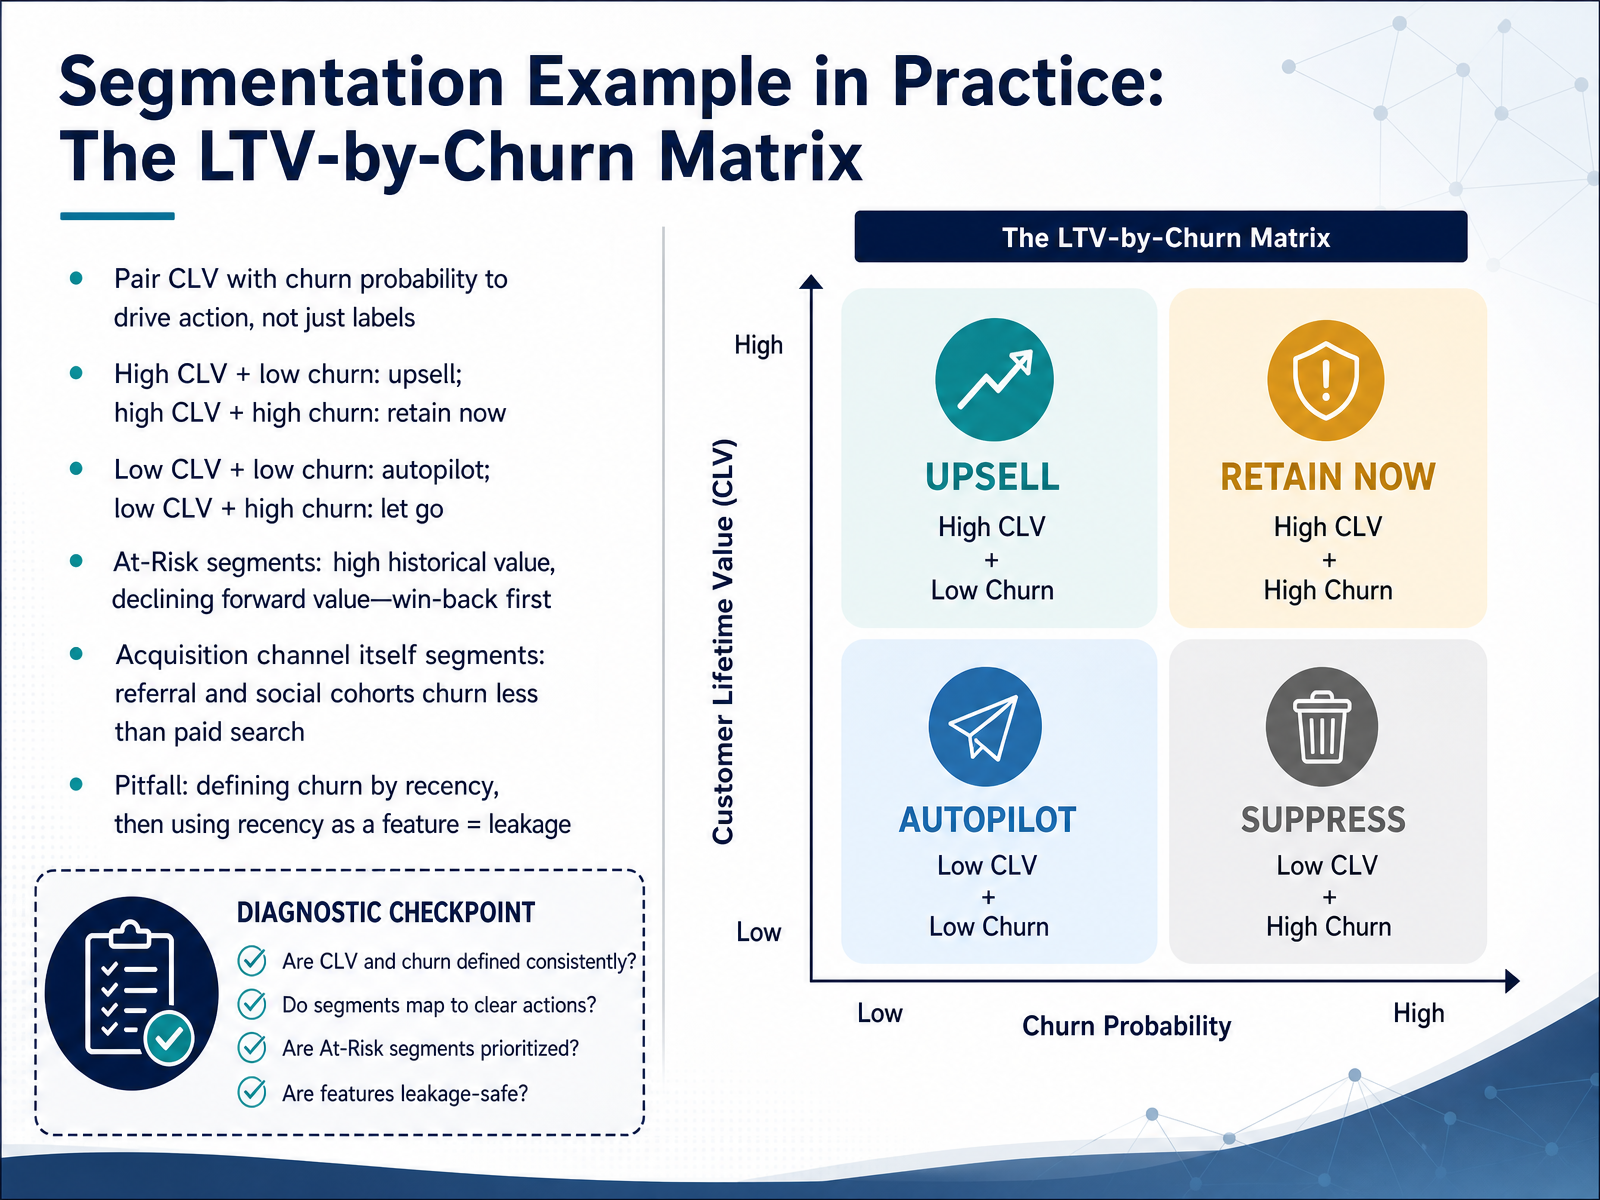
2 min - 09Segmentation Example in Practice: The LTV-by-Churn MatrixLet's walk through segmentation in practice with the lifetime value by churn matrix. The core move here is pairing predicted lifetime value with churn probability to drive action, not just labels. High value plus low churn risk means upsell. High value plus high churn risk means retain now and protect that revenue. Low value plus low churn risk runs on autopilot. Low value plus high churn risk, let go gracefully, or suppress paid spend entirely. Then watch the At Risk segment, customers with high historical value but declining forward value. Those get win-back first, because that is where recovery dollars actually sit. And here is a pattern worth testing in your own data, acquisition channel itself segments your base. In several e-commerce analyses, referral and social cohorts churned less than paid search. That is an observed pattern, not a rule, so validate it against your own mix before you shift budget. One pitfall to flag: if you define churn by recency, then feed recency into the model as a feature, you have leakage. Your model looks sharp and predicts nothing useful. Keep the target and the features separated. Next, Pattern 4: Forecasting and Budget Optimization Examples.
 2 min
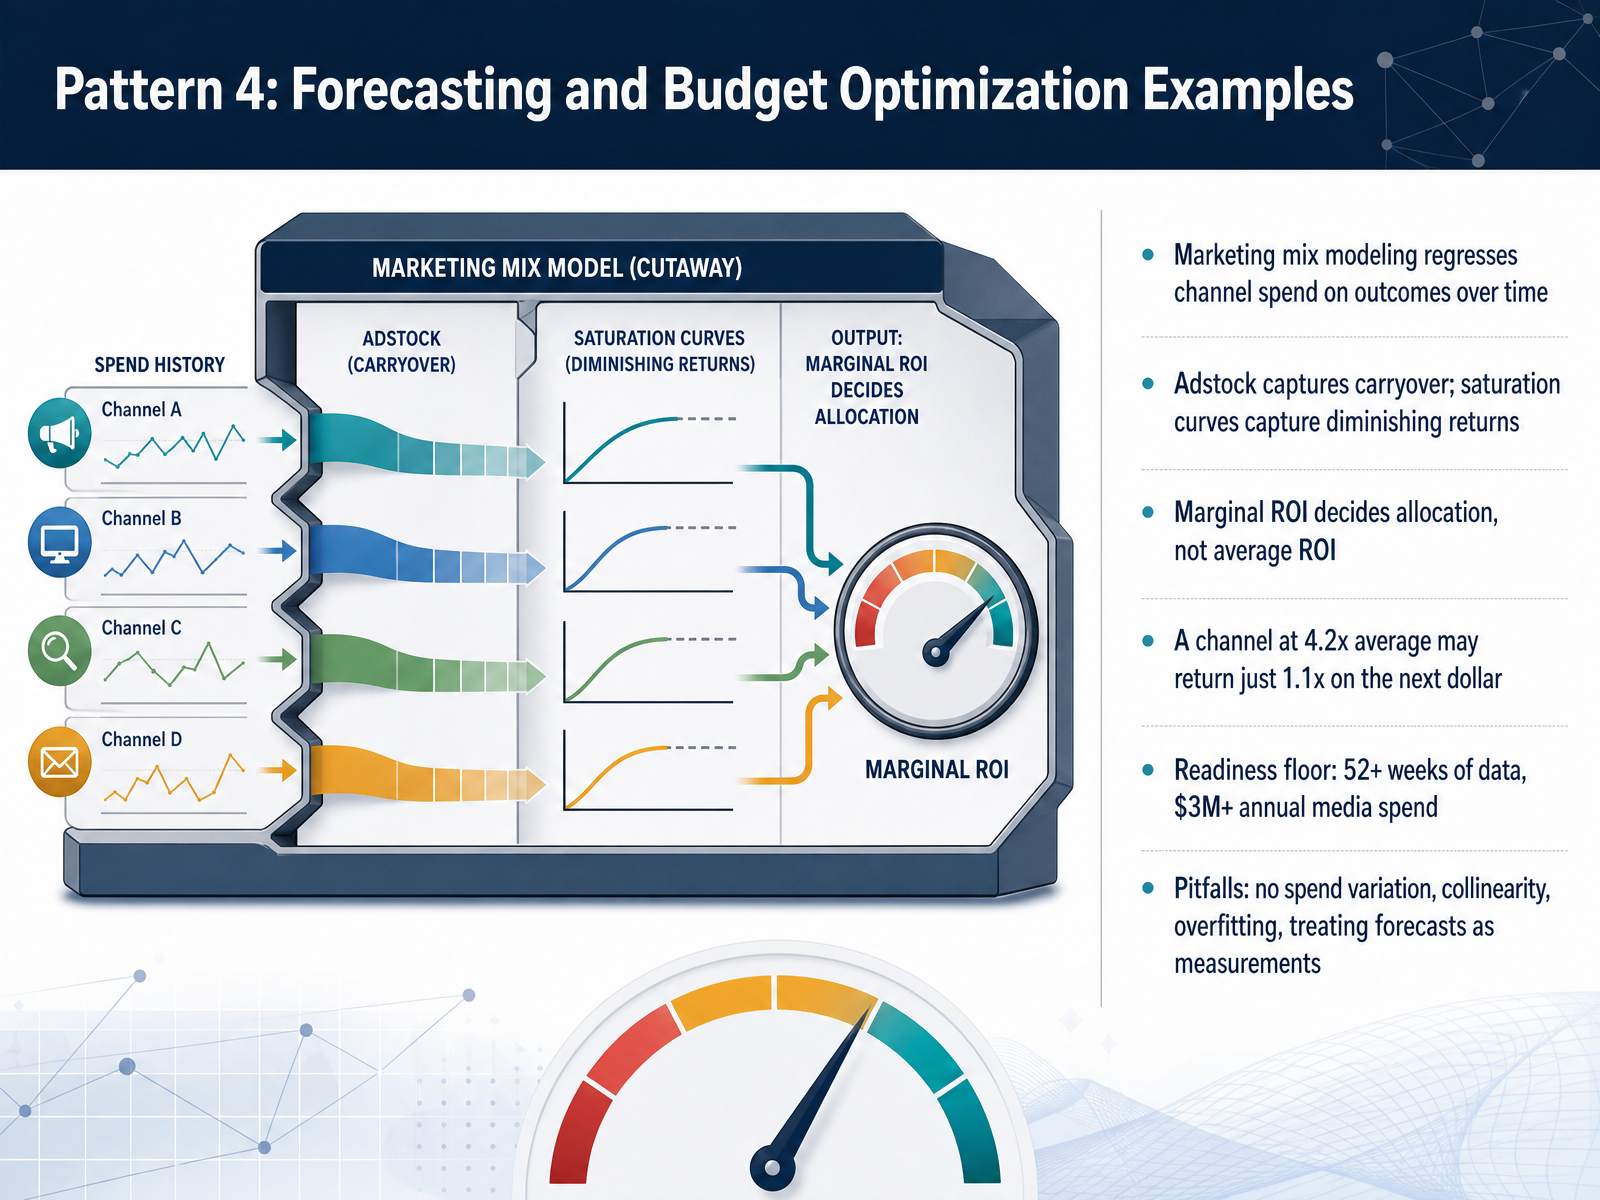
2 min - 10Pattern 4: Forecasting and Budget Optimization ExamplesNow let's look at forecasting and budget optimization in practice. Marketing mix modeling regresses channel spend on outcomes over time, using adstock to capture carryover and saturation curves to capture diminishing returns. The decision at stake is allocation, and the metric that decides it is marginal ROI, not average ROI. A channel can post a four point two times average return while its next dollar returns just one point one times, because the average still contains all that efficient historic spend. That is saturation, and it changes where the next dollar should go. A practical readiness floor: about fifty two weeks of weekly data and roughly three million dollars in annual media spend. Below that, uncertainty swamps the signal. Watch four pitfalls: no spend variation, so the model has nothing to learn from; collinearity, when channels always move together; overfitting, which explains history and predicts nothing; and treating forecasts as measurements. They are estimates with confidence intervals. Validate against holdout periods and incrementality tests before you move real money. Next, let's see what a reallocation looks like when the total budget stays the same.
 2 min
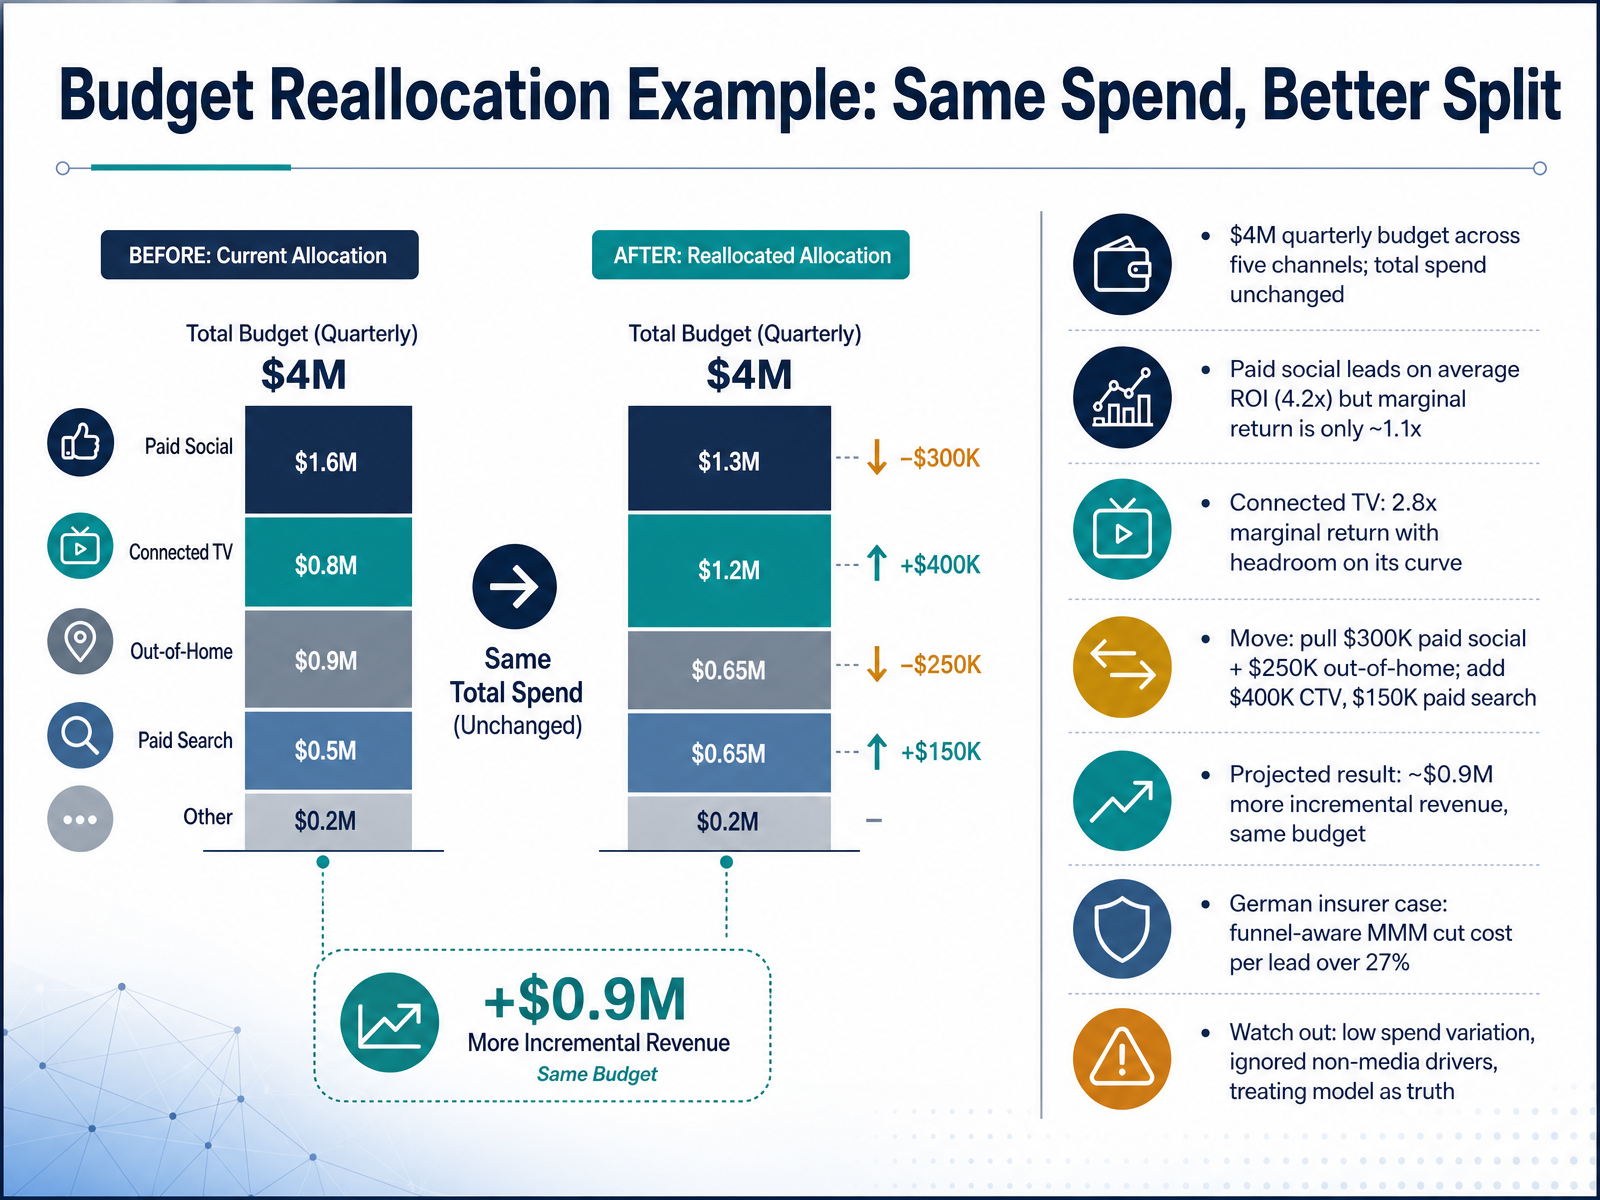
2 min - 11Budget Reallocation Example: Same Spend, Better SplitLet's walk through a full reallocation decision. Picture a four million dollar quarterly budget across five channels. Total spend stays fixed. Paid social leads on average ROI at four point two times, but its marginal return is only about one point one times. That channel is saturated. Connected TV sits at two point eight times marginal return with real headroom on its curve. So the move is straightforward. Pull three hundred thousand from paid social and two hundred fifty thousand from out-of-home, then add four hundred thousand to connected TV and one hundred fifty thousand to paid search. Same budget, projected roughly nine hundred thousand dollars in additional incremental revenue. A German insurer saw cost per lead drop over twenty seven percent using funnel-aware modeling. But treat this as a hypothesis, not truth. Watch for low spend variation, ignored non-media drivers, and models you never test. Now let's look at what strong examples actually demonstrate, in the next slide on strengths.
 2 min
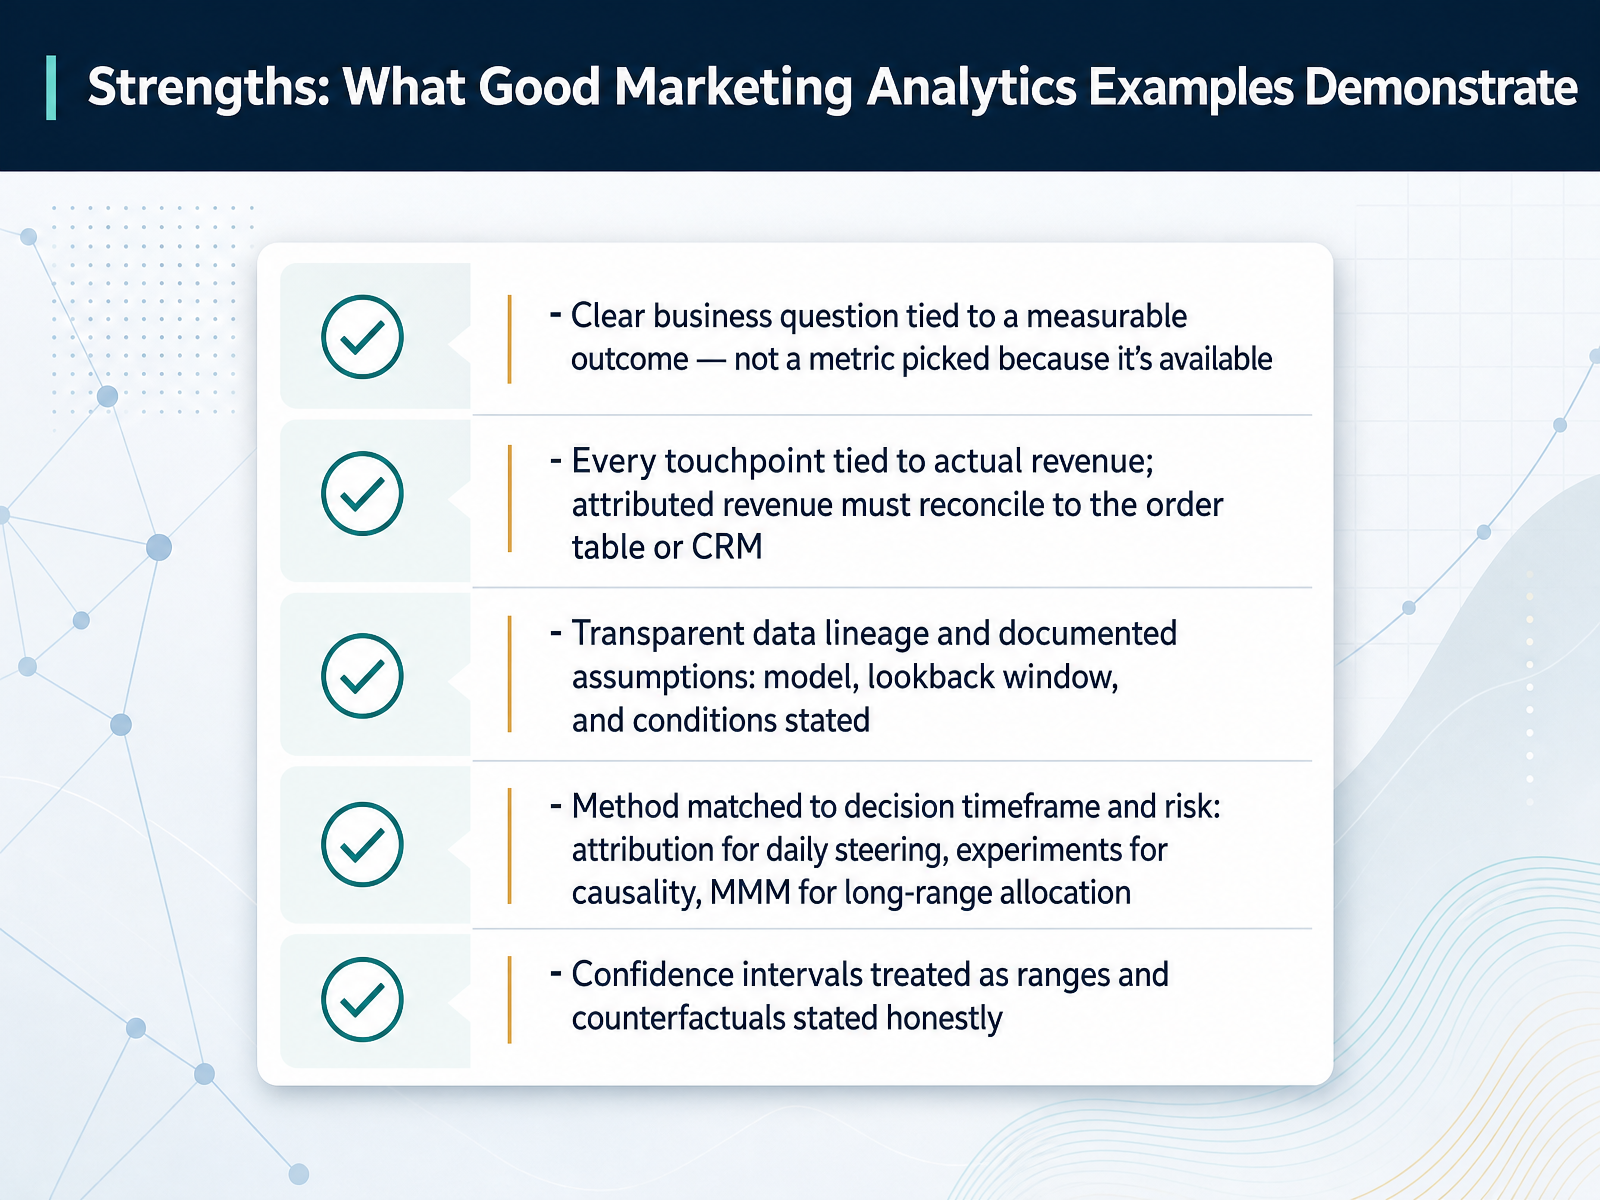
2 min - 12Strengths: What Good Marketing Analytics Examples DemonstrateLet's turn to what good marketing analytics examples actually demonstrate. Start with the decision, not the dashboard. A strong example begins with a clear business question tied to a measurable outcome, not a metric chosen because it was available. Next, every touchpoint ties to actual revenue. If attributed revenue doesn't reconcile to the order table or your CRM, you have a tracking problem, and no model choice fixes it. Then, transparency: state your model, your lookback window, and your assumptions, so anyone reading the number knows its conditions. Match the method to the decision. Attribution for daily steering, experiments for causality, marketing mix modeling for long-range allocation, because each carries different risk. Finally, treat confidence intervals as ranges and state counterfactuals honestly. If platforms are seeing 40 percent of your customer journeys, a confident number is still built on incomplete data. Those five habits separate analysis that informs budget decisions from analysis that merely reports.
 houseofmartech.comchillmetrics.cosaasanalytics.io+22 min
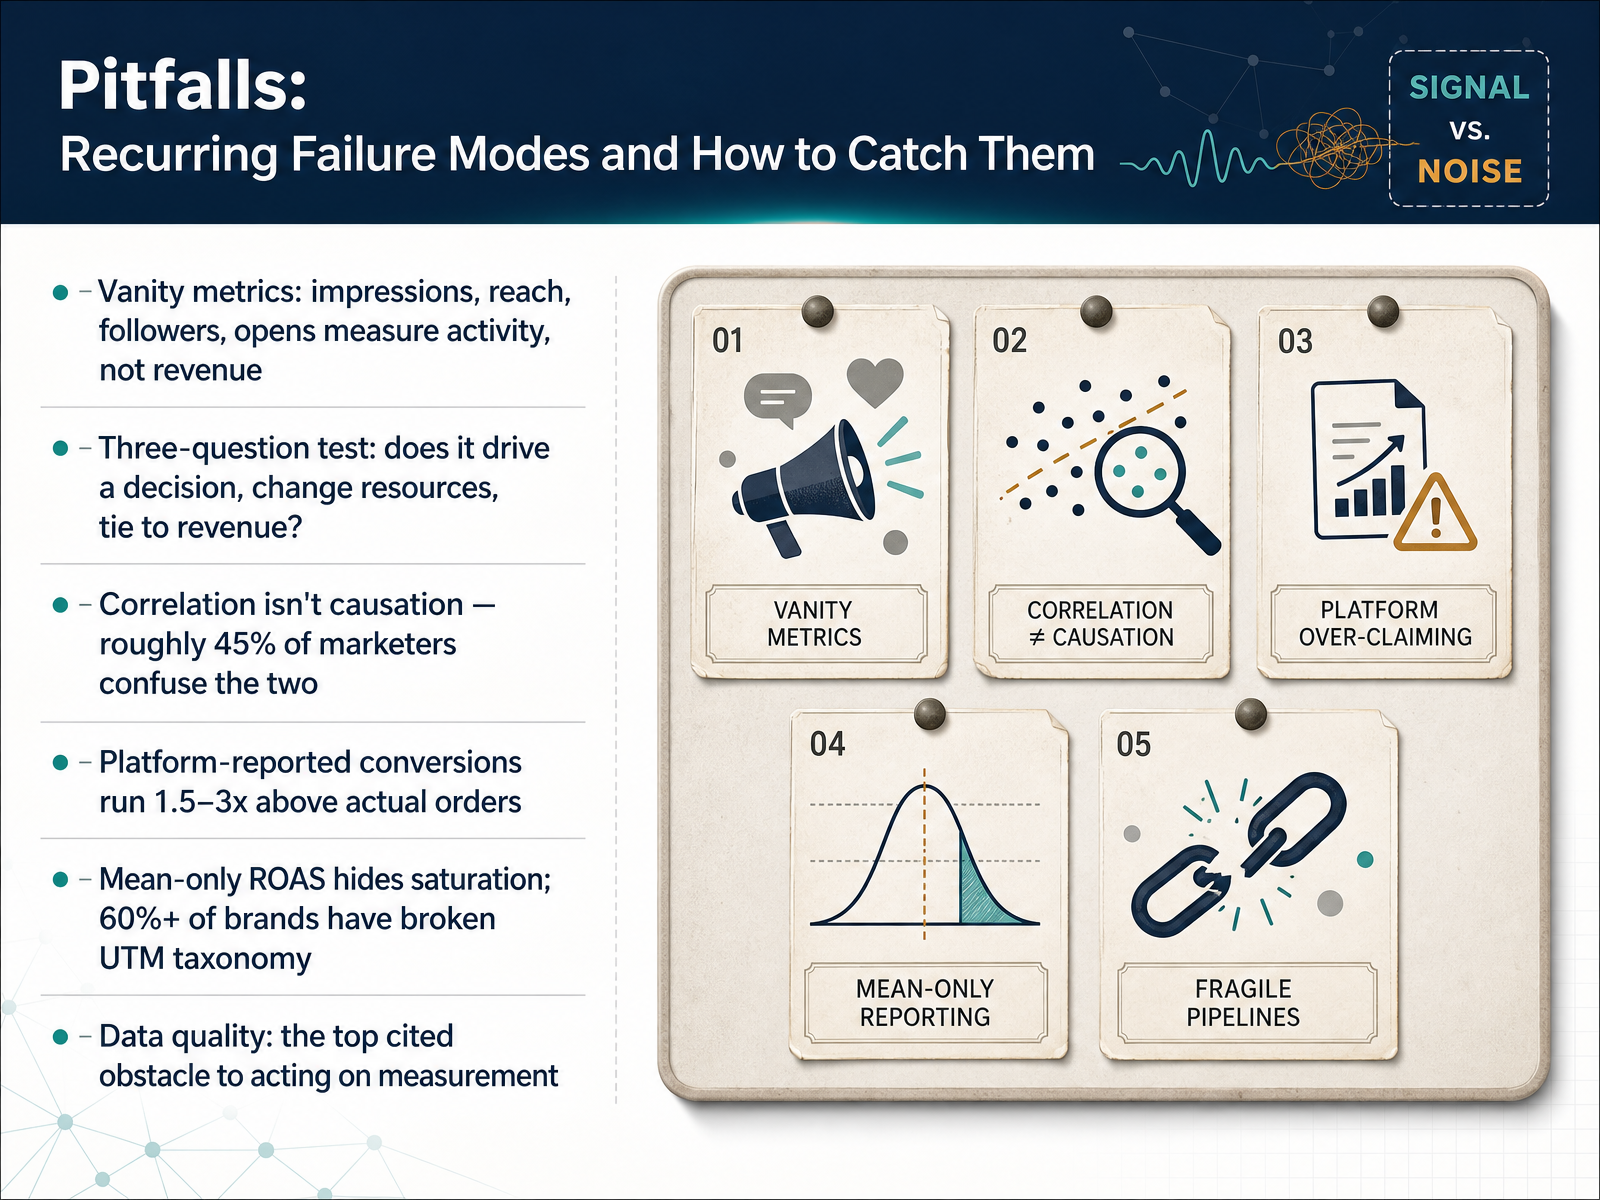
 - 13Pitfalls: Recurring Failure Modes and How to Catch ThemLet's talk about the failure modes that keep coming back, and how to catch them early. Start with vanity metrics: impressions, reach, followers, opens. They measure activity, not revenue. Run the three-question test. Does it drive a decision? Would it change resources if it doubled? Does it tie to revenue? If it fails any of those, it's vanity, so demote it to diagnostic, don't delete it. Next, correlation versus causation. Roughly forty five percent of marketers confuse the two. A spike in conversions may just be seasonality, or a competitor closing. Then there's the reconciliation problem: platform-reported conversions run one and a half to three times above actual orders, because each platform counts the same sale. If attributed revenue doesn't reconcile to your order table, you have a tracking problem no model fixes. Watch averages too. Mean-only ROAS hides saturation, so a channel can look strong while its next dollar barely breaks even. And check your plumbing: more than sixty percent of brands have broken UTM taxonomy, which quietly corrupts every downstream view. Data quality remains the top cited obstacle to acting on measurement. The takeaway: audit for these patterns on a schedule, and treat any metric that can't fail as a metric you can't trust. Next, the Diagnostic Framework and Practical Takeaways.
 trustmedia.ioprooflytics.iodatadrivenmarketer.me+22 min
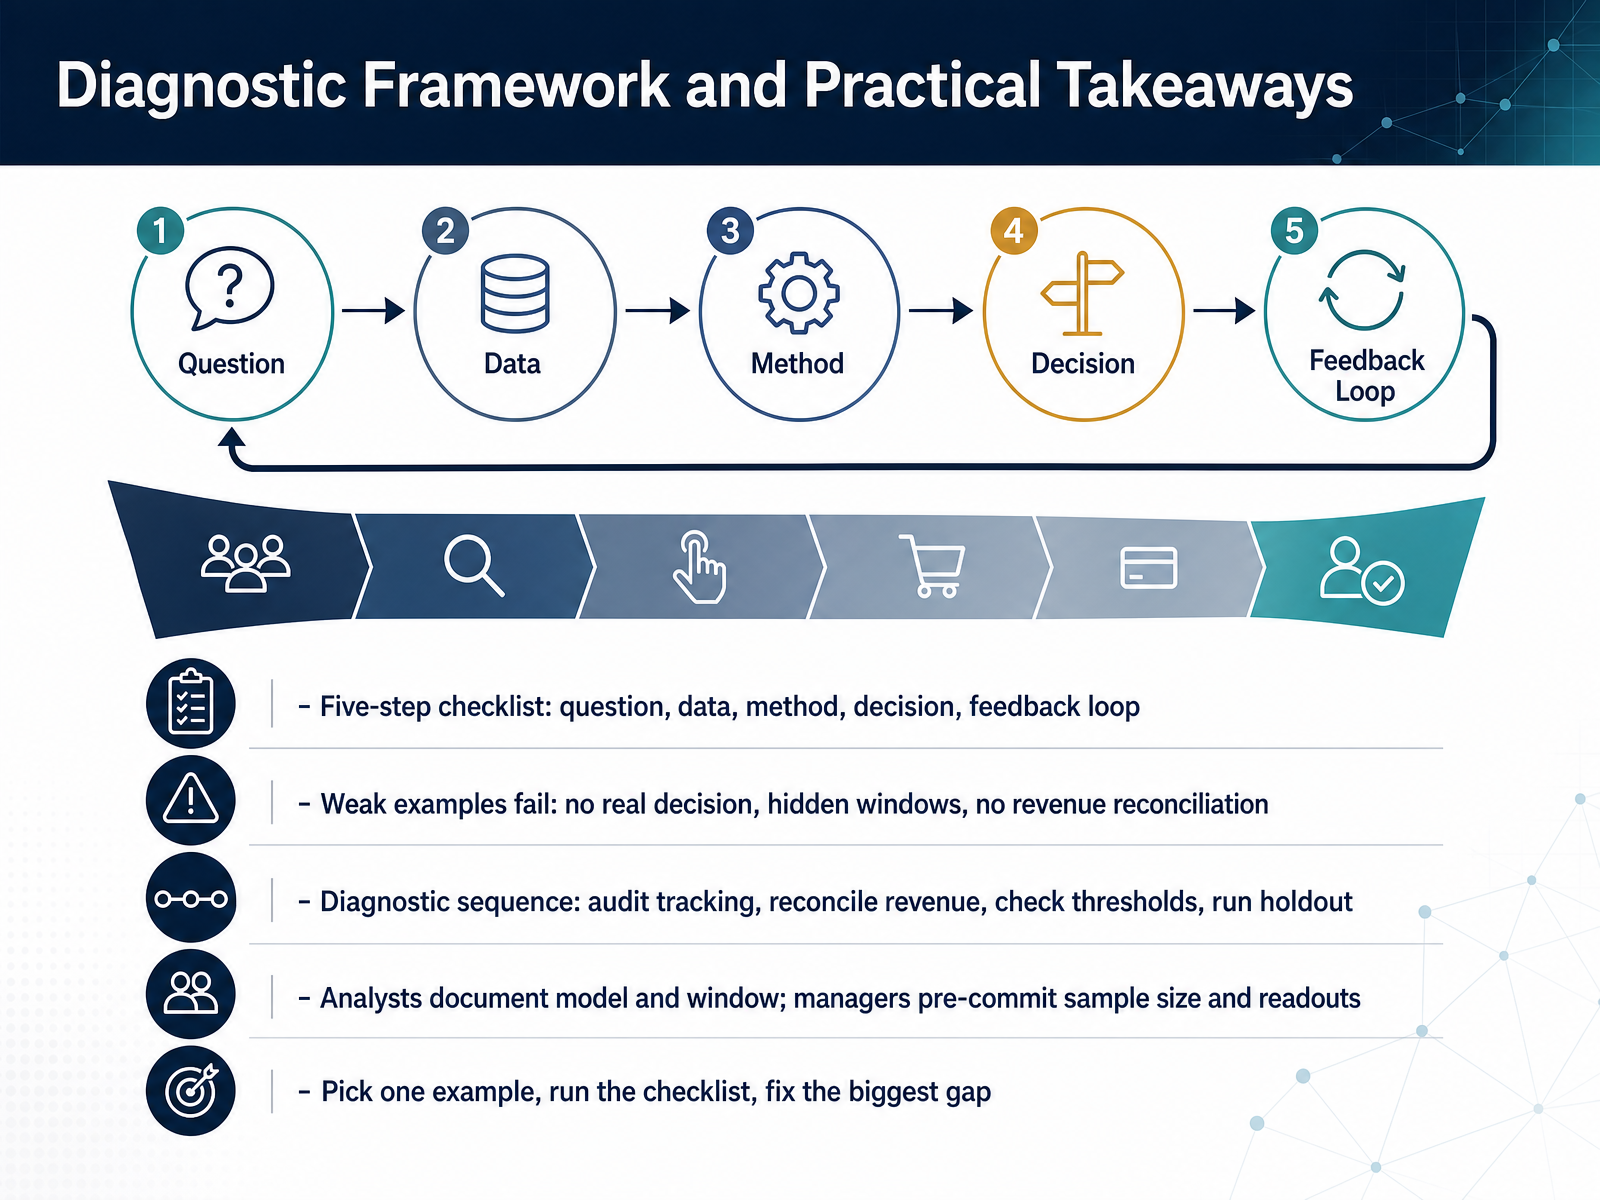
 - 14Diagnostic Framework and Practical TakeawaysLet's pull this all together into something you can actually use on Monday morning.
Here's the five-step checklist. Question, data, method, decision, feedback loop. If you can't name the decision a piece of analysis will change, stop there. That's the first gap to fix.
Weak examples fail in predictable ways. No real decision at the end. Hidden attribution windows. No reconciliation back to revenue. When platform-reported conversions run two to three times higher than actual orders, that's not a modeling problem, it's a tracking problem, and no algorithm fixes it.
So follow the diagnostic sequence. Audit your tracking. Reconcile attributed revenue against your order table. Check whether you meet the conversion thresholds for the model you're running, usually around three hundred per month for data-driven attribution, and remember it silently falls back to last click below that. Then run a holdout for your most expensive channel. That's the only step that speaks to causation.
Two disciplines to institutionalize. Analysts document the model and the window. Managers pre-commit the sample size and the readout before launch. And if you haven't built enough history, use a simpler model and note it, rather than pretending precision you don't have.
So pick one example from this course. Run the checklist. Find the biggest gap and fix that first.
Thank you for working through this with me. You now have a framework that separates patterns you observe from things you've actually caused. Keep testing, keep documenting, and stay honest about what your data can and cannot tell you. Good luck, and go make better budget calls.
 houseofmartech.comchillmetrics.cosaasanalytics.io+22 min
Take the deck with you
Download this course as a file — free, no sign-up needed.
- PDF handoutEvery slide page, ready to print or share.15 pages · 3.7 MBDownload
- PowerPoint slidesThe full deck as a .pptx — open it in PowerPoint, Keynote, or Google Slides.15 pages · 3.6 MBDownload
Free to use in your own training — please keep the PersonWise credit page at the end.
Have your own deck? Turn it into a course
Sources consulted
Web sources consulted while building this course.
- Multi-Touch Attribution Models Compared: 2026 Guide — houseofmartech.com
- Multi-Touch Attribution in 2026: What Actually Works - Chillmetrics — chillmetrics.co
- Data-Driven Attribution: How It Works & When to Use It (2026) — saasanalytics.io
- Marketing Attribution in 2026: Beyond Last-Click to Data-Driven Multi-Touch Models — overthetopseo.com
- Multi-Touch Attribution for Ecommerce: How the Models Work and When to Stop Trusting Them — polaranalytics.com
- Beyond Clicks: Causal Inference in Marketing Analytics | TrustMedia — trustmedia.io
- Vanity Metrics Trap in Marketing Dashboards 2026 | Prooflytics — prooflytics.io
- Marketing performance analytics: your 2026 guide - The data driven marketer — datadrivenmarketer.me
- Misleading Marketing Metrics: Are Your Reports Inaccurate? — neilpatel.com
- Most Marketing Dashboards Are Measuring Activity, Not Causality — envigo.co.uk
- The Complete Guide to Full-Funnel Attribution in 2026 - ad-times.com — ad-times.com
- Visual Marketing Funnel Analytics: Complete Guide 2026 — cometly.com
- How to Measure Digital Marketing Effectiveness | Centric — centricdxb.com
- The Ultimate Guide to Growth Marketing Funnel in 2026 — catchdigital.io
- Marketing Funnel Metrics Template: Stage Benchmarks — getfairview.com
- Advanced A/B Testing – Statistical Significance, Power & Pitfalls - DataExpertise — dataexpertise.in
- Your A/B Test Is Probably Lying to You (Here's How to Catch It) — alijabbary.com
- The Peeking Problem in A/B Testing: The Statistical Mistake That Inflates Your False-Positive Rate To 40%+ | Atticus Li — atticusli.com
- A/B Testing Mistakes: 12 Errors That Invalidate Results — metricuno.com
- Common A/B Testing Mistakes & Validity Threats · Donnu A/B — donnuab.com