Begin
14 pages · ~28 min
Marketing Analytics Types
This training introduces the main types of marketing analytics, helping marketers and analysts understand how to apply each type to make data-driven decisions.
A digital instructor presents all 14 pages. Hold “Ask” at any point and ask out loud — the answer comes from this course. No sign-up needed.
What you’ll learn
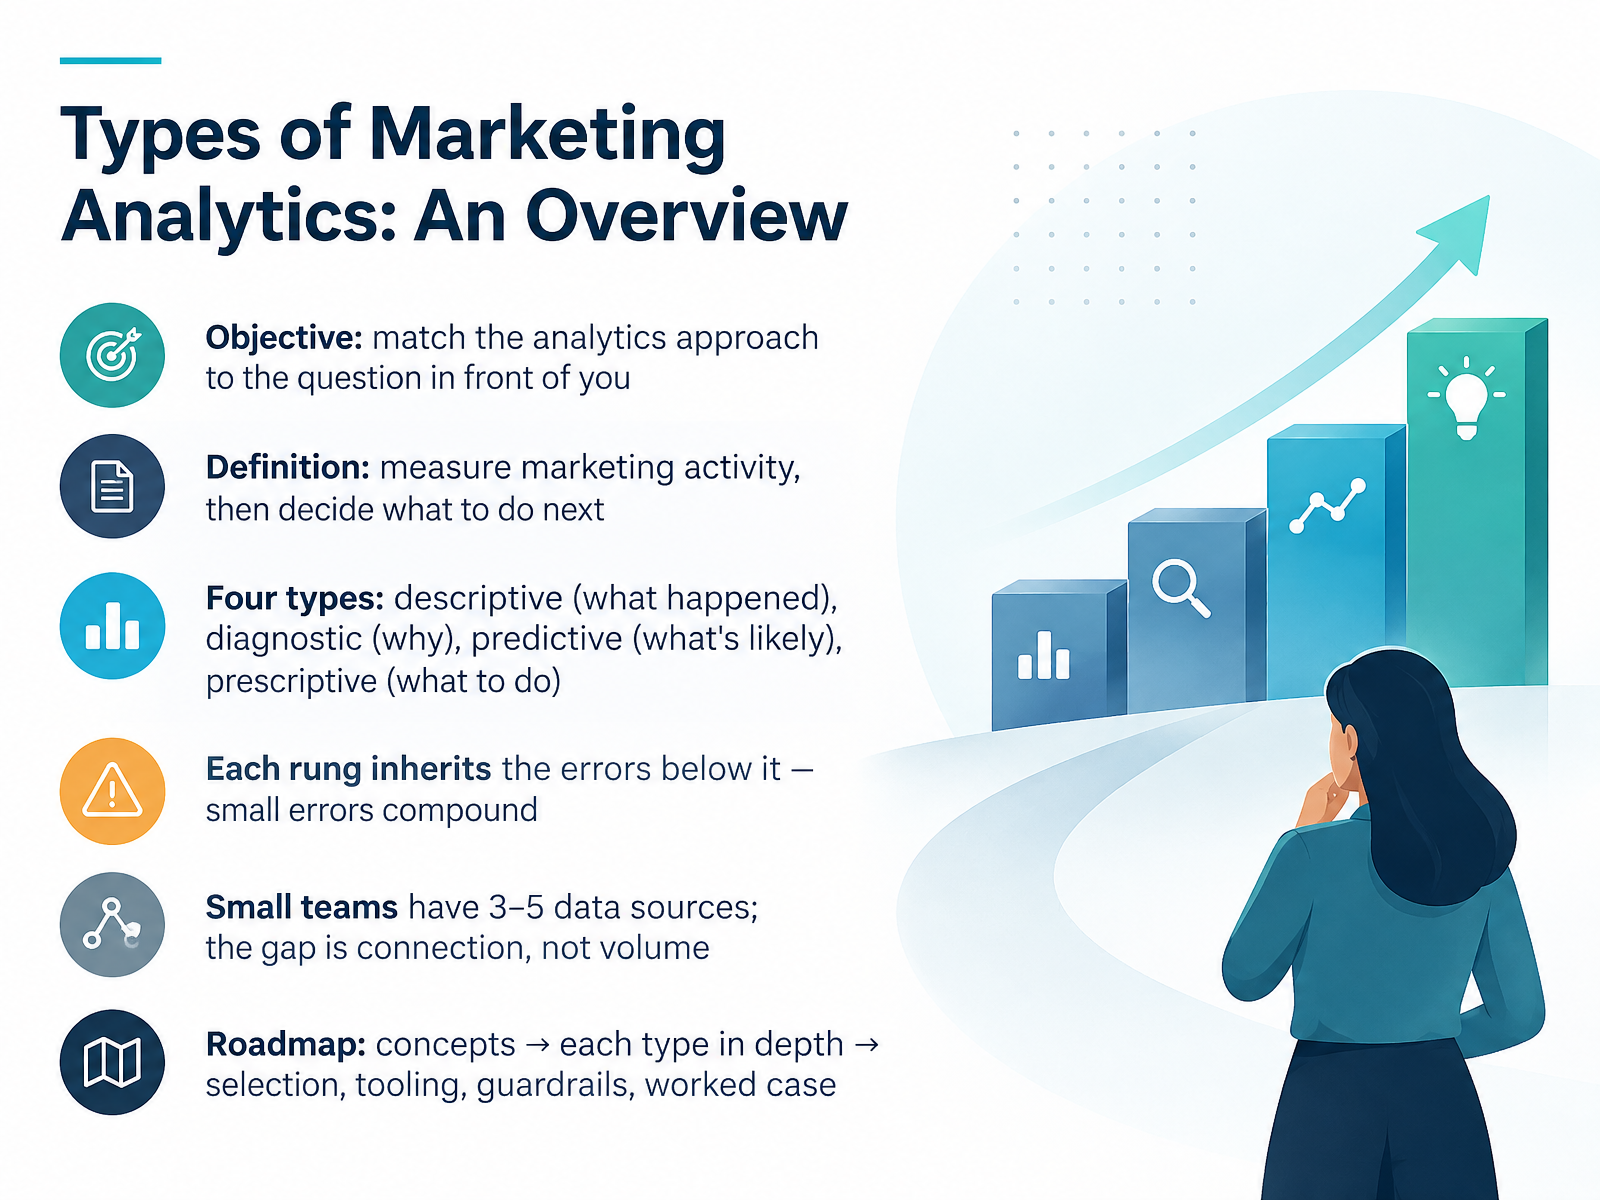
- 01Types of Marketing Analytics: An OverviewWelcome. Over the next few slides, we are going to sort out the types of marketing analytics, so that by the end you can pick the right approach for the question in front of you. Whether you are a marketer, an analyst, a content creator, or a small team wearing several hats, the goal is simple. Measure your marketing activity, then decide what to do next. There are four types. Descriptive tells you what happened. Diagnostic tells you why. Predictive tells you what is likely. And prescriptive tells you what to do. Each rung sits on the one below it. So small errors at the bottom compound as you climb. And here is the good news for small teams. You usually have three to five data sources. Your gap is connecting them, not collecting more. Here is the roadmap. First, the concepts. Then each type in depth. Then selection, tooling, guardrails, and a worked case. Let's start with the four types at a glance.cdp.comcdp.combusiness.adobe.com+22 min
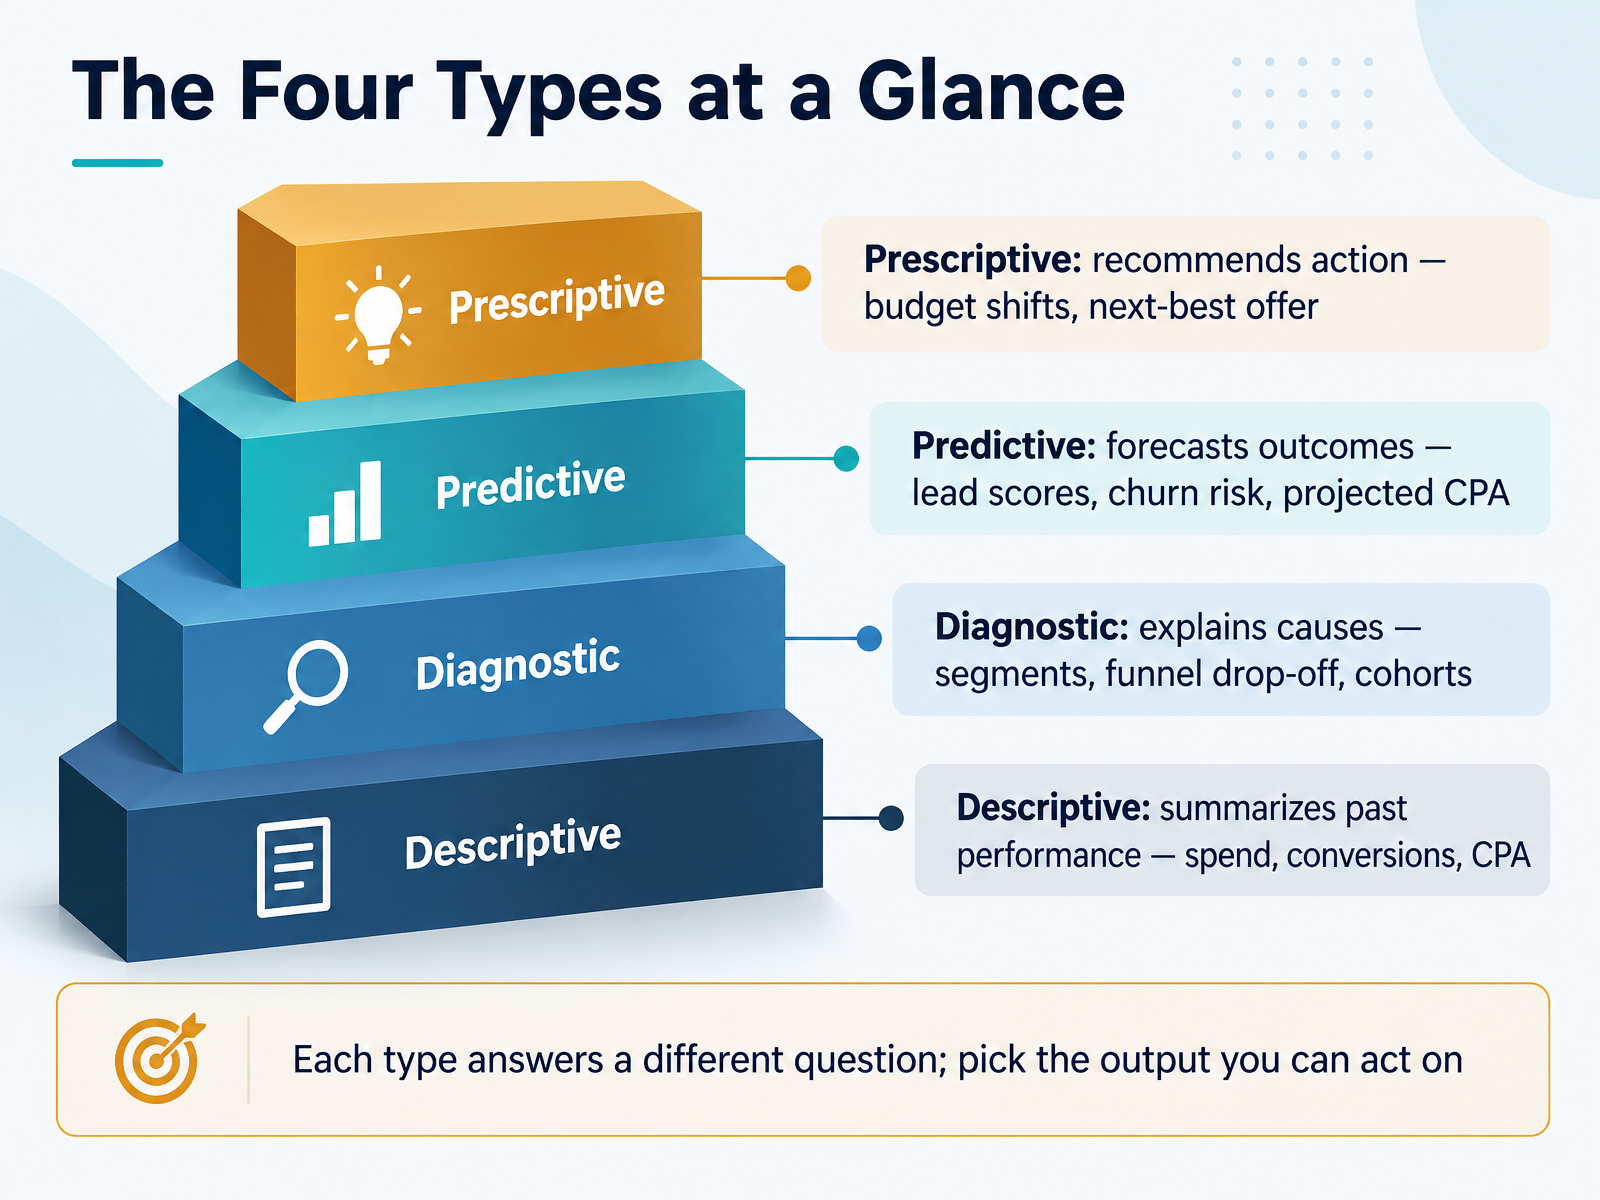
- 02The Four Types at a GlanceLet's look at the four types side by side. Descriptive analytics summarizes what already happened. Think total spend, conversions, and cost per acquisition. Diagnostic analytics explains why. You look at segments, funnel drop-off, and cohorts to find the cause. Predictive analytics forecasts what comes next, like lead scores, churn risk, or projected cost per acquisition. Prescriptive analytics recommends what to do, such as shifting budget or choosing the next best offer. Each type answers a different question. Your job is to pick the output you can actually act on. Next, we'll build a shared vocabulary in From Data to Decisions: A Shared Vocabulary.
 1 min
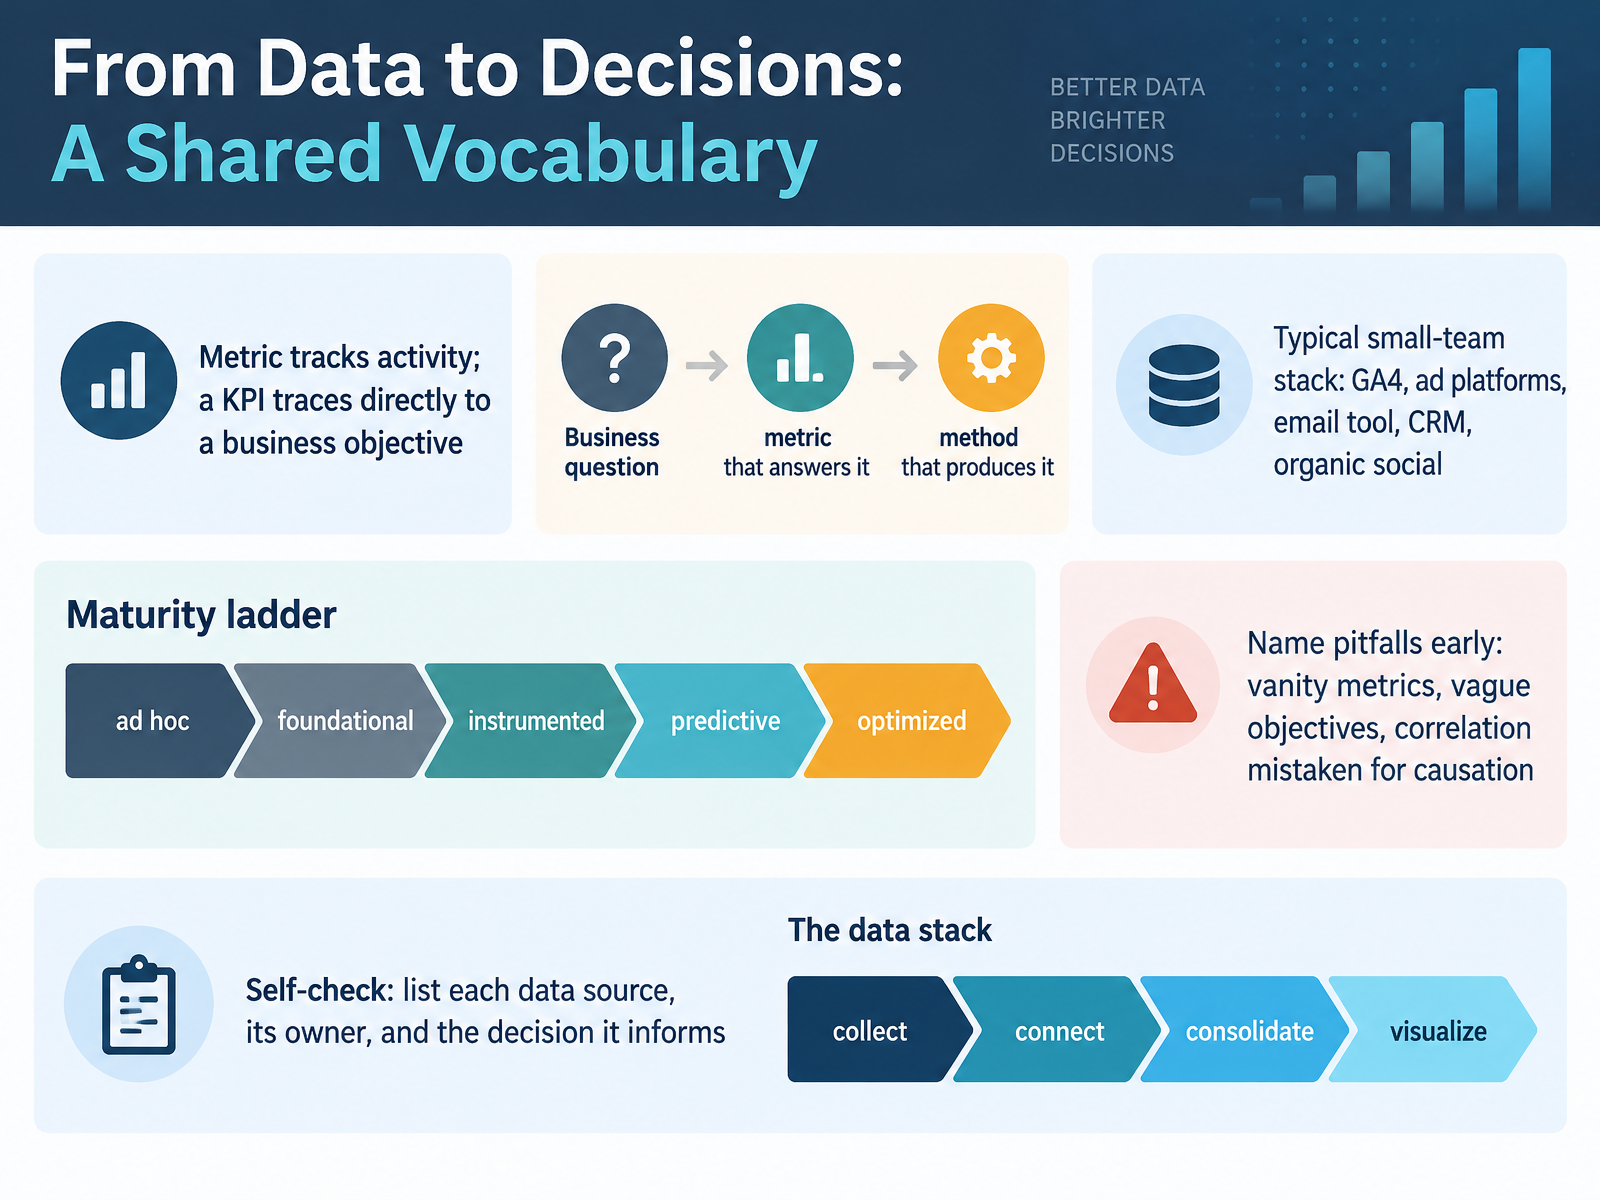
- 03From Data to Decisions: A Shared VocabularyLet's build a shared vocabulary before we pick any tools. A metric tracks activity, like page views. A KPI traces directly to a business objective, like qualified leads per month. So work backwards: business question, then the metric that answers it, then the method that produces it. Your typical small-team stack is probably GA4, ad platforms, an email tool, a CRM, and organic social. That's five sources, and that's fine. Then place yourself on the maturity ladder: ad hoc, foundational, instrumented, predictive, optimized. Most small teams sit at foundational, and that's a realistic starting point. Name pitfalls early: vanity metrics, vague objectives, and correlation mistaken for causation. Here's your self-check. List each data source, its owner, and the decision it informs. If a source has no decision attached, question why you're collecting it. That list alone prevents most reporting chaos. Next, we'll look at descriptive analytics and ask: what happened?
 2 min
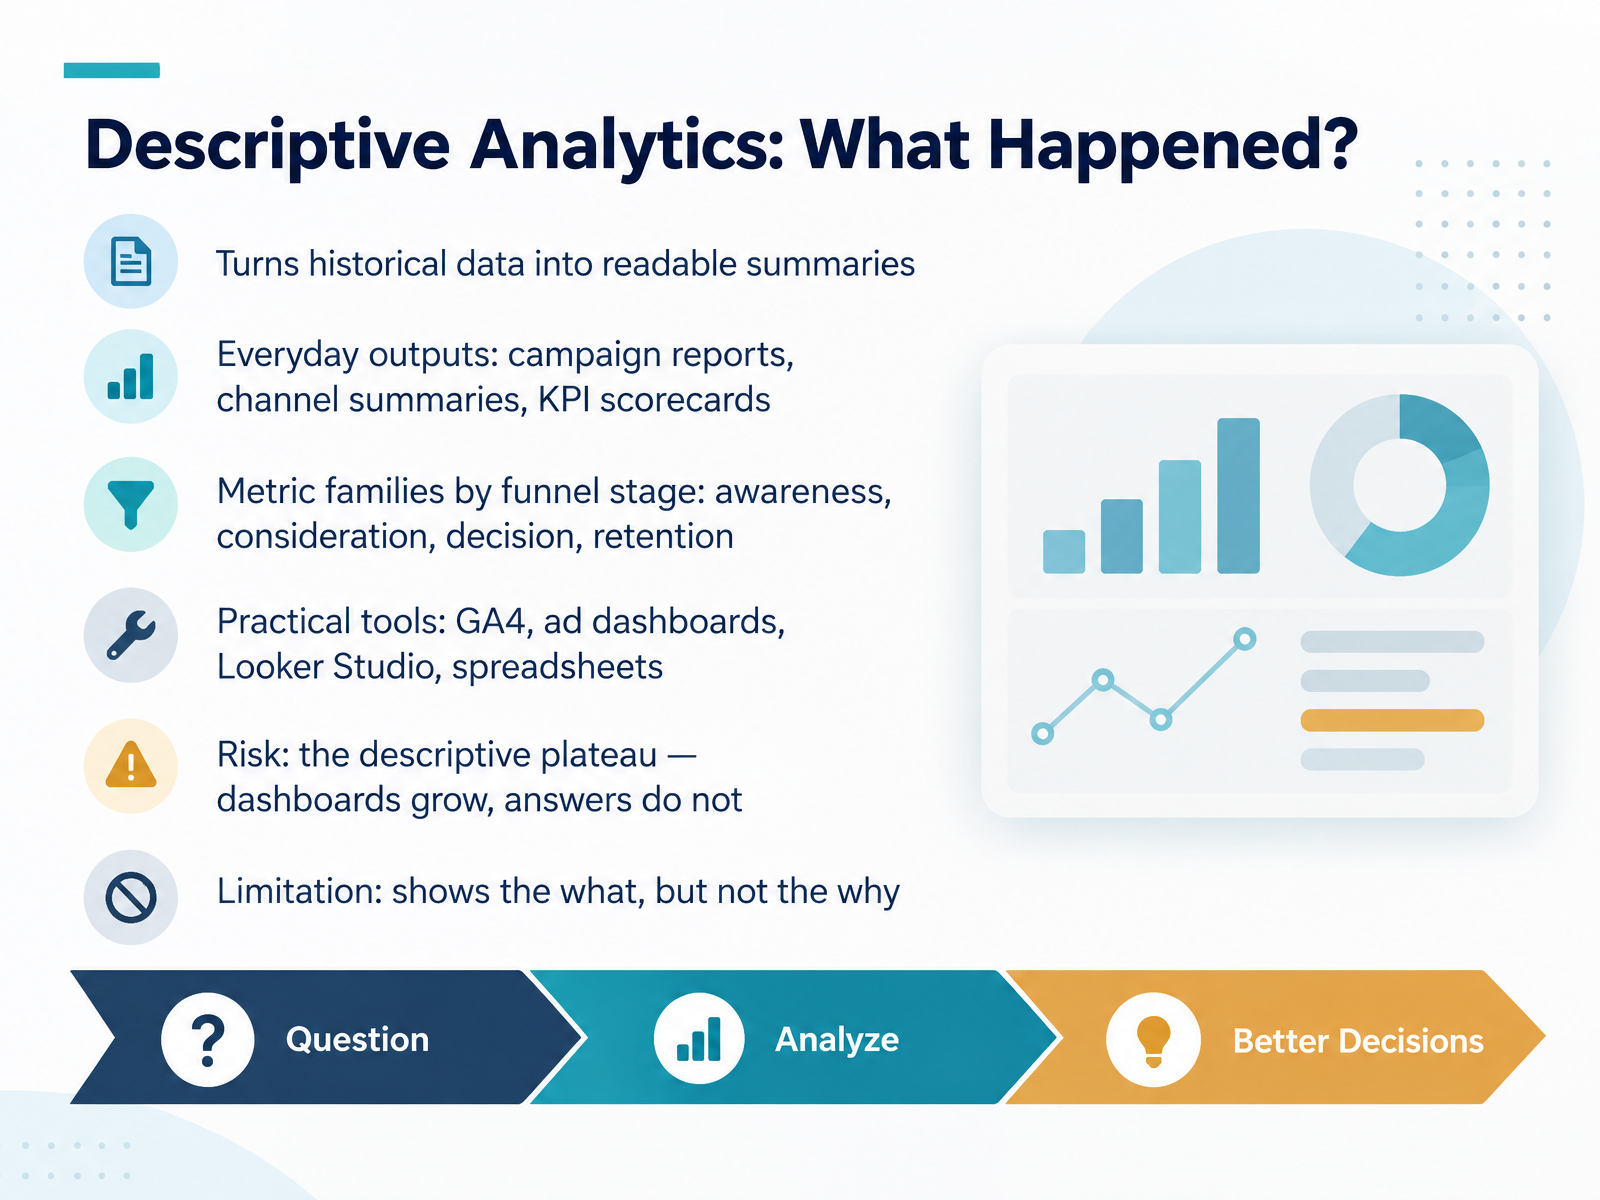
- 04Descriptive Analytics: What Happened?Let's start with the foundation: descriptive analytics. This is the what happened layer. It turns historical data into readable summaries. The everyday outputs you already know: campaign reports, channel summaries, and K P I scorecards. Organize your metrics by funnel stage, so awareness, consideration, decision, and retention each get their own view. For tools, most small teams can cover this with G A four, ad dashboards, Looker Studio, and a good spreadsheet. Here is the risk to watch. I call it the descriptive plateau. Dashboards keep growing, but the answers do not. If you only report the what, you will not explain the why. So use descriptive analytics to establish a baseline, then move on. Next, we look at diagnostic analytics, which asks why did it happen.
 2 min
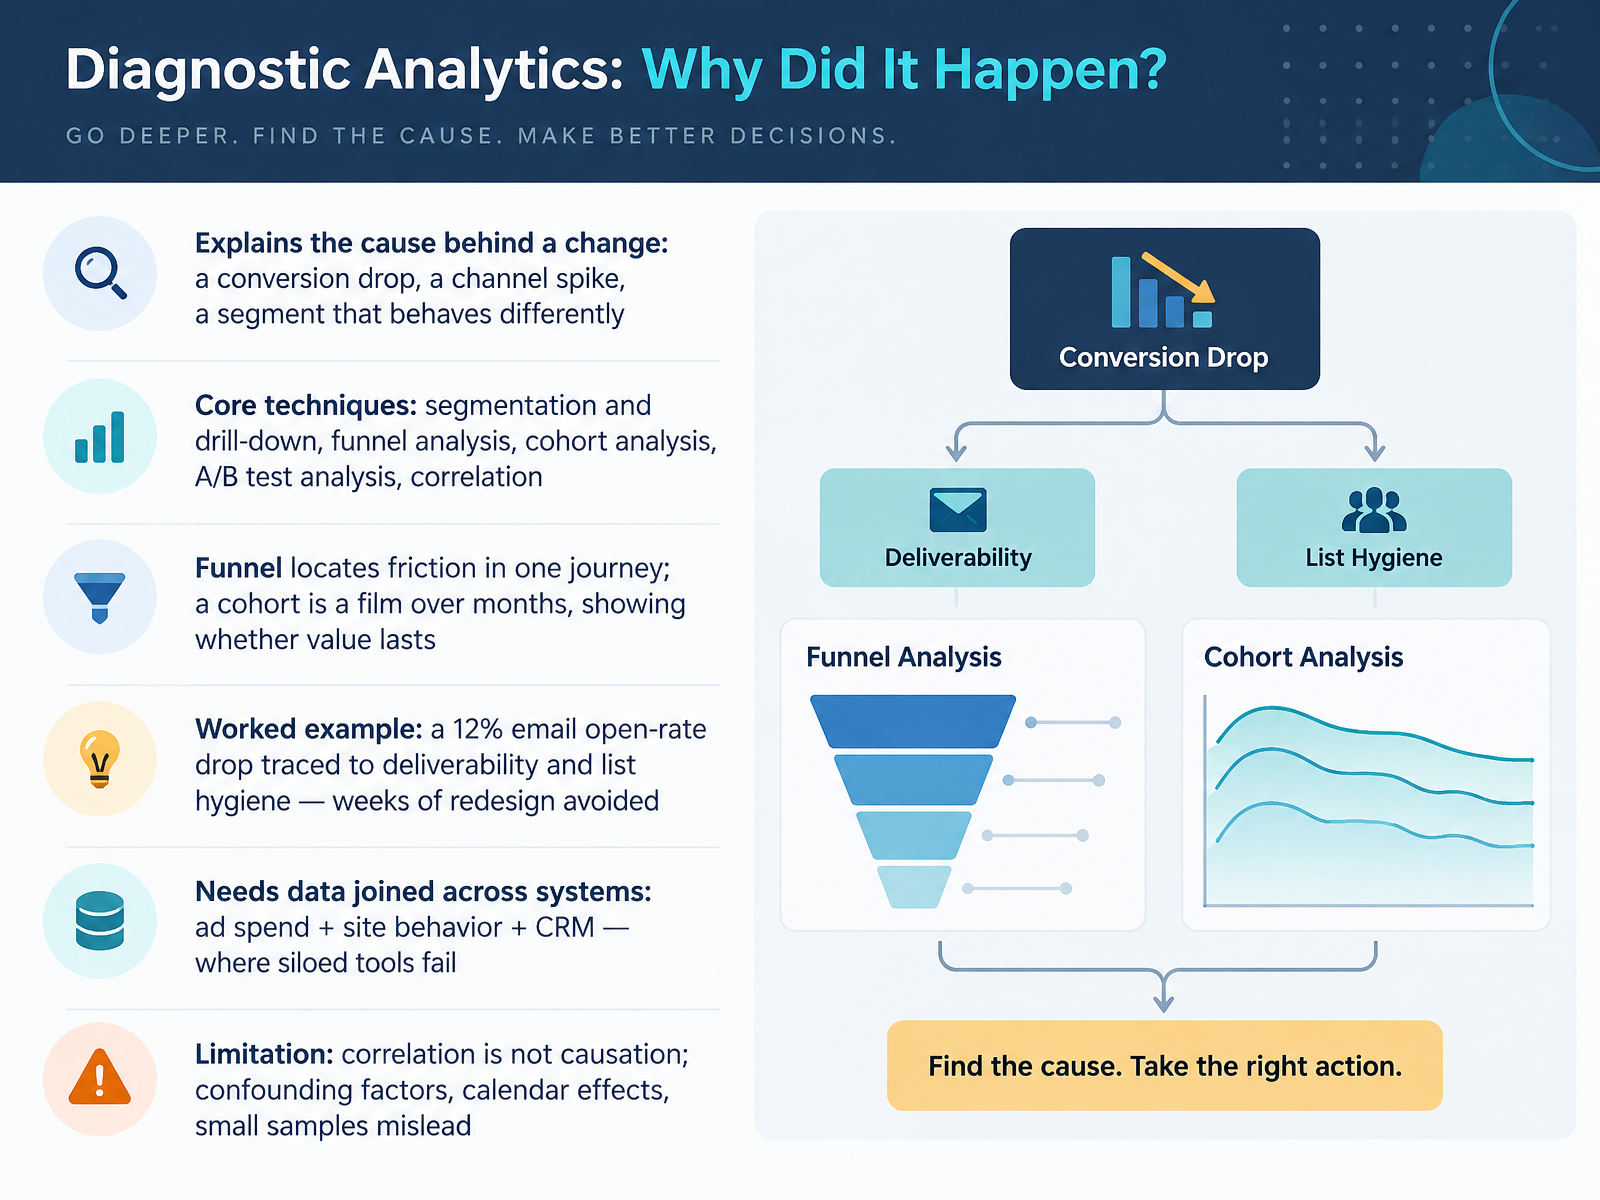
- 05Diagnostic Analytics: Why Did It Happen?Now let's talk about diagnostic analytics. This is the question of why something happened. A conversion drop, a channel spike, a segment that suddenly behaves differently. Diagnostic work finds the cause. The core techniques are segmentation and drill-down, funnel analysis, cohort analysis, A B test analysis, and correlation. Here is the distinction to hold onto. A funnel locates friction inside one journey, step by step. A cohort is more like a film over months. It shows whether the value you created actually lasts. A worked example. Your email open rate drops twelve percent. Diagnostic analysis traces it to deliverability and list hygiene. That finding saves you weeks of redesigning a campaign that was never the problem. One warning. This work needs data joined across systems. Ad spend, site behavior, and your CRM in one view. Siloed tools fail here. And remember, correlation is not causation. Confounding factors, calendar effects, and small samples will mislead you. So validate before you act. With causes understood, we move from explaining the past to anticipating what comes next. Predictive analytics, what is likely to happen?
 amplitude.comhenkanpartners.aiartisangrowthstrategies.com+22 min
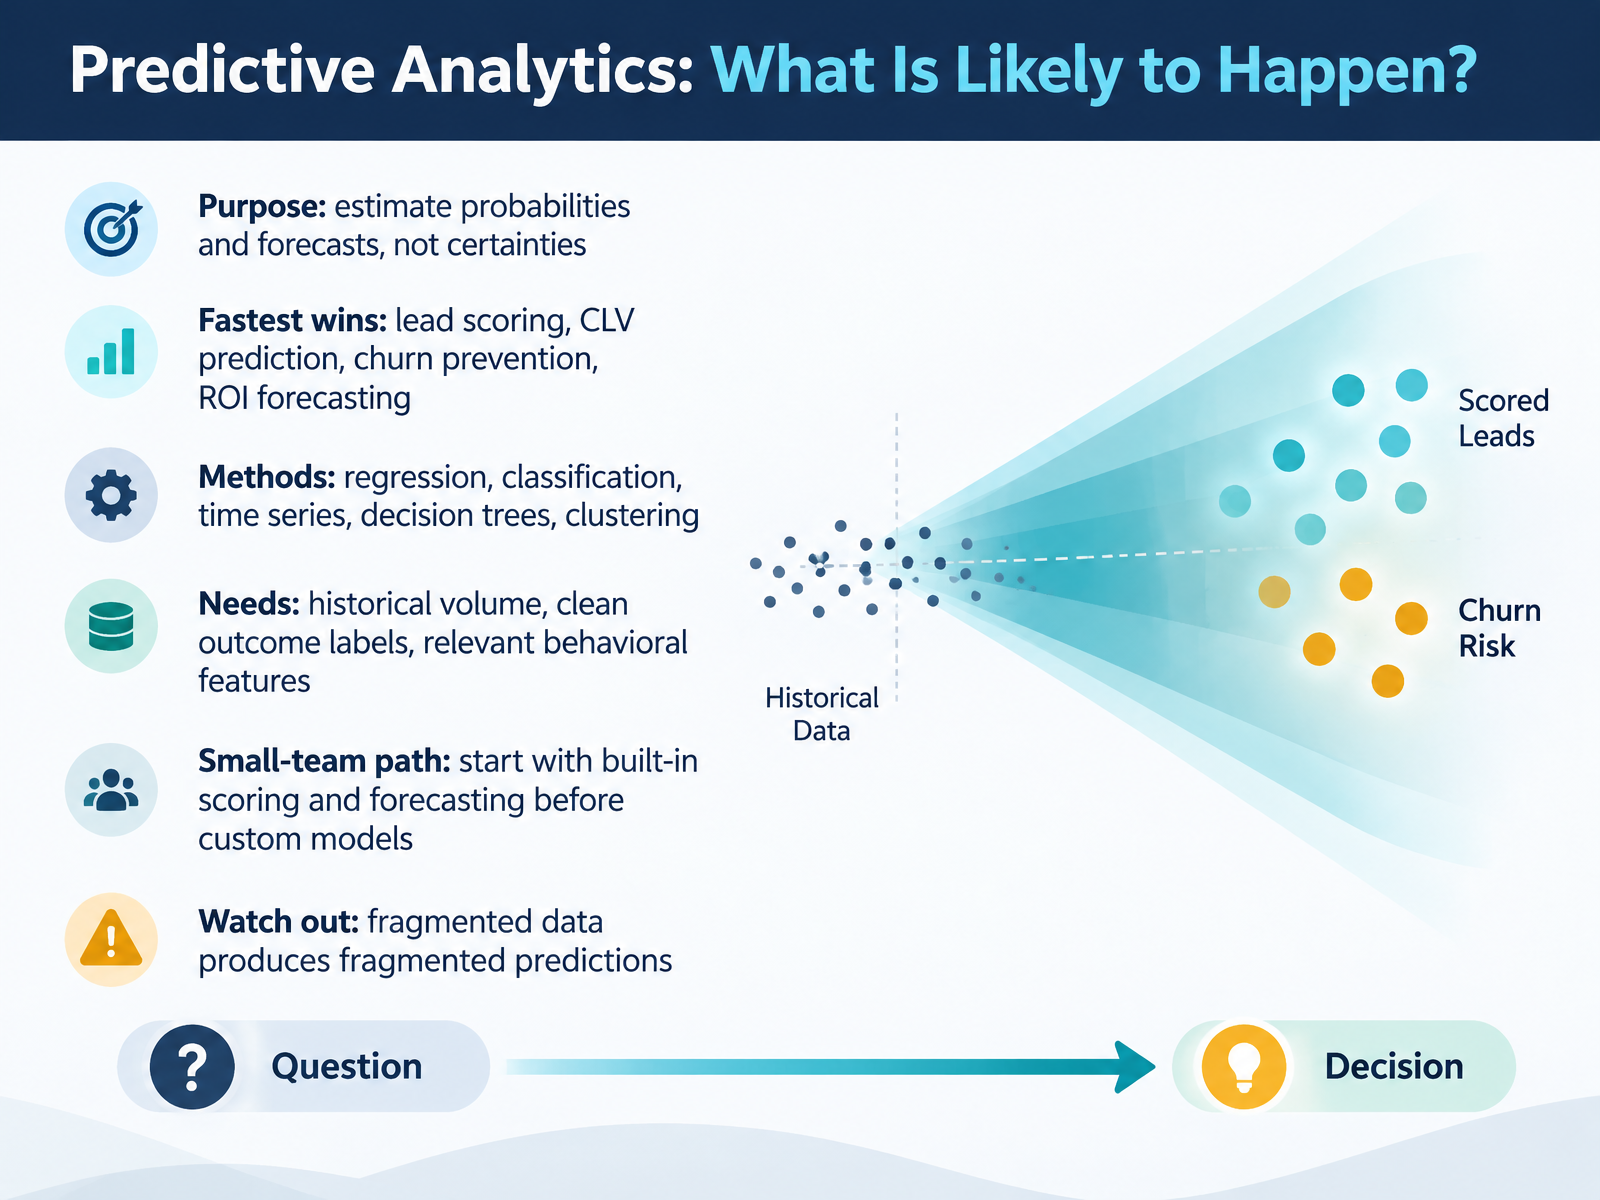
- 06Predictive Analytics: What Is Likely to Happen?Now let's talk about predictive analytics, which asks a simple question: what is likely to happen? The key word is likely. These models estimate probabilities and forecasts, not certainties. The fastest wins are lead scoring, customer lifetime value prediction, churn prevention, and return on investment forecasting. The methods behind them include regression, classification, time series, decision trees, and clustering. To get usable results, you need historical volume, clean outcome labels, meaning which past outcomes you can actually measure, and relevant behavioral features. If you are a small team, start with built-in scoring and forecasting tools before you build custom models. And watch out: fragmented data produces fragmented predictions. So keep your data connected. Next, we move into prescriptive analytics, and ask what we should do.
 1 min
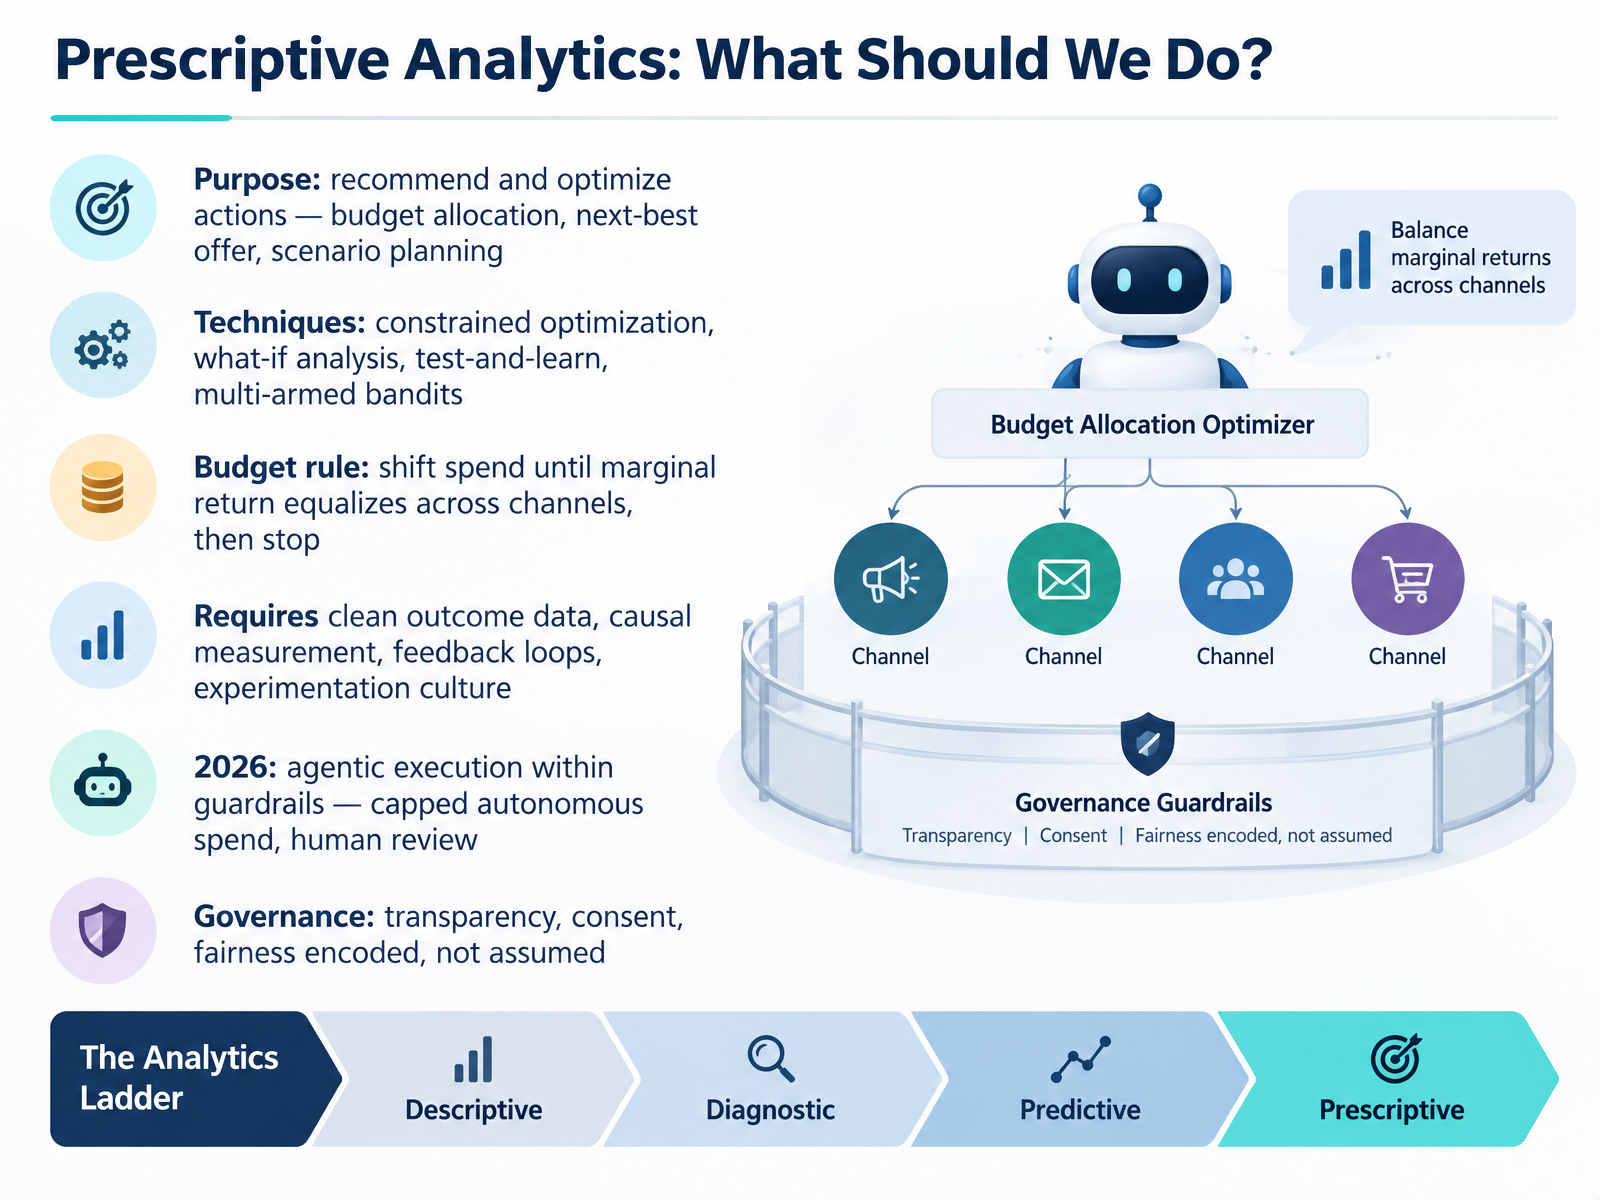
- 07Prescriptive Analytics: What Should We Do?Now we move from predicting what might happen to prescribing what you should do. Prescriptive analytics recommends and optimizes actions, like budget allocation across channels, the next-best offer for a customer, or scenario planning before a launch. The techniques are constrained optimization, what-if analysis, test-and-learn, and multi-armed bandits, which simply means letting tests shift traffic toward the options that perform best. Here is the budget rule to remember. Shift spend until the marginal return, meaning the return on the next dollar, equalizes across channels, then stop. This only works with clean outcome data, causal measurement, feedback loops, and a culture of experimentation. In 2026, expect agentic execution inside guardrails, such as capped autonomous spend with human review. And build governance in from the start: transparency, consent, and fairness must be encoded, not assumed. Next, we will look at choosing the right analytics type.
 2 min
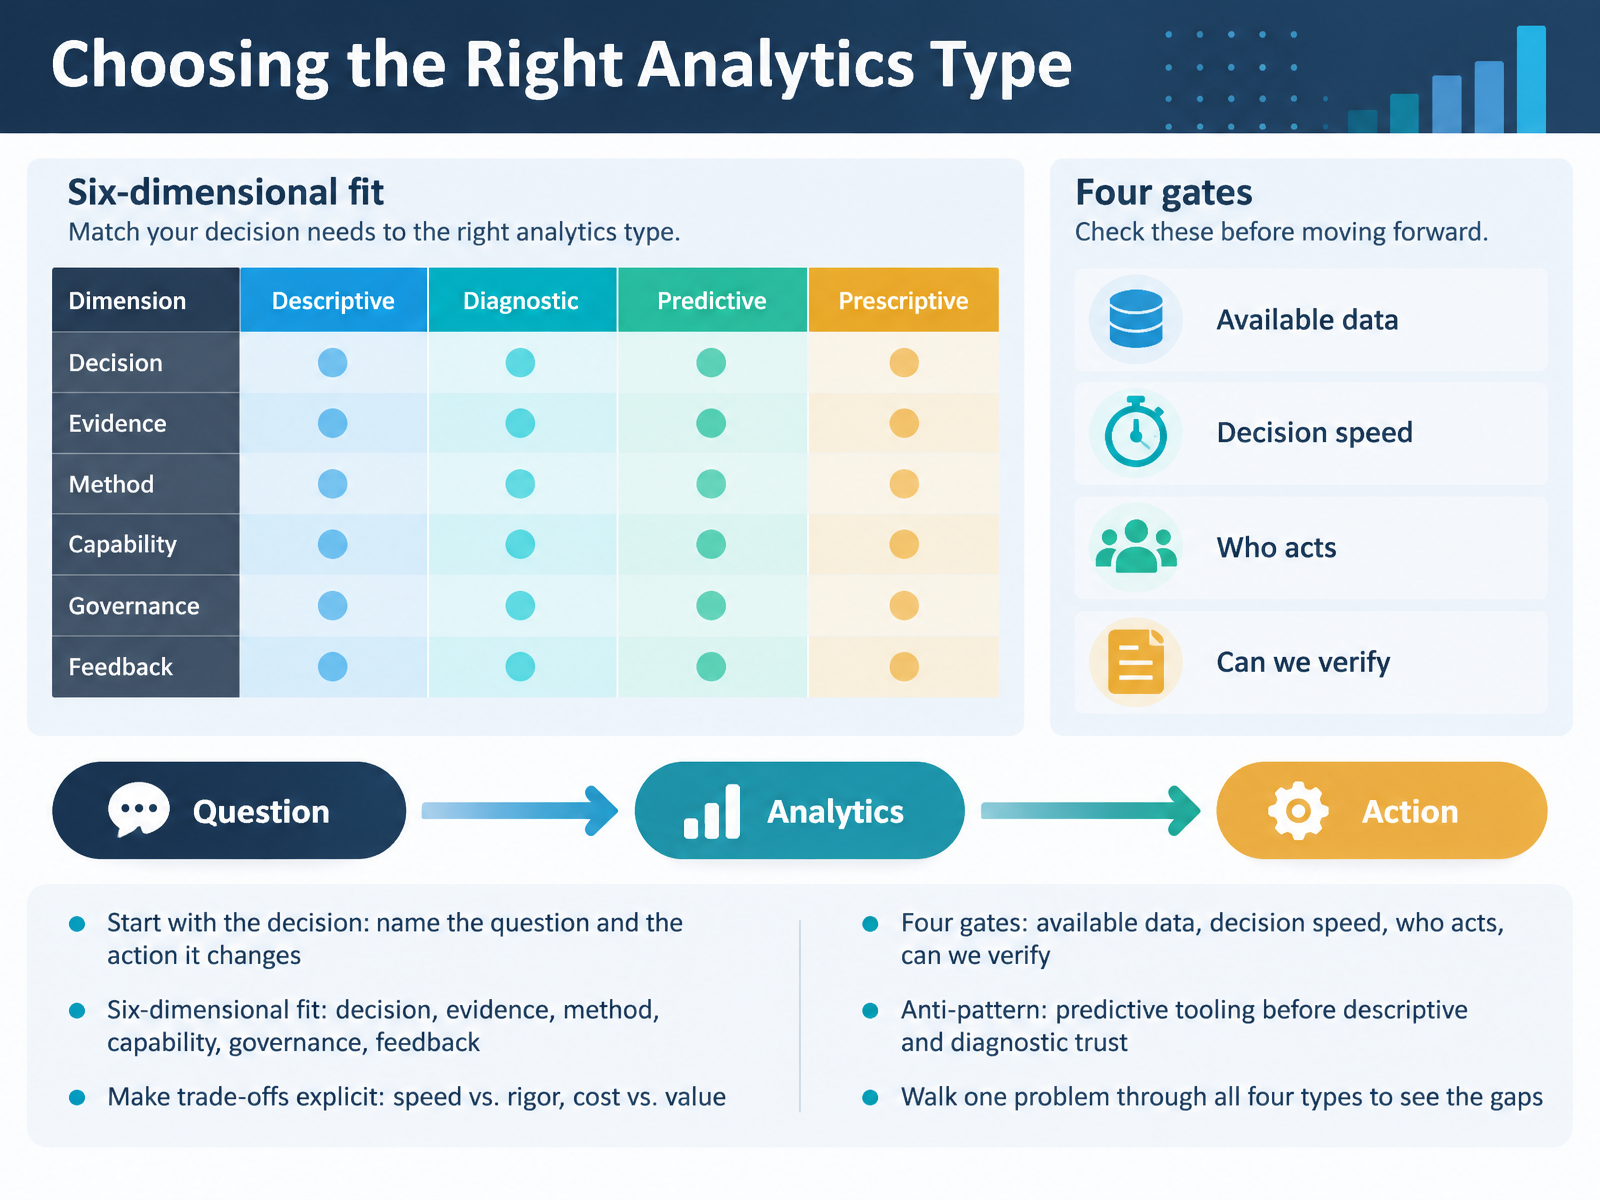
- 08Choosing the Right Analytics TypeNow, let's turn to choosing the right analytics type. Start with the decision itself. Name the question you're answering, and the action it will change. Next, check six dimensions of fit: the decision, the evidence, the method, your team's capability, governance, and feedback. Make trade-offs explicit. Speed versus rigor. Cost versus value. Then run four gates: Is the data available? How fast is the decision? Who acts on it? And can we verify the result? Be careful of one common anti-pattern: adopting predictive tooling before you have descriptive and diagnostic trust. Finally, walk one real problem through all four types to surface the gaps. Next, we'll look at tools, data, and skills by team size.
 1 min
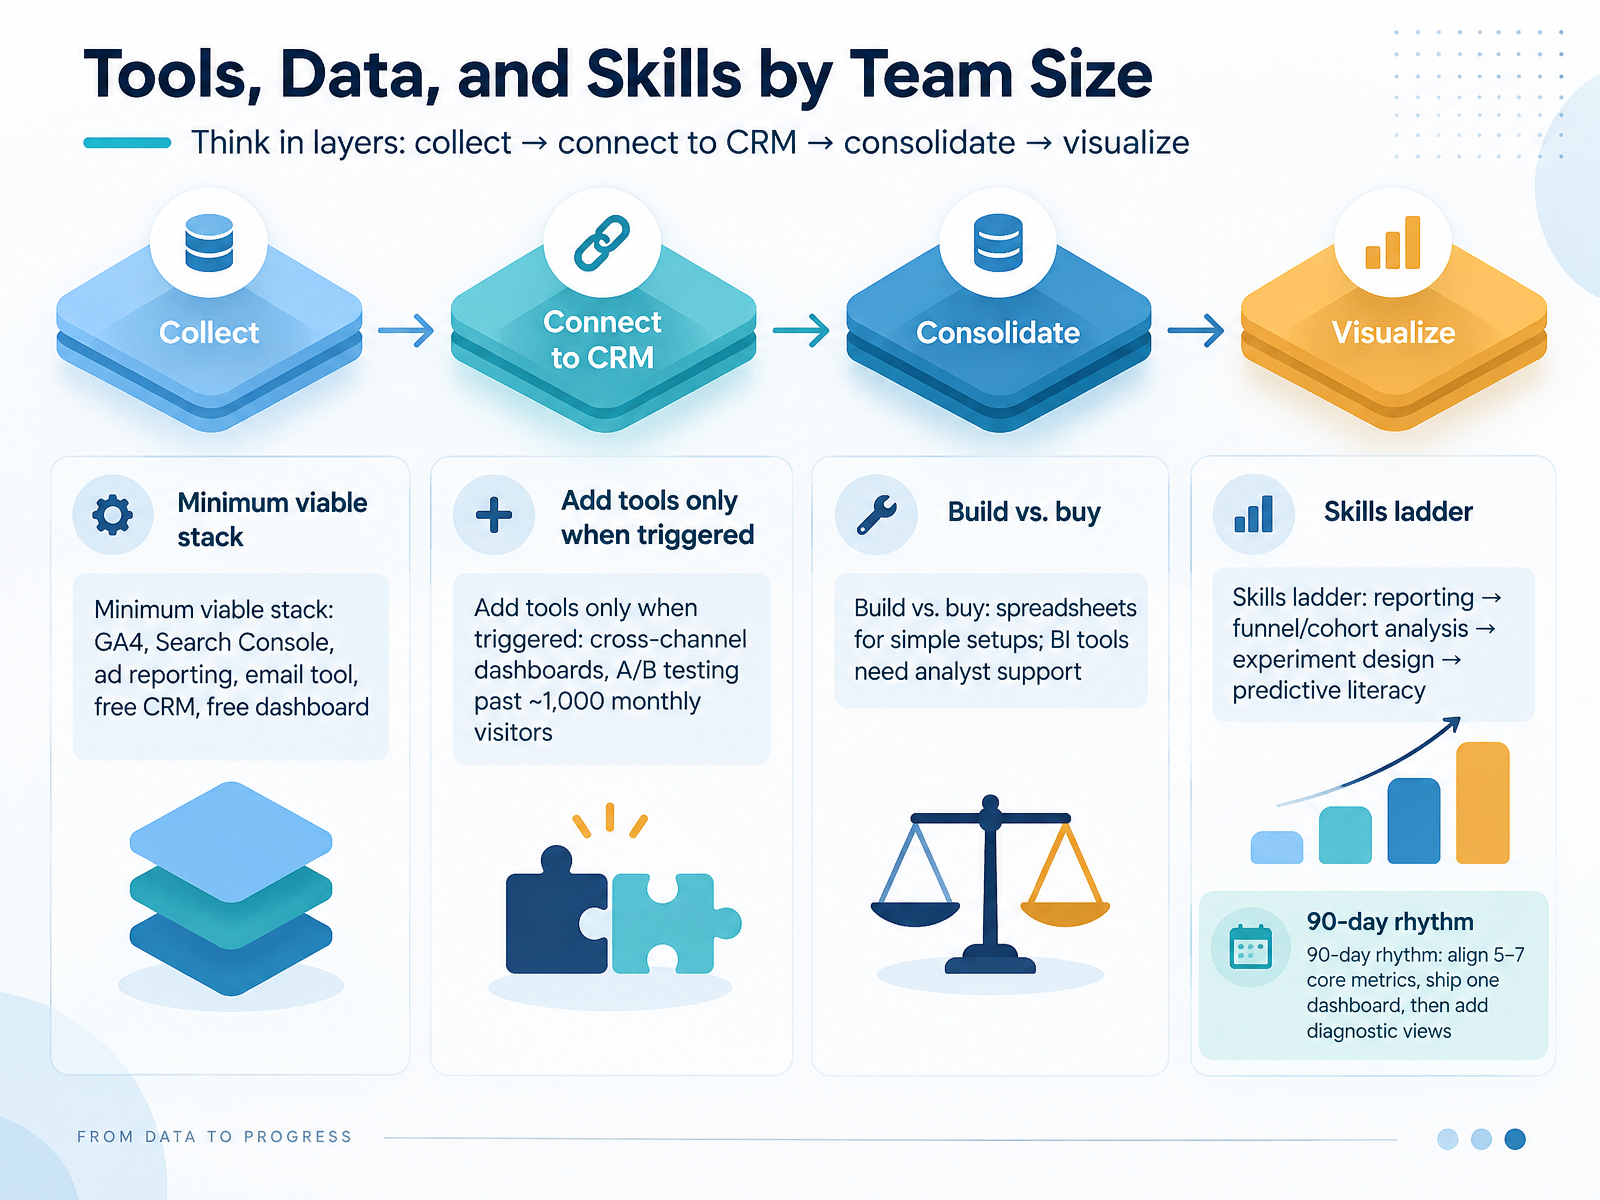
- 09Tools, Data, and Skills by Team SizeNow let's match tools, data, and skills to your team size. Think in layers, not in a big tool list: collect data, connect it to your C R M, consolidate it in one place, then visualize it so people can act. Your minimum viable stack is usually G A four, Search Console, ad reporting, your email tool, a free C R M, and a free dashboard. That covers most small teams. Add tools only when something triggers it. A cross-channel dashboard makes sense when you are managing several channels and losing the full picture. A B testing makes sense past roughly one thousand monthly visitors, because before that your results are mostly noise. Build versus buy comes down to support. Spreadsheets work for simple setups, while B I tools need analyst support to stay useful. The skills ladder runs from reporting, to funnel and cohort analysis, to experiment design, to predictive literacy, which simply means reading forecasts without overtrusting them. Give yourself a ninety-day rhythm. Align five to seven core metrics, ship one dashboard, then add diagnostic views. That sequence keeps your stack lean and your team learning. Next, let's look at data quality and tracking hygiene.
 2 min
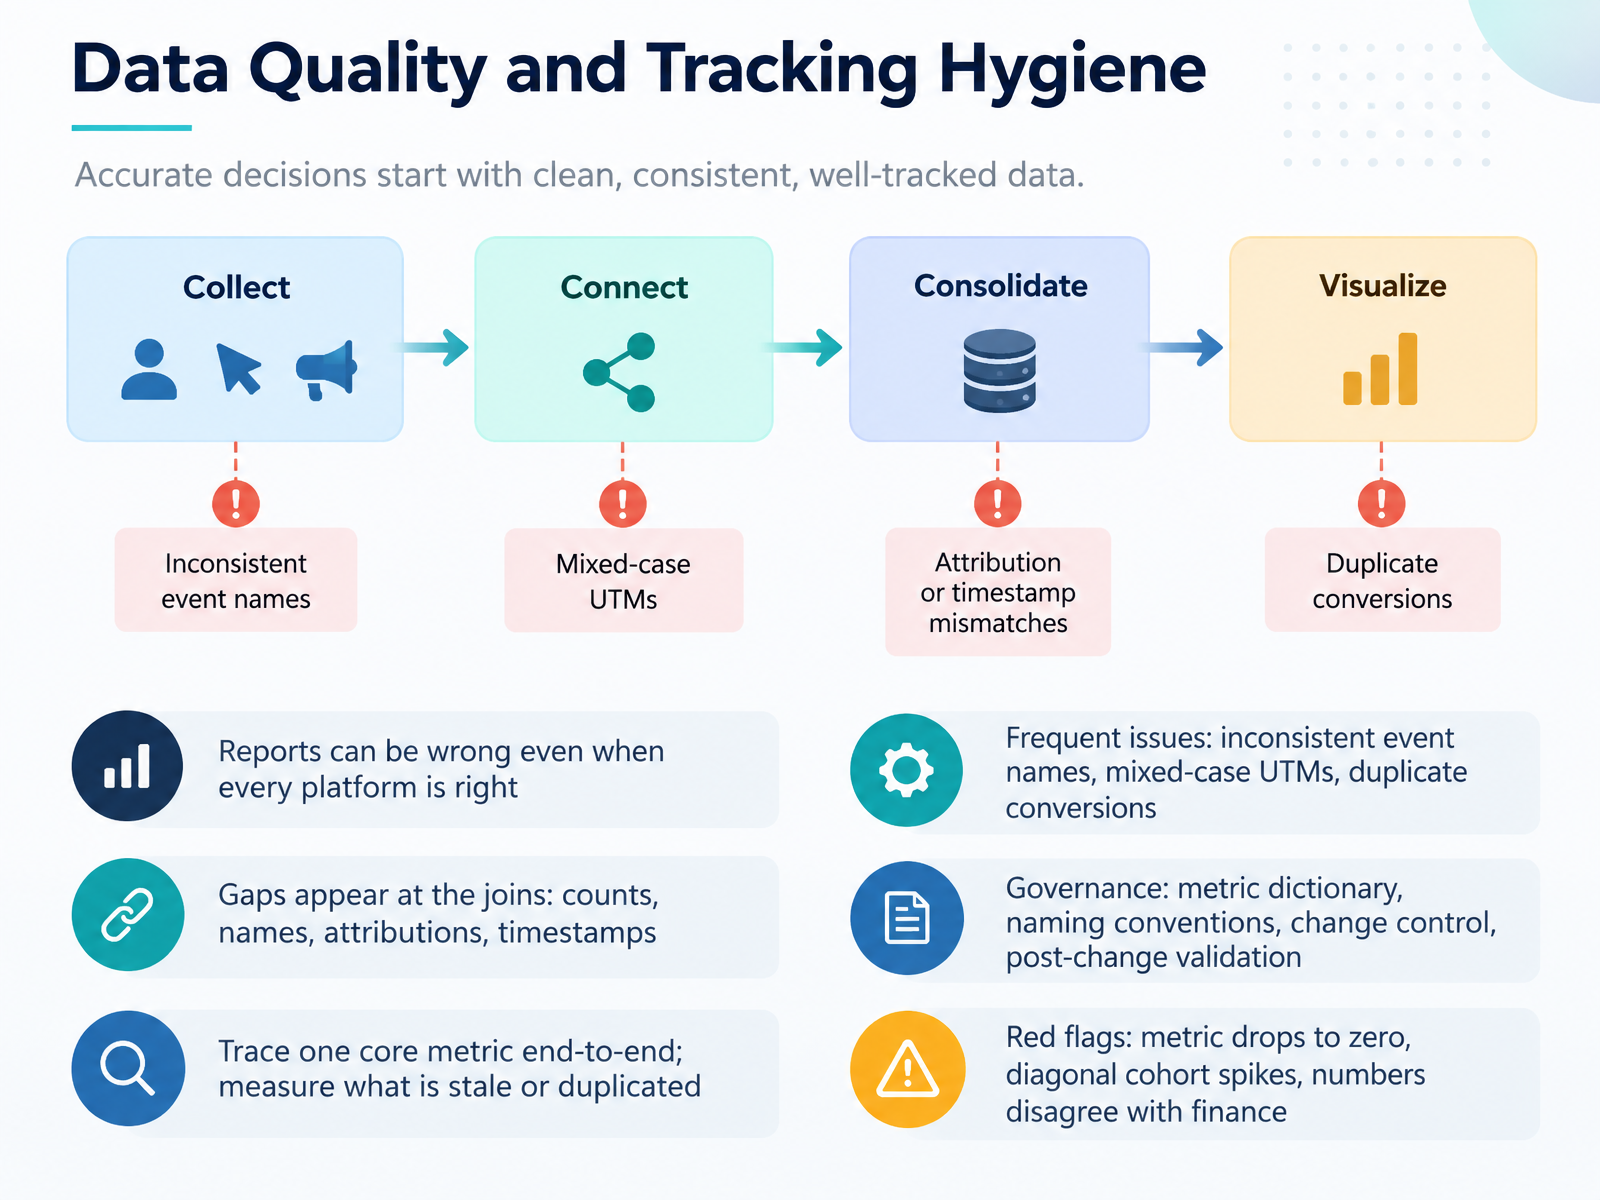
- 10Data Quality and Tracking HygieneNow let's talk about data quality and tracking hygiene. Here's the key point. Your reports can be wrong even when every platform is right, because gaps appear at the joins. Counts, names, attributions, and timestamps get mismatched when data moves between systems. So trace one core metric end-to-end, from click to conversion, and measure where it is stale or duplicated. Common issues you will see include inconsistent event names, mixed-case U T M parameters, and duplicate conversions. To control this, set up governance. That means a metric dictionary that defines each metric once, naming conventions everyone follows, change control before tracking updates, and post-change validation. Watch for red flags too. A metric dropping to zero, diagonal spikes in your cohort table, or numbers that disagree with finance. Pick one metric this week and trace it end-to-end. Coming up next, we'll look at privacy, bias, and responsible use.
 1 min
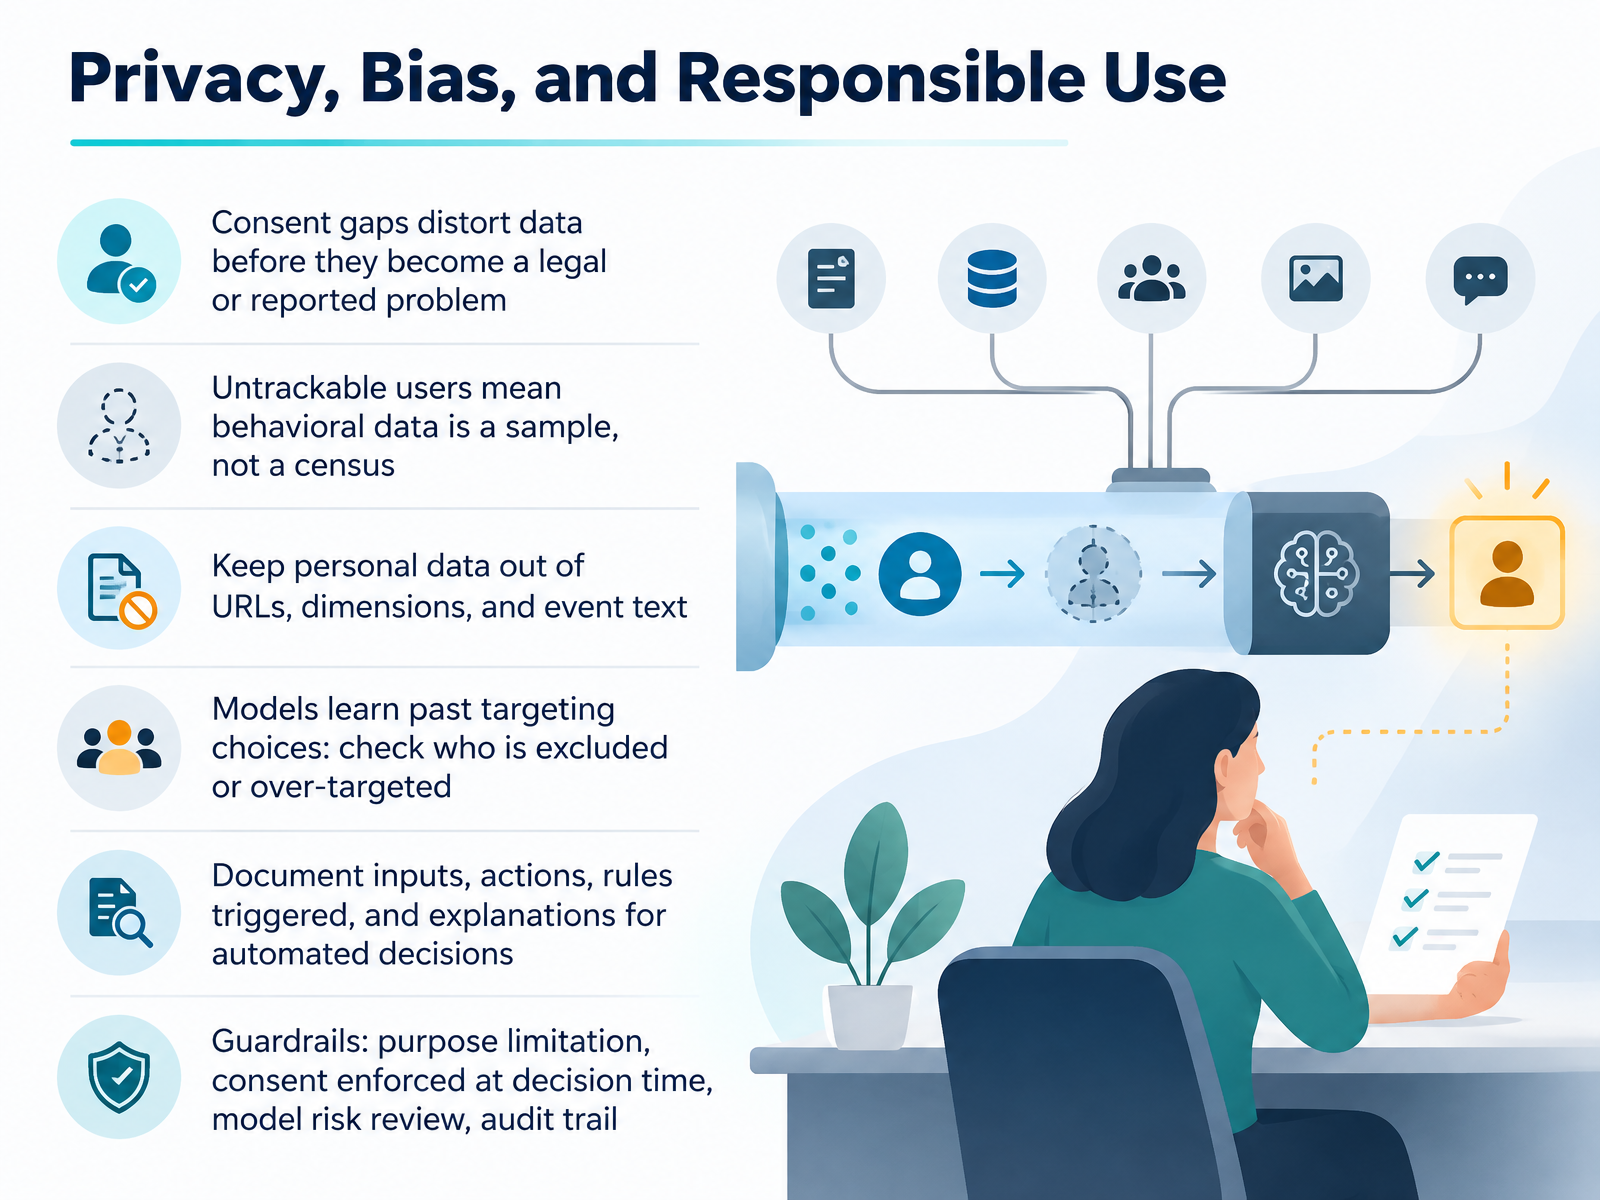
- 11Privacy, Bias, and Responsible UseNext, let's talk about privacy, bias, and responsible use. These are not just legal boxes to tick. Consent gaps distort data before they ever become a reported problem. And when users can't be tracked, your behavioral data is a sample, not a census. So treat it that way. Keep personal data out of URLs, dimensions, and event text. Then check your models for bias. They learn from past targeting choices, so ask who gets excluded or over-targeted. For automated decisions, document the inputs, the actions taken, the rules triggered, and the explanation. That gives you an audit trail. And build guardrails: purpose limitation, consent enforced at decision time, and model risk review. Now let's look at common mistakes and practical guardrails.
 1 min
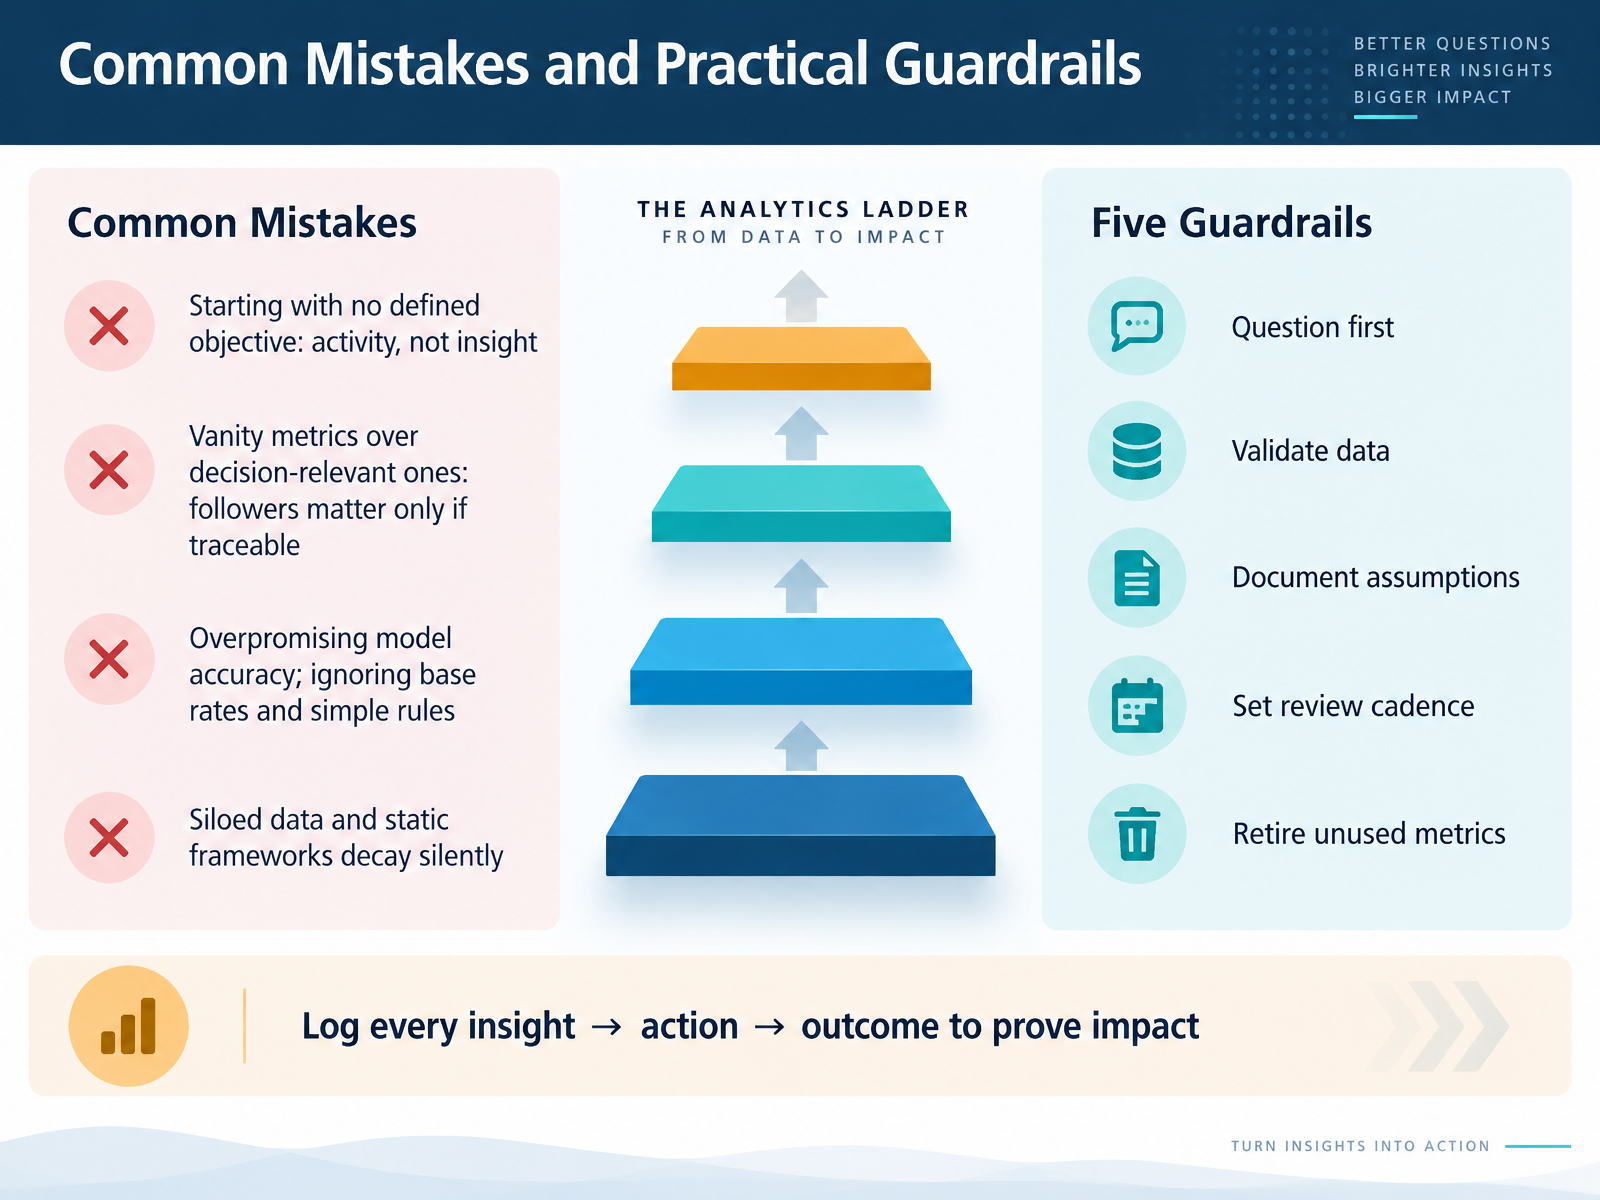
- 12Common Mistakes and Practical GuardrailsNow let's talk about the mistakes that quietly undermine analytics work, and the guardrails that prevent them. The first mistake is starting with no defined objective. You get activity, not insight. Before you open a tool, write down the decision you're trying to support. The second is chasing vanity metrics over decision-relevant ones. Followers only matter if you can trace them to a business outcome. Third, don't overpromise model accuracy. Ignoring base rates and simple rules often leads to disappointment. And fourth, siloed data and static frameworks decay silently, so you need to keep them alive. Here are five practical guardrails. Question first, validate your data, document your assumptions, set a review cadence, and retire metrics nobody uses. And one more habit that proves impact: log every insight to action to outcome. That record is your evidence. Next, we'll walk through a case study that ties all four types together.
 2 min
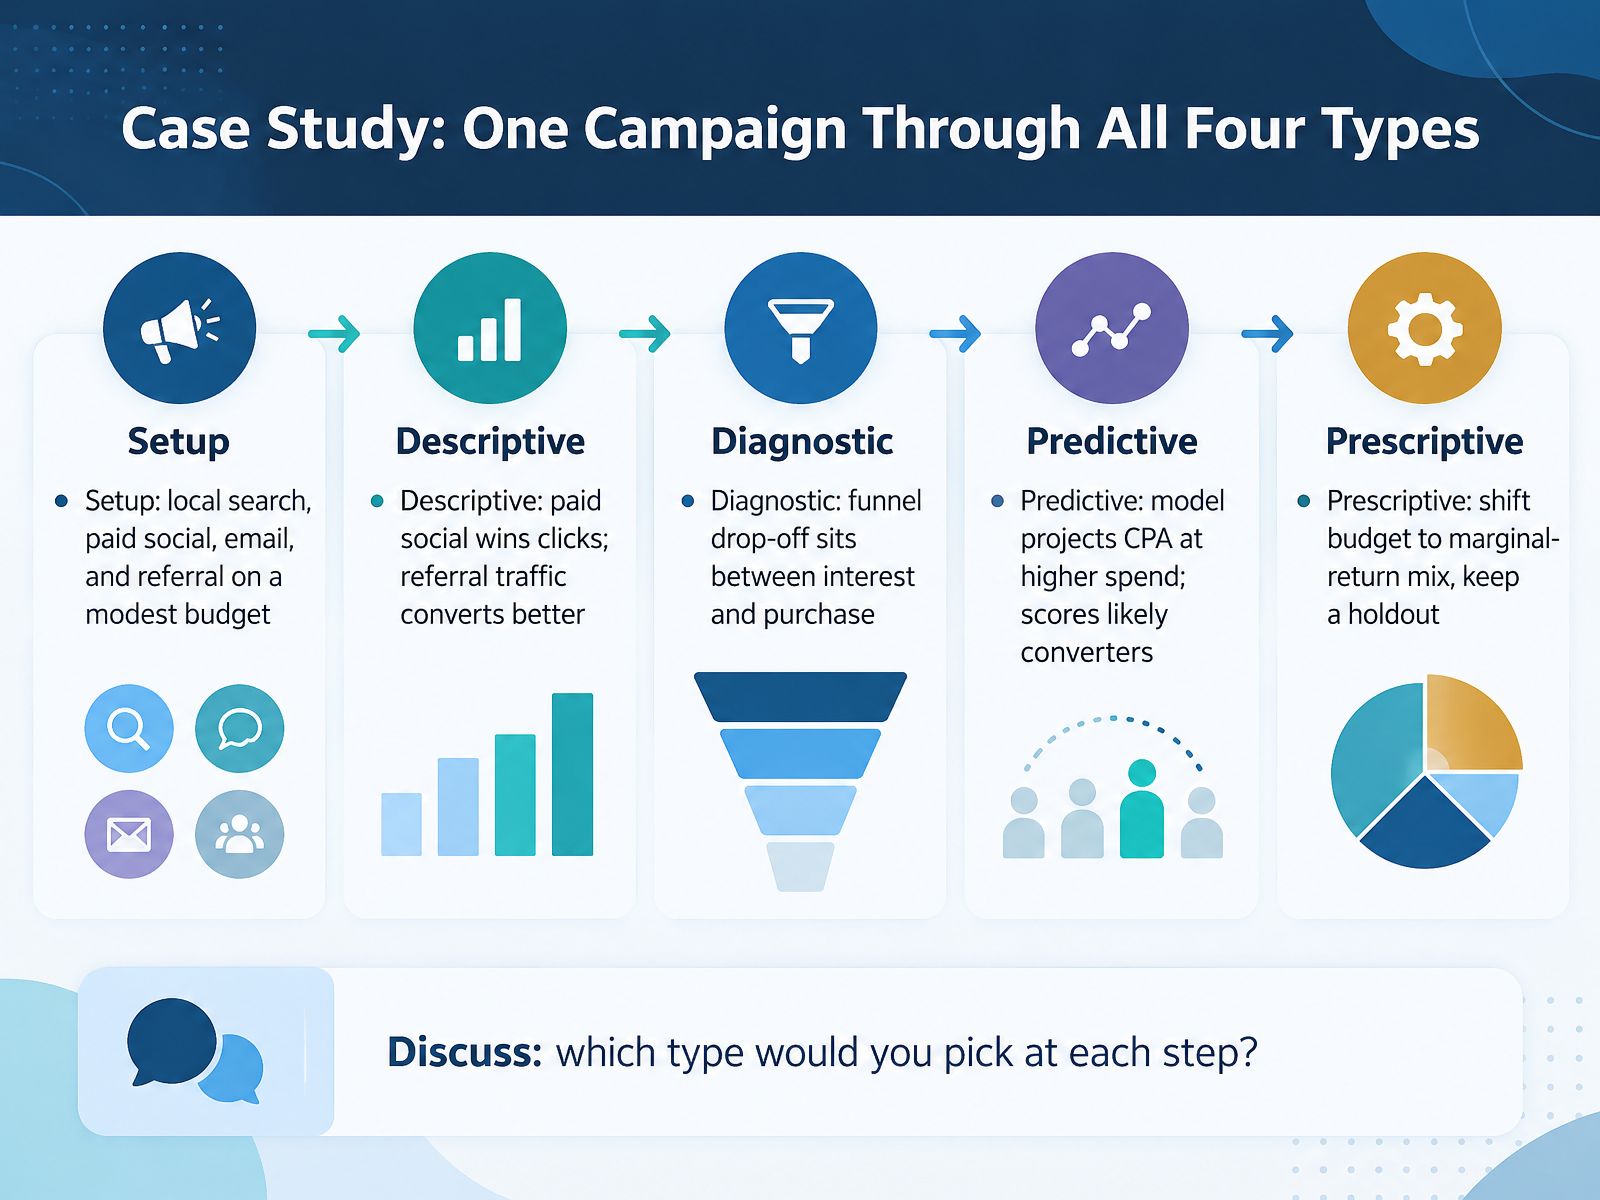
- 13Case Study: One Campaign Through All Four TypesNow let's pull all four types together with one campaign. Picture a modest budget spread across local search, paid social, email, and referral. Descriptive analytics shows what happened: paid social wins clicks, but referral traffic converts better. Pause here and ask which metric you trust. Diagnostic analytics asks why, and it finds the funnel drop-off sits between interest and purchase. Predictive analytics looks forward: it models cost per acquisition at higher spend, and scores which visitors are likely to convert. Prescriptive analytics recommends the move: shift budget toward the mix with the best marginal return, and keep a holdout so you can prove the lift later. Now discuss: at each step, which type would you pick, and why? That habit of matching the question to the method is what makes your analysis useful. Next, we'll turn this into an action plan and next steps.
 2 min
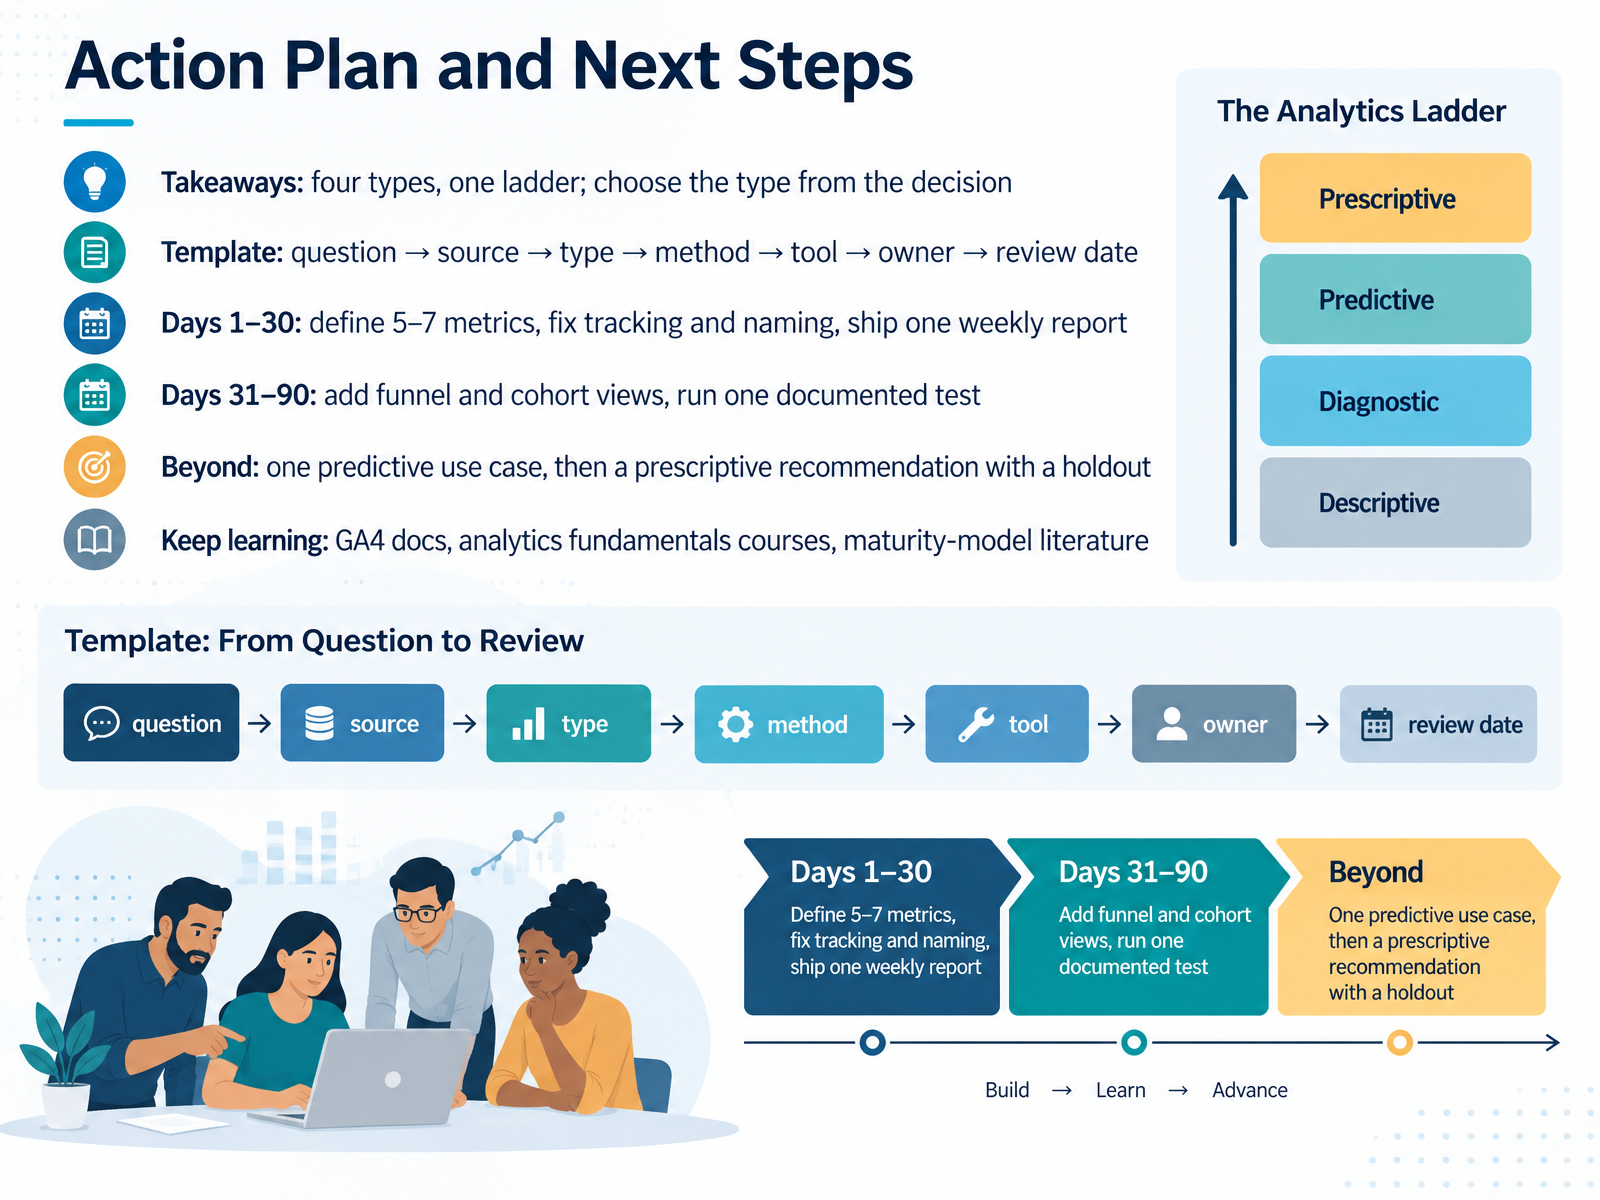
- 14Action Plan and Next StepsLet's close with a plan you can actually run. The core takeaway: there are four types, and they sit on one ladder. You choose the type from the decision in front of you, not from the tool you happen to like. Capture that in a simple template: question, source, type, method, tool, owner, and review date.
For the first thirty days, define five to seven metrics. Fix your tracking and naming, and ship one weekly report. For example, pick one landing page and one conversion metric, then publish that report every Monday.
Days thirty-one to ninety: add funnel and cohort views, and run one documented test. Beyond that, run one predictive use case, then a prescriptive recommendation with a holdout, meaning a group you leave untouched so you can compare results.
Keep learning through GA four documentation, analytics fundamentals courses, and maturity-model literature. You now have a ladder and a plan. Pick your first question this week, assign an owner, and let the data earn its keep. Thank you, and good luck.
 2 min
Take the deck with you
Download this course as a file — free, no sign-up needed.
- PDF handoutEvery slide page, ready to print or share.15 pages · 3.2 MBDownload
- Narrated PowerPointThe deck that presents itself — every slide carries the digital human's narration video.15 pages · 11.2 MBDownload
- PowerPoint slidesThe full deck as a .pptx — open it in PowerPoint, Keynote, or Google Slides.15 pages · 3.1 MBDownload
Free to use in your own training — please keep the PersonWise credit page at the end.
Have your own deck? Turn it into a course
Sources consulted
Web sources consulted while building this course.
- What Is Marketing Analytics? Complete Guide [2026] | CDP.com — cdp.com
- Marketing Analytics | CDP.com — cdp.com
- A marketer's guide to descriptive, predictive, diagnostic ... — business.adobe.com
- ROLE OF DATA IN MARKETING DECISION-MAKING: CONTEMPORARY ANALYTICS AND A SIX-DIMENSIONAL FIT FRAMEWORK — doi.org
- What Is Marketing Analytics? | Ipsos MMA — mma.com
- Funnel Analysis Examples and Case Studies in 5 Industries — amplitude.com
- Funnel & Cohort Analysis Guide · Henkan Insights — henkanpartners.ai
- Funnel Diagnostics: Find Hidden Drop-Offs With an Event Taxonomy That Actually Works | Artisan Strategies — artisangrowthstrategies.com
- Marketing Cohort Analysis: How To Do It (With Examples) - Analytics Platform - Matomo — matomo.org
- Build Conversion Funnels & Analyse Drop-Off Reports — sourceloop.ai