Begin
14 pages · ~28 min
Glaciers: How Ice Shapes Landscapes
This training explores how glaciers shape landscapes, helping learners understand glacial processes and their impact on landforms. Ideal for students and enthusiasts of geology and physical geography.
A digital instructor presents all 14 pages. Hold “Ask” at any point and ask out loud — the answer comes from this course. No sign-up needed.
What you’ll learn
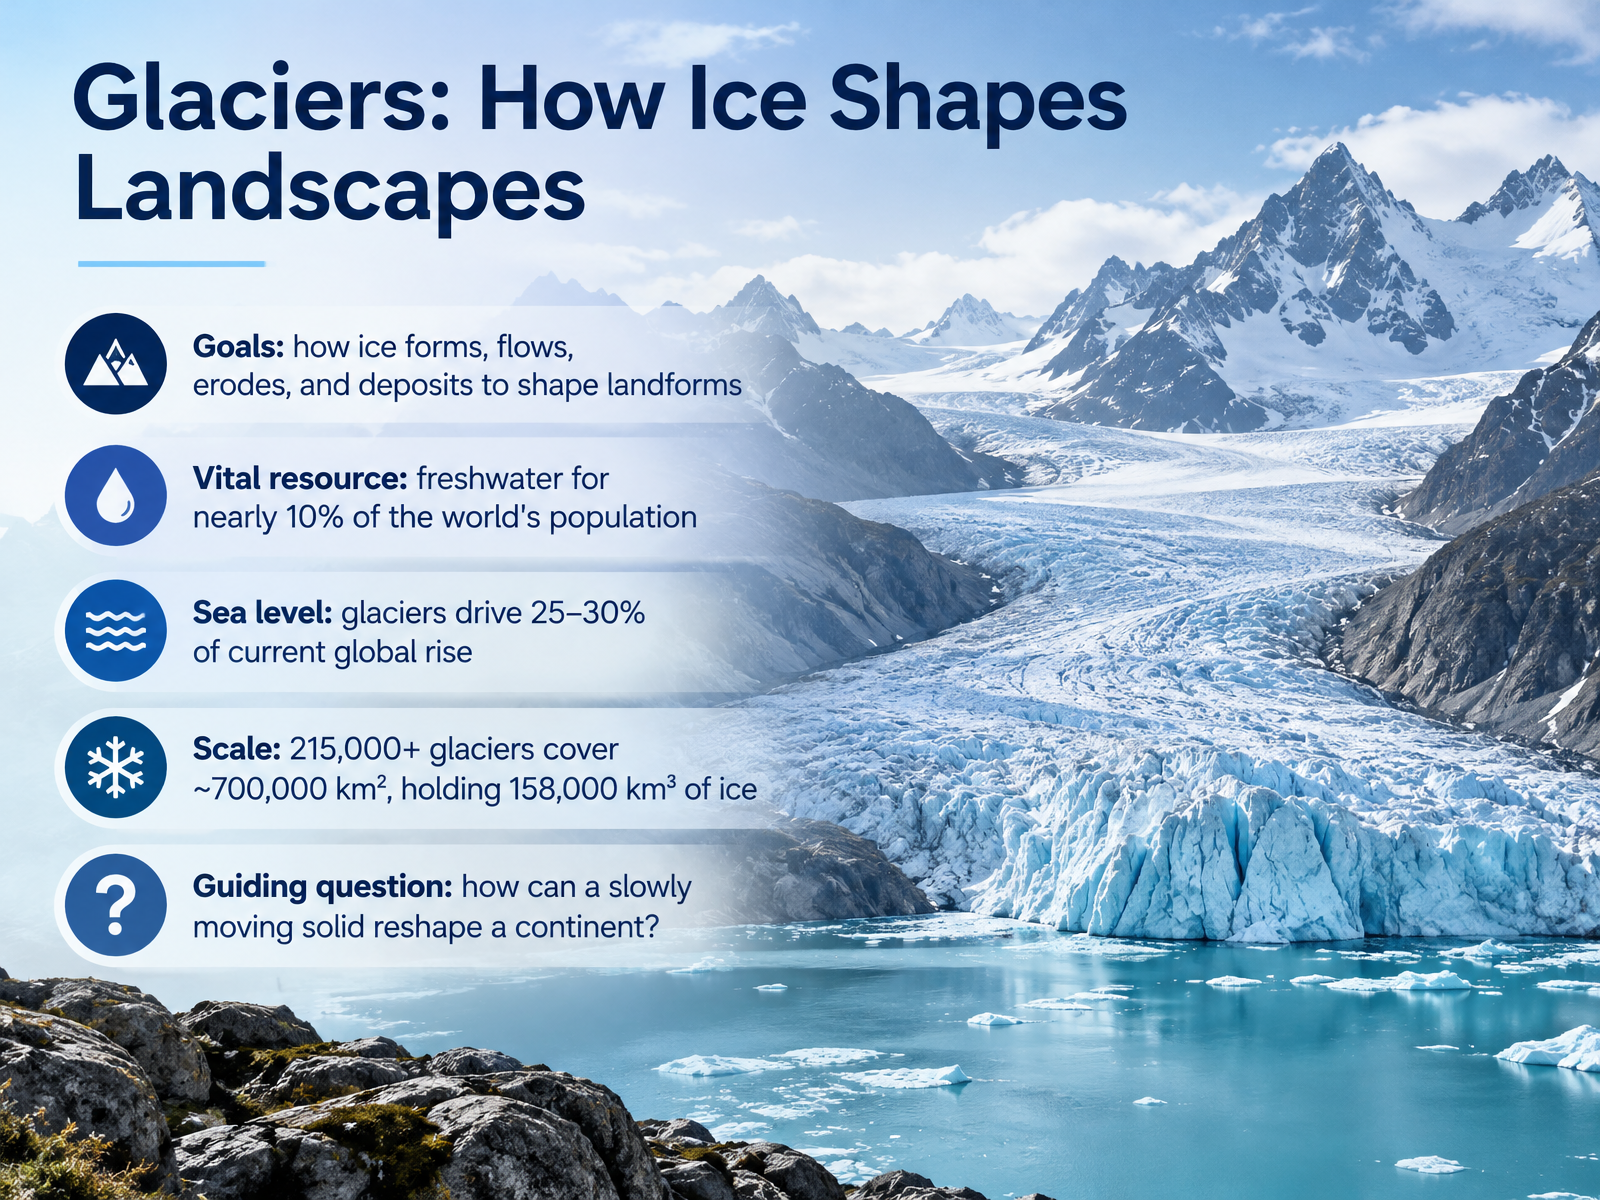
- 01Glaciers: How Ice Shapes LandscapesWelcome. Today we begin a journey into glaciers, and into how slowly moving ice shapes the land around us. By the end, you will understand how glacier ice forms, flows, erodes, and deposits material to build landforms. Glaciers matter to us, too. They store freshwater used by nearly one in ten people on Earth. Their melting drives about twenty-five to thirty percent of current global sea level rise. And the scale is enormous: more than two hundred fifteen thousand glaciers cover about seven hundred thousand square kilometers, holding roughly one hundred fifty-eight thousand cubic kilometers of ice. So here is our guiding question. How can a solid that moves slower than a growing fingernail reshape a continent? Keep that question in mind as we go. Next, we look at glacier types and the global ice inventory.ipcc.chdoi.orguser.geo.uzh.ch+22 min
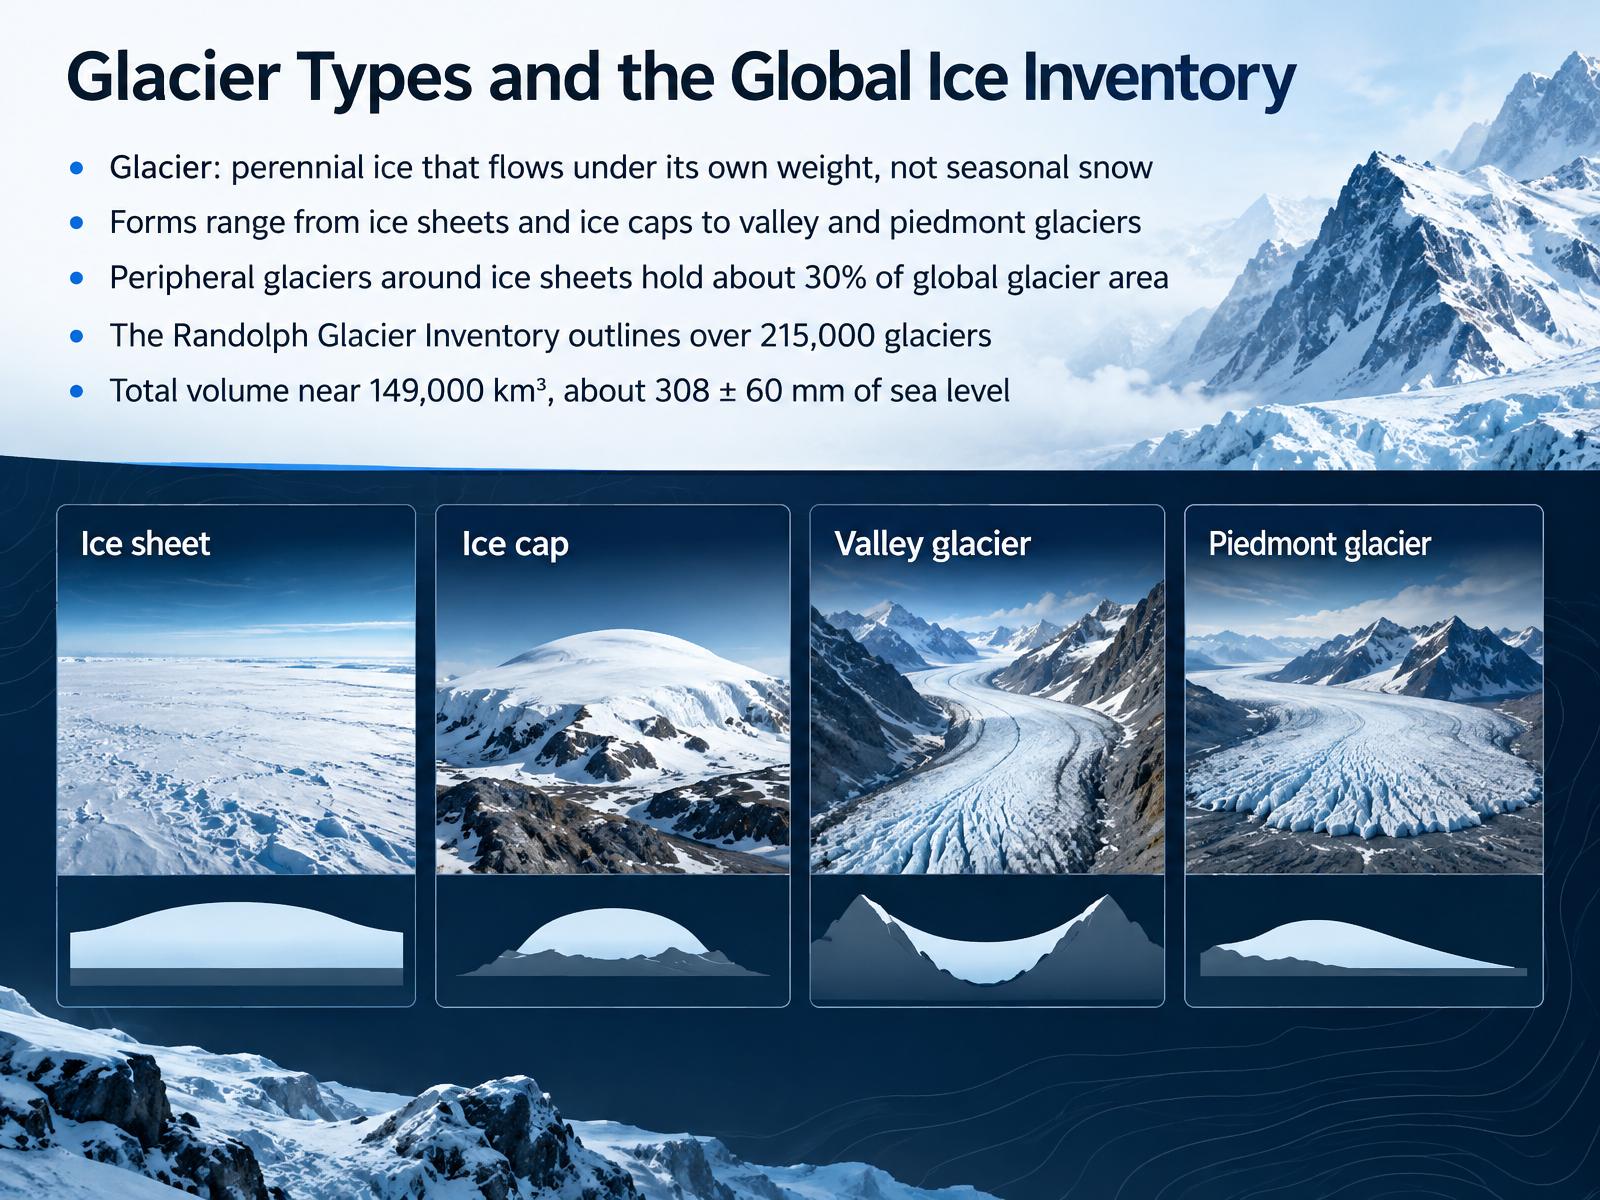
- 02Glacier Types and the Global Ice InventoryNow that we know why glaciers matter, let's sort them into types and count them. A glacier is perennial ice that flows under its own weight. It is not seasonal snow. Picture a mass of ice so thick it deforms and creeps downhill like slow, silent honey. Glaciers come in many forms, from vast ice sheets and ice caps to narrow valley glaciers and spread-out piedmont glaciers. Here is a number to hold onto. The small glaciers around the edges of the big ice sheets hold about thirty percent of global glacier area. To keep track of them, scientists use the Randolph Glacier Inventory. It outlines more than two hundred fifteen thousand glaciers. Together, their total volume is near one hundred forty nine thousand cubic kilometers. That is roughly three hundred eight millimeters of potential sea level rise, give or take sixty millimeters. As curious observers, ask yourself how such a huge total gets measured. Next, we look at how snow turns into ice, in From Snow to Ice: Formation and Mass Balance.
 ipcc.chdoi.orguser.geo.uzh.ch+22 min
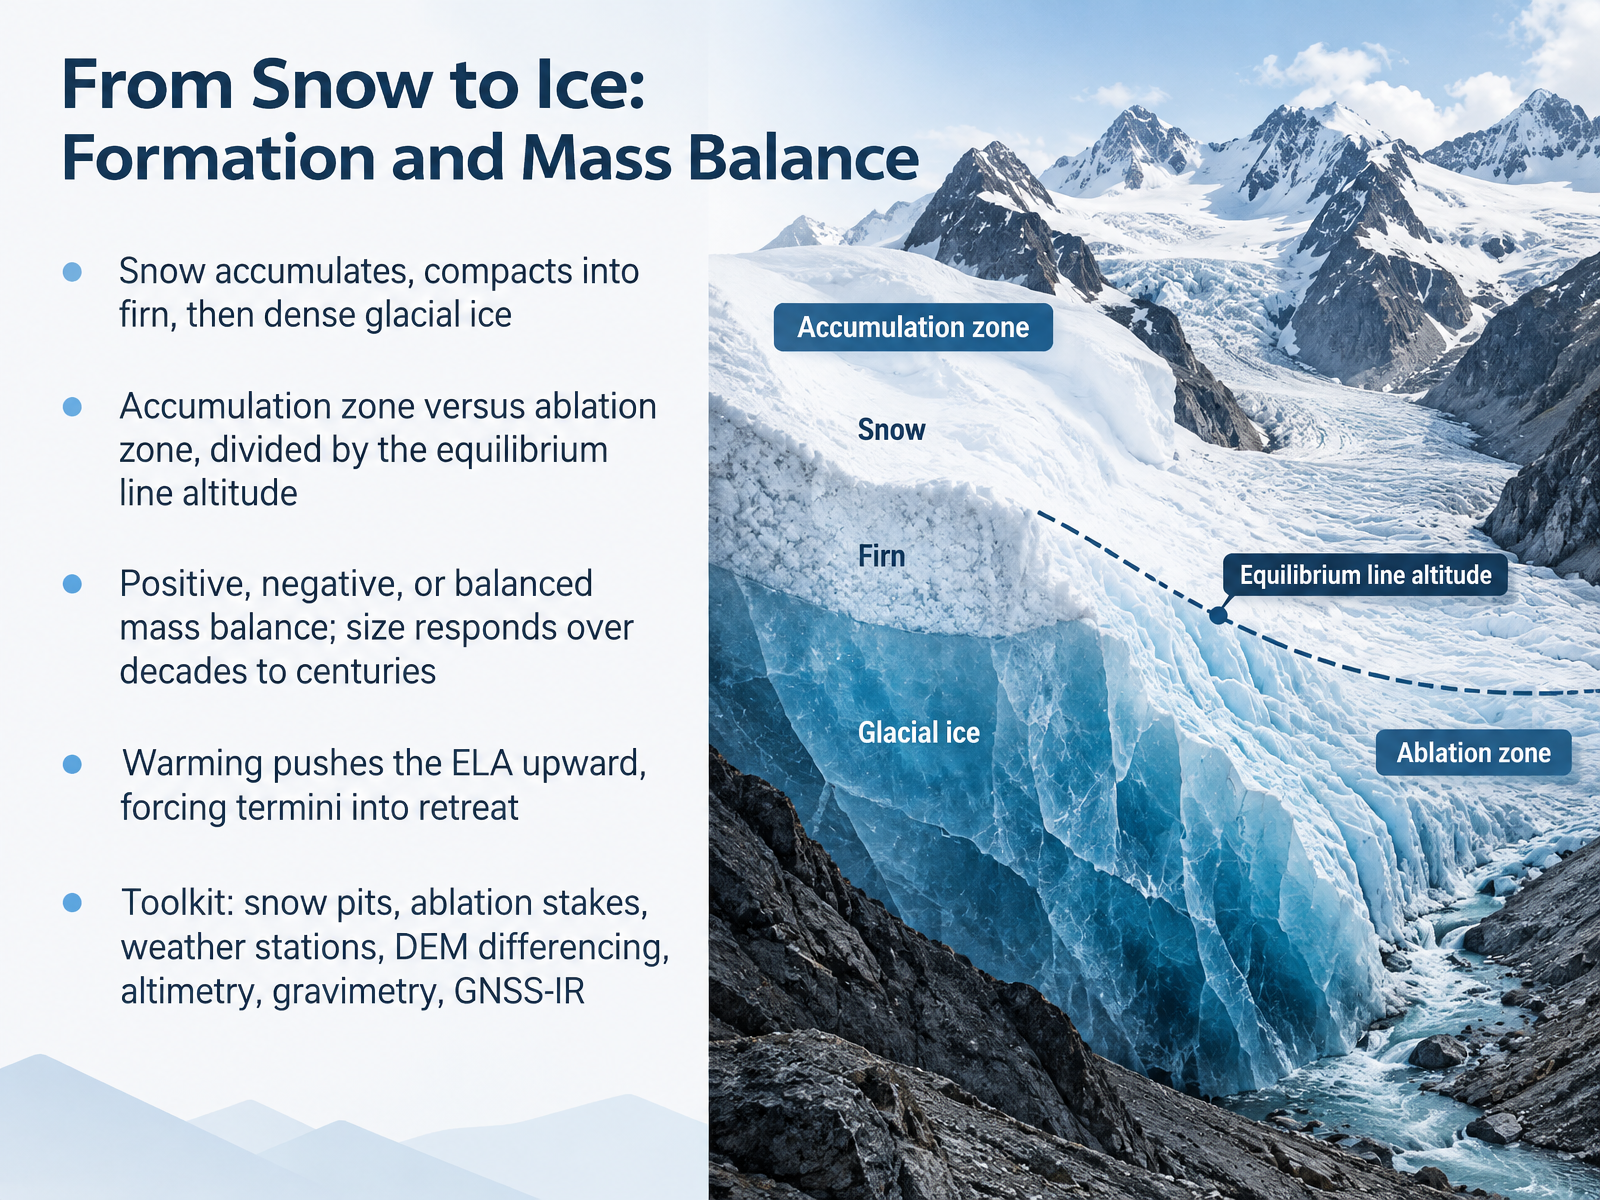
- 03From Snow to Ice: Formation and Mass BalanceLet's follow a snowflake's journey. Snow piles up, gets buried, and compacts into firn, a grainy in-between stage. With more pressure, the air is squeezed out, and firn becomes dense glacial ice. Picture a glacier as a bank account. The accumulation zone is where snow adds money. The ablation zone is where melting and calving withdraw it. The line between them is the equilibrium line altitude, or E L A. When gains exceed losses, mass balance is positive. When losses win, it is negative. And a glacier's size responds over decades to centuries, not overnight. As warming pushes the E L A upward, the withdrawal zone grows, and the terminus retreats. Curious observers can ask, where would the E L A sit on your local mountain? Scientists track this with snow pits, ablation stakes, weather stations, D E M differencing, altimetry, gravimetry, and G N S S I R. These tools turn snow into numbers. Next, how ice moves through deformation, sliding, and surges.
 essd.copernicus.orgusgs.govdoi.org+22 min
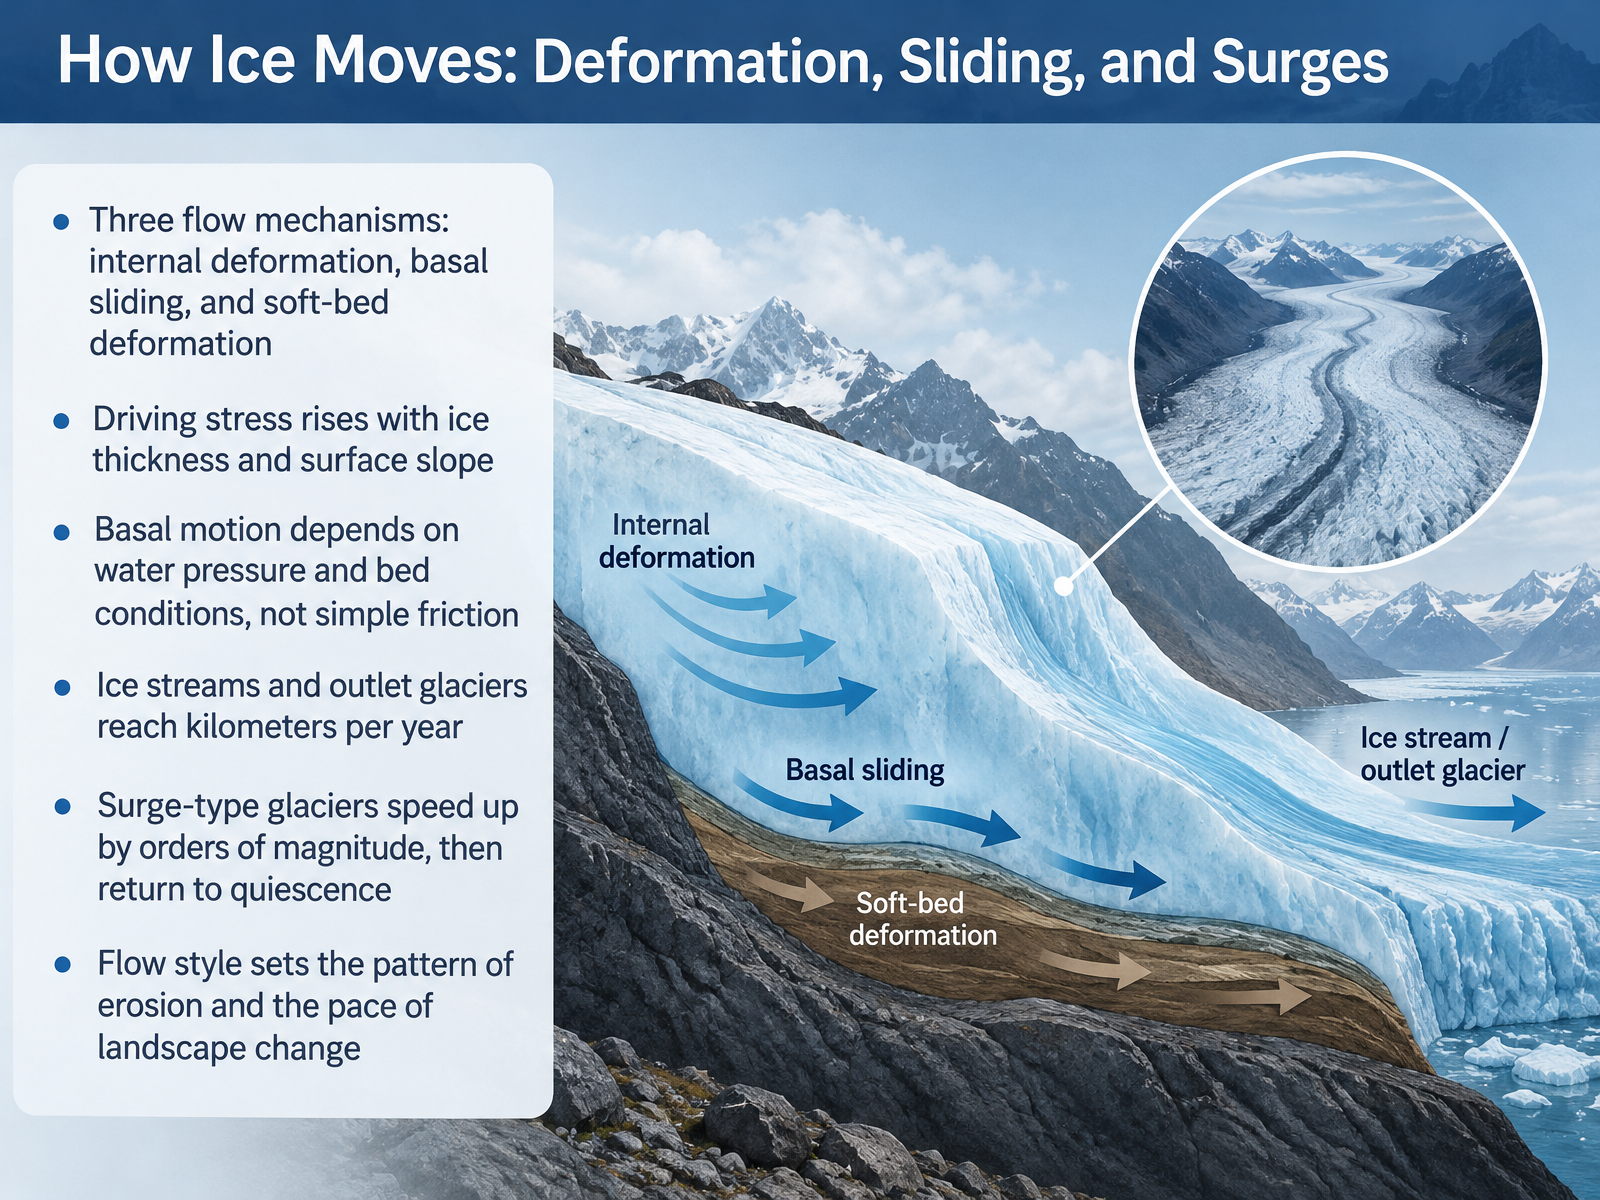
- 04How Ice Moves: Deformation, Sliding, and SurgesNow let's look at how ice actually moves. Glaciers flow in three main ways. First, internal deformation. The ice deforms and creeps under its own weight, like very slow, stiff honey. Second, basal sliding. The whole ice mass slips over the bed below. Third, soft-bed deformation. The ice drags a layer of wet sediment along with it. What drives all this flow? Driving stress. It rises with ice thickness and with the steepness of the surface slope. Thicker or steeper ice pushes harder. Now, a key point. Basal motion is not simply controlled by friction. It depends on water pressure and the condition of the bed. High water pressure can lift the ice and let it slide faster, especially over soft sediment. This is why some ice streams and outlet glaciers can move at kilometers per year. And surge-type glaciers take this further. They speed up by orders of magnitude, then return to quiet for decades. Here is the takeaway. The style of flow sets the pattern of erosion and the pace of landscape change. Next, we turn to glacial erosion and sediment transport.
 science.orgarxiv.orgnature.com+22 min
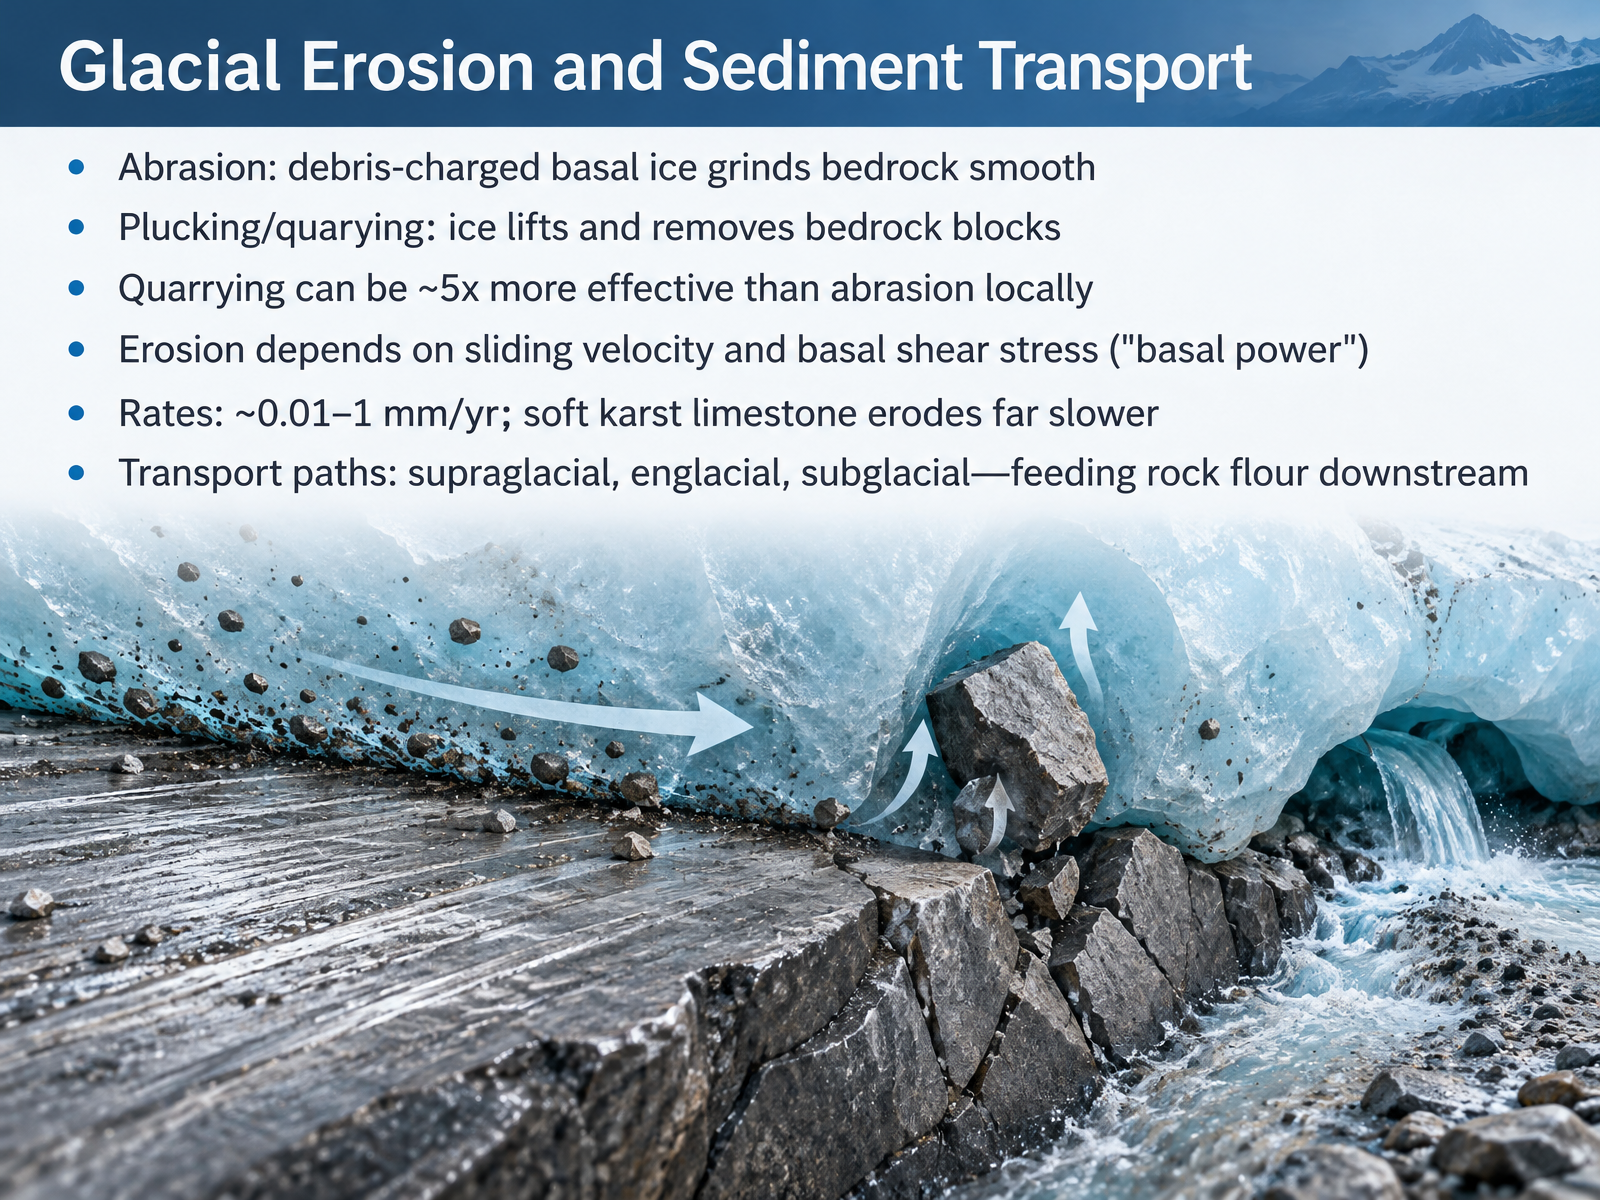
- 05Glacial Erosion and Sediment TransportNow let's look at how ice actually wears down rock. Glaciers erode in two main ways. Abrasion is like sandpaper. Debris frozen into the base of the ice grinds across bedrock and smooths it. Plucking, also called quarrying, is different. The ice grips blocks of bedrock and lifts them away. Locally, quarrying can be about five times more effective than abrasion. How fast does this happen? It depends on sliding velocity and basal shear stress, together called basal power. Measured rates run from about zero point zero one to one millimeter per year. Soft, karst limestone erodes far slower, because meltwater drains away and the ice loses its grip. The eroded rock then travels in three paths: on top of the ice, supraglacial; inside the ice, englacial; and beneath it, subglacial. This debris feeds rock flour downstream. Next, we look at the landforms these processes carve: Erosional Landforms: Valleys, Cirques, and Fjords.
 doi.orgdoi.orggh.copernicus.org+22 min
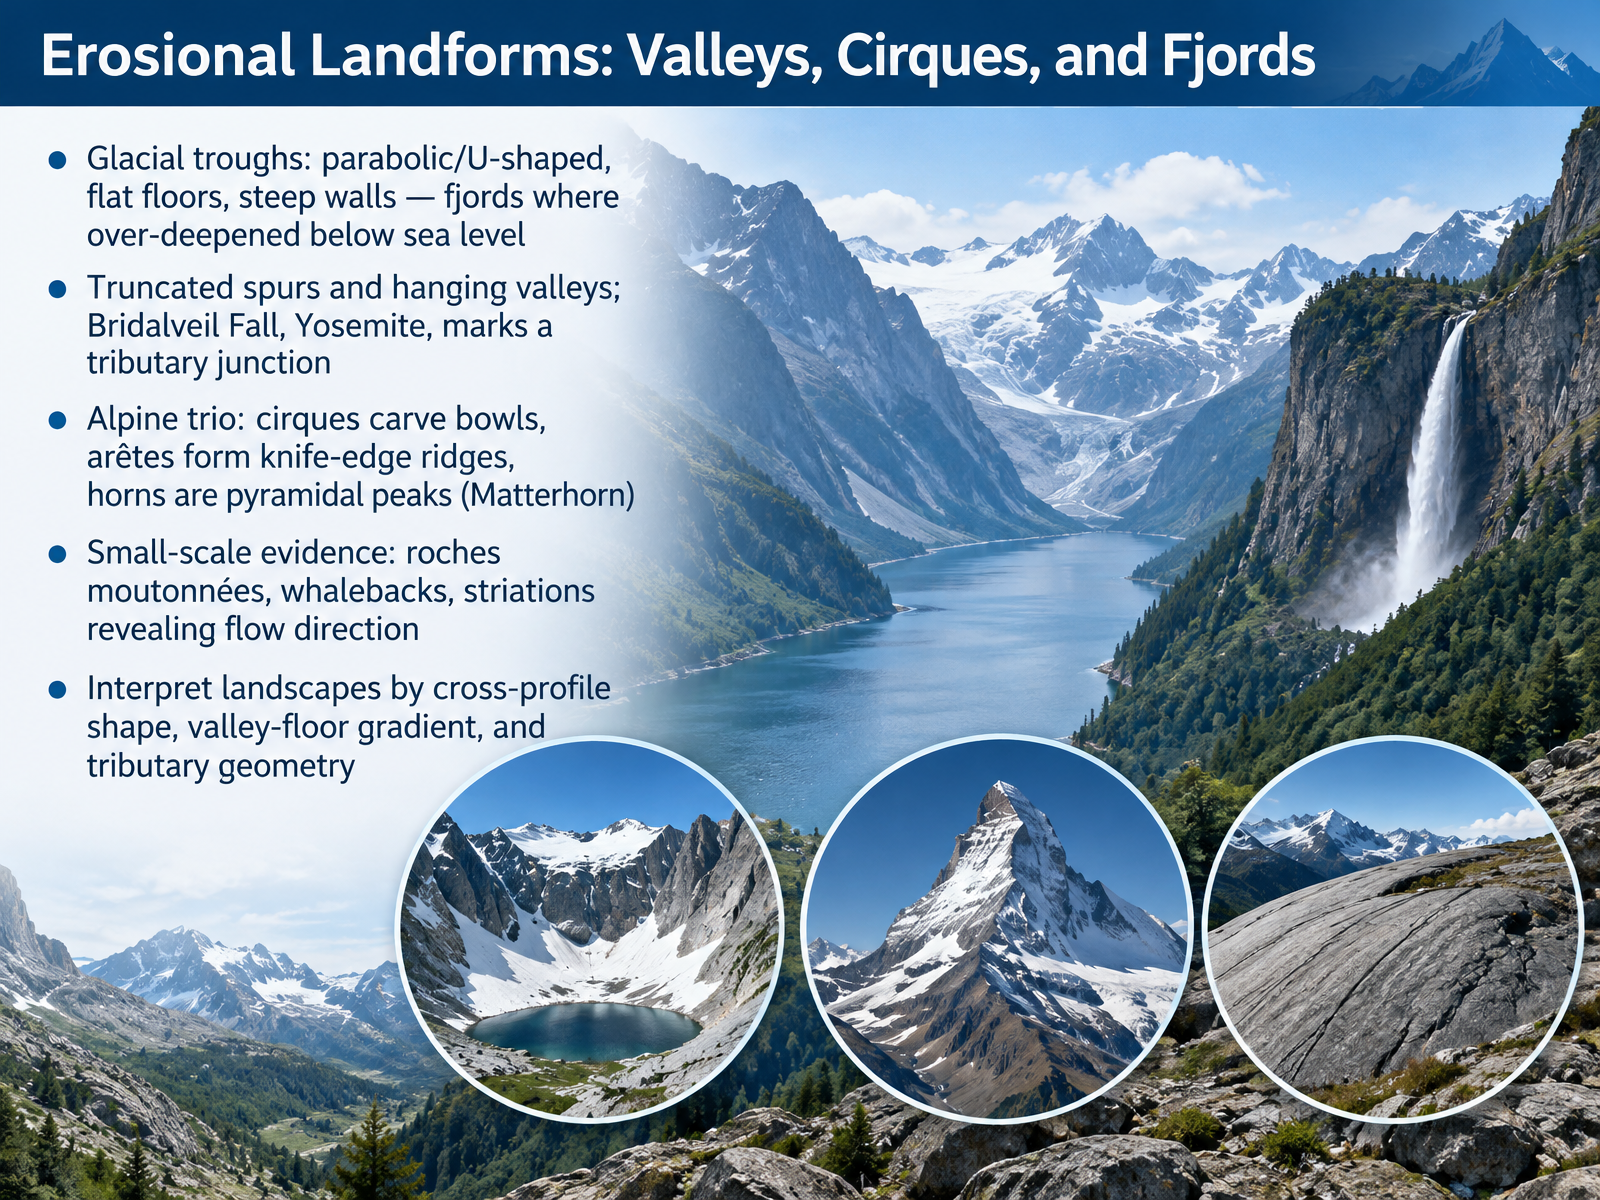
- 06Erosional Landforms: Valleys, Cirques, and FjordsNow let us look at how ice carves the land itself. Start with the valley shape. A river cuts a narrow V. A glacier widens the floor and steepens the walls, leaving a broad, flat-bottomed trough. Where that trough drops below sea level and fills with ocean water, we call it a fjord. Picture steep walls rising straight from the sea. Next, side valleys. A small tributary glacier cannot cut as deep as the main one, so its mouth is left hanging high on the valley wall. Bridalveil Fall in Yosemite marks exactly that kind of junction. In the mountains, three features often appear together. A cirque is a bowl scooped at the valley head. An arete is the knife-edge ridge between two cirques. And where three or more cirques meet, they leave a horn, like the Matterhorn. Finally, look at small clues. Roche moutonnees and whalebacks are smoothed, rounded rock humps, and striations are scratches that reveal which way the ice flowed. So, as a curious observer, judge a landscape by three things: cross-profile shape, valley-floor gradient, and how tributaries join the main valley. That reading tells you ice was here. Next, we turn from erosion to deposition, in Depositional Landforms: Moraines, Till, and Outwash.
 2 min
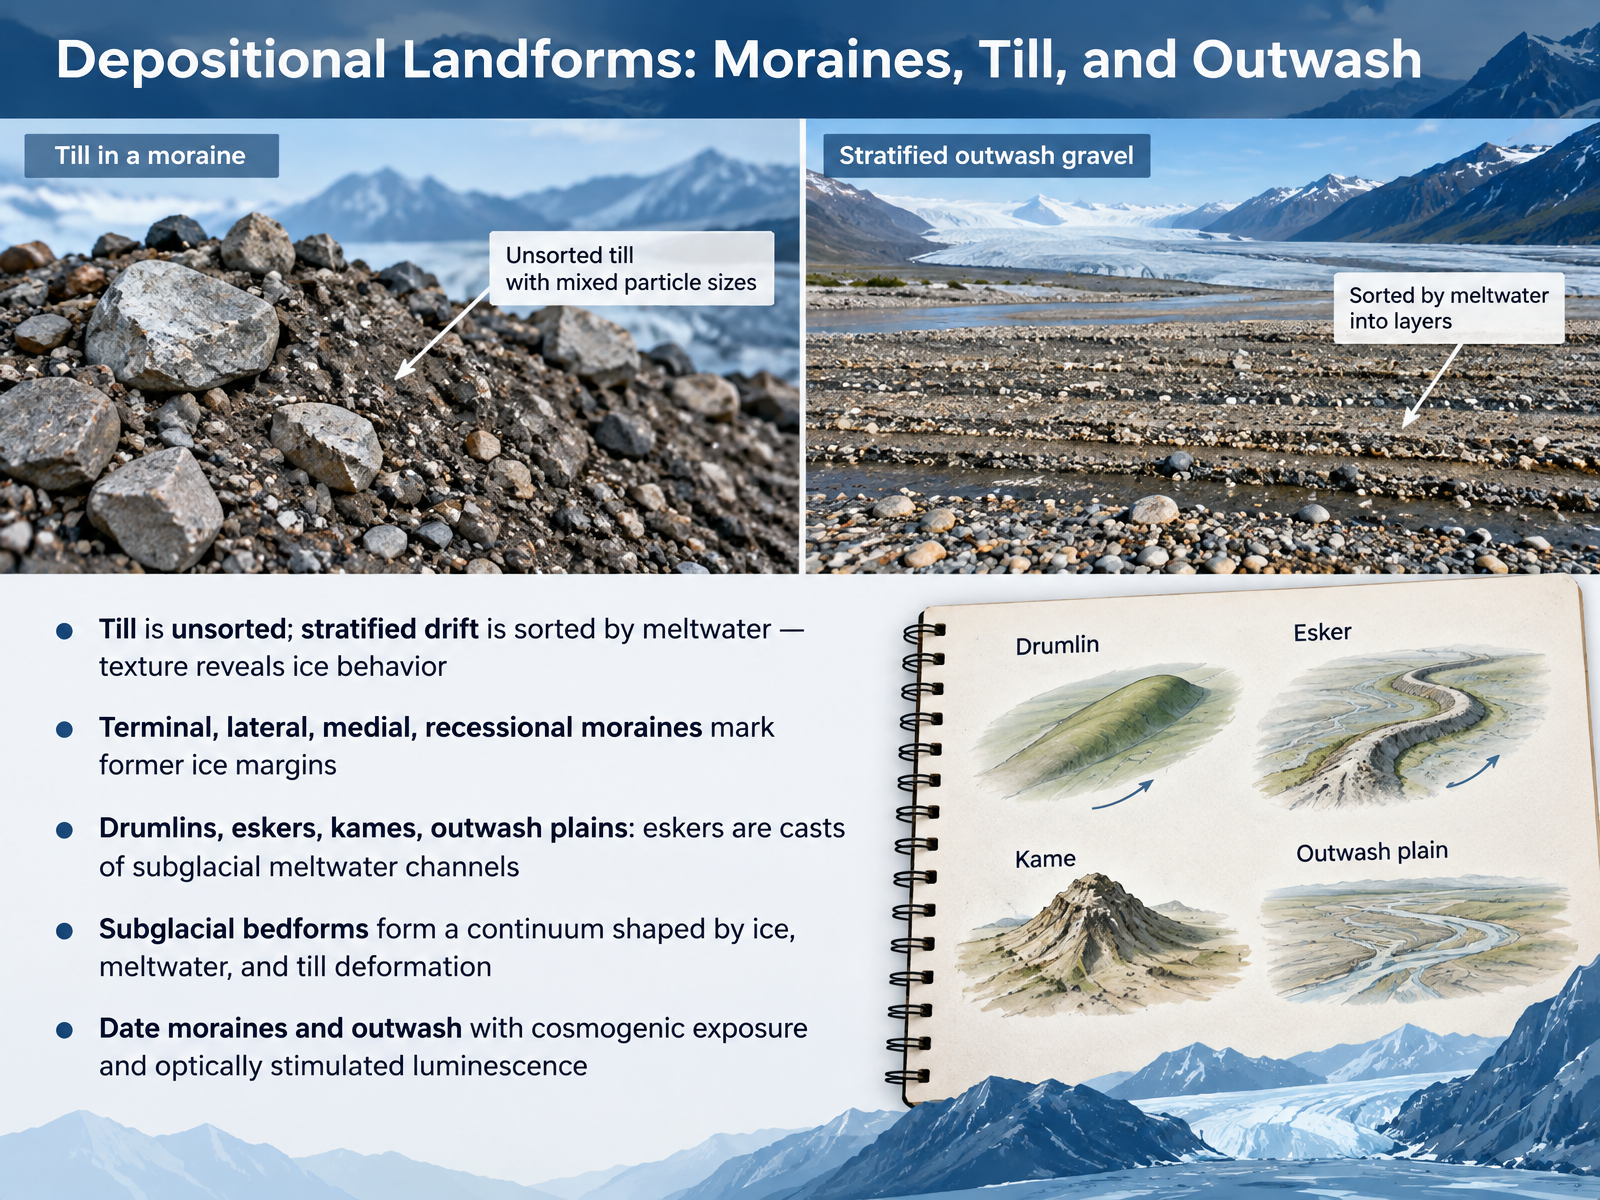
- 07Depositional Landforms: Moraines, Till, and OutwashNow let's look at what glaciers leave behind. When ice melts, it deposits sediment, and the texture of that sediment tells a story. Till is unsorted, a jumble of clay, sand, and boulders dropped directly by ice. Stratified drift, by contrast, is sorted by meltwater, with larger grains settling first. So ask yourself, what does texture reveal about how the ice behaved? Moraines mark former ice margins. Terminal moraines sit at the farthest advance. Lateral moraines line the sides. Medial moraines form where ice streams merge. Recessional moraines record pauses during retreat. Other features include drumlins, streamlined hills; eskers, sinuous ridges that are casts of subglacial meltwater channels; kames, ice-contact mounds; and outwash plains, spread by meltwater rivers. These subglacial bedforms form a continuum shaped by ice, meltwater, and till deformation. To date them, scientists use cosmogenic exposure and optically stimulated luminescence. Next, we turn to glacial lakes, outburst floods, and mountain hazards.
 2 min
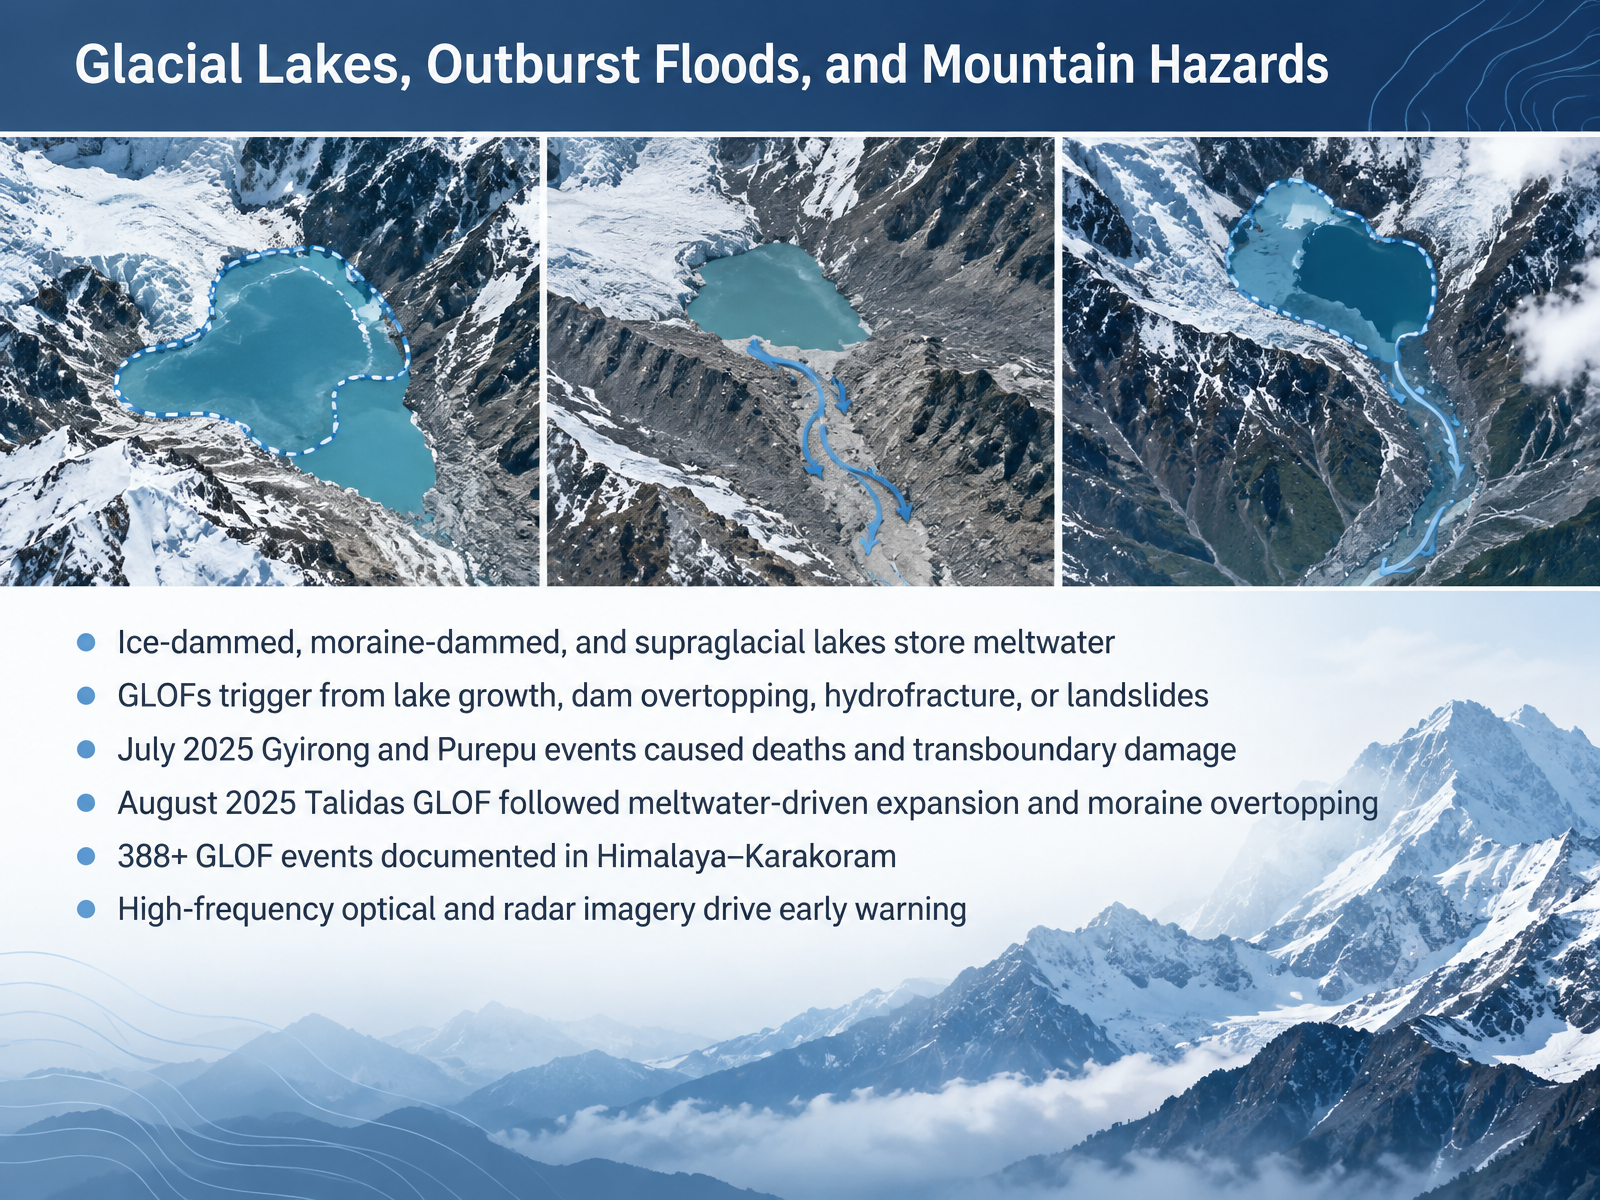
- 08Glacial Lakes, Outburst Floods, and Mountain HazardsNow let's look at where that meltwater collects, and why it can become dangerous. Glacial lakes form in three common settings. Ice-dammed lakes are held back by the glacier itself. Moraine-dammed lakes sit behind ridges of rock and debris left by the ice. And supraglacial lakes rest directly on the glacier surface. All three store meltwater, and all three can fail. A glacial lake outburst flood, or G L O F, can be triggered by rapid lake growth, water spilling over the dam, hydrofracture, where water splits the ice, or a landslide into the lake. Recent events show the stakes. In July 2025, the Gyirong and Purepu floods in the Himalaya caused deaths and damage across the China-Nepal border. In August 2025, the Talidas flood followed steady meltwater-driven lake growth and overtopping of its moraine dam. Across the Himalaya and Karakoram, more than three hundred and eighty-eight G L O F events have now been documented. So how do we watch for them? High-frequency optical and radar satellite imagery let us track lake growth and support early warning. Next, we widen our view to Ice Ages and Continental Glaciation.
 ipcc.chdoi.orguser.geo.uzh.ch+22 min
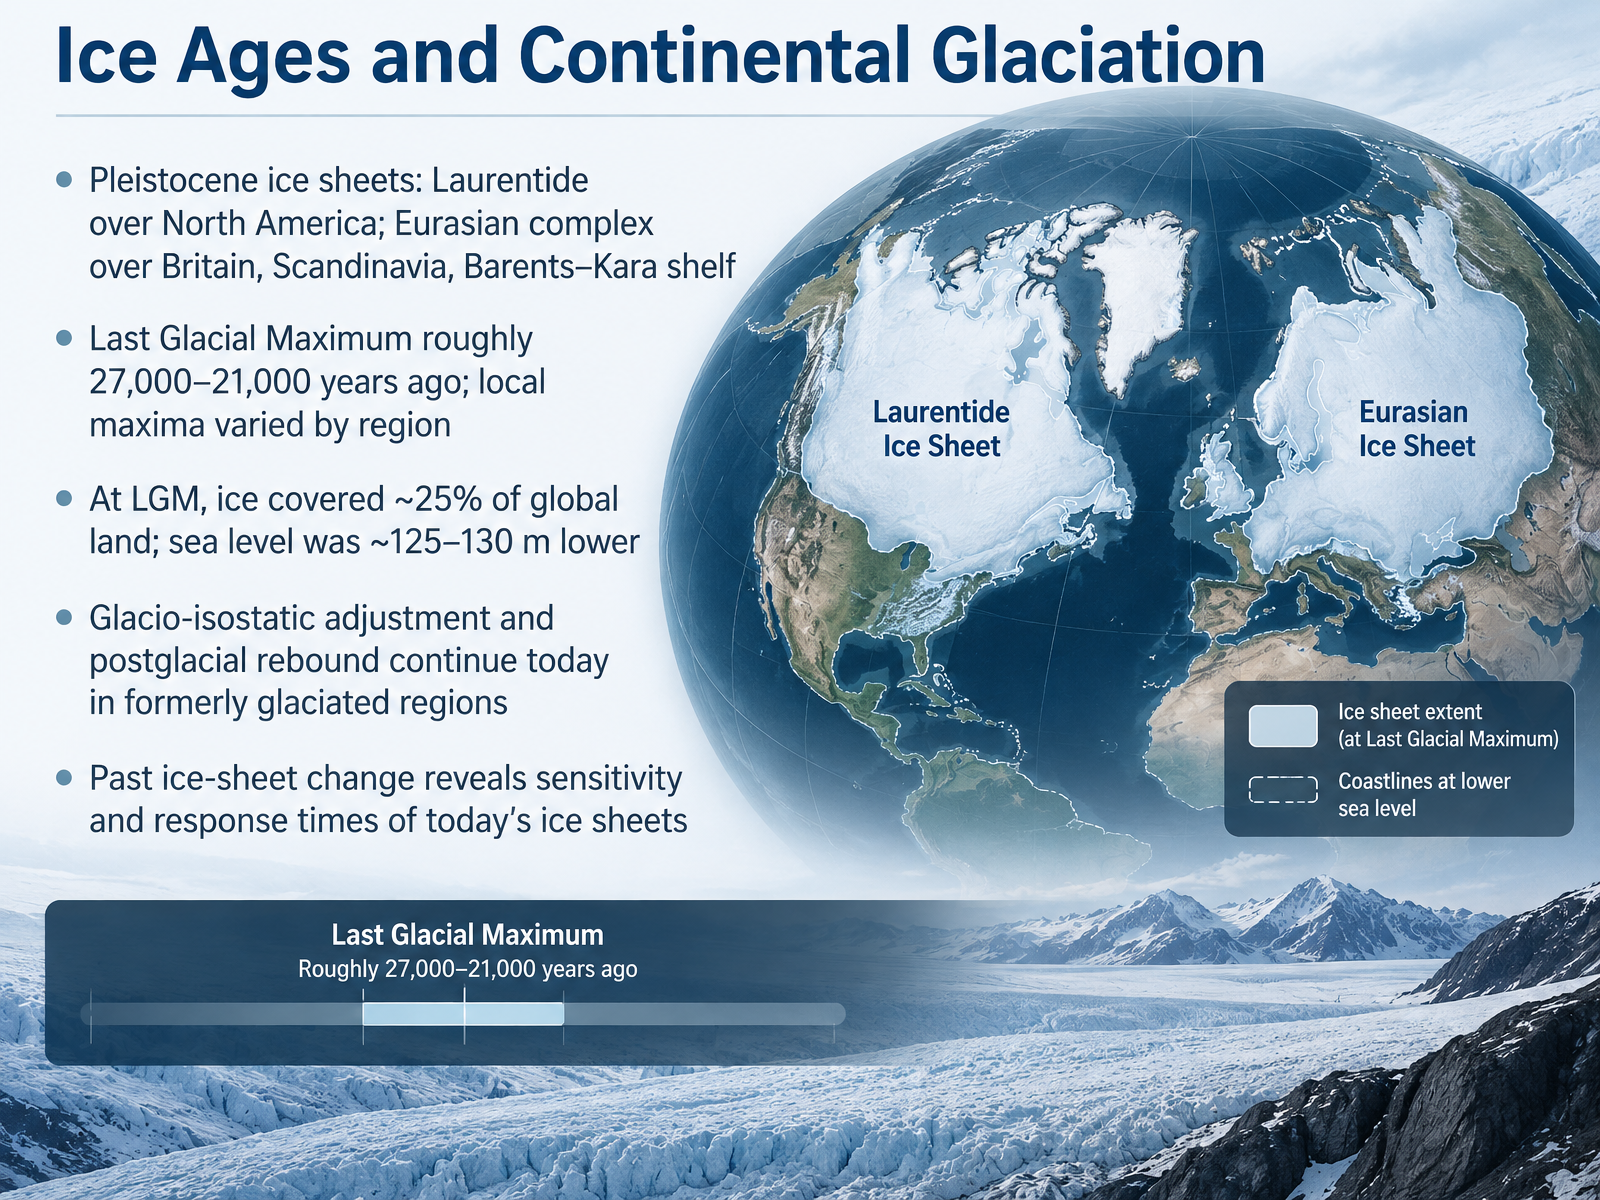
- 09Ice Ages and Continental GlaciationNow let's zoom out to the ice ages, when ice sheets covered whole continents. During the Pleistocene, two great complexes dominated the Northern Hemisphere. The Laurentide Ice Sheet spread over North America. And the Eurasian complex covered Britain, Scandinavia, and the Barents and Kara shelf. Their peak is called the Last Glacial Maximum, roughly twenty-seven thousand to twenty-one thousand years ago. But local maxima varied, so think of it as a worldwide interval, not a single instant. At that time, ice covered about twenty-five percent of global land. Today, it is roughly ten percent. And sea level stood about one hundred twenty-five to one hundred thirty meters lower. Now, here is a question for you. If you removed that much ice from a continent, what would happen to the land beneath it? The answer is rebound. The crust sank under the weight, and it is still rising today in formerly glaciated regions. One slow adjustment, called glacial isostatic adjustment. That past change matters. It shows us how sensitive today's ice sheets are, and how quickly they can respond. Next, we turn to glaciers today: global change, water, and sea level.
 2 min
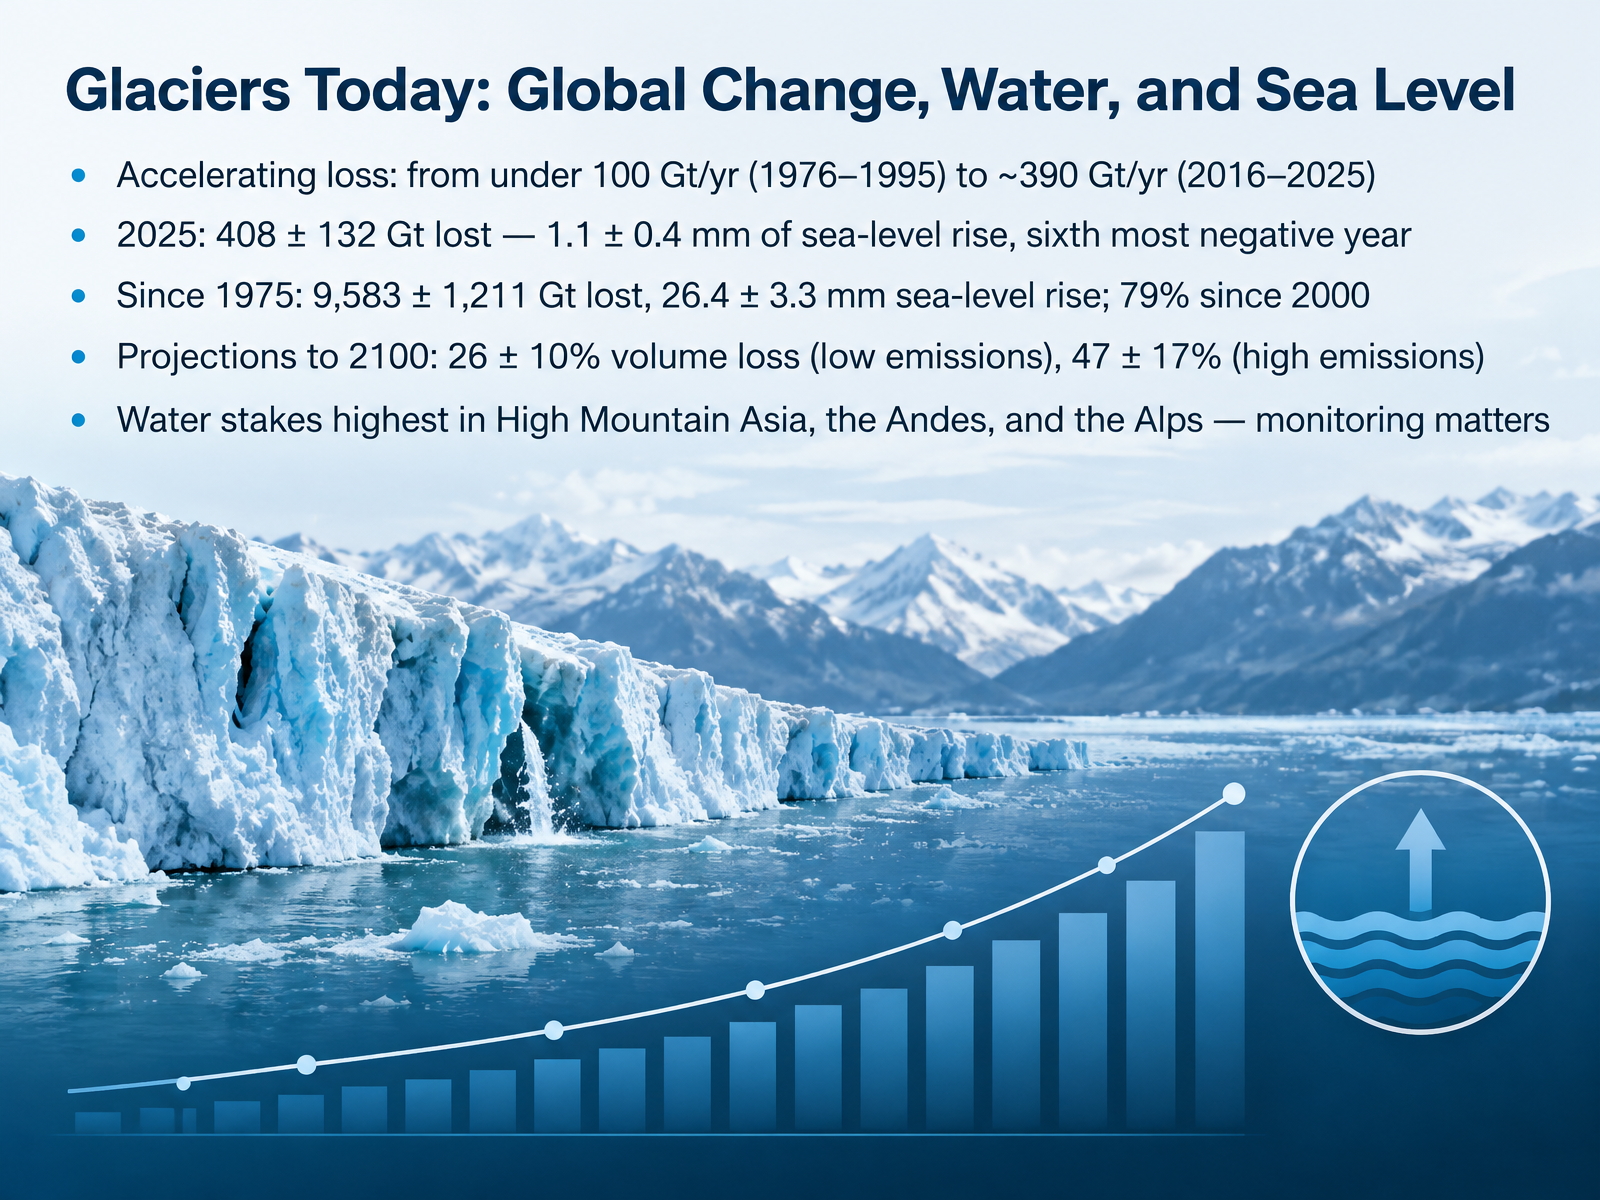
- 10Glaciers Today: Global Change, Water, and Sea LevelNow let's bring this global picture into the present. Glaciers are losing mass faster than before. From 1976 to 1995, the loss was under 100 gigatonnes per year. In the last decade, it reached about 390 gigatonnes per year. A gigatonne is a billion tonnes of water. In 2025 alone, glaciers lost 408 gigatonnes, raising sea level by about 1.1 millimetres. Since 1975, the total is about 9,583 gigatonnes, or 26.4 millimetres of sea-level rise. Nearly 80 percent of that has occurred since 2000. Looking ahead to 2100, projections suggest a loss of about 26 percent of glacier volume under low emissions, and 47 percent under high emissions. The water stakes are highest in High Mountain Asia, the Andes, and the Alps. That is why monitoring matters. Next, we look at how policy turns that need into action: Monitoring Policy: From the International Year of Glaciers to a Decade of Action.
 essd.copernicus.orgusgs.govdoi.org+22 min
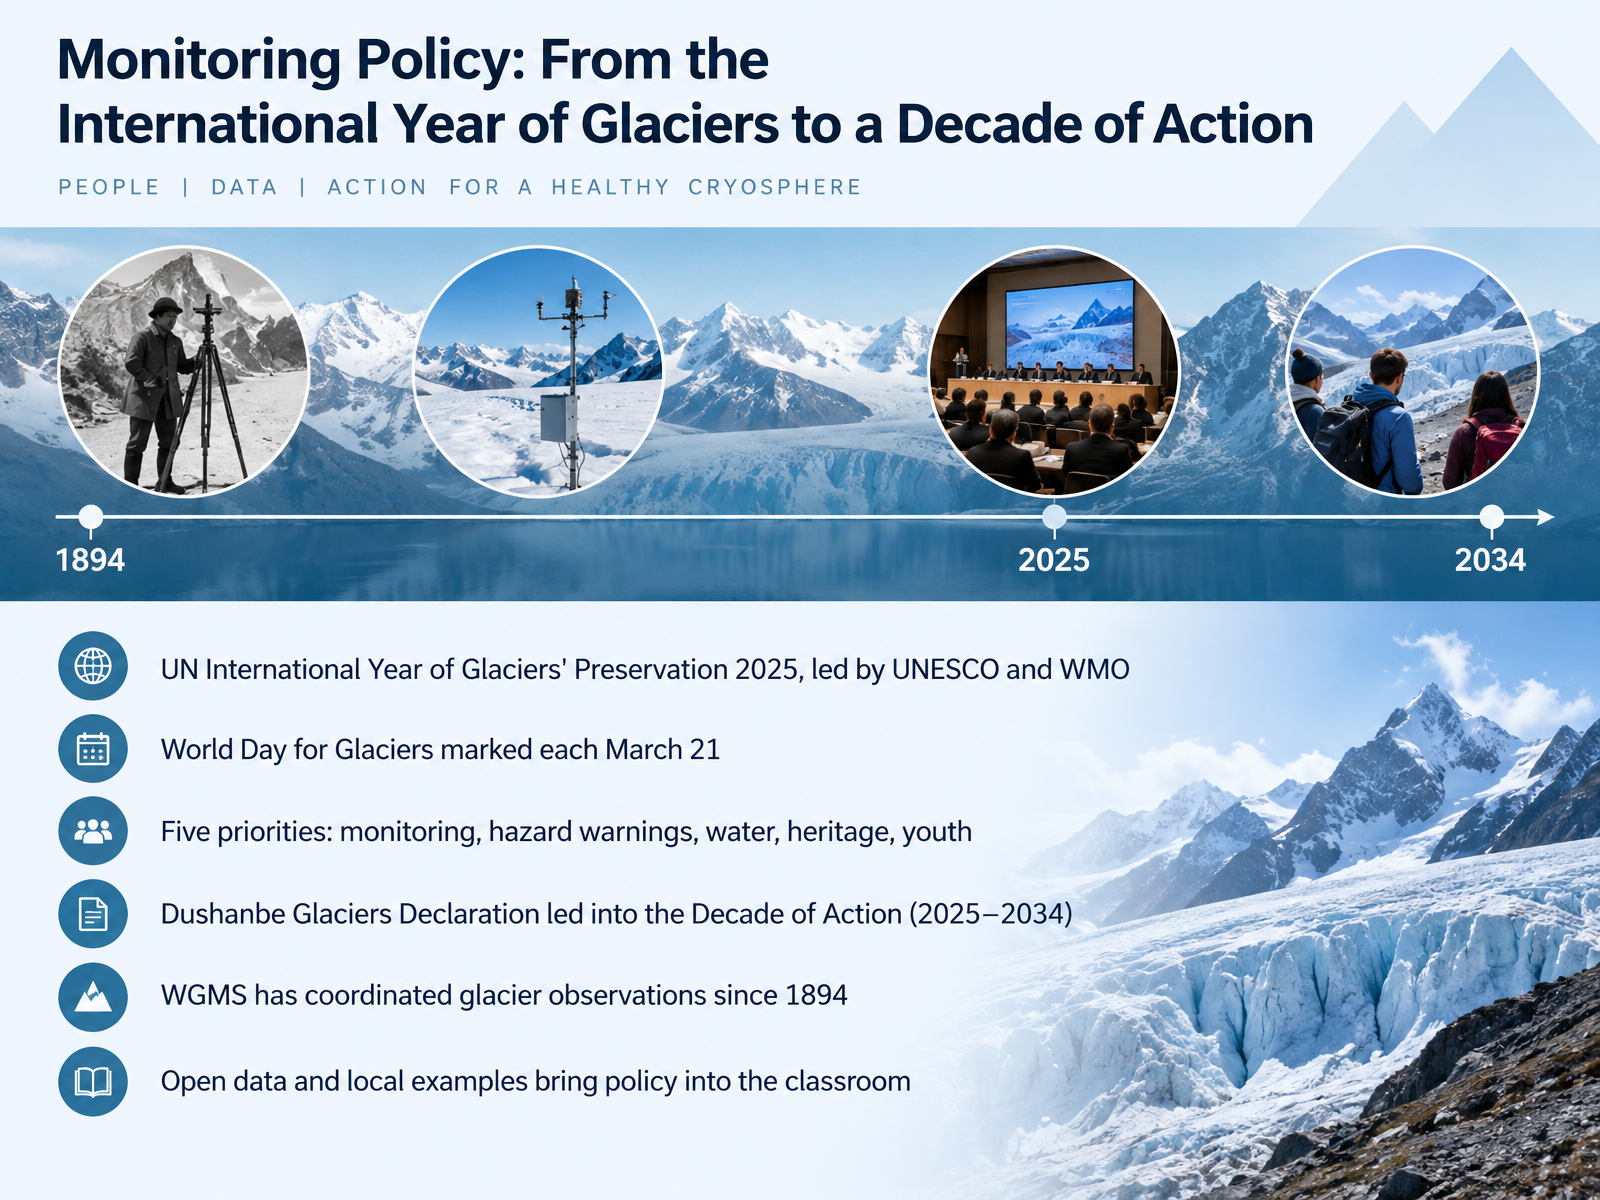
- 11Monitoring Policy: From the International Year of Glaciers to a Decade of ActionNow let's connect the science to policy. The United Nations declared 2025 the International Year of Glaciers' Preservation, led by UNESCO and the World Meteorological Organization. Each March 21 is now the World Day for Glaciers, a yearly reminder of ice's role in our water and climate. The year focused on five priorities: monitoring, hazard warnings, water, heritage, and youth. These priorities led to the Dushanbe Glaciers Declaration and opened the Decade of Action for Cryospheric Sciences, running from 2025 to 2034. Here is a number worth remembering. The World Glacier Monitoring Service has coordinated glacier observations since 1894. That is more than a century of shared records, and today open data and local examples bring this policy into your classroom. Ask your students which nearby river depends on mountain ice. Next, we will see how simple models make ice flow and erosion easy to teach.
 1 min
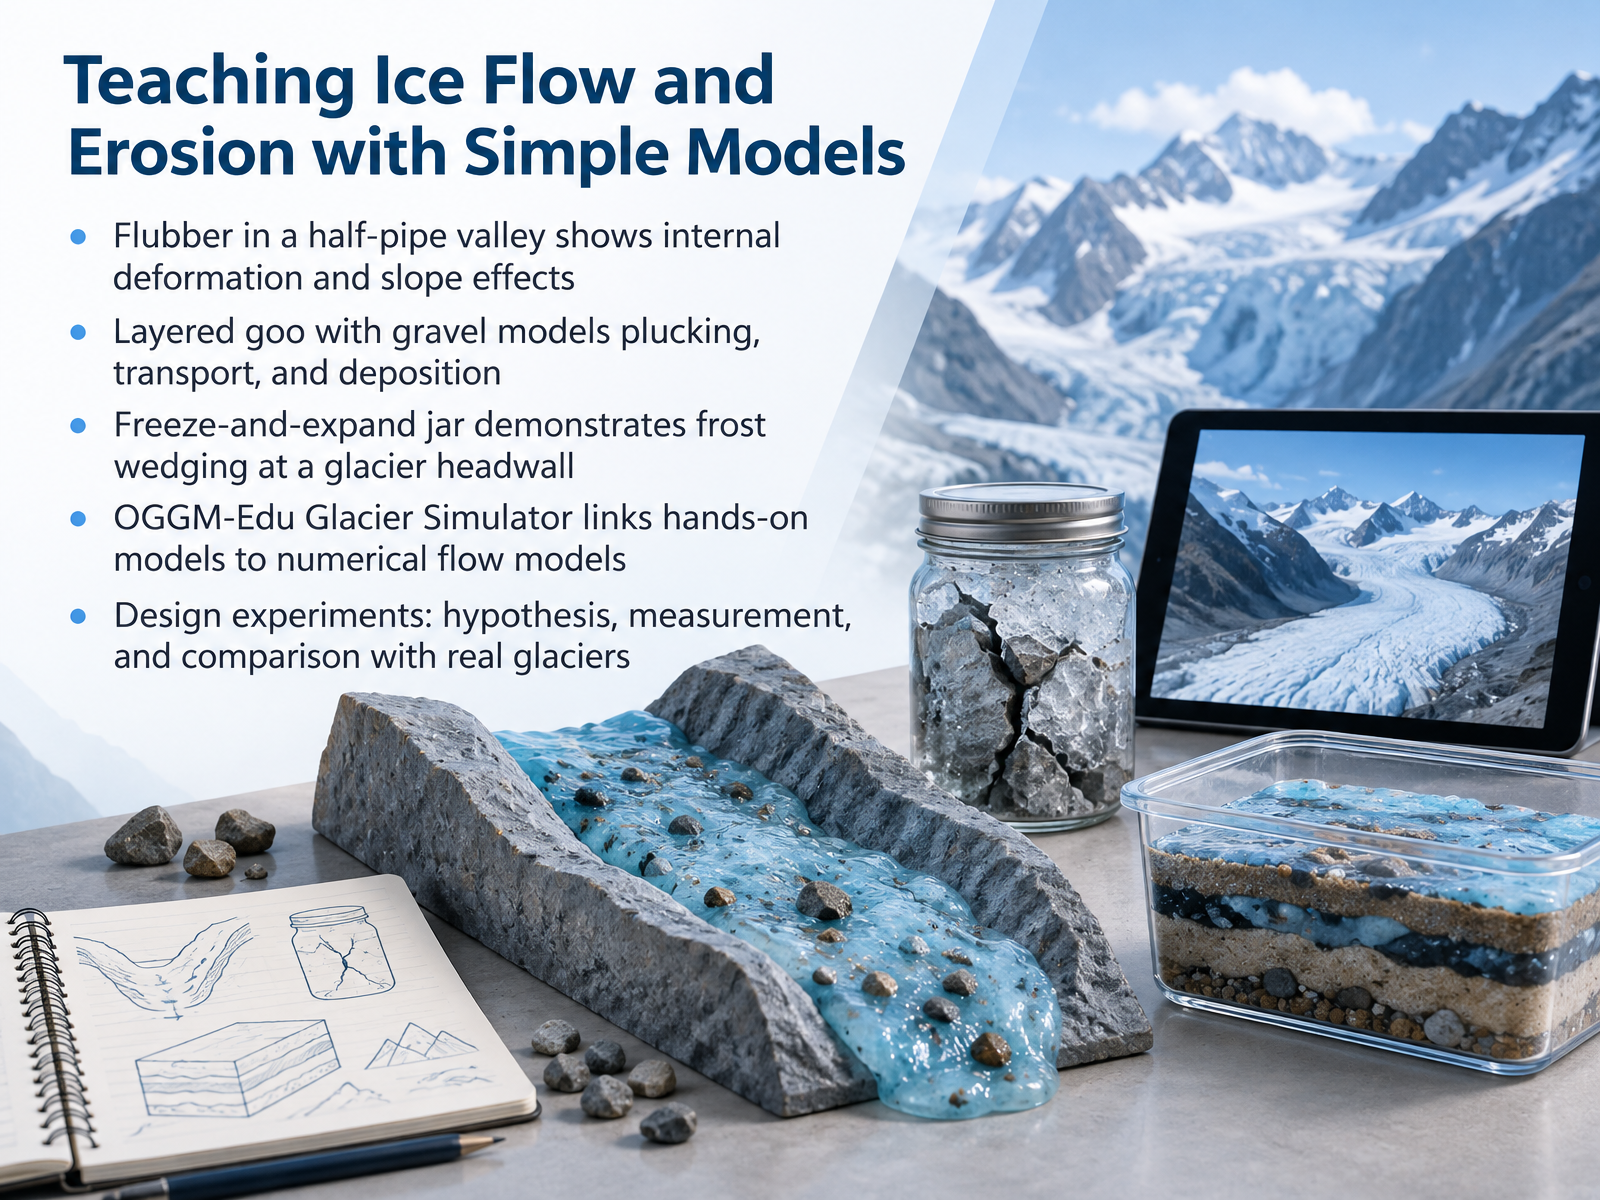
- 12Teaching Ice Flow and Erosion with Simple ModelsLet's look at how simple models can make ice flow and erosion visible. Start with a half-pipe valley and a piece of flubber. The flubber bends and spreads under its own weight, much like ice deforming inside a glacier. Tilt the valley more, and it flows faster, just as steeper glaciers move faster. Next, layer goo with gravel. As the goo creeps downhill, it plucks grains, carries them along, and drops them where it slows, giving you a model of erosion and deposition. A sealed jar filled with water and frozen shows frost wedging. The ice expands, cracks the jar, and echoes what happens at a glacier headwall. Then connect these hands-on tests to the OGGM-Edu Glacier Simulator, which models glacier flow numerically. Ask your students to design an experiment, state a hypothesis, measure flow or sediment, and compare results with real glaciers. Models are simplified, but they build the habits of careful observation. Reading Your Local Landscape: Field and Data Activities.
 2 min
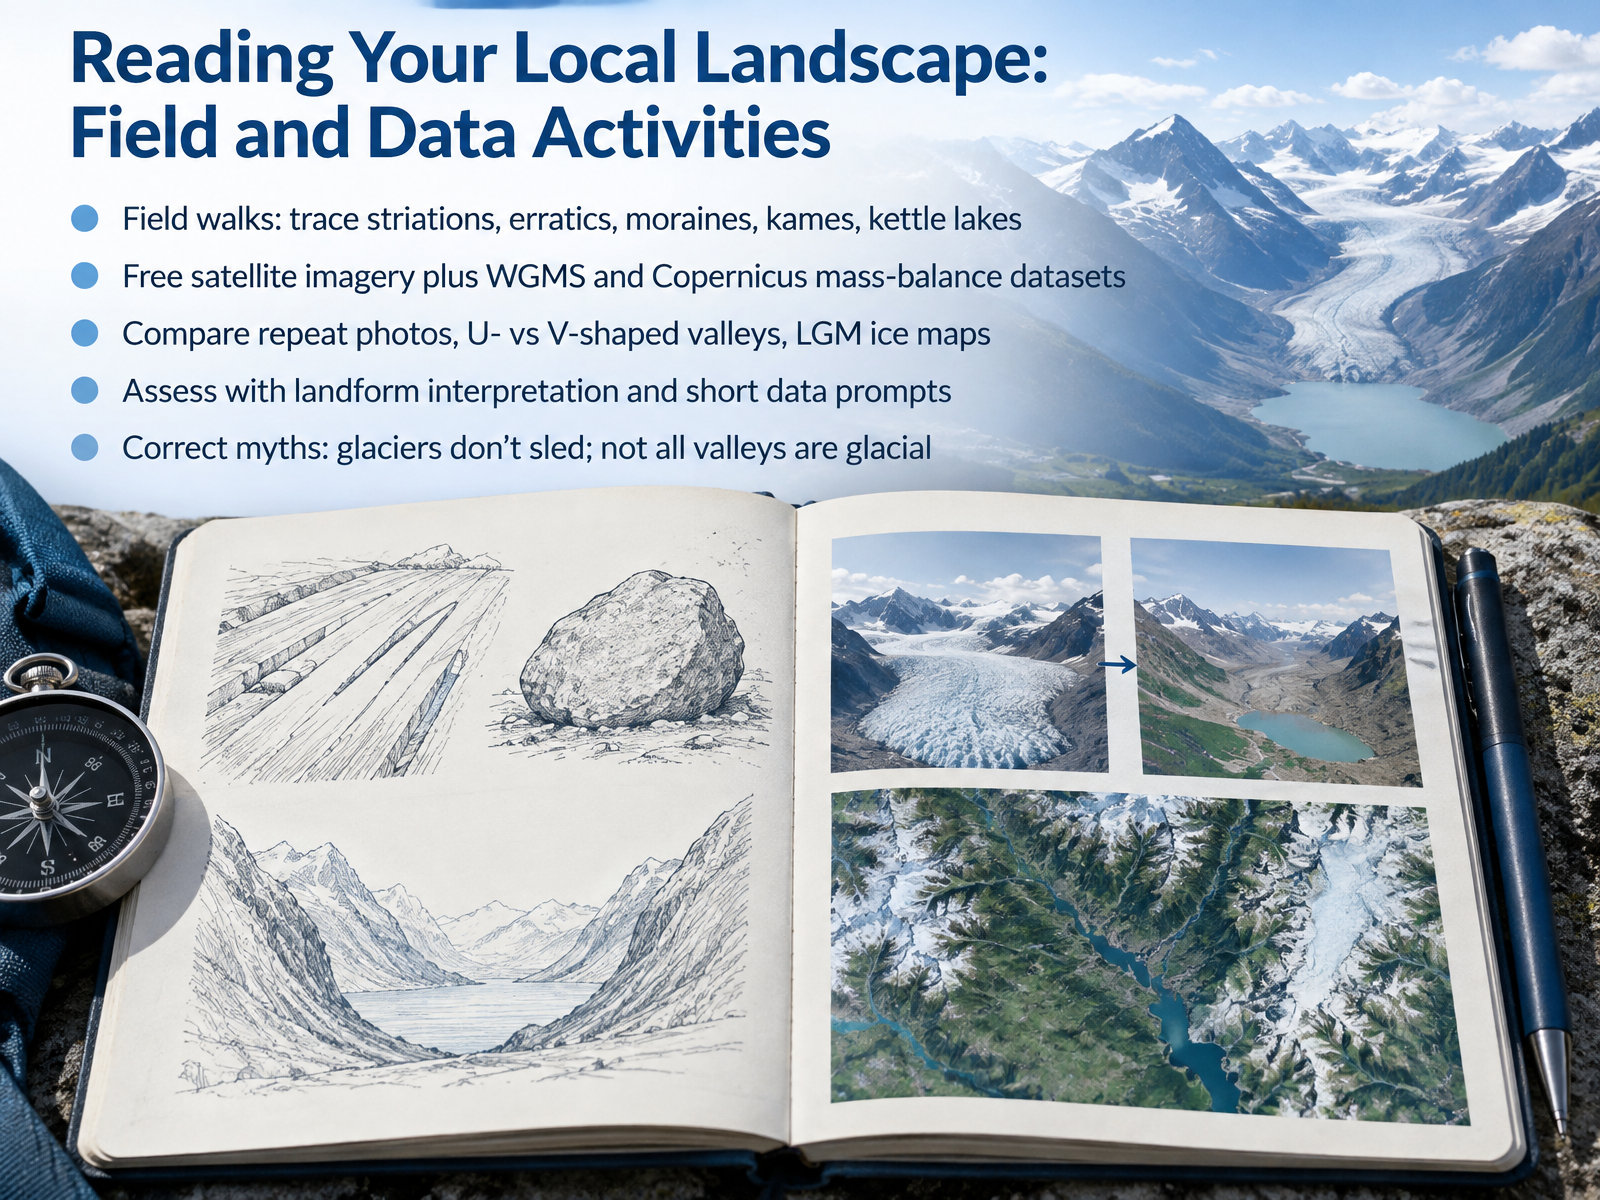
- 13Reading Your Local Landscape: Field and Data ActivitiesNow let's put this into practice by reading your local landscape. On a field walk, you can trace striations, the scratches ice left on bedrock. You can find erratics, boulders carried far from home. You can map moraines, kames, and kettle lakes, and ask what each one tells you about past ice. Free satellite imagery is available to everyone, and global mass balance data come from the World Glacier Monitoring Service and Copernicus. Use them to compare repeat photos, U-shaped versus V-shaped valleys, and ice maps of the Last Glacial Maximum. Assess your learning with landform interpretation and short data prompts. And correct two common myths. Glaciers do not sled downhill like a toboggan; they flow and deform internally. Not every valley is glacial. A narrow V-shaped valley usually points to a river. Next, we ask why these ice-shaped landscapes matter.
 essd.copernicus.orgusgs.govdoi.org+22 min
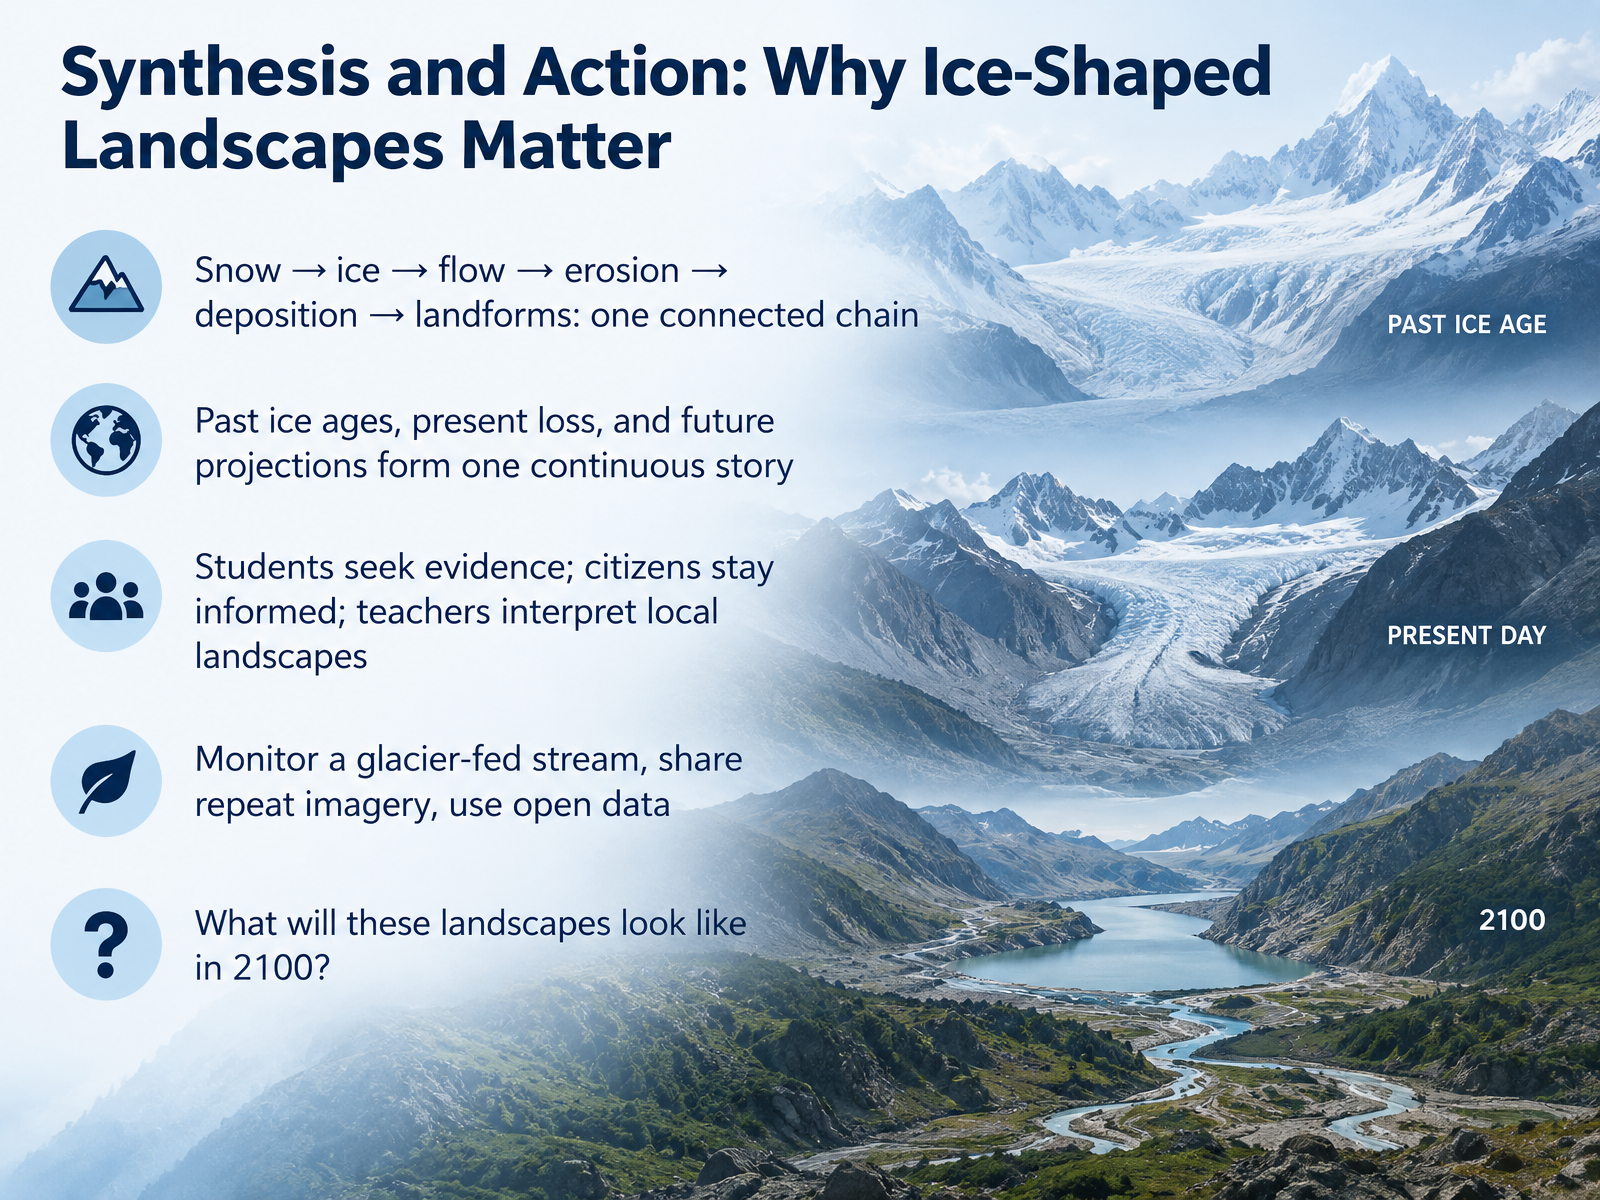
- 14Synthesis and Action: Why Ice-Shaped Landscapes MatterLet's bring everything together. Snow turns to ice, ice flows, flowing ice erodes and carries rock, and that rock is deposited as moraine, drumlin, or erratic. One connected chain, from a single snowflake to a whole landscape. And that chain does not stop in the past. Ice ages, today's shrinking glaciers, and future projections are one continuous story. As observers, you each have a role. Students, look for evidence in the field. Citizens, stay informed. Teachers, help others read their local landscape. Here is something practical you can do. Monitor a glacier-fed stream. Share repeat photographs from the same viewpoint. Use open data from glacier monitoring services. Now, a question to carry with you. What will these ice-shaped landscapes look like in twenty-one hundred? Your answer depends on what we do now. Thank you for learning with me. Keep observing, stay curious, and keep asking questions.
 2 min
Take the deck with you
Download this course as a file — free, no sign-up needed.
- PDF handoutEvery slide page, ready to print or share.15 pages · 5.8 MBDownload
- Narrated PowerPointThe deck that presents itself — every slide carries the digital human's narration video.15 pages · 15.8 MBDownload
- PowerPoint slidesThe full deck as a .pptx — open it in PowerPoint, Keynote, or Google Slides.15 pages · 5.8 MBDownload
Free to use in your own training — please keep the PersonWise credit page at the end.
Have your own deck? Turn it into a course
Sources consulted
Web sources consulted while building this course.
- Chapter 4: Observations: Cryosphere — ipcc.ch
- Annual mass-change estimates for the world's glaciers — doi.org
- https://user.geo.uzh.ch/mzemp/share/wgms/esa-glambie/material/GlaMBIE_Nature_manuscript_v2024-07-17_clean.pdf — user.geo.uzh.ch
- global glacier state — wgms.ch
- Cryosphere | Copernicus — climate.copernicus.eu
- ESSD - Annual mass change of the world's glaciers from 1976 to 2024 by temporal downscaling of satellite data with in situ observations — essd.copernicus.org
- Mass Balance Methods: Measuring Glacier Change — usgs.gov
- Global Evaluation of GRACE Mascon Products in Monitoring Glacier Mass Balance — doi.org
- A Novel Method Combining Remote Sensing Albedo and Differencing DEM to Estimate Annual Glacier Mass Balance — doi.org
- FS 3.199: Towards a second Glacier Mass Balance Intercomparison Exercise (GlaMBIE-II) – Glacier change observations for hydrological and sea-level rise assessments – #IMC: International Mountain Conference — imc2025.info
- Friction at the bed does not control fast glacier flow | Science — science.org
- What is glacier sliding? — arxiv.org
- Water pressure fluctuations control variability in sediment flux and slip dynamics beneath glaciers and ice streams | Communications Earth & Environment — nature.com
- On non-dimensional forms of basal sliding laws and flow laws for ice-sheet and glacier modelling — doi.org
- Glacier Surges Controlled by the Close Interplay Between Subglacial Friction and Drainage — doi.org
- In situ 10 Be modeling and terrain analysis constrain subglacial quarrying and abrasion rates at Sermeq Kujalleq (Jakobshavn Isbræ), Greenland — doi.org
- Glacial erosion rates of primary bedrock from in situ 14C-10Be measurements are low — doi.org
- GH - Rockwall erosion rate inferred from in situ 10Be concentration of supraglacial clasts: a review — gh.copernicus.org
- Subglacial abrasion rates at Goldbergkees, Hohe Tauern, Austria, determined from cosmogenic 10Be and 36Cl concentrations — doi.org
- Controls on glacial erosion rates revealed by cosmogenic nuclide measurements in southeastern Alaska | PNAS — pnas.org