
Social Media Marketing Analytics: Tool Selection & Workflow
Begin
14 pages · ~28 min
Social Media Marketing Analytics: Tool Selection & Workflow
Learn to select and design workflows for social media marketing analytics tools to measure performance effectively.
What you’ll learn
- 01Social Media Marketing Analytics Tools: Selection and Workflow DesignWelcome. If you are here, you already know that choosing a social analytics tool is not a feature comparison. It is a strategic decision that shapes your reporting cadence, your data architecture, and ultimately, how fast your team can move. Fragmented analytics create silos, inconsistent reports, and slow decisions. Today, we fix that. Our goal is a practical evaluation framework, a clear implementation workflow, and a plan to get your team up to speed. To frame the stakes: this market is heading toward nearly eleven billion dollars in twenty twenty-six, growing at over seventeen percent annually. And here is the trend that matters most for your stack: buyers are consolidating point tools into unified platforms. That means your next decision is likely about architecture, not just dashboards. Let's build your selection workflow, starting with where analytics fits in the broader social workflow.grandviewresearch.commordorintelligence.comfortunebusinessinsights.com+22 min
- 02Where Analytics Fits in the Social WorkflowLet’s situate analytics inside the workflow that actually produces your numbers. The standard loop is plan, publish, monitor, and then report. Where teams get into trouble is treating the last step as an afterthought rather than something the whole loop is built around. Here’s the friction point: native analytics like Instagram Insights and Meta Business Suite only cover one platform each, and most of those only keep ninety days of history. That’s fine for a single-channel check-in, but if you have to brief an executive or a client, you need a cross-platform rollup with exportable PDFs or spreadsheets. The biggest failure I see is buying a tool before you define your workflow. Vendors sell you dashboards, but a dashboard is not a reporting process. Map your steps first, then match the tool to the job. If you just need insights on one channel, native data is fine. But enterprise needs like benchmarking and historical depth push you into suites like Sprout Social or Metricool. Now let’s shift to the real distinction between native analytics and what enterprise requirements demand.
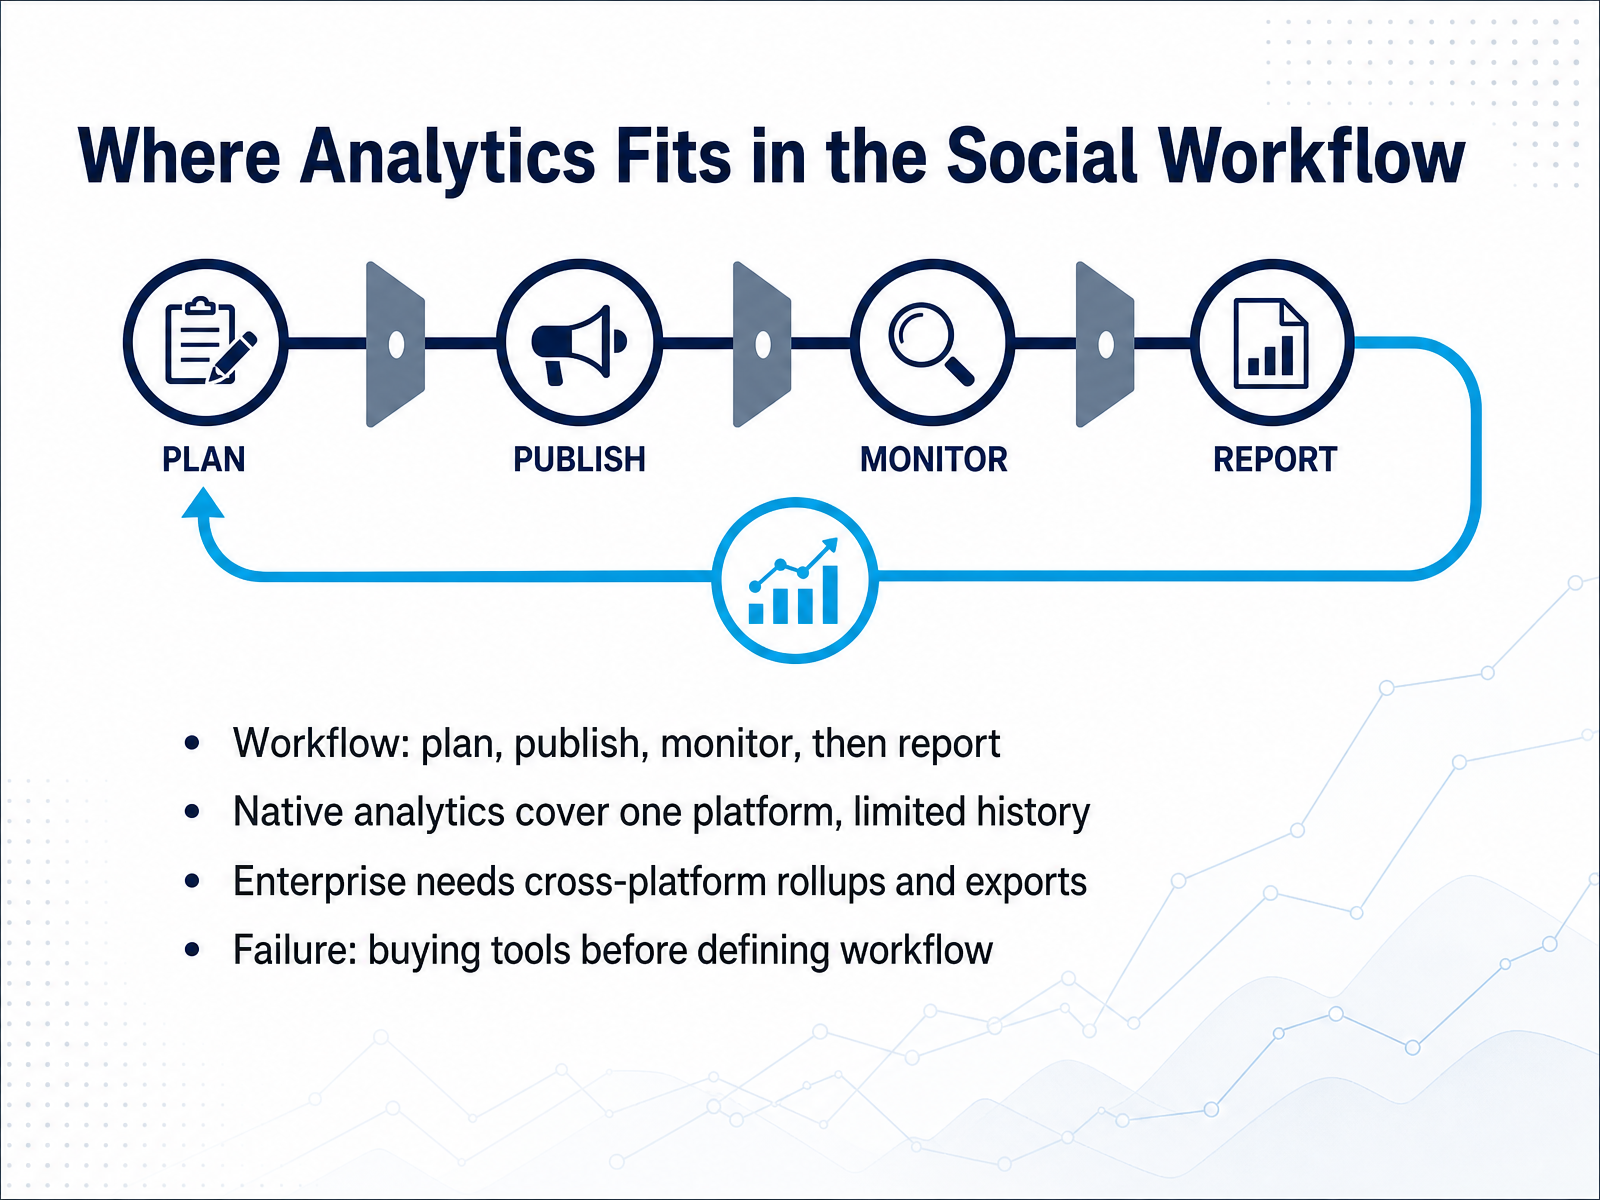 kompozy.ioimprovado.iorevuze.it+22 min
 - 03Native Analytics vs. Enterprise RequirementsLet's talk about the gap between native platform analytics and what your enterprise actually requires. Native tools like Meta Business Suite, TikTok Analytics, or LinkedIn Analytics are free, and the data is platform-accurate because it comes straight from the source. But they are single-channel, and most only give you about ninety days of history. That is a hard ceiling when you need year-over-year benchmarking. Once you scale, the requirements shift. You need a unified, cross-platform dashboard, role-based access for different teams, and consistent benchmarking across competitors. That means you need data exports, API connectors, and stable metric definitions. A small team can absolutely run on native tools. But the moment you report to multiple stakeholders or compare performance across channels, you need an enterprise platform to stitch it together. The actionable takeaway: if you are exporting screenshots to build a report, you have already outgrown native. Next, we will look at how to define your requirements before you evaluate vendors.
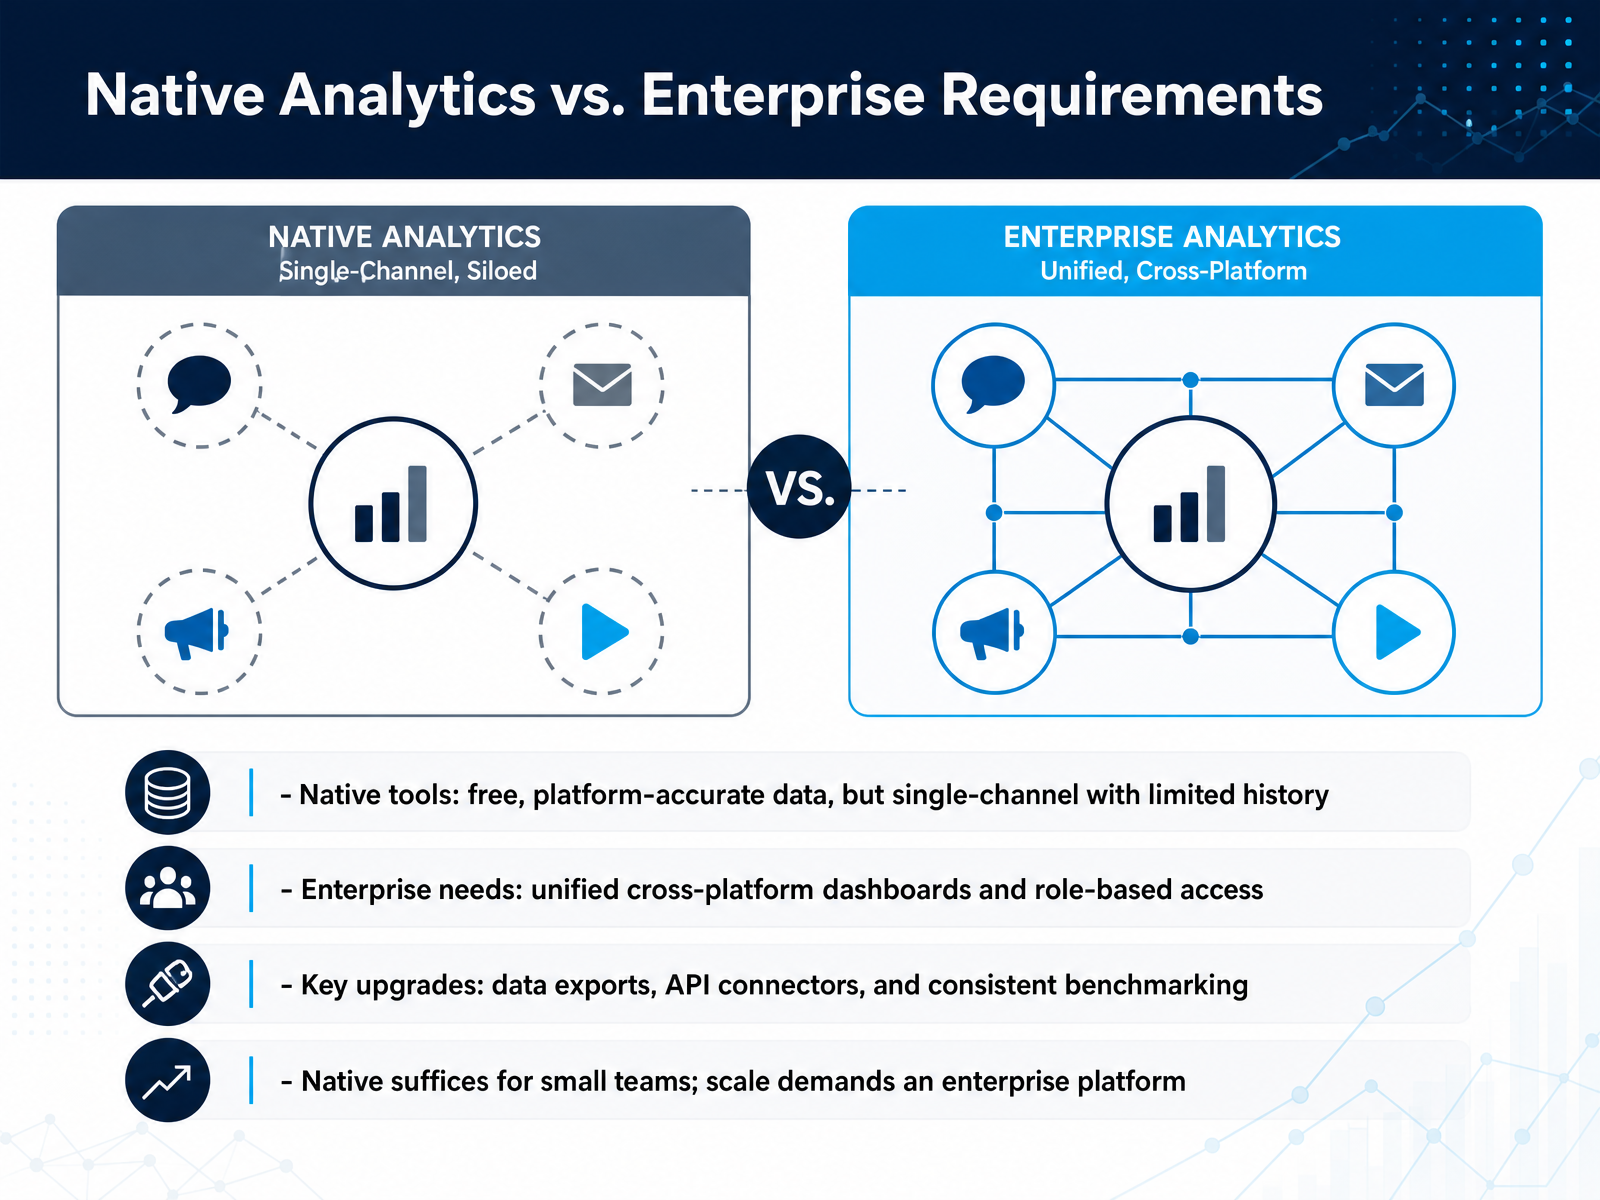 grandviewresearch.commordorintelligence.comfortunebusinessinsights.com+22 min
 - 04Defining Requirements Before Evaluating VendorsBefore you sit through another demo, lock down your requirements. Start by mapping must-haves and nice-to-haves to specific user roles. Your analysts need per-post export and API access; your approvers need audit trails and role-based permissions. If a feature doesn't serve a named role, it's probably a distraction. Next, write a requirements brief. This prevents shiny-tool syndrome, where a polished interface overrides what you actually need. Organize the brief into four categories: data sources, collaboration, export and API, and governance. Under data sources, list every platform and account type you manage. For collaboration, specify approval chains and who can edit versus publish. Export and API covers CSV, scheduled reports, and programmatic pulls into your BI stack. Governance is where you document SSO, SCIM, and data residency needs. Finally, set evaluation weights before you see any vendor. Score each requirement zero, one, or two, and apply disqualifiers for security or contract terms you won't bend on. This way, the vendor adapts to your criteria, not the other way around. Next, we'll look at how different roles within your team use analytics differently.
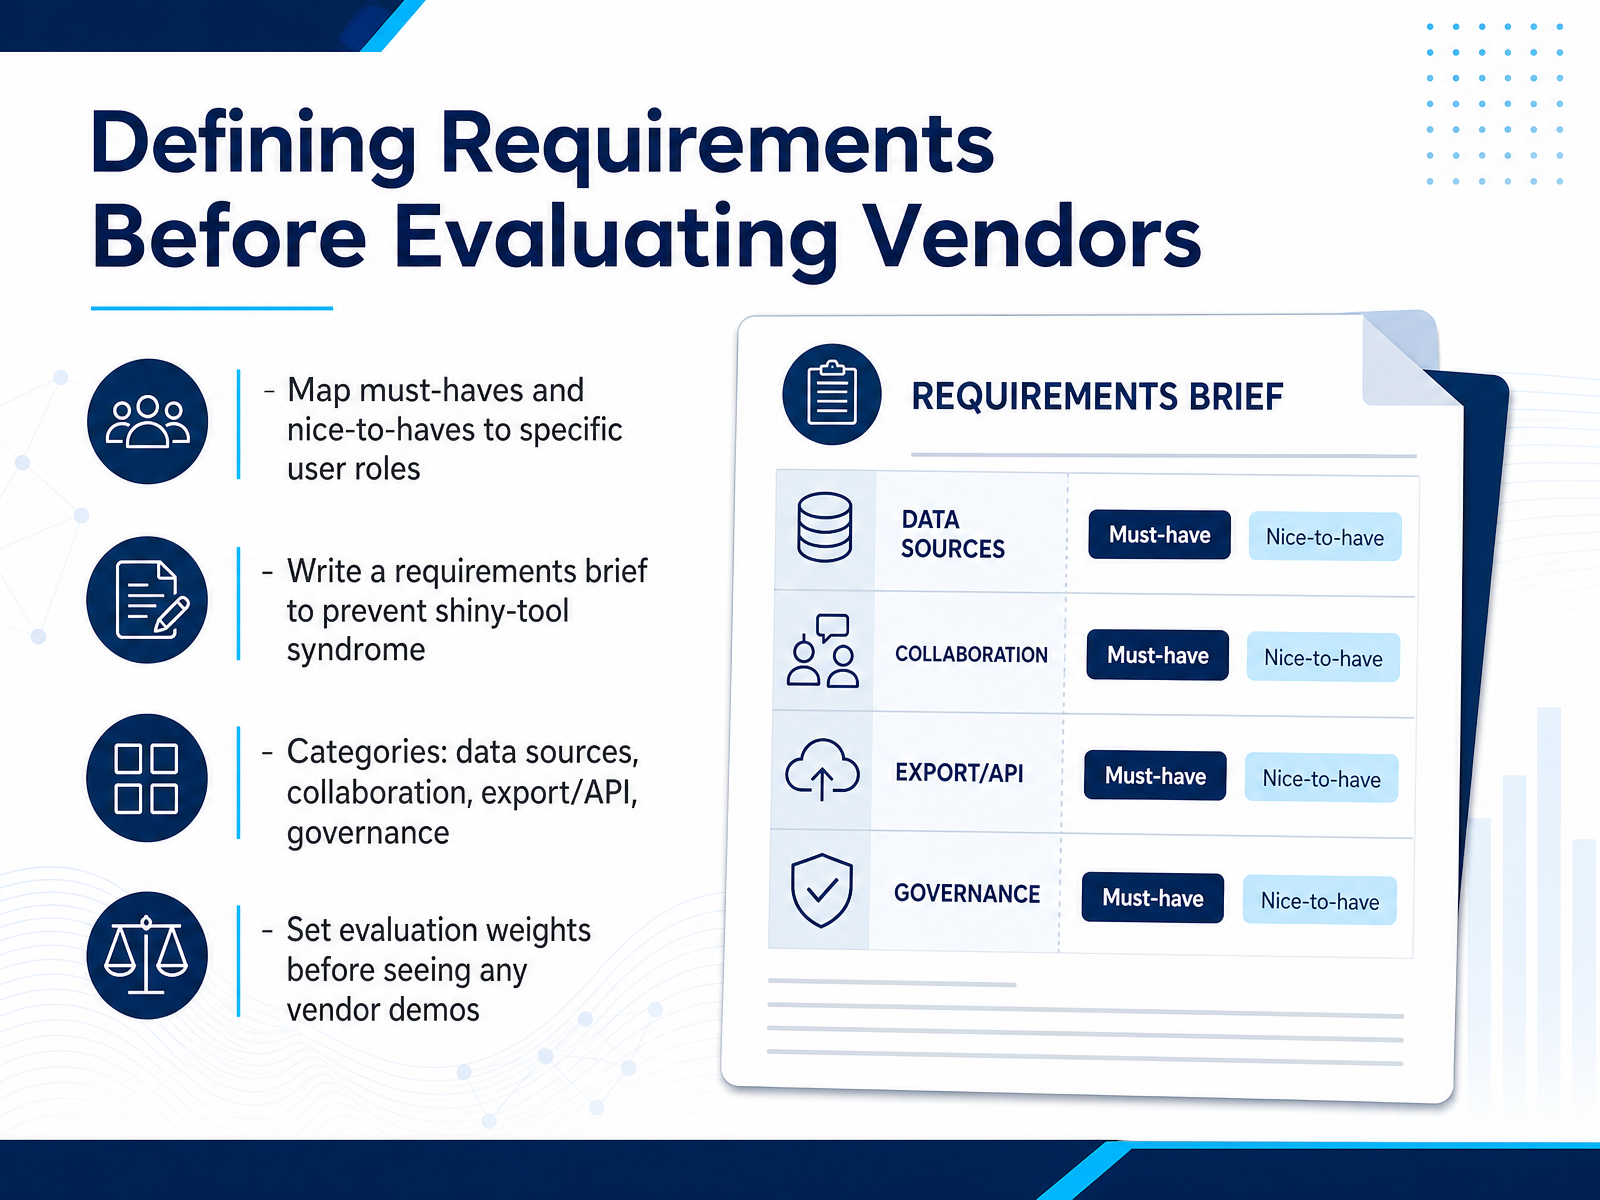 apaya.comemplifi.iosocialk.it+22 min
 - 05Role-Specific Analytics NeedsNow, let's talk about what analytics actually look like by role, because the platform you pick has to serve three different customers inside your organization. Social media managers live in publishing performance and engagement. Their daily loop is: post, measure, iterate. They need per-post metrics, content type comparisons, and engagement rate calculations that actually tell them whether the carousel beat the single image. If your analytics tool can't sort and filter posts by metric, your managers are scrolling a chronological feed and guessing. Growth marketers care about conversion paths, experiments, and channel mix. They want to know which social touchpoint influenced pipeline and revenue, not just impressions. The 2026 standard here is revenue attribution and multi-touch models, not last-click and not engagement. If your platform only reports clicks, you're missing the story. Ops analysts sit on the other side of the table. Their job is integration, governance, and cross-channel reporting. They'll ask whether data exports to the BI stack, whether the API is tenant-scoped, whether audit logs are tamper-resistant, and whether history retention survives a downgrade. So when you build your requirements list, ask each stakeholder which metric they wake up thinking about. That quickly reveals where the tool needs to go deep. Next, let's look at how to turn these competing needs into a structured evaluation framework.
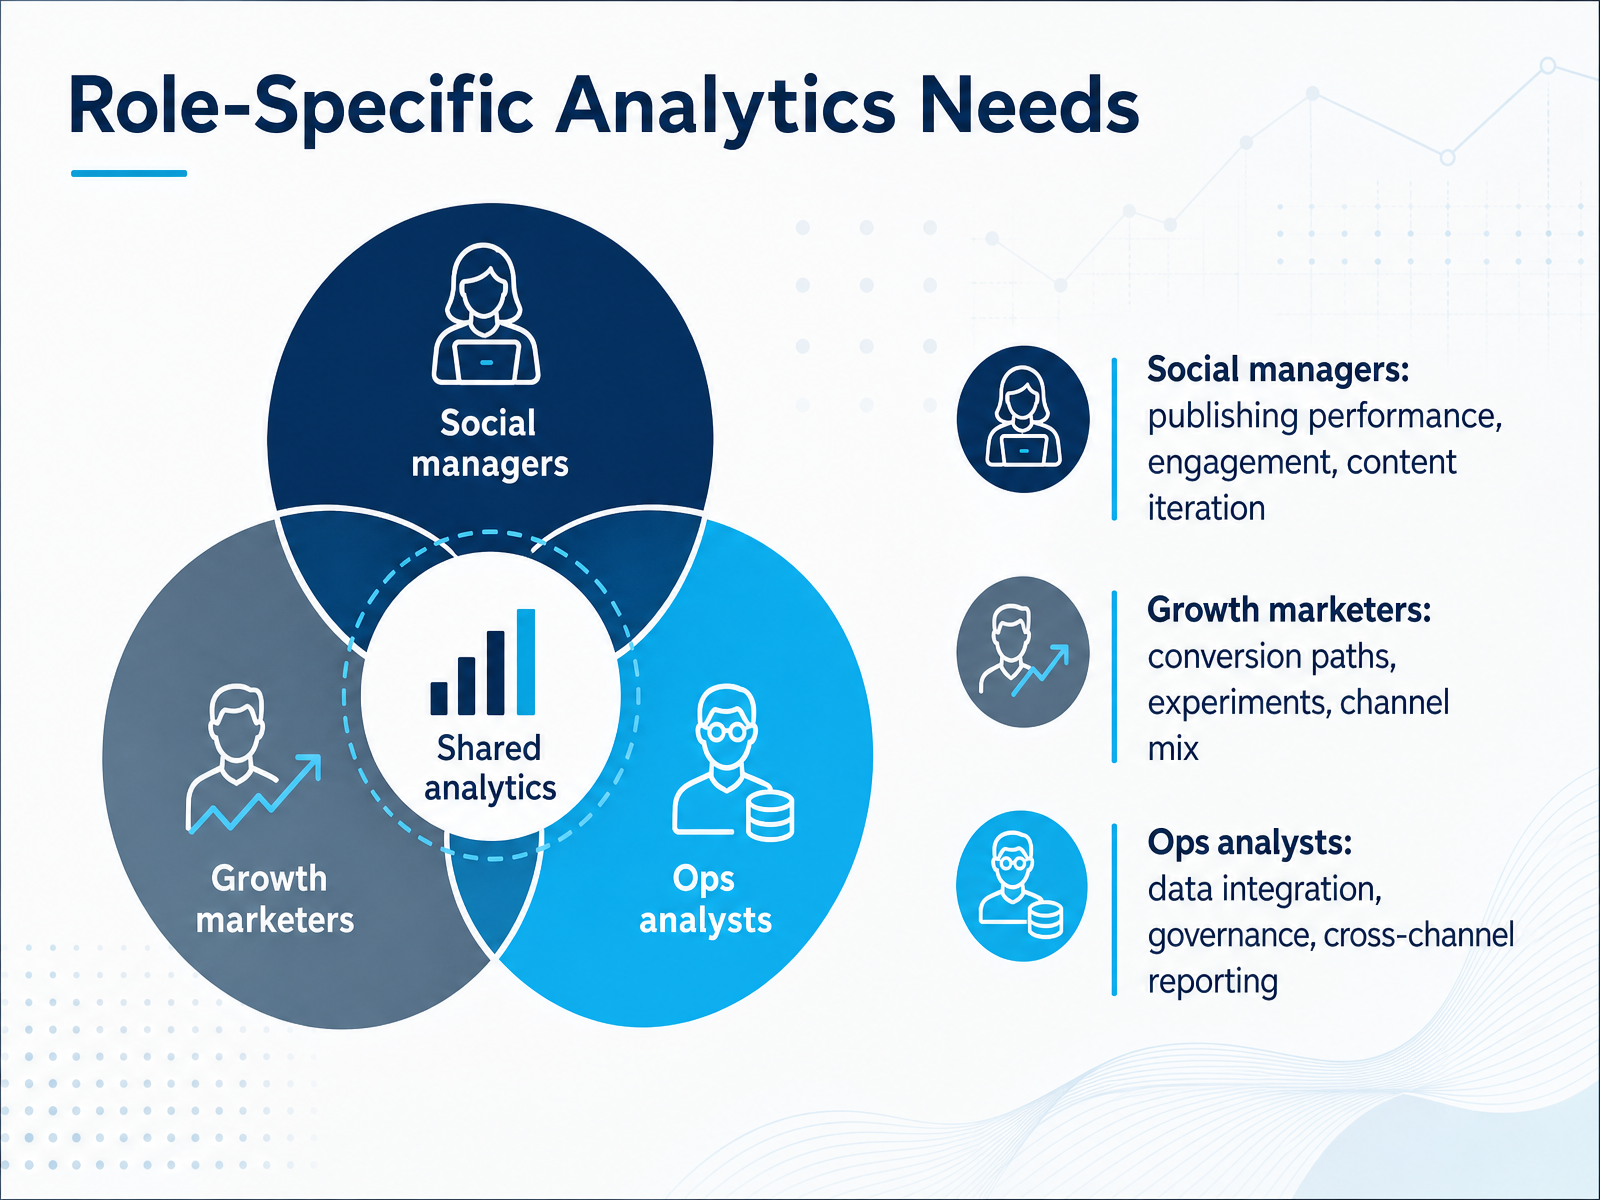 apaya.comemplifi.iosocialk.it+22 min
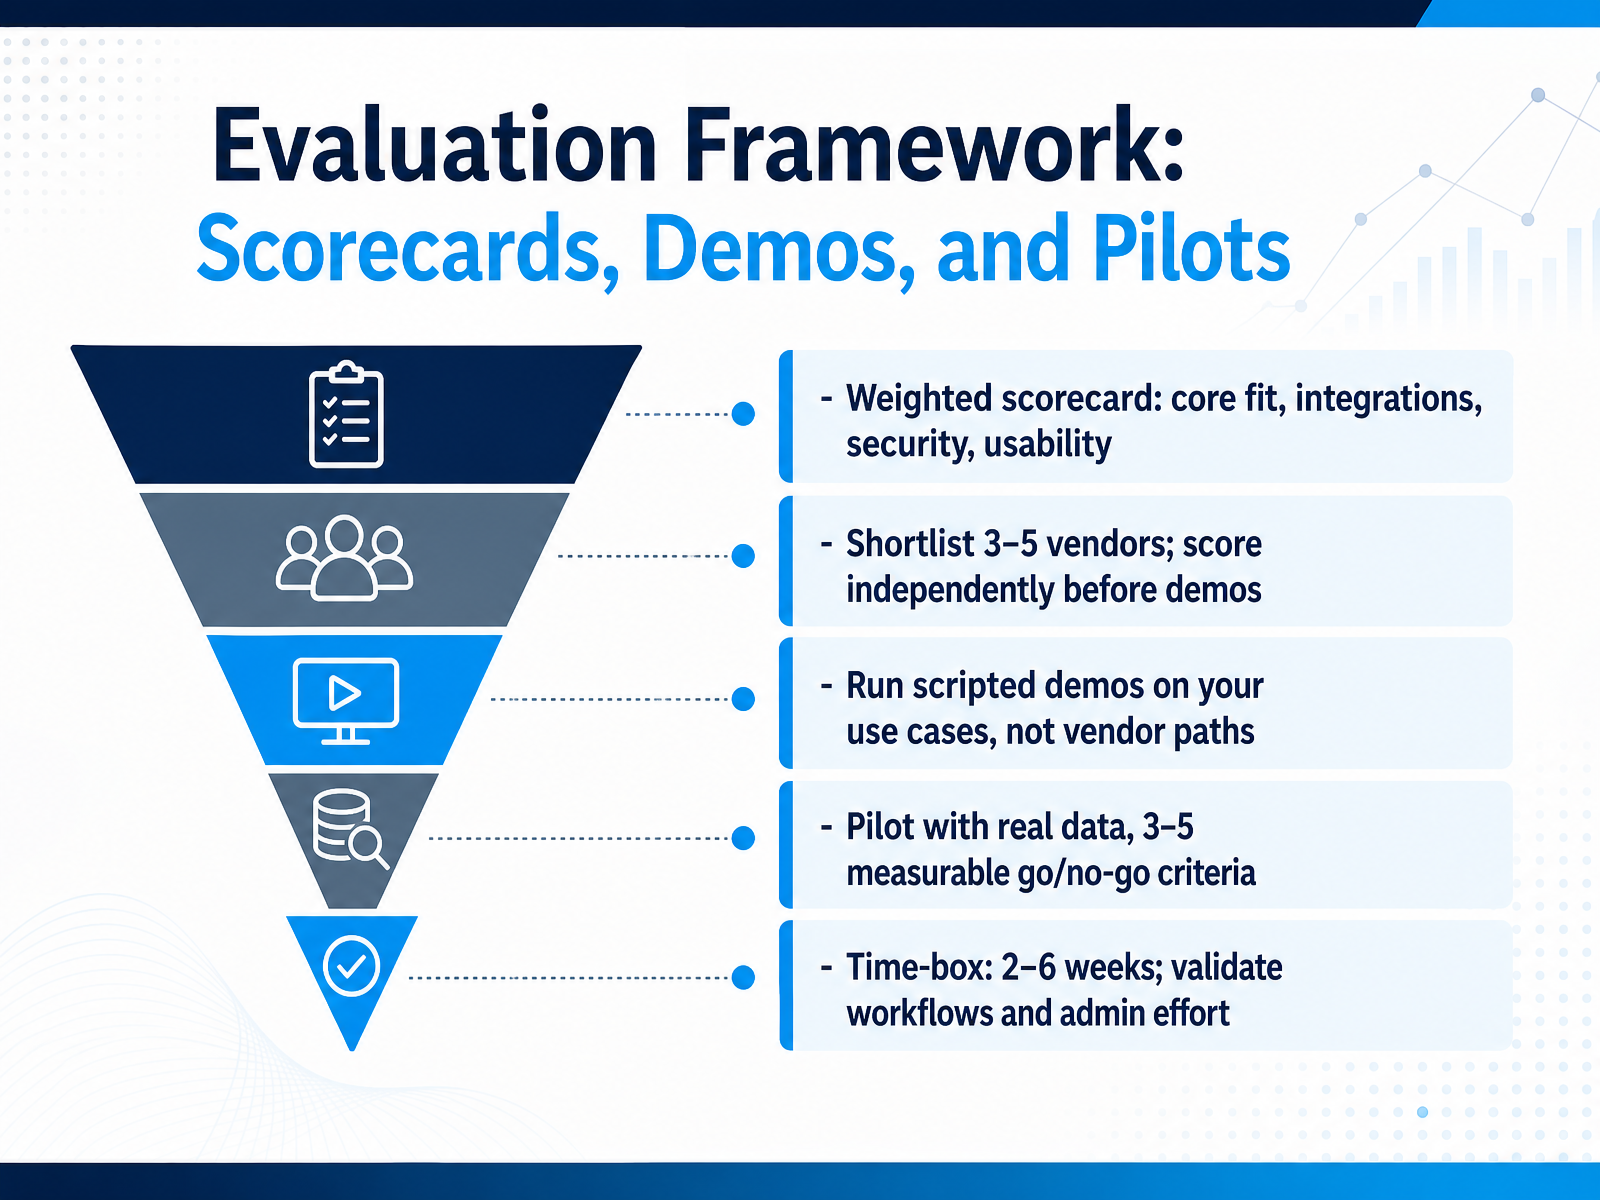
 - 06Evaluation Framework: Scorecards, Demos, and PilotsLet’s talk about how to actually evaluate these tools—scorecards, demos, and pilots. First, build a weighted scorecard. Start with core fit for your use cases, then integrations, security, and usability. Give each a weight that reflects your priorities, like forty percent for core fit and twenty for integrations. Don’t rank everything equally. Next, shortlist three to five vendors and score them independently before any demo. This keeps anchoring bias out and forces a real comparison. When it comes to demos, script them around your use cases, not the vendor’s happy path. Hand them your export file, your naming conventions, your approval flow, and watch them struggle. That struggle is the data you need. Then run a pilot with real data. Pick three to five measurable go or no-go criteria before it starts—like time to pull a weekly report or error rates on syncing. Time-box it. Two to six weeks is realistic. Enough to validate workflows and admin effort, short enough to keep urgency. The key takeaway: a scorecard filters, but only a pilot proves it. Next, we’ll look at vendor categories and when consolidating makes sense.
 pedowitzgroup.comdatainnovation.iothe-brand-algorithm.com+22 min
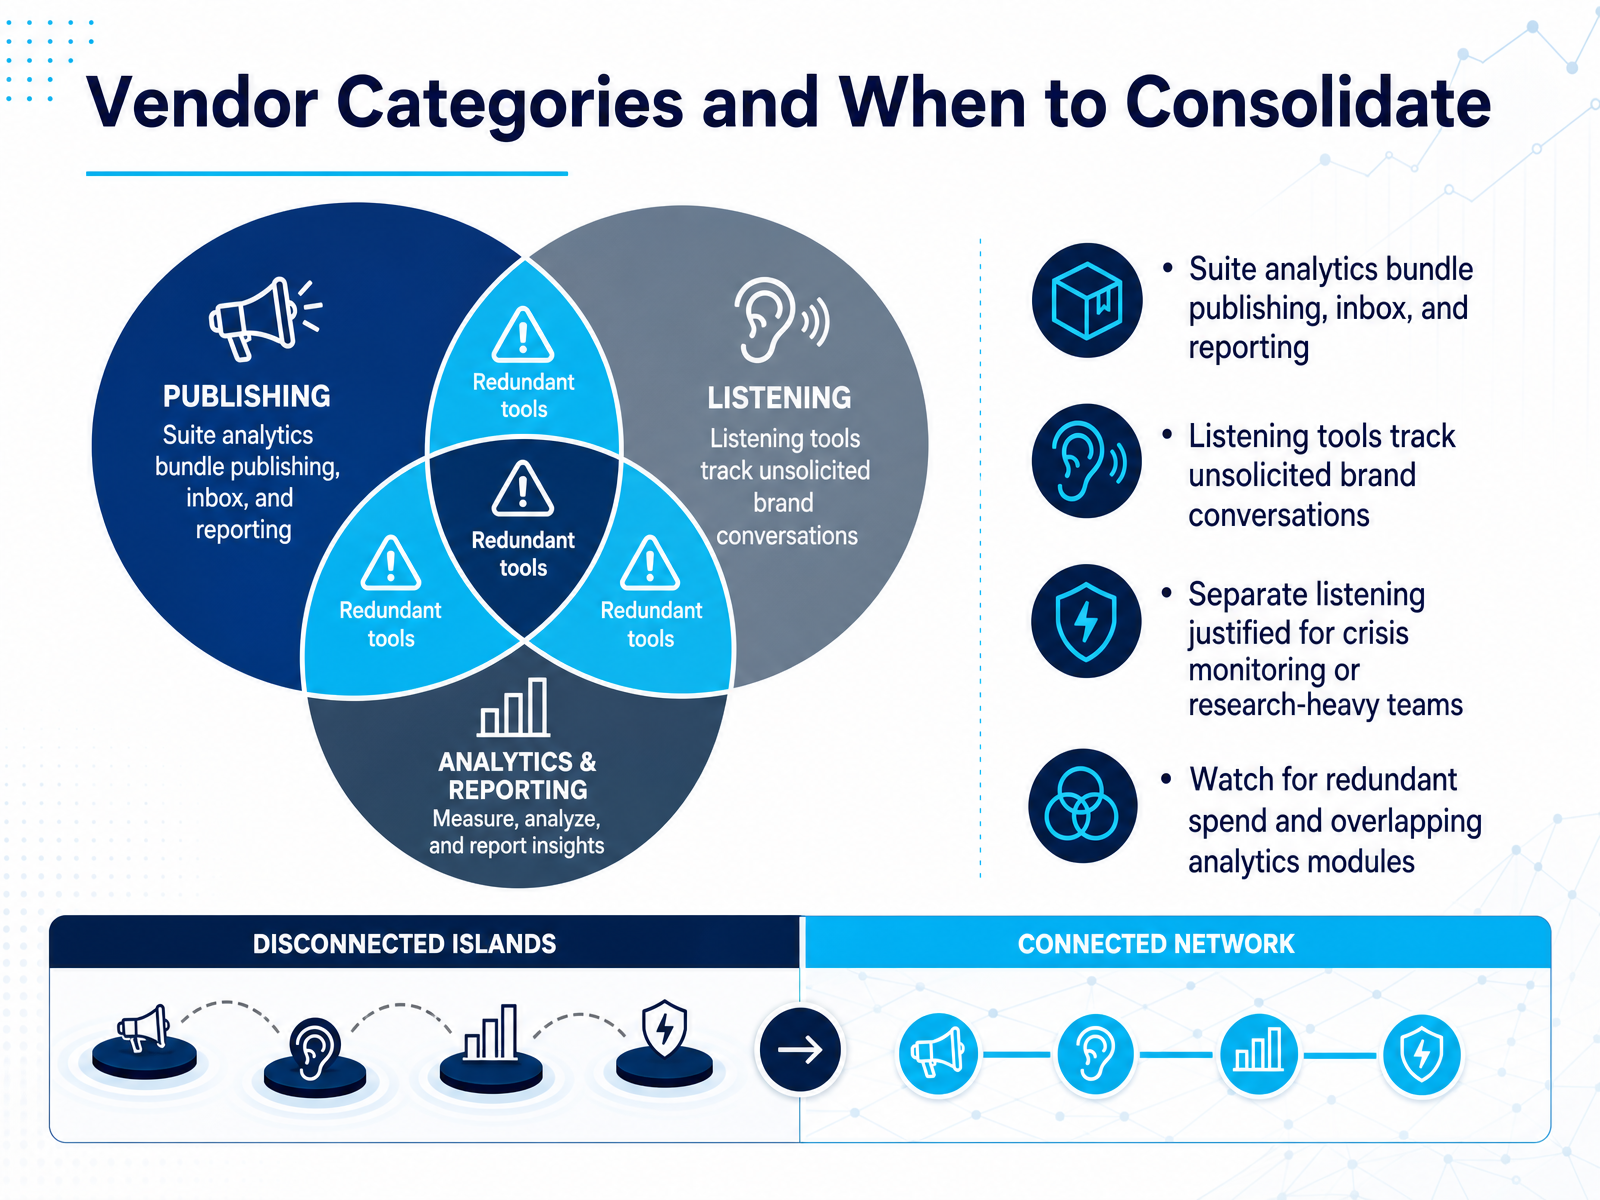
 - 07Vendor Categories and When to ConsolidateLet's talk about vendor categories, because that's where most tool-stack mistakes get made. There are really two broad families here. On one side, you have the suite platforms like Sprout Social, Hootsuite, or Agorapulse. These bundle publishing, inbox management, and analytics into one seat. On the other side, you have dedicated listening tools like Brandwatch, Talkwalker, or Sprinklr, built to track unsolicited brand conversations across forums, news, and review sites—not just your own posts. The trap is buying a suite that includes a light listening module, and then adding a fully separate enterprise listening tool on top of it. You end up paying twice for overlapping dashboards. A separate listening tool is only defensible when you're running crisis monitoring, or when your team is research-heavy and needs that deep consumer intelligence. But for most reporting cadences, one consolidated tool is enough. Here's your action item: before you renew this quarter, map which metrics you actually pull from each vendor. If two tools produce the same audience-sentiment chart, kill the pricier one. Now, let's move on to how to score enterprise fit before you sign anything.
 kompozy.ioimprovado.iorevuze.it+22 min
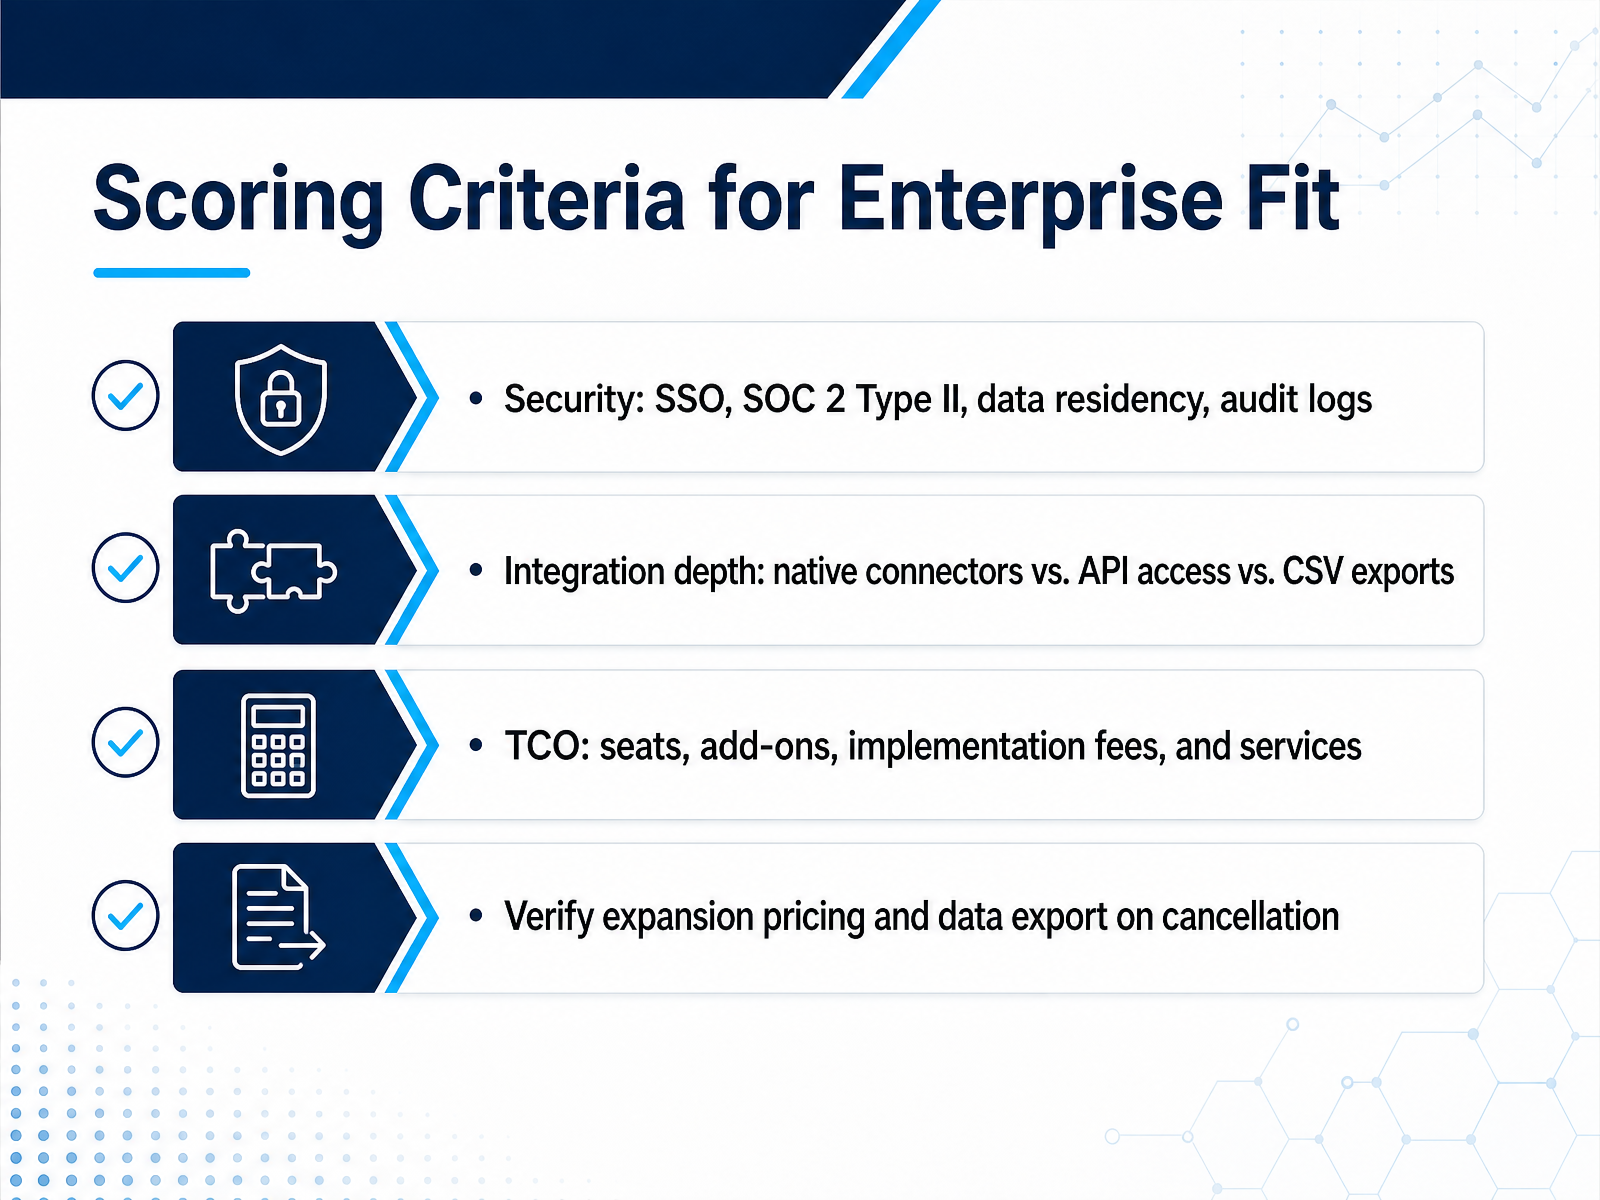
 - 08Scoring Criteria for Enterprise FitLet’s talk about what actually separates an enterprise-grade analytics tool from one that just looks good in a demo. You need four scoring criteria: security, integration depth, total cost of ownership, and exit terms. On security, verify SAML single sign-on, SOC 2 Type II, data residency options, and audit logs that are immutable. A spreadsheet export is not an audit log. Next, integration depth. Look for native connectors to your CRM and data warehouse, then API access, and only accept CSV exports as a floor. If your BI team has to rebuild the pipeline, that’s a hidden tax. For total cost of ownership, model seats, add-ons, implementation fees, and services over three years, not just year one. A per-seat model can look fine at five users and explode at fifty. Finally, verify expansion pricing now. Ask what adding a brand or channel costs after signature, and confirm you can export your full data in a usable format if you cancel. Paywalled exports are switching costs dressed up as a feature. Check these before you sign, because once you’re in the contract, you lose all leverage. This scorecard will carry directly into the next decision: platform coverage and data history verification.
 apaya.comemplifi.iosocialk.it+22 min
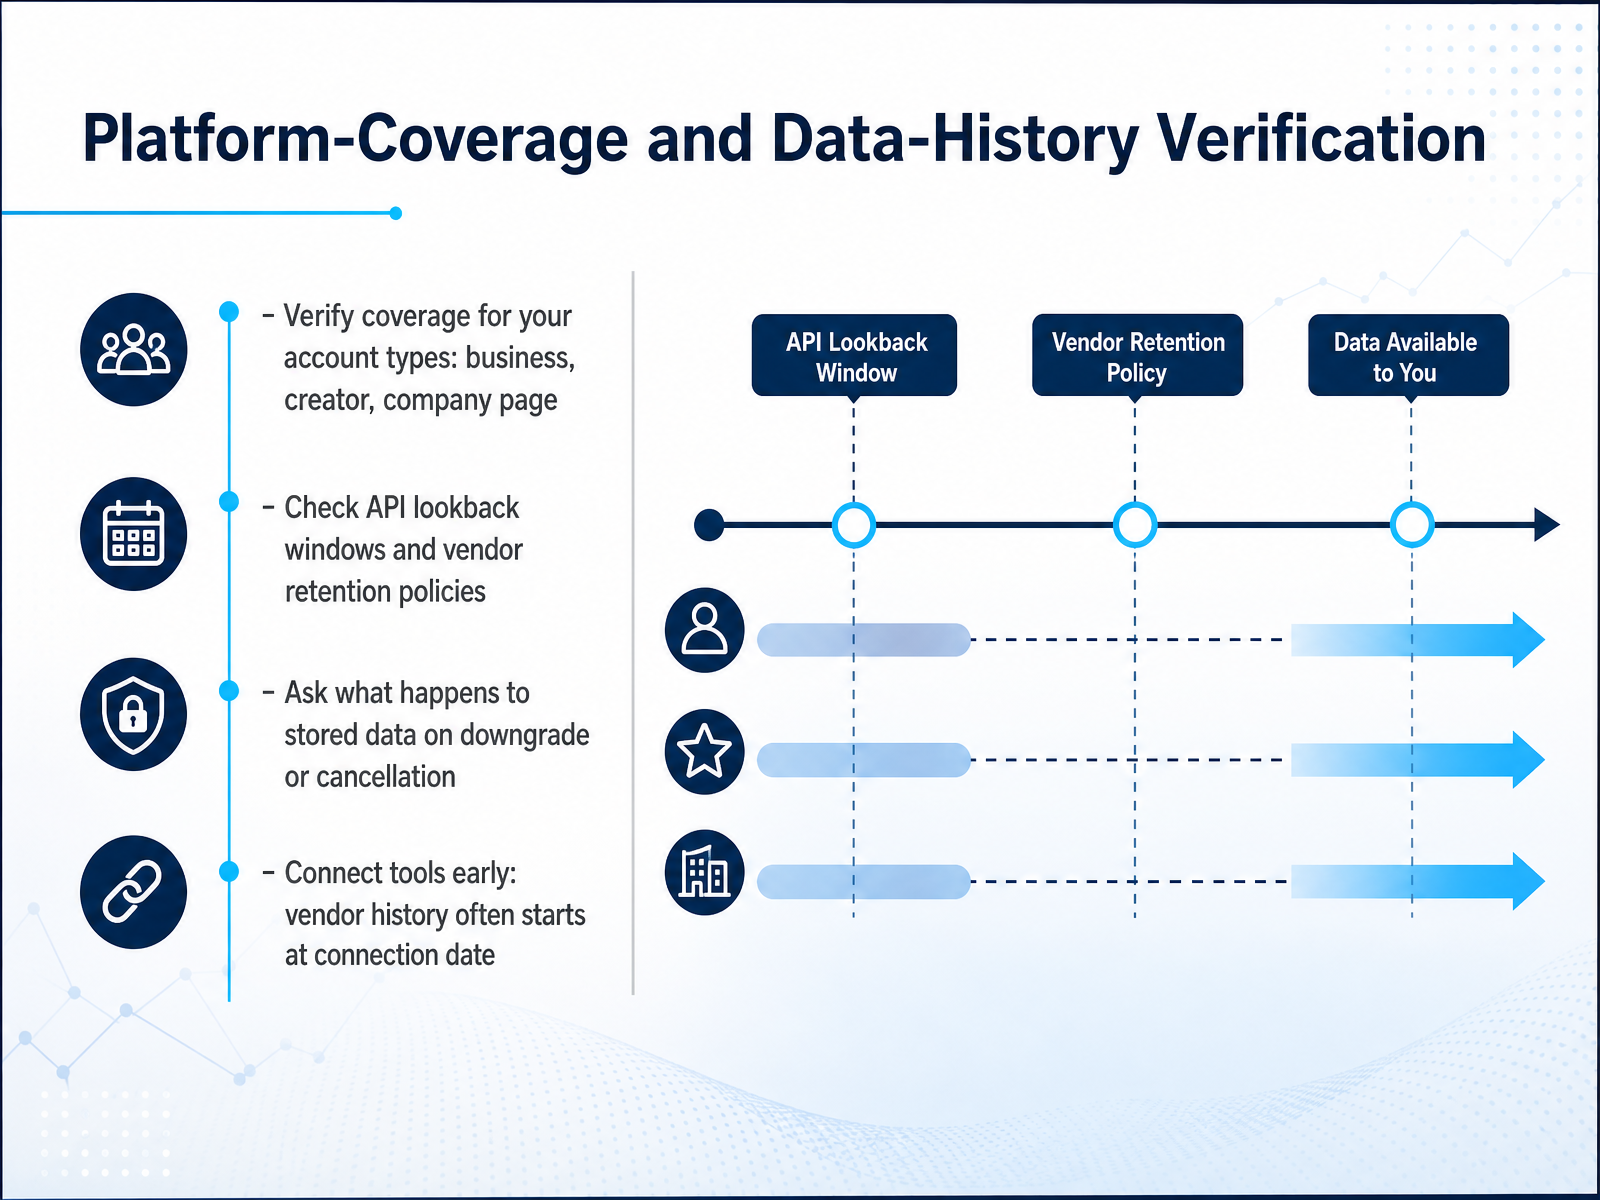
 - 09Platform-Coverage and Data-History VerificationLet’s talk about the operational due diligence that separates a great tool from a costly mistake. Start with platform coverage—and by that, I mean coverage for the exact account types you run. A vendor can say they support LinkedIn, but if they only offer company-page analytics and you manage creator accounts, the data is missing where you need it most. Verify this per platform, per account type, before you commit. Next, check API lookback windows and vendor retention policies. The raw platforms often only hand over ninety days. Some tools store that history indefinitely on paid plans; others cap it by tier. Ask specifically how far back your data goes the moment you connect, because for most vendors, the day you sign up is day zero. Year-over-year comparisons start a year later, not today. Also, ask what happens to your stored history if you downgrade or cancel. Is it exportable, frozen, or simply gone? If you need multi-year trends for a board deck, keep your own copy. Finally, connect a tool now. Even a modest one starts building your history immediately. Waiting for the perfect platform only delays your historical baseline. Verify coverage, retention, and cancellation terms before signing, and your future reporting will thank you.
 apaya.comemplifi.iosocialk.it+22 min
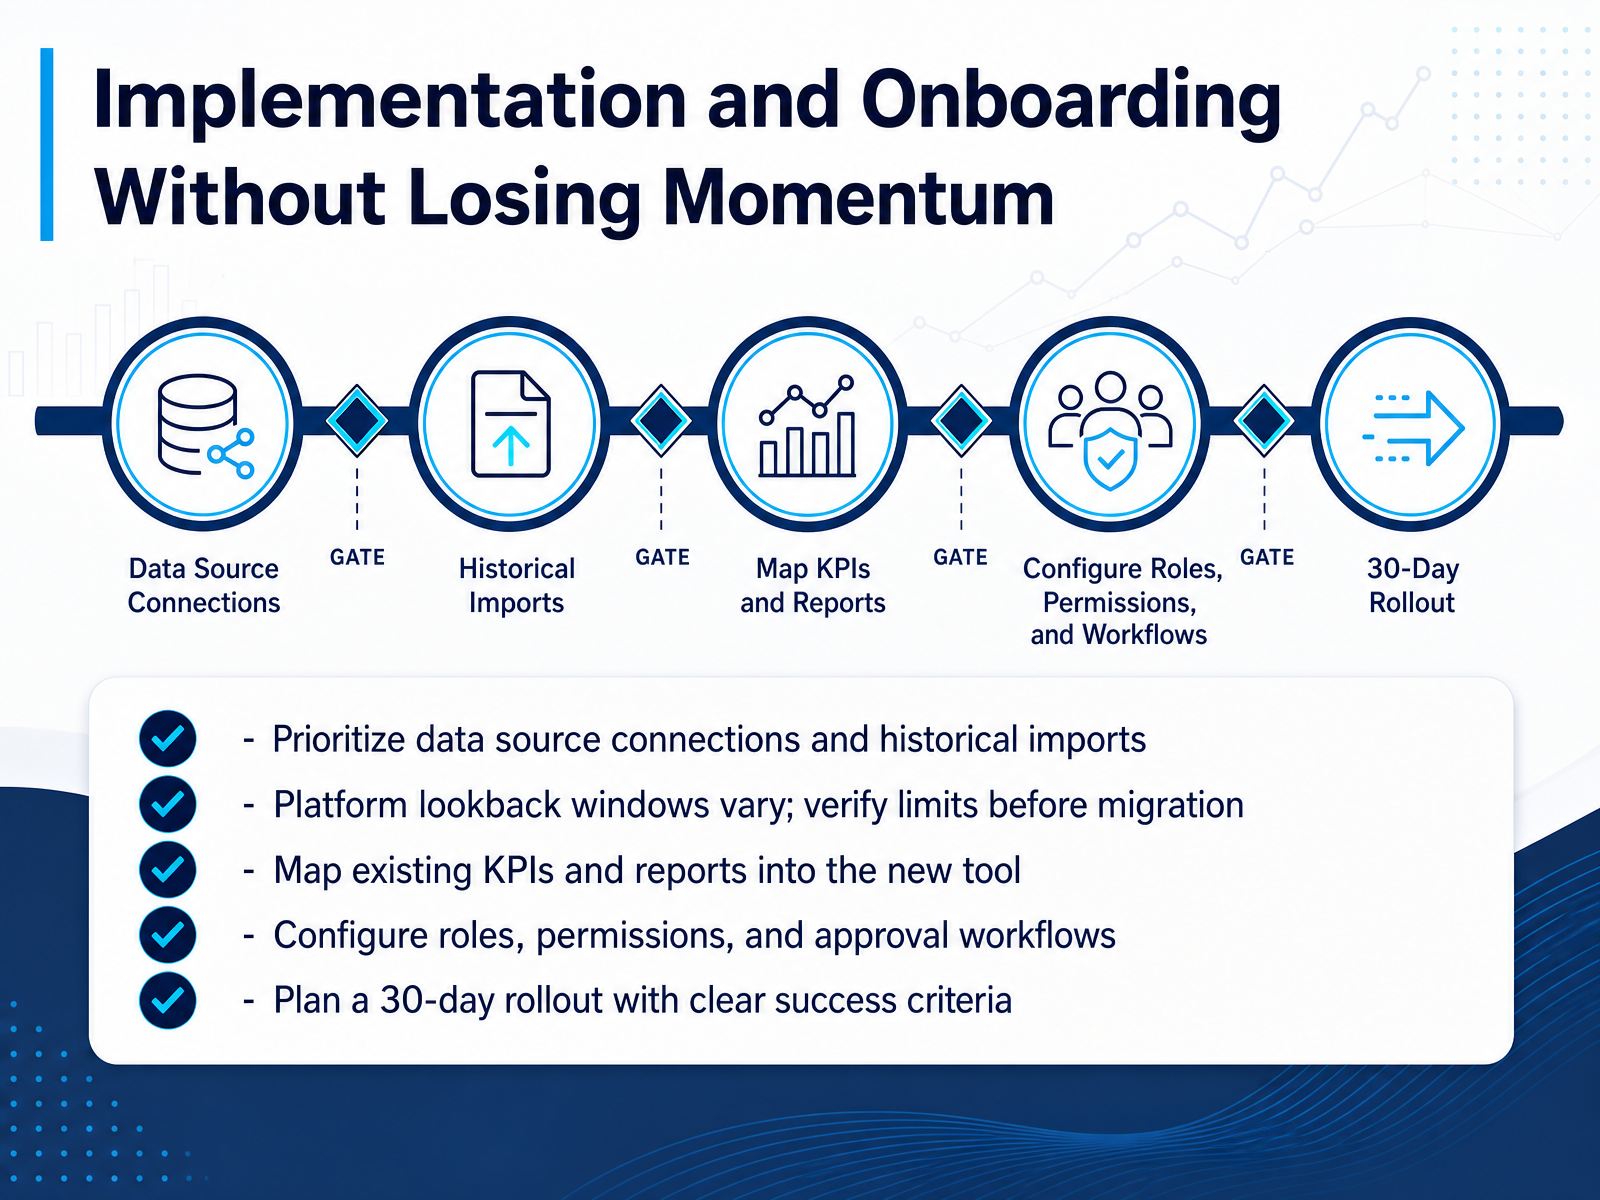
 - 10Implementation and Onboarding Without Losing MomentumNow let's talk about the part that actually makes or breaks a new analytics tool: implementation and onboarding. If you don't protect your momentum here, the tool becomes shelfware. First, prioritize data source connections and historical imports. Get your core platforms connected on day one so the tool starts accumulating history immediately. Platform lookback windows vary, and they change, so verify limits before you migrate. Don't trust a vendor summary; check each network's API directly. Then map your existing KPIs and reports into the new tool before you cut over. If your leadership team expects a certain weekly report format, replicate it in the new system first. Configure roles, permissions, and approval workflows next. This is where governance lives. Set up who can see what and who approves what before you invite the whole team. Finally, plan a thirty-day rollout with clear success criteria. Define what good looks like at week one, two, and four. A structured pilot with three representative accounts and a volume target will tell you more than any demo ever could. When you hit day thirty, you'll have a decision, not a debate. Next, let's talk about designing reliable reporting workflows.
 apaya.comemplifi.iosocialk.it+21 min
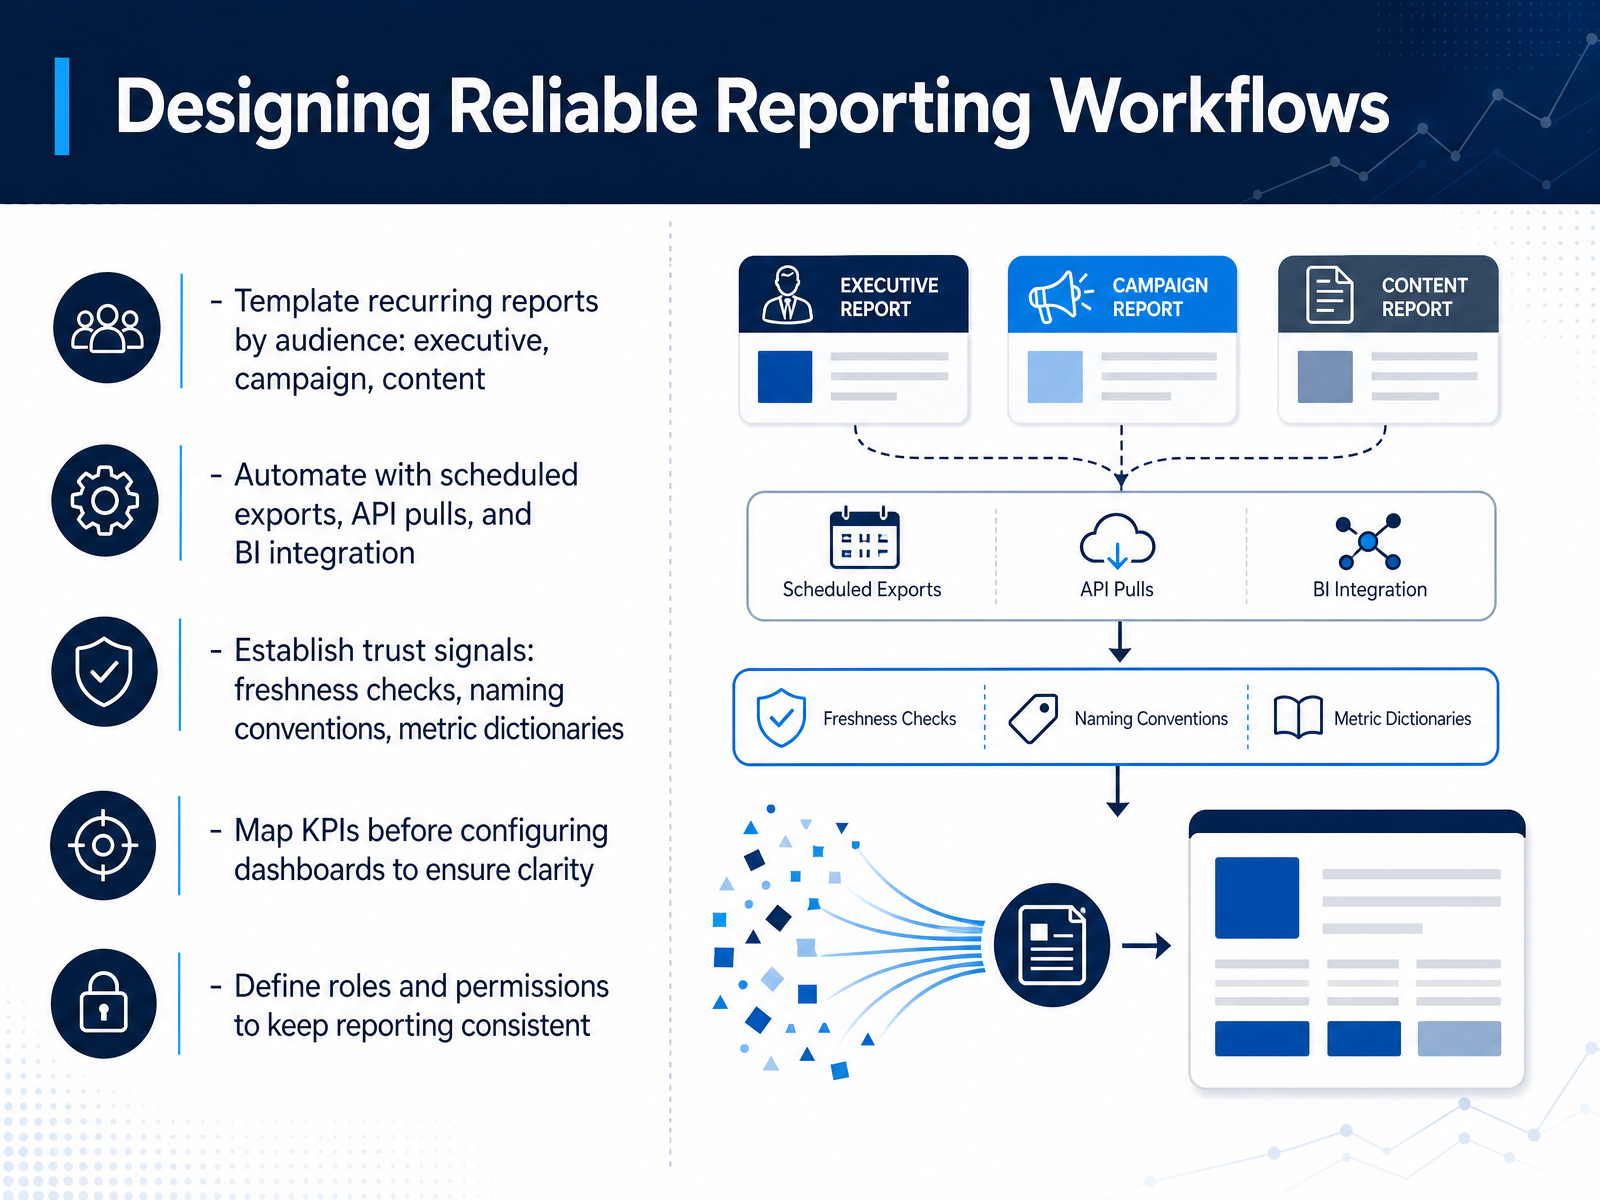
 - 11Designing Reliable Reporting WorkflowsSo now that you've selected your tool, the real work starts: making your reporting pipeline reliable. First, template your recurring reports by audience. Executives want trend lines and ROI. Campaign teams need tactical performance. Content teams need post-level breakdowns. One dashboard won't serve all three. Next, automate everything you can. Scheduled exports, API pulls, and direct BI integration mean your data flows without manual downloads. But automation only works if people trust it. Add freshness checks, enforce naming conventions, and build a metric dictionary. That way, when your executive report says engagement rate, everyone knows exactly what it means. Before you configure a single dashboard, map your KPIs to each question the business is asking. If you don't, you'll end up building charts you never read. Finally, lock down roles and permissions. Who can edit reports? Who only views? Consistency comes from controlled access. Get these four pieces right, and your reporting cadence becomes the backbone of decision-making. That's what we'll tackle next as we connect these analytics to actual growth decisions.
 kompozy.ioimprovado.iorevuze.it+22 min
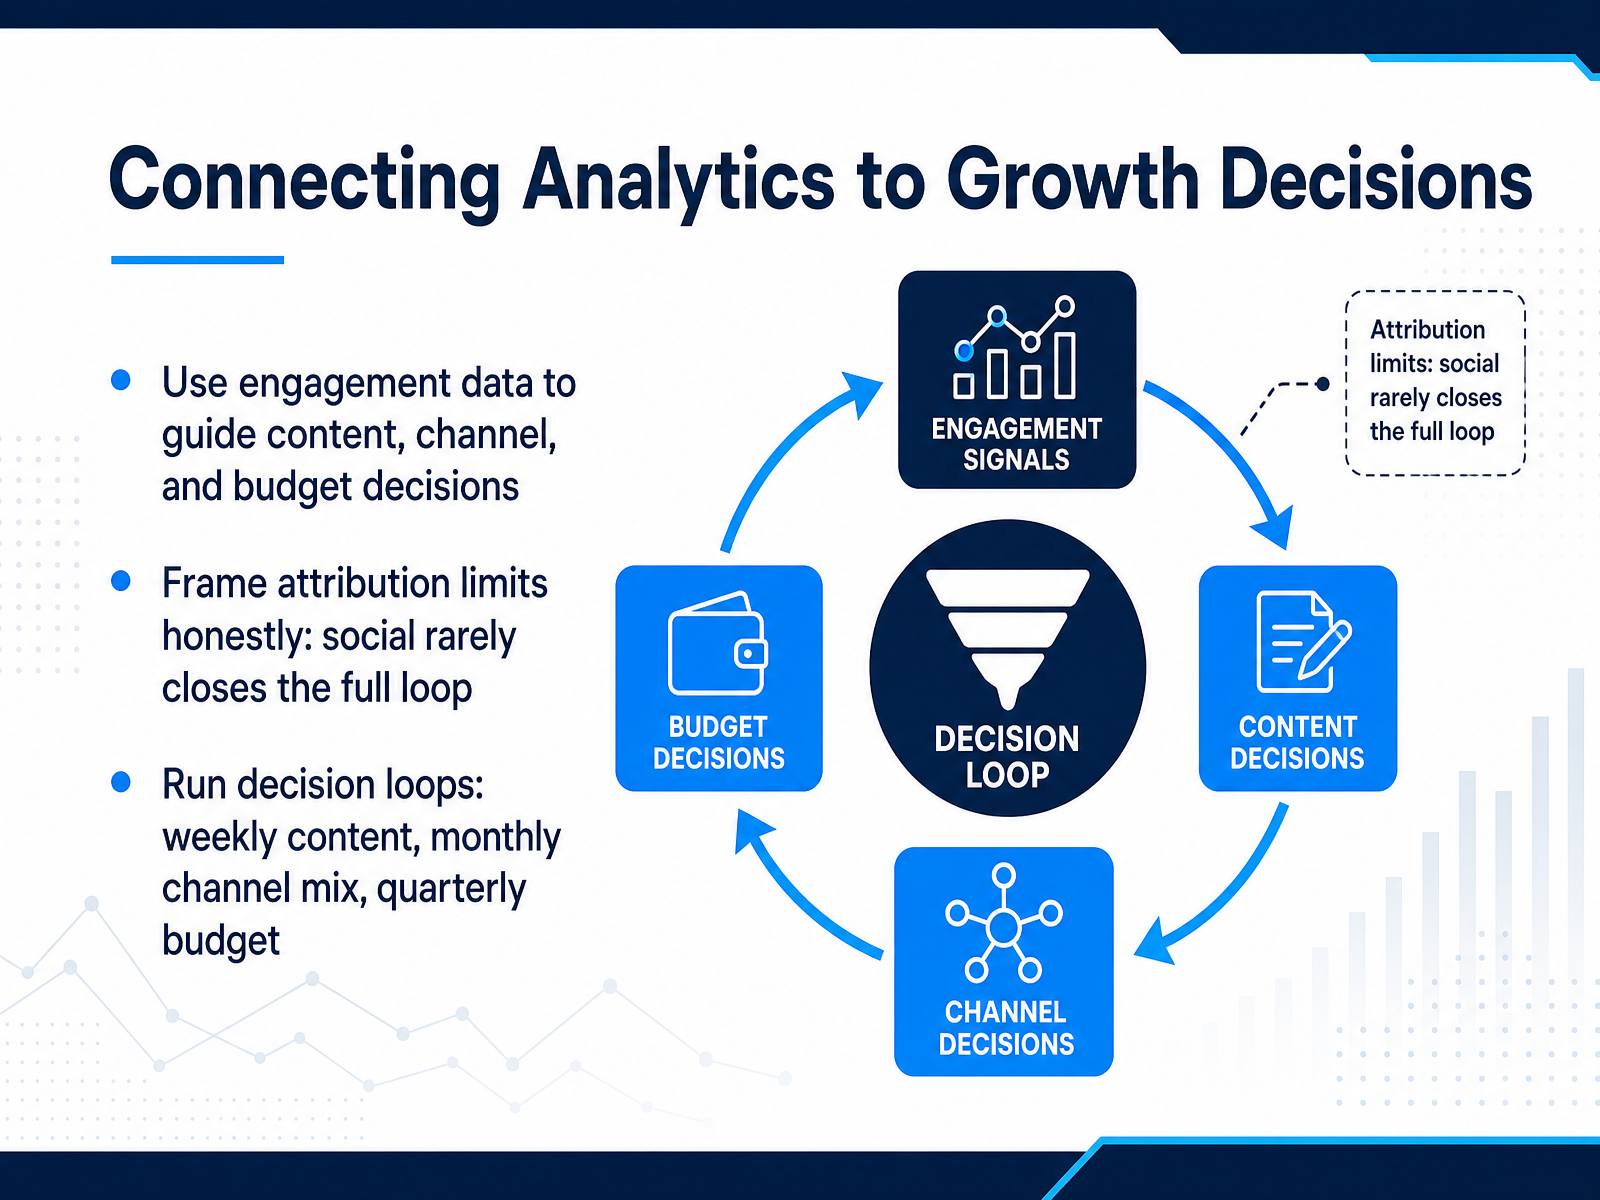
 - 12Connecting Analytics to Growth DecisionsNow let's connect analytics to growth decisions, because data only matters when it changes what you do next. Use engagement data to guide content, channel, and budget choices. If your TikTok posts drive triple the engagement rate of LinkedIn but LinkedIn sends more qualified traffic, the decision isn't about one metric, it's about what each channel is for. So, let engagement inform creative and cadence, and let business outcomes steer investment. Be honest about attribution limits. Social rarely closes the full loop, especially in B2B with long sales cycles. You can track assisted conversions and use UTM parameters, but don't overclaim last-click credit. The actionable move is to frame social as a contributor in your dashboard, not the sole driver. Now, run decision loops at the right cadence so insights don't go stale. Weekly, review content performance and double down on what resonates. Monthly, assess the channel mix and shift resources between organic and paid. Quarterly, revisit budget allocation and tie results to pipeline or revenue. This rhythm keeps analytics embedded in operations, not stuck in a report. Here's your takeaway: analytics should trigger decisions at a set frequency; if you haven't made a budget or content change in the last thirty days, your data isn't doing its job yet. Next, we'll cover governance, access, and your team operating model to make this repeatable.
 grandviewresearch.commordorintelligence.comfortunebusinessinsights.com+22 min
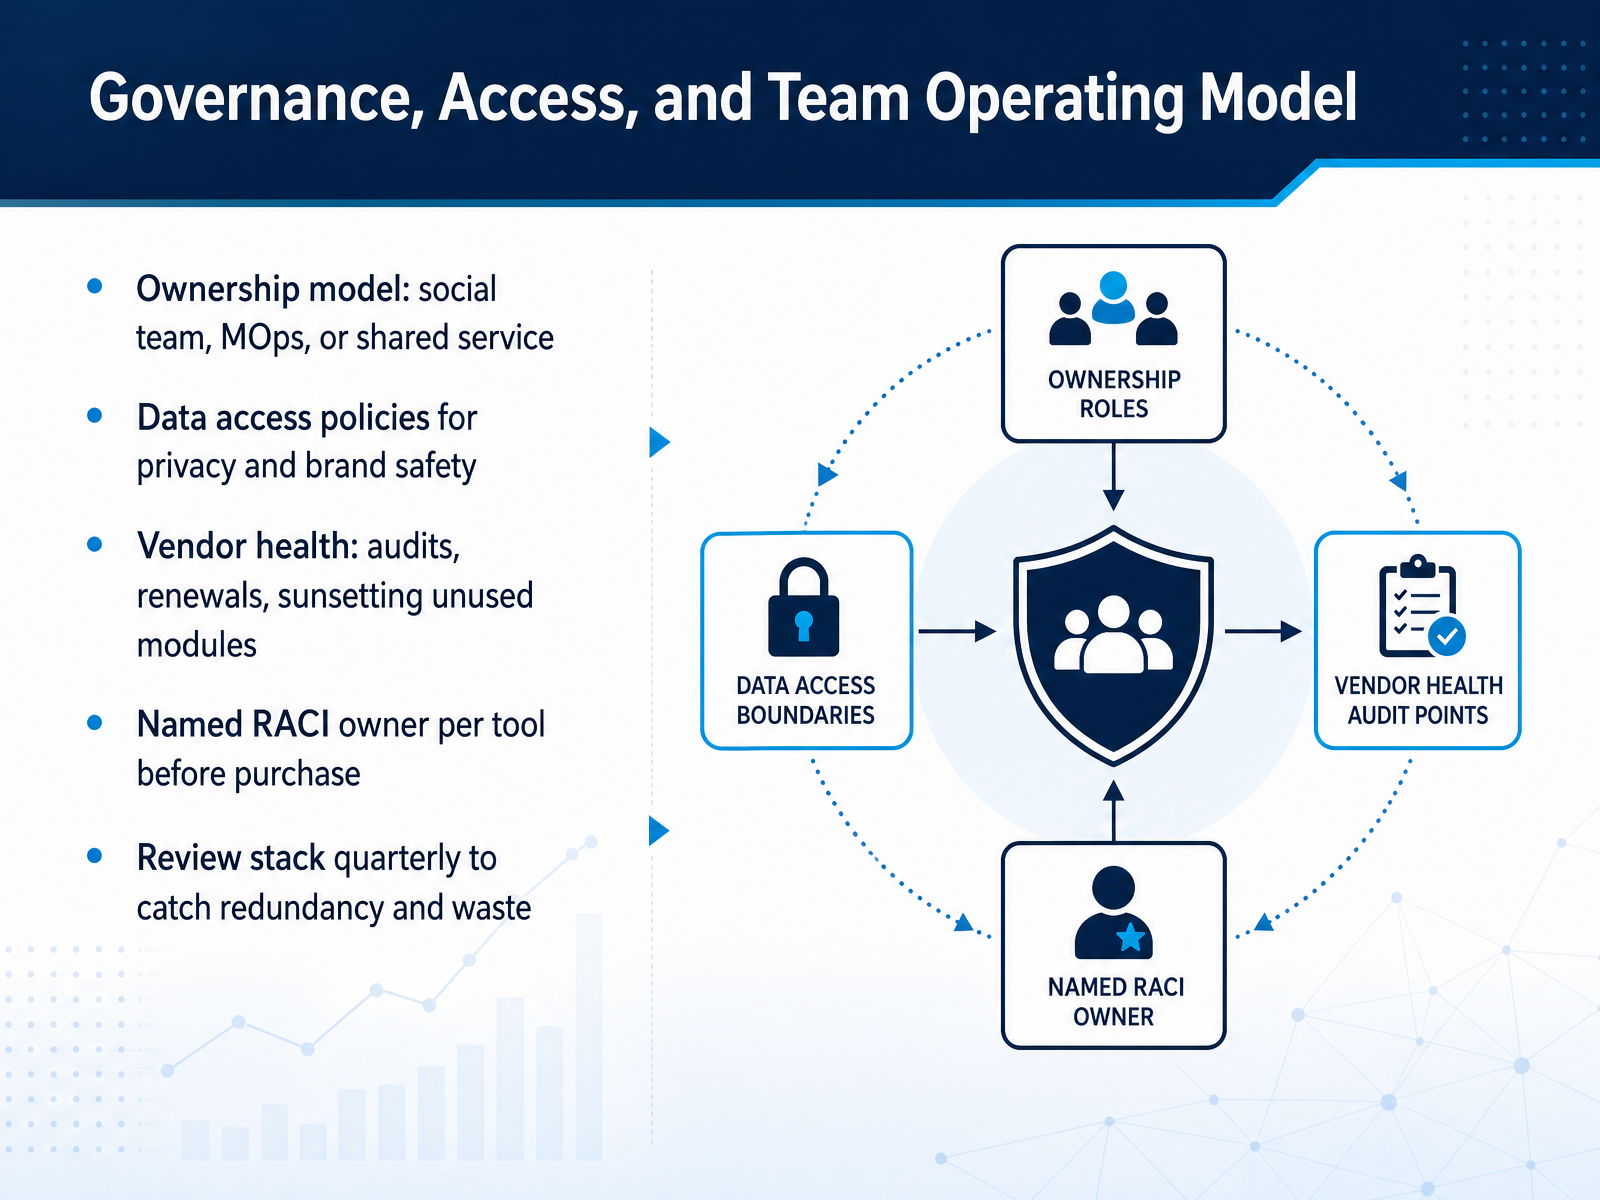
 - 13Governance, Access, and Team Operating ModelNow let’s talk about the operational backbone of your analytics stack. Governance, access, and the operating model you put in place. Most stack failures trace back to unclear ownership. Decide upfront whether the social team, marketing operations, or a shared service owns each tool. If you want speed, put MOps in the lead, with security, IT, and analytics as partners. You also need data access policies that protect privacy and brand safety. Make sure only approved users can pull audience or performance data, and document what is shareable externally. Vendor health is a recurring job. Audit your stack every quarter. Check usage logs and license seats. Sunset unused modules and renegotiate renewals. One audit found eight tools not logged into for ninety days, with three tools billing for seats of former employees. That is pure waste. Before buying anything, assign a named RACI owner. This person handles configuration, training, and adoption. Without that, a tool becomes shelfware. And tie those reviews to your renewal dates. That way, you catch redundancy and redundant spend before you auto-renew. The takeaway? Treat governance as an active process, not a one-time document. Ownership is the strongest predictor of whether an analytics tool actually changes decisions. But even the best governance fails if adoption stalls. So next, let’s move from selection to adoption with a practical action plan.
 pedowitzgroup.comdatainnovation.iothe-brand-algorithm.com+22 min
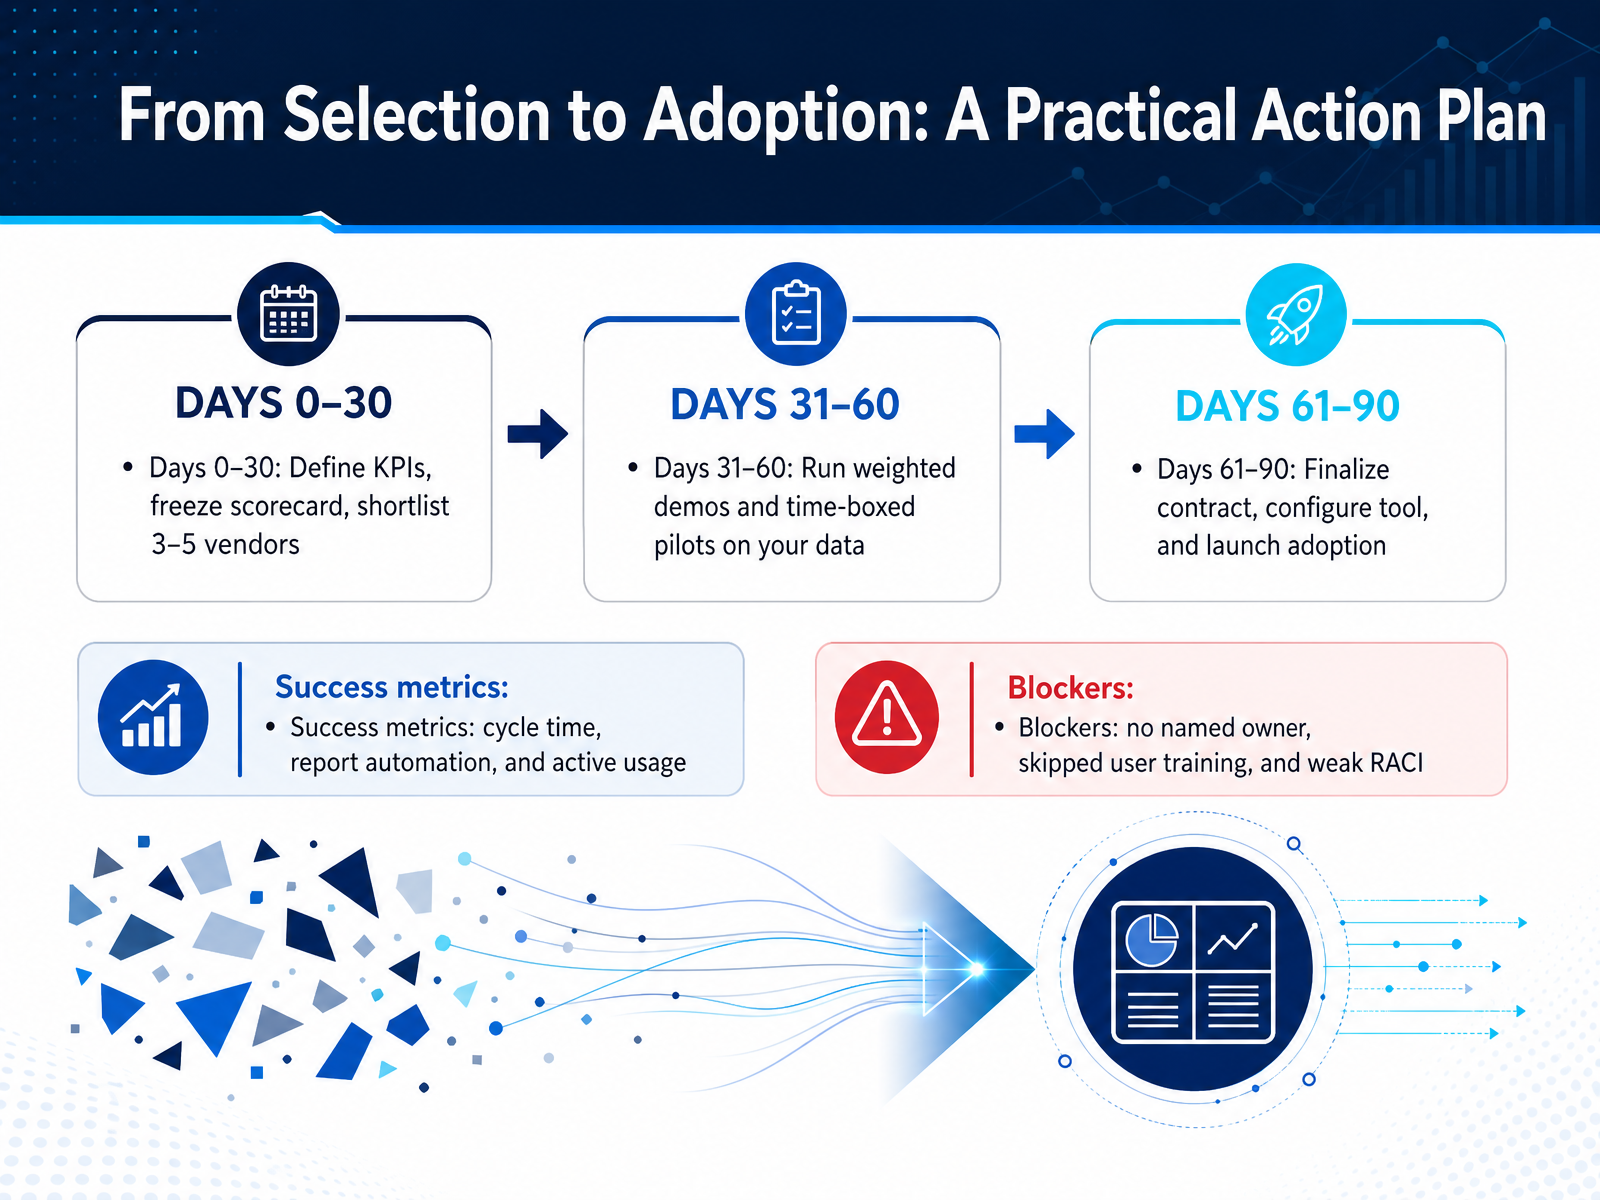
 - 14From Selection to Adoption: A Practical Action PlanSo here's the action plan that turns this evaluation into a live tool. Days zero to thirty: freeze your KPI definitions, lock the weighted scorecard, and shortlist three to five vendors. Don't let the weights drift once scoring starts. Days thirty-one to sixty: run scripted demos and time-boxed pilots on your own production-like data. Two to six weeks is enough to prove integration depth, but too short for scope to creep. Weight fit and integration heaviest, then security and TCO. Days sixty-one to ninety: finalize the contract with data export rights, name your RACI, configure the tool, and launch adoption. Track success by cycle time, report automation, and active user counts. The blockers are almost never technical. They are a missing named owner, skipped end-user training, or a weak RACI. Put a human accountable for configuration, utilization, and outcomes. If the pilot users aren't involved in selection, adoption stalls. That wraps our framework: define the job, score with evidence, pilot on your data, and protect the exit. Thanks for sticking with me. Now go freeze those weights and run the pilot. You have everything you need to make this decision defensible.
 pedowitzgroup.comdatainnovation.iothe-brand-algorithm.com+22 min
Take the deck with you
Download this course as a file — free, no sign-up needed.
- PDF handoutEvery slide page, ready to print or share.15 pages · 3.3 MBDownload
- Narrated PowerPointThe deck that presents itself — every slide carries the digital human's narration video.15 pages · 17.8 MBDownload
- PowerPoint slidesThe full deck as a .pptx — open it in PowerPoint, Keynote, or Google Slides.15 pages · 3.2 MBDownload
Free to use in your own training — please keep the PersonWise credit page at the end.
Have your own deck? Turn it into a course
Sources consulted
Web sources consulted while building this course.
- Social Media Analytics Market Size, Share Report 2026-2033 — grandviewresearch.com
- Social Media Analytics Market Size, Growth Report, Share & Forecast ... — mordorintelligence.com
- Social Media Analytics Market Size, Share | Global Report [2034] — fortunebusinessinsights.com
- Enterprise Social Media Analytics Tools Charting Growth Trajectories: Analysis and Forecasts 2026-2033 — archivemarketresearch.com
- Social Media Analytics Market Size, Share & Trends | Industry Report 2035 — emergenresearch.com
- The 10 best social media analytics tools in 2026 (honest comparison) · Kompozy — kompozy.io
- 12 Best Social Media Analytics Tools for 2026 - Improvado — improvado.io
- 15 Best Social Media Analytics Tools 2026 - Revuze — revuze.it
- Best Social Media Analytics Tools 2026 | BizTechScout — biztechscout.com
- Best Social Media Analytics Tools 2026: Pricing Compared - Postiv AI — postiv.ai
- Social Media Management Software RFP Template - Apaya — apaya.com
- Evaluate the Best Social Media Management Platforms Today — emplifi.io
- How to Choose a Social Media Analytics Tool (Buyer's Guide) — socialk.it
- Enterprise Social Media Management Checklist: SSO, Compliance, and the Stuff That Matters | Listicler — listicler.com
- How to Evaluate Social Media Management Platforms - Apaya — apaya.com
- What's the best way to evaluate new marketing technology vendors? — pedowitzgroup.com
- MarTech Vendor Selection: The Evaluation Framework We Use Across 200+ Tools | Data Innovation — datainnovation.io
- The Complete Guide to Marketing Technology Evaluation — the-brand-algorithm.com
- MarTech Justification Scorecard by AJ Sedlak - Marketing Operations — marketingops.com
- Martech Stack Evaluation — A 6-Dimension Scorecard Framework — martechstackbuilder.com