Begin
14 pages · ~28 min
Map Projections and World Map Distortion
This training explains why all world maps distort reality and helps learners understand the trade-offs behind common map projections.
A digital instructor presents all 14 pages. Hold “Ask” at any point and ask out loud — the answer comes from this course. No sign-up needed.
What you’ll learn
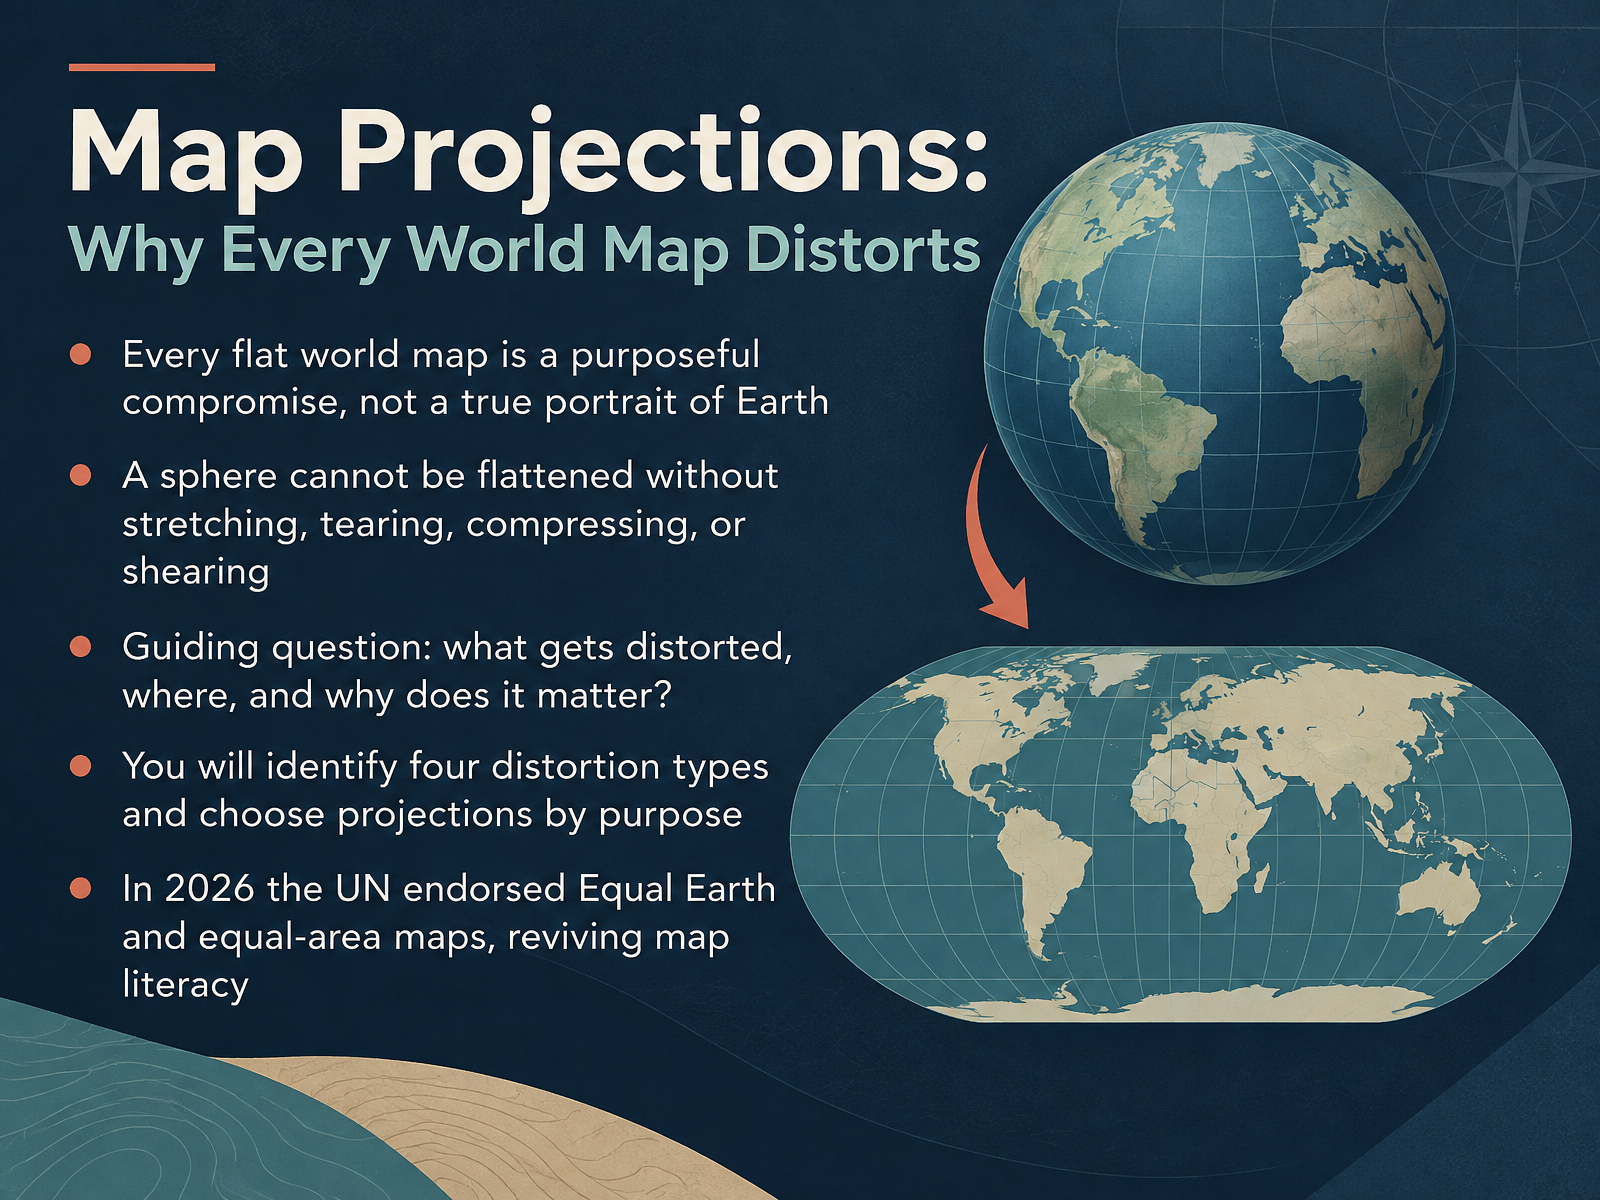
- 01Map Projections: Why Every World Map DistortsWelcome. I'm glad you're here, because we're about to look at something you've seen thousands of times without ever being told the whole story: the world map. Here's the idea we'll build on together. Every flat world map is a purposeful compromise, not a true portrait of Earth. A sphere simply cannot be flattened without stretching, tearing, compressing, or shearing something. Think of a phone navigating you across town. A classroom wall map. A news graphic. Each one made a quiet choice about what to sacrifice. So our guiding question is this: what gets distorted, where, and why does it matter? By the end, you'll be able to identify four distortion types, and choose a projection based on purpose rather than habit. This conversation is especially timely. In 2026, the United Nations endorsed Equal Earth and other equal-area maps, reviving public interest in map literacy. So let's begin by asking the most basic question of all. Why is flattening a sphere impossible?youtube.comsites.lsa.umich.eduen.wikipedia.org+22 min
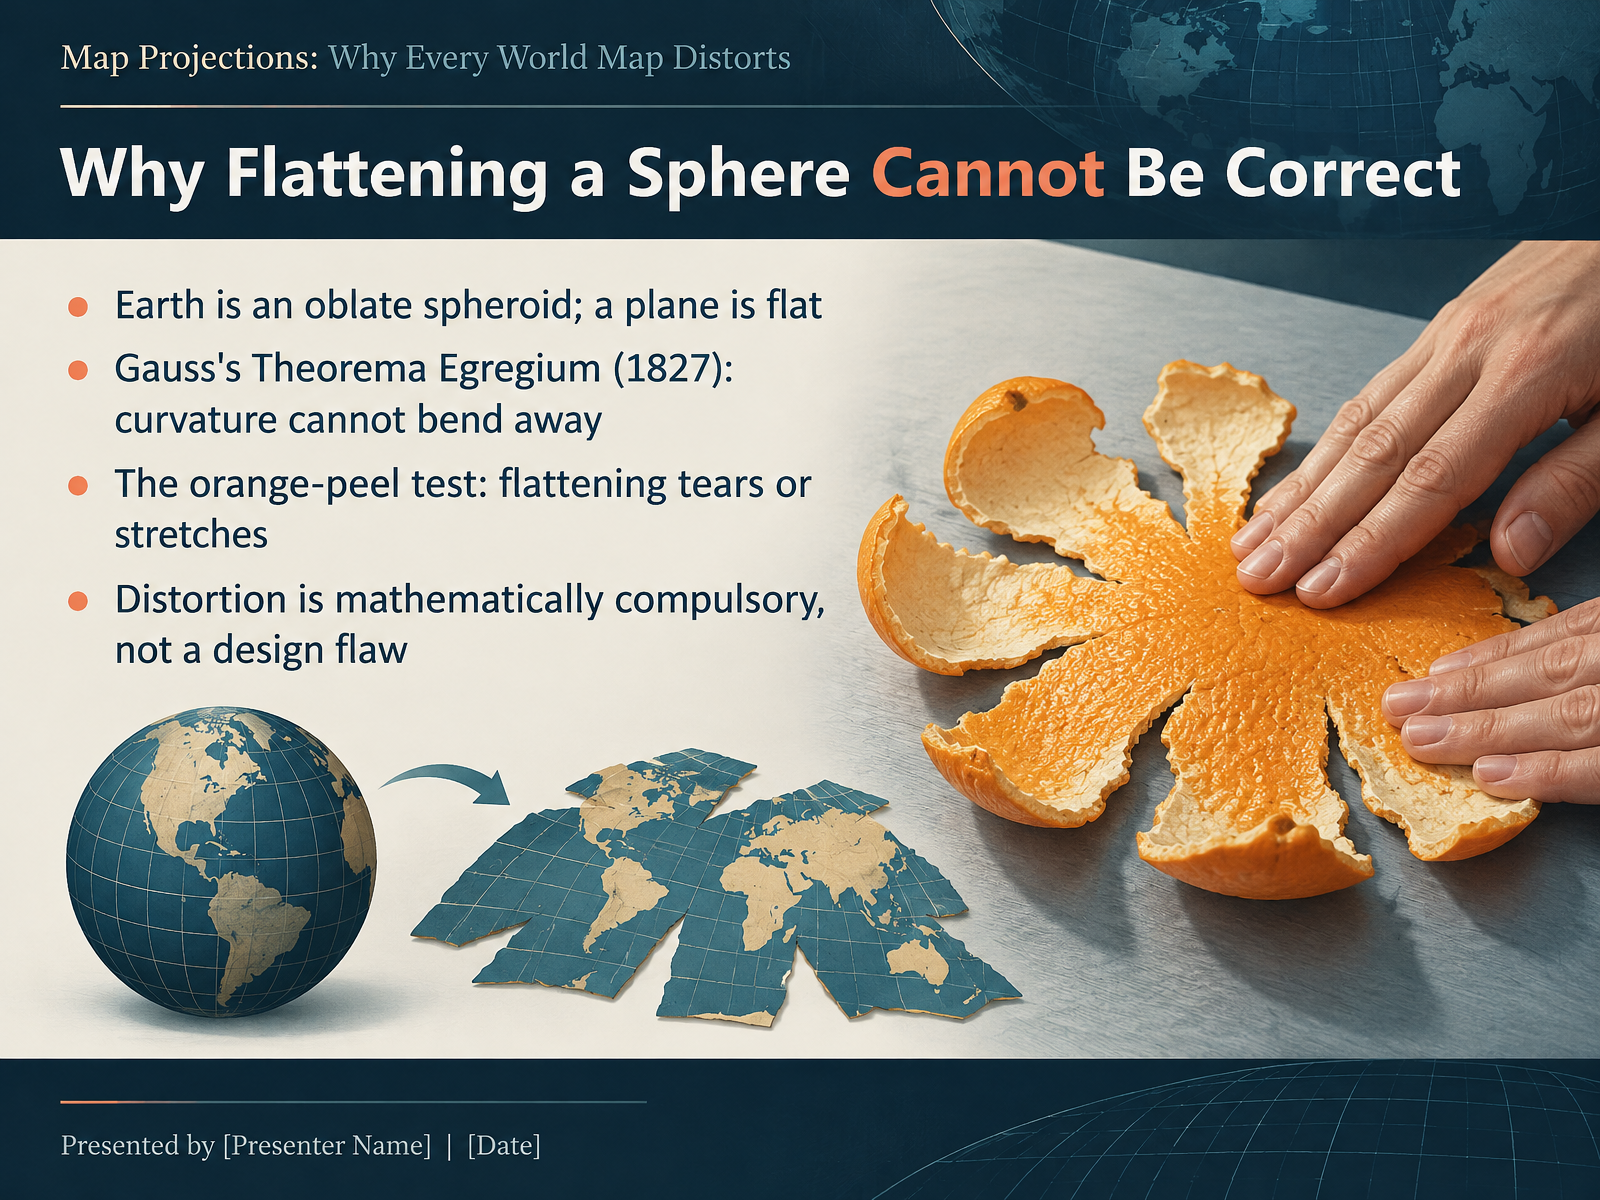
- 02Why Flattening a Sphere Cannot Be CorrectSo, why can't we just flatten the Earth correctly? The reason is built into the geometry itself. Earth is an oblate spheroid, a slightly squashed ball, while a map is a flat plane. And in 1827, the mathematician Carl Friedrich Gauss proved something remarkable with his Theorema Egregium, meaning the Remarkable Theorem. Curvature is intrinsic. If you bend a surface without stretching it, its curvature cannot change. A sphere curves; a flat plane doesn't. So no bending process can turn one into the other. Here's the key trade-off, and the easiest way to feel it is the orange-peel test. Peel an orange and try to press the skin flat. It tears, or it stretches. Never both perfectly flat and perfectly intact. That is exactly what every map projection does to the globe. So distortion isn't a design flaw, or a sign that cartographers haven't tried hard enough. It is mathematically compulsory. The only real question is which distortion we choose to accept. And that choice is called a projection. Let's look at the four properties every map must trade away.
 youtube.comsites.lsa.umich.eduen.wikipedia.org+22 min
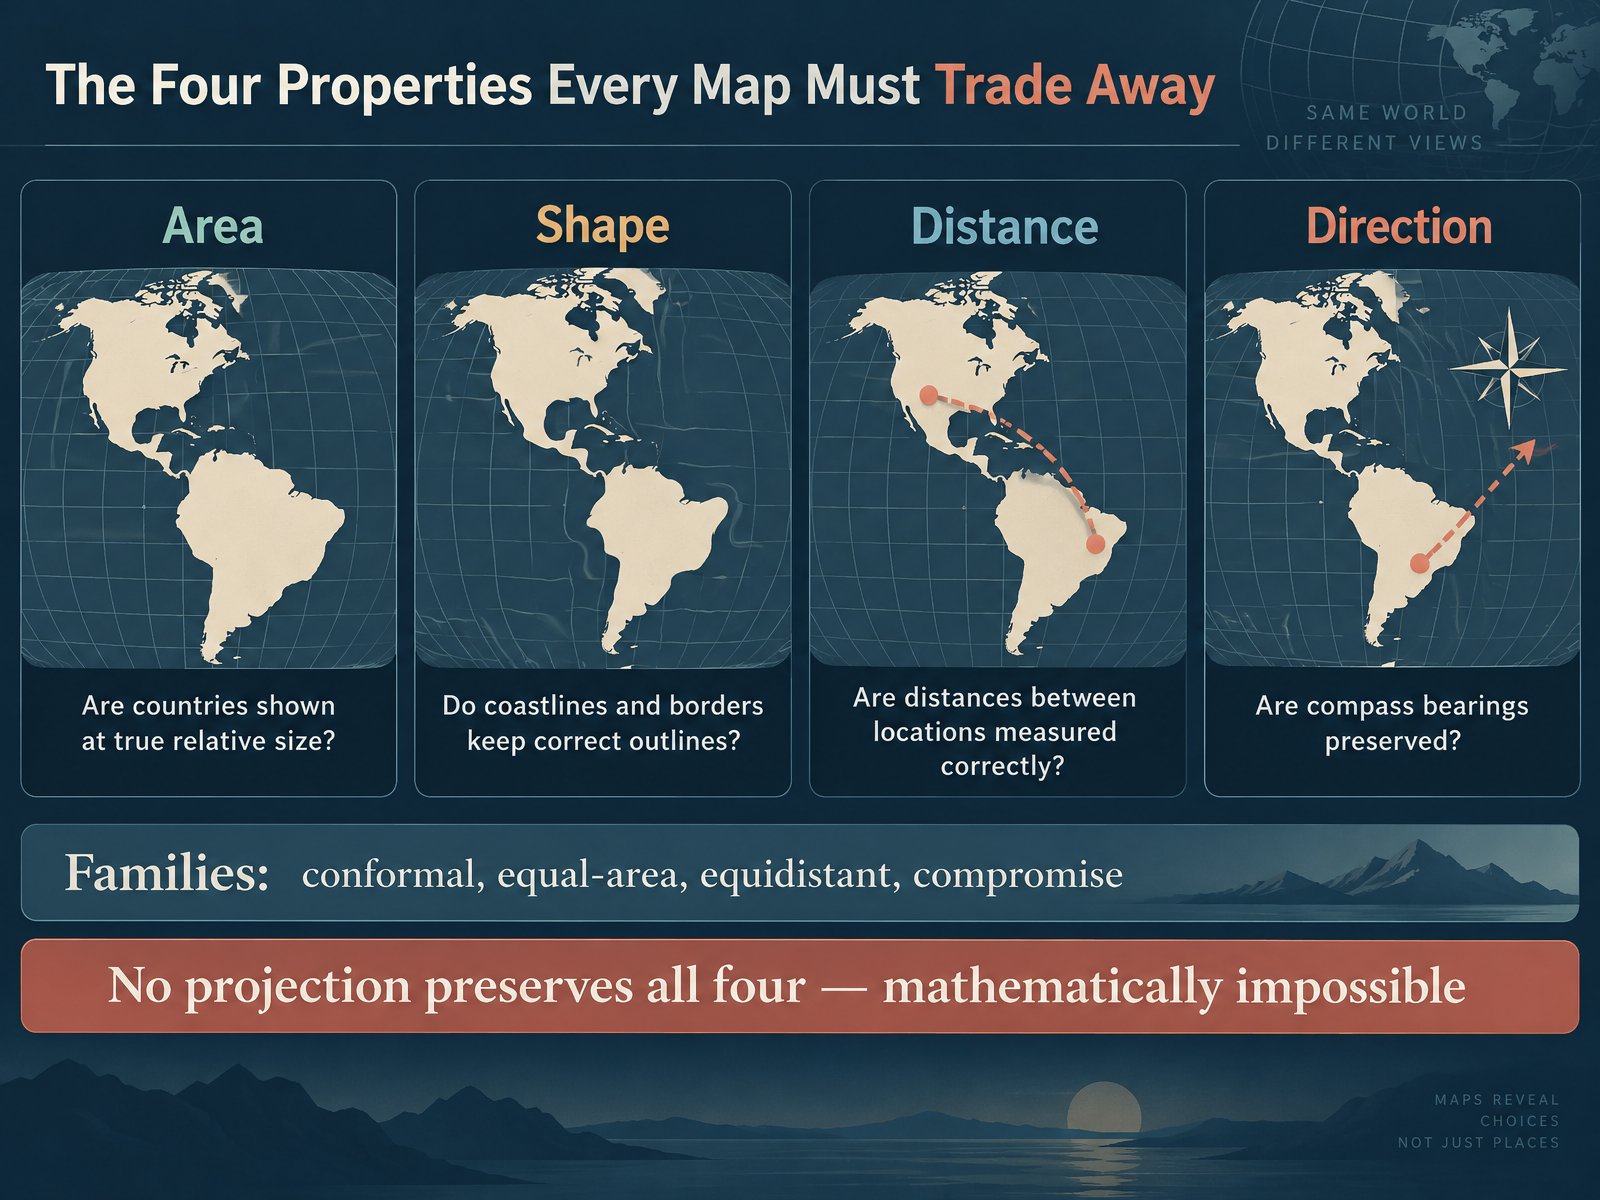
- 03The Four Properties Every Map Must Trade AwayNow let's break down why that is the case. Every map projection has to trade away at least one of four properties. First, area: are countries shown at their true relative size? On many maps, Greenland looks nearly as big as Africa, when Africa is actually about fourteen times larger. Second, shape: do coastlines and borders keep their correct outlines? Third, distance: are distances between locations measured correctly? And fourth, direction: are compass bearings preserved? Projections fall into families based on which property they protect. Conformal projections keep local shape and angles. Equal-area projections keep true relative size. Equidistant projections keep distance accurate, but only from one or two chosen points. And compromise projections like Robinson or Winkel Tripel spread the error around so nothing looks too wrong. Here is the key trade-off. No projection preserves all four properties at once. That is not a design flaw. It is a mathematical impossibility, proven by Carl Friedrich Gauss in eighteen twenty-seven. So the real question is not which map is correct, but which distortion you can live with for your purpose. Next, let's see how cartographers visualize that distortion directly, with Tissot's Indicatrix: Seeing Distortion at a Glance.
 youtube.comsites.lsa.umich.eduen.wikipedia.org+22 min
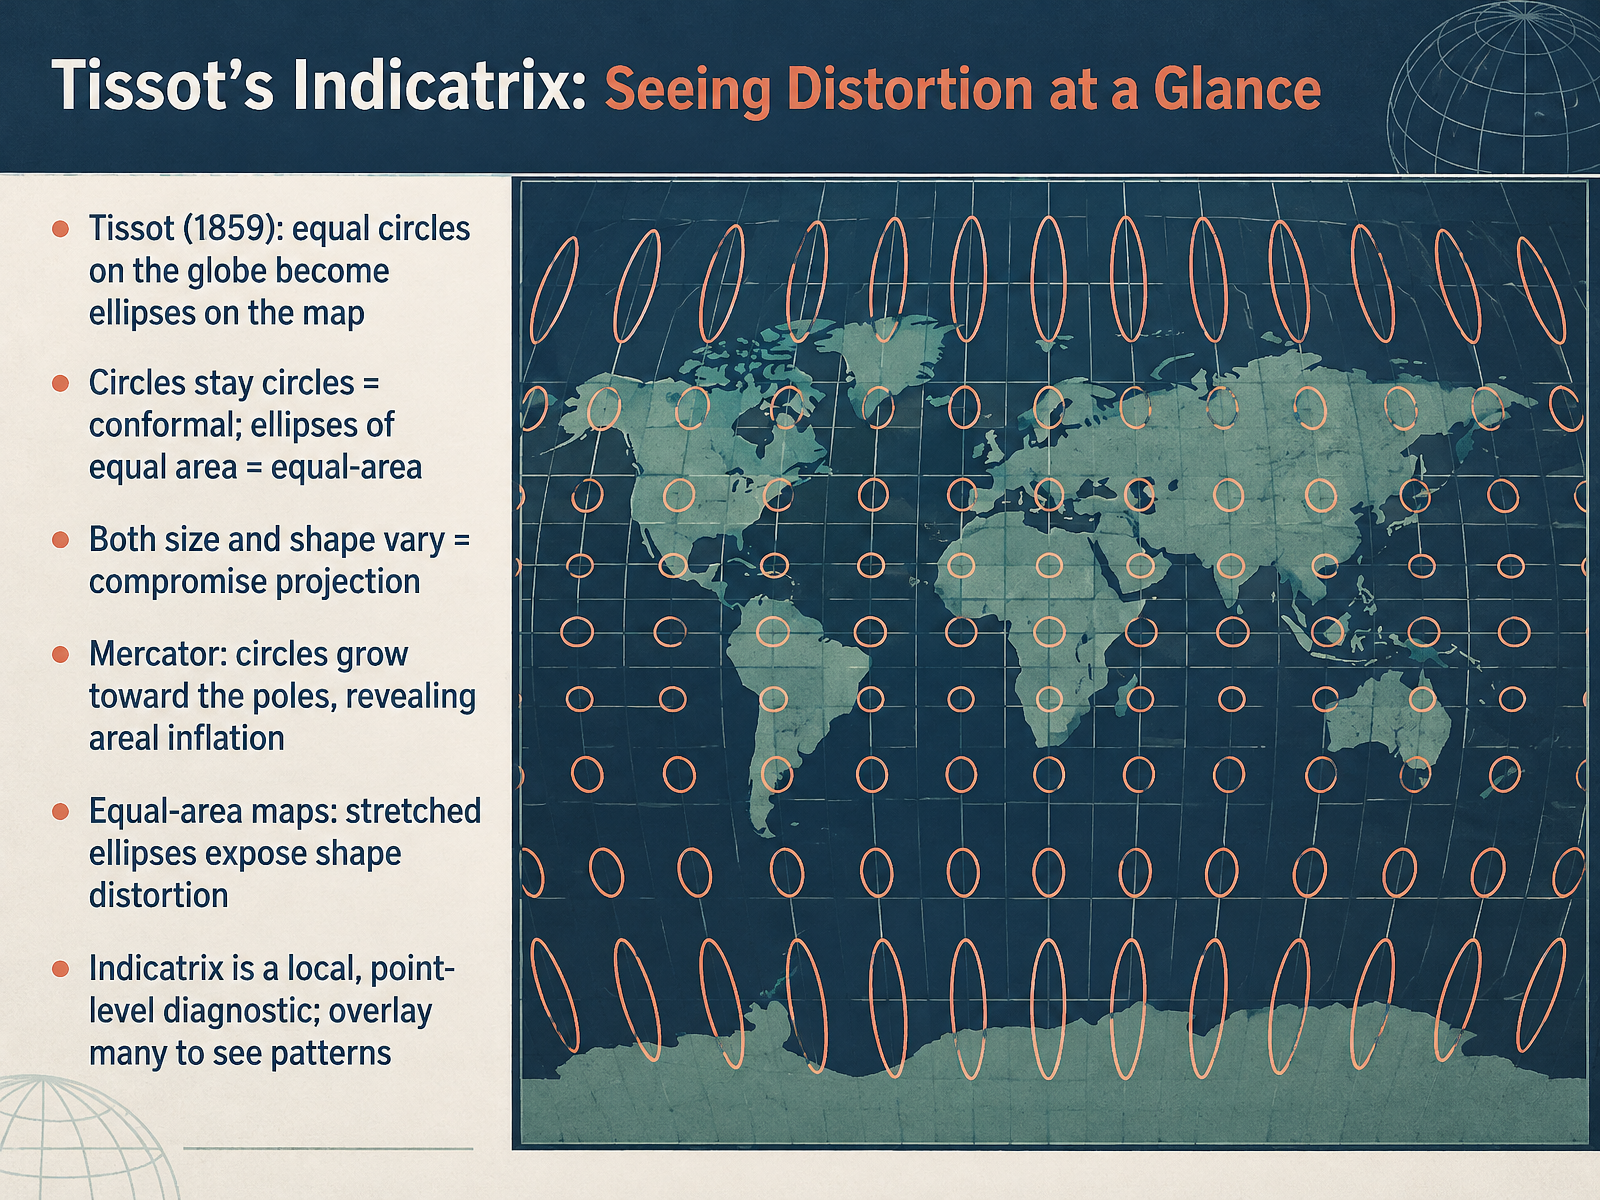
- 04Tissot's Indicatrix: Seeing Distortion at a GlanceLet's take a closer look at how we actually measure projection distortion. Meet Tissot's indicatrix, a tool introduced by the French mathematician Nicolas Auguste Tissot in 1859. The idea is simple. Imagine drawing identical circles on the globe at regular intervals. When you project them onto a flat map, those circles change shape. Now here's the key trade-off. If the circles stay circles, the projection is conformal, meaning it preserves local shape. If the circles become ellipses but all keep the same area, the projection is equal-area. And if both size and shape vary, you have a compromise projection. Mercator is a classic example. Its circles grow larger toward the poles, revealing severe areal inflation. Equal-area maps do the opposite. They keep areas true, but stretch shapes, especially near the edges. One important detail. A single ellipse only tells you about distortion at one point. So cartographers overlay many indicatrices to spot patterns across the whole map. That way, you can see at a glance where a projection performs well and where it struggles. Next, we'll examine how projections are actually constructed. From Globes to Grids: How Projections Are Built.
 esri.comsco.wisc.eduneacsu.net+22 min
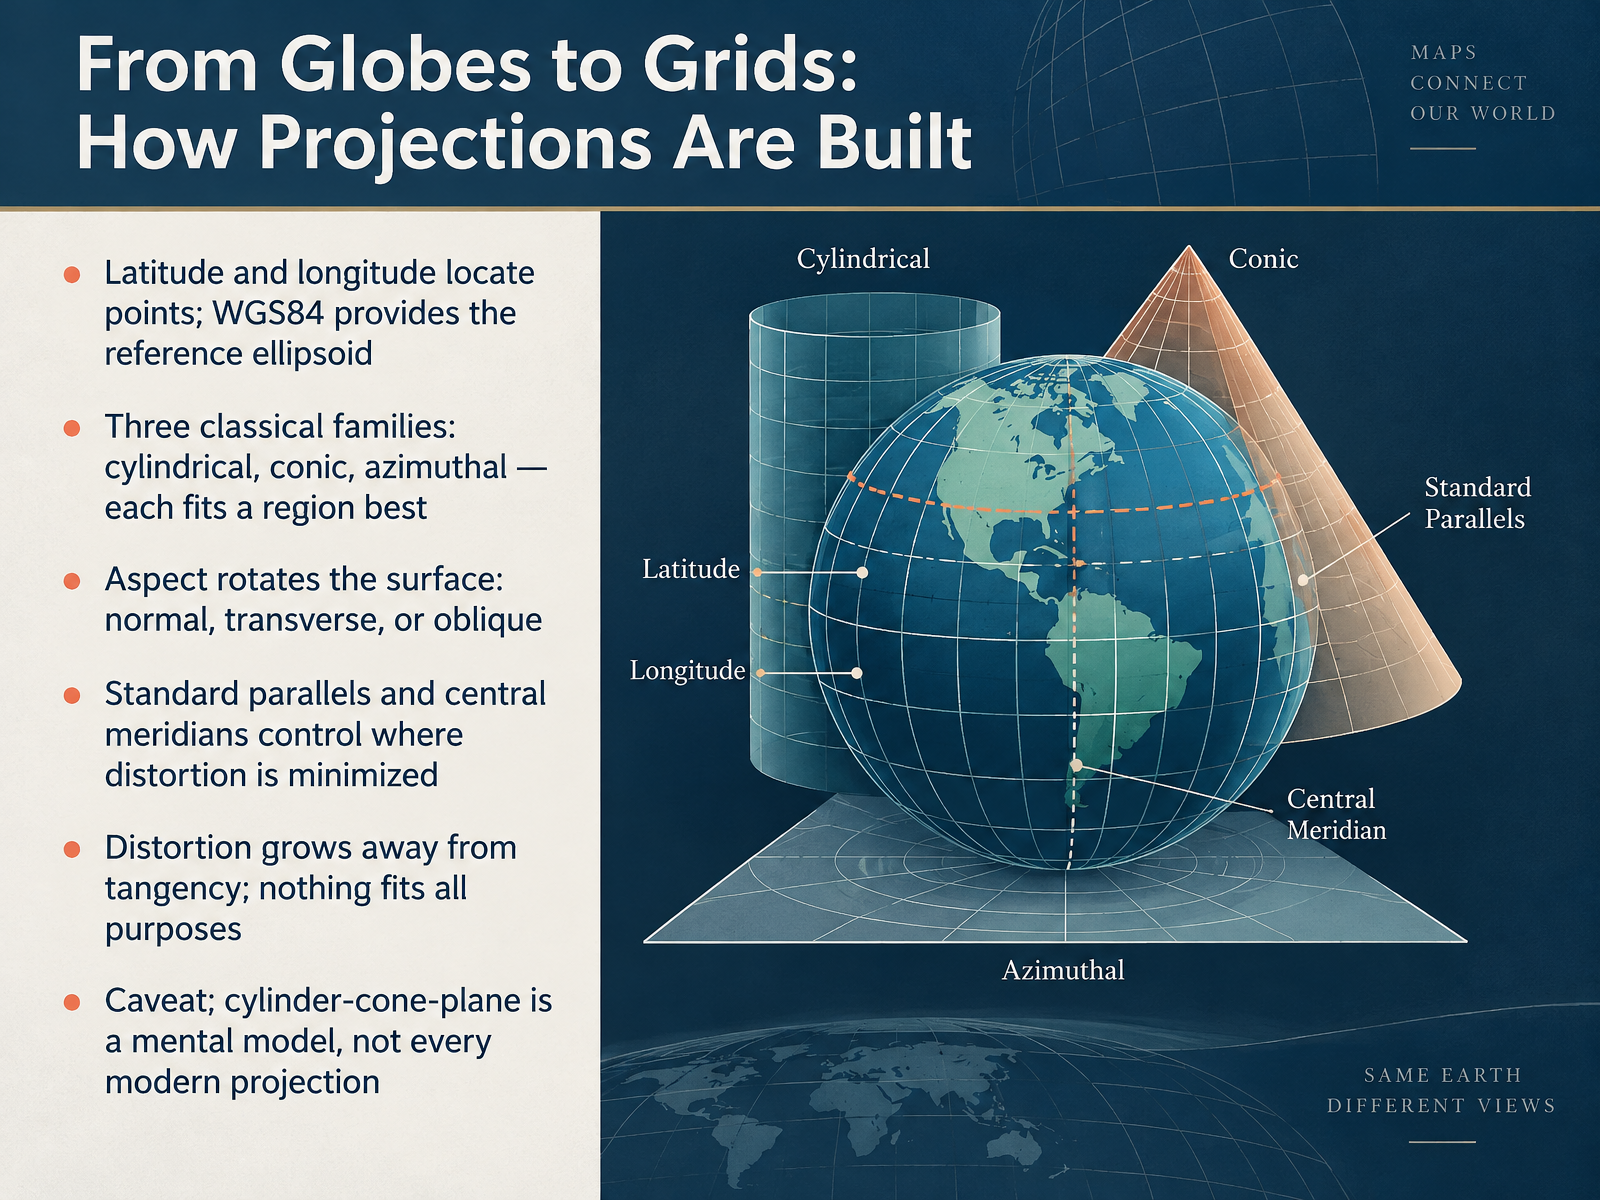
- 05From Globes to Grids: How Projections Are BuiltNow let's look at how projections are actually built. Every projection starts with a coordinate system. Latitude and longitude locate points on the Earth, and a reference ellipsoid, such as W G S eighty-four, provides the smooth mathematical model that those coordinates sit on. From there, mapmakers use three classical families: cylindrical, conic, and azimuthal. Each one fits a particular region best. A cylinder suits the equator, a cone suits the mid-latitudes, and a plane suits the poles. Here's the key trade-off. Aspect rotates the surface, so it can sit normally, transversely, or obliquely. Standard parallels and central meridians control where distortion is minimized. Distortion grows as you move away from the line or point of tangency, so nothing fits all purposes. One caveat: the cylinder, cone, and plane model is a helpful mental picture, not a rule that every modern projection follows. Next, let's meet the projections you see most often: the usual suspects, Mercator, Gall-Peters, Robinson, and Winkel Tripel.
 mathworks.comcourses.ems.psu.eduunstats.un.org+21 min
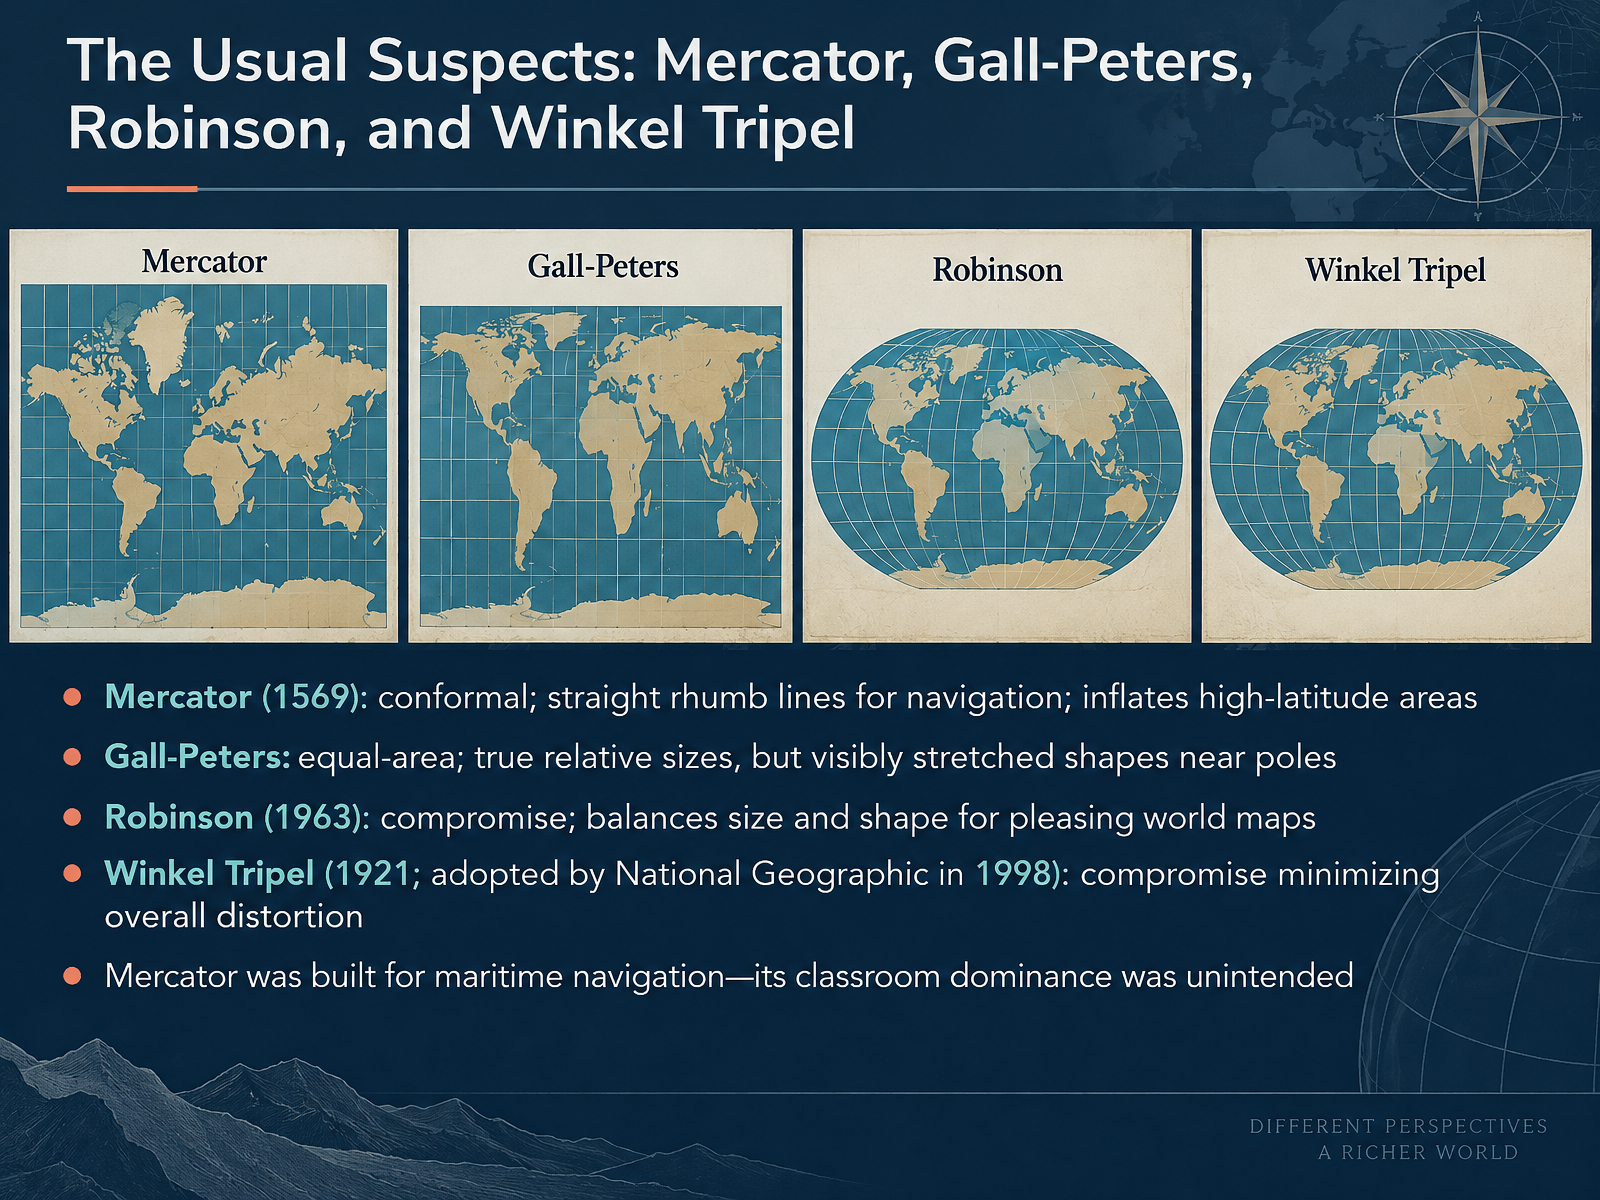
- 06The Usual Suspects: Mercator, Gall-Peters, Robinson, and Winkel TripelNow let's meet the usual suspects, the four projections you'll run into again and again. First, Mercator, from fifteen sixty-nine. It's conformal, meaning it preserves local angles and shapes. That's why rhumb lines, paths of constant compass bearing, appear straight. Great for sailors. But it inflates high-latitude areas, so Greenland can look as big as Africa. Here's the key trade-off. Gall-Peters is equal-area. It shows true relative sizes, so Africa finally looks huge. The cost? Shapes get stretched and squashed, especially near the poles. Then there's Robinson, from nineteen sixty-three. It's a compromise, balancing size and shape to make a pleasing world map. Winkel Tripel, created in nineteen twenty-one and adopted by National Geographic in nineteen ninety-eight, is also a compromise, designed to minimize overall distortion. One last point. Mercator was built for maritime navigation. Its dominance in classrooms was never intended. Next, we'll see this distortion in action with Greenland, Africa, and beyond.
 education.nationalgeographic.orgen.wikipedia.orgexa.ai+22 min
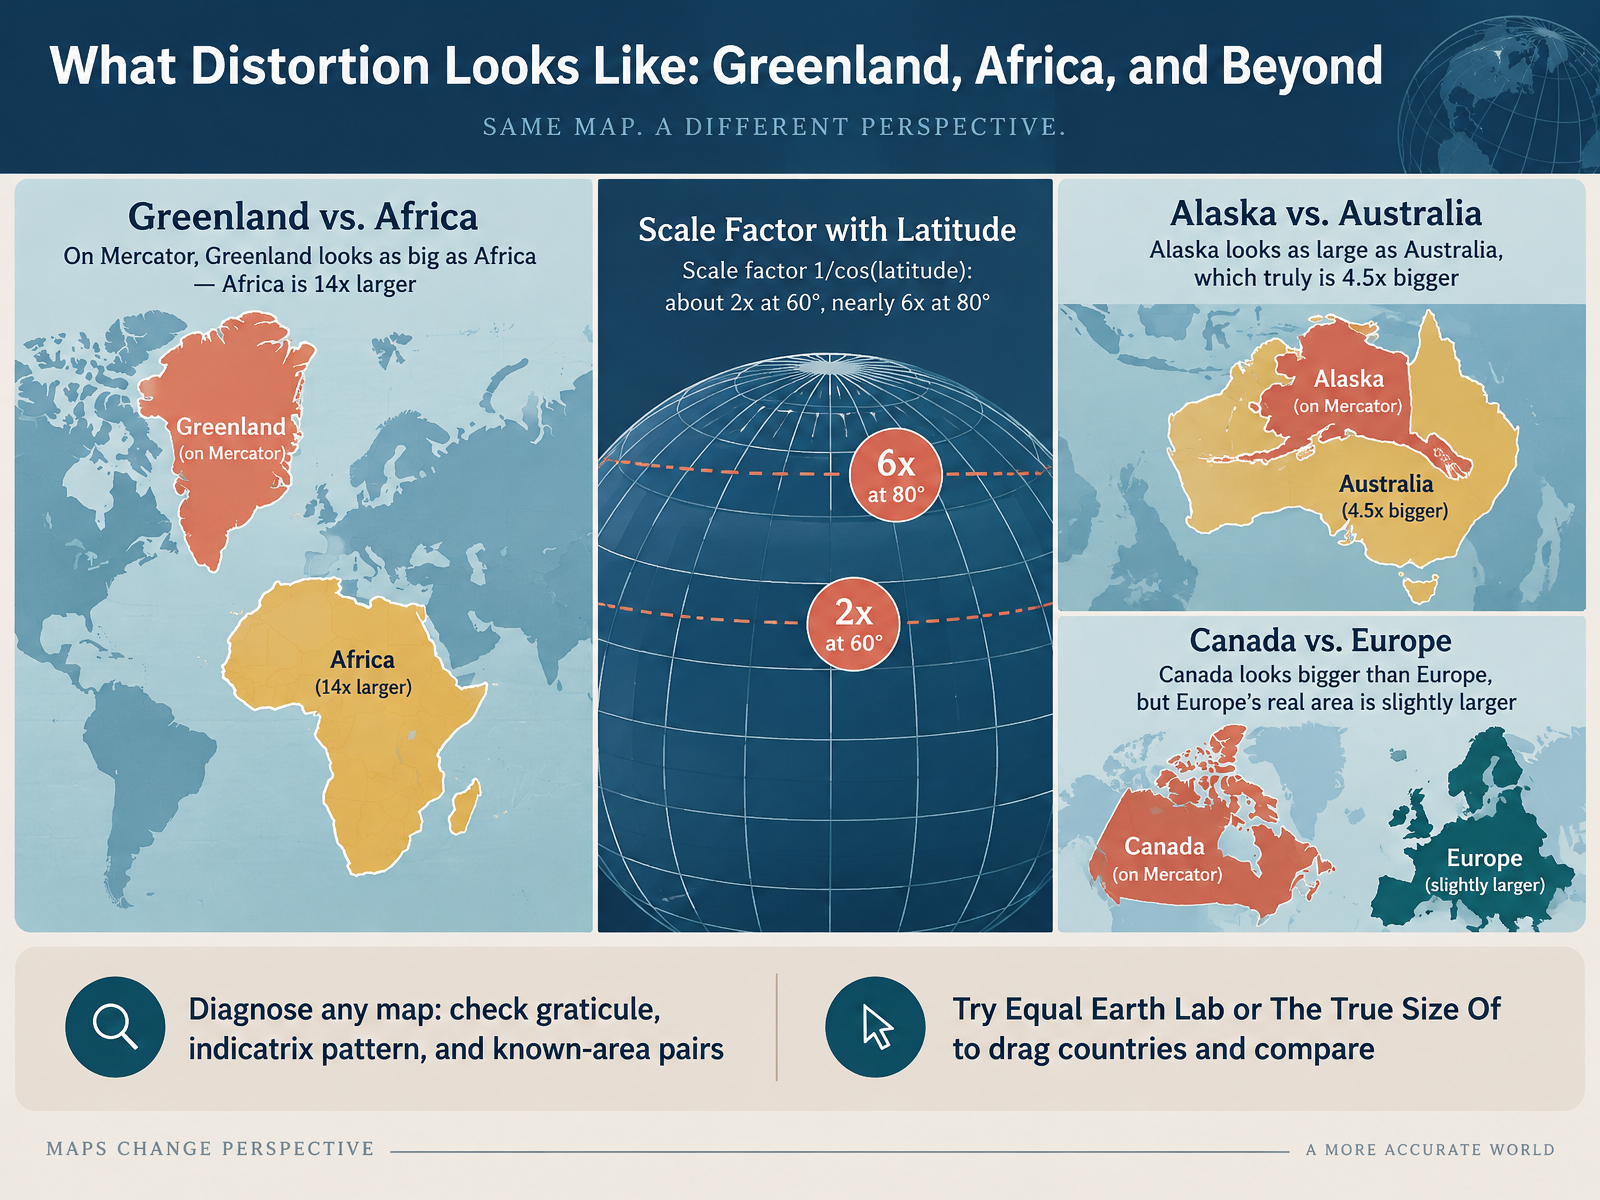
- 07What Distortion Looks Like: Greenland, Africa, and BeyondLet's make distortion concrete by looking at some familiar size comparisons. On a Mercator map, Greenland appears about as big as Africa. In reality, Africa is roughly fourteen times larger. That is not a small error. Why does this happen? Mercator's scale factor is one divided by the cosine of latitude. At sixty degrees, that is about two times. At eighty degrees, it is nearly six times. So the farther from the equator, the more inflated the land appears. Alaska looks about as large as Australia, but Australia is truly four and a half times bigger. Canada looks bigger than Europe, yet Europe's real area is slightly larger. As a quick takeaway, you can diagnose any map by checking three things. First, the graticule, meaning the grid of latitude and longitude lines. Second, the indicatrix pattern, which shows how shapes and sizes distort. And third, known-area pairs, like Greenland versus Africa. If you want to explore this yourself, try tools like Equal Earth Lab or The True Size Of, where you can drag countries around and compare their actual areas.
Global Shift in 2026: The UN Resolution and Equal Earth.
 esri.comsco.wisc.eduneacsu.net+22 min
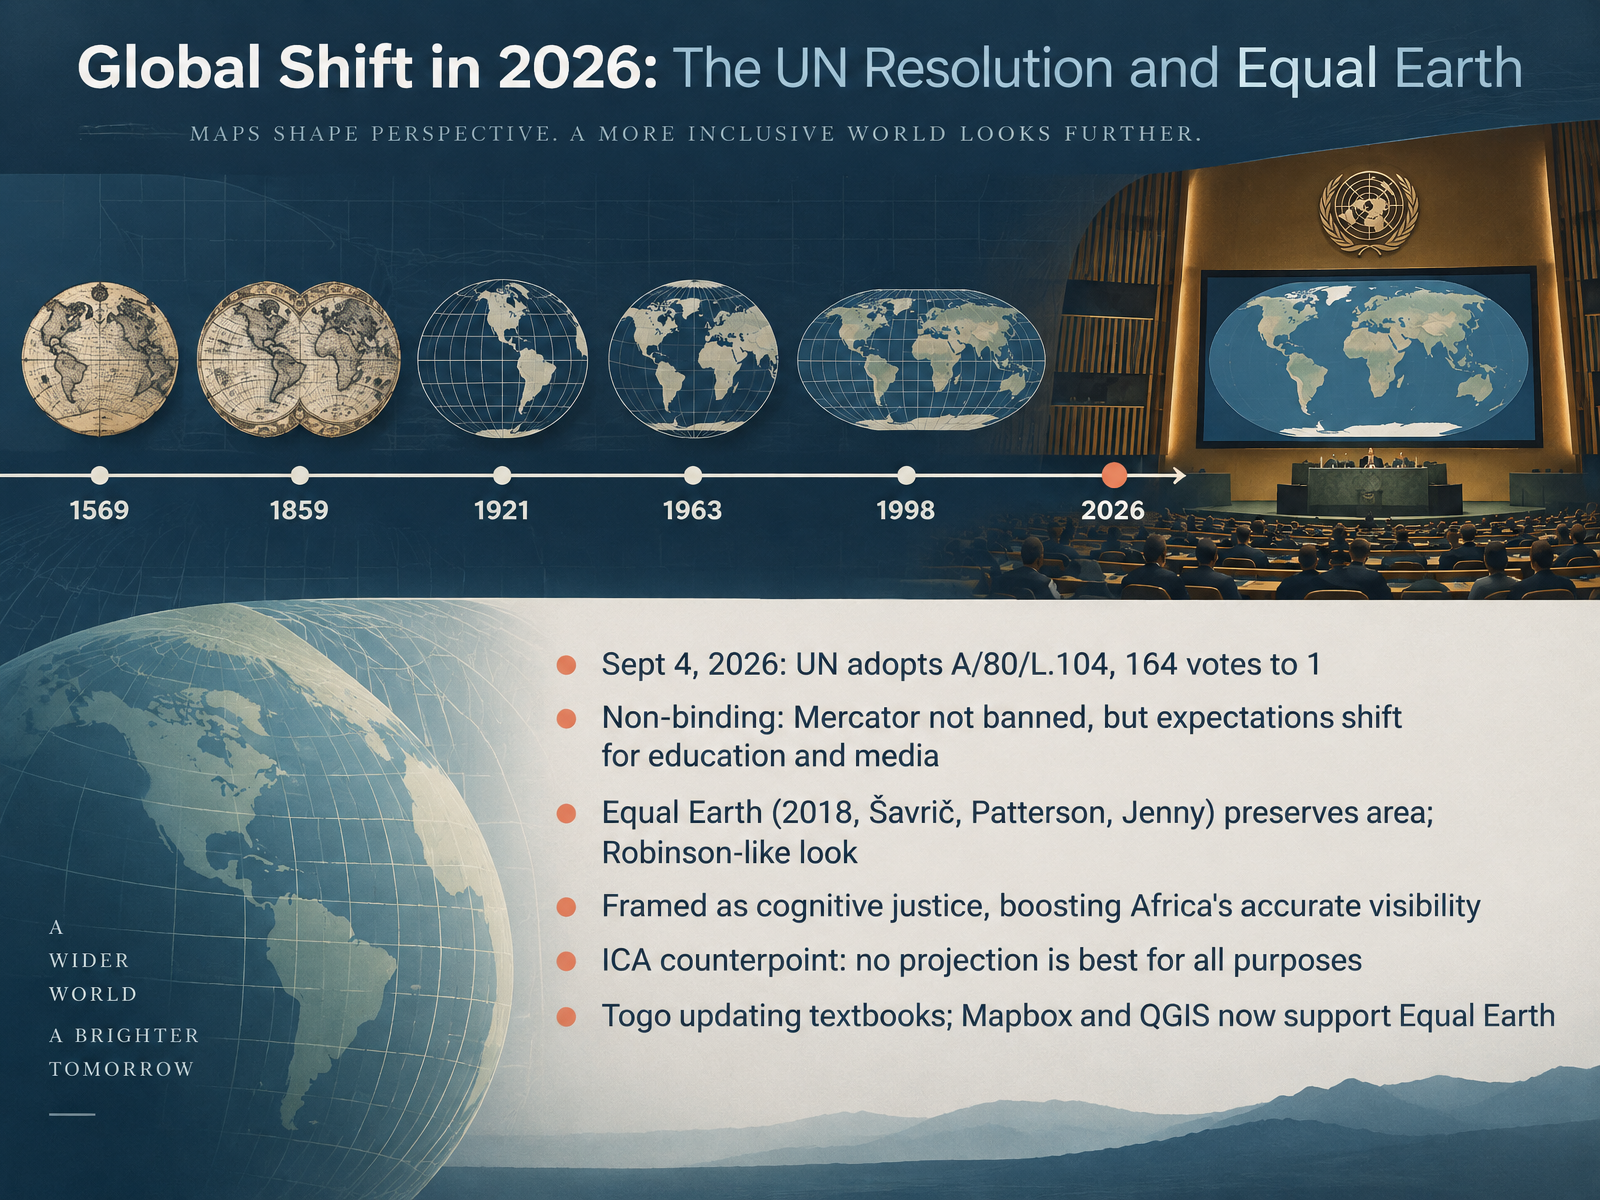
- 08Global Shift in 2026: The UN Resolution and Equal EarthNow let's look at how this debate turned into an actual global shift. On September fourth, 2026, the United Nations General Assembly adopted resolution A slash eighty slash L dot one zero four, by a vote of one hundred sixty four to one. The United States cast the only no vote. Here's the key trade-off: the resolution is non-binding. Mercator isn't banned. But it does shift expectations for education and media, encouraging equal-area maps when relative size matters. The resolution points to Equal Earth, published in 2018 by Šavrič, Patterson, and Jenny. It preserves area, so Africa, Latin America, and Oceania finally appear at true scale, and it looks a lot like the familiar Robinson projection, just corrected for area. Supporters frame this as cognitive justice, a way to give Africa accurate visibility after centuries of being visually minimized. But there's an important counterpoint from the International Cartographic Association: no single projection is best for every purpose. In practice, the change is already moving: Togo is updating its textbooks, and tools like Mapbox and QGIS now support Equal Earth. Why It Matters: Media, Navigation, and Education.
 2 min
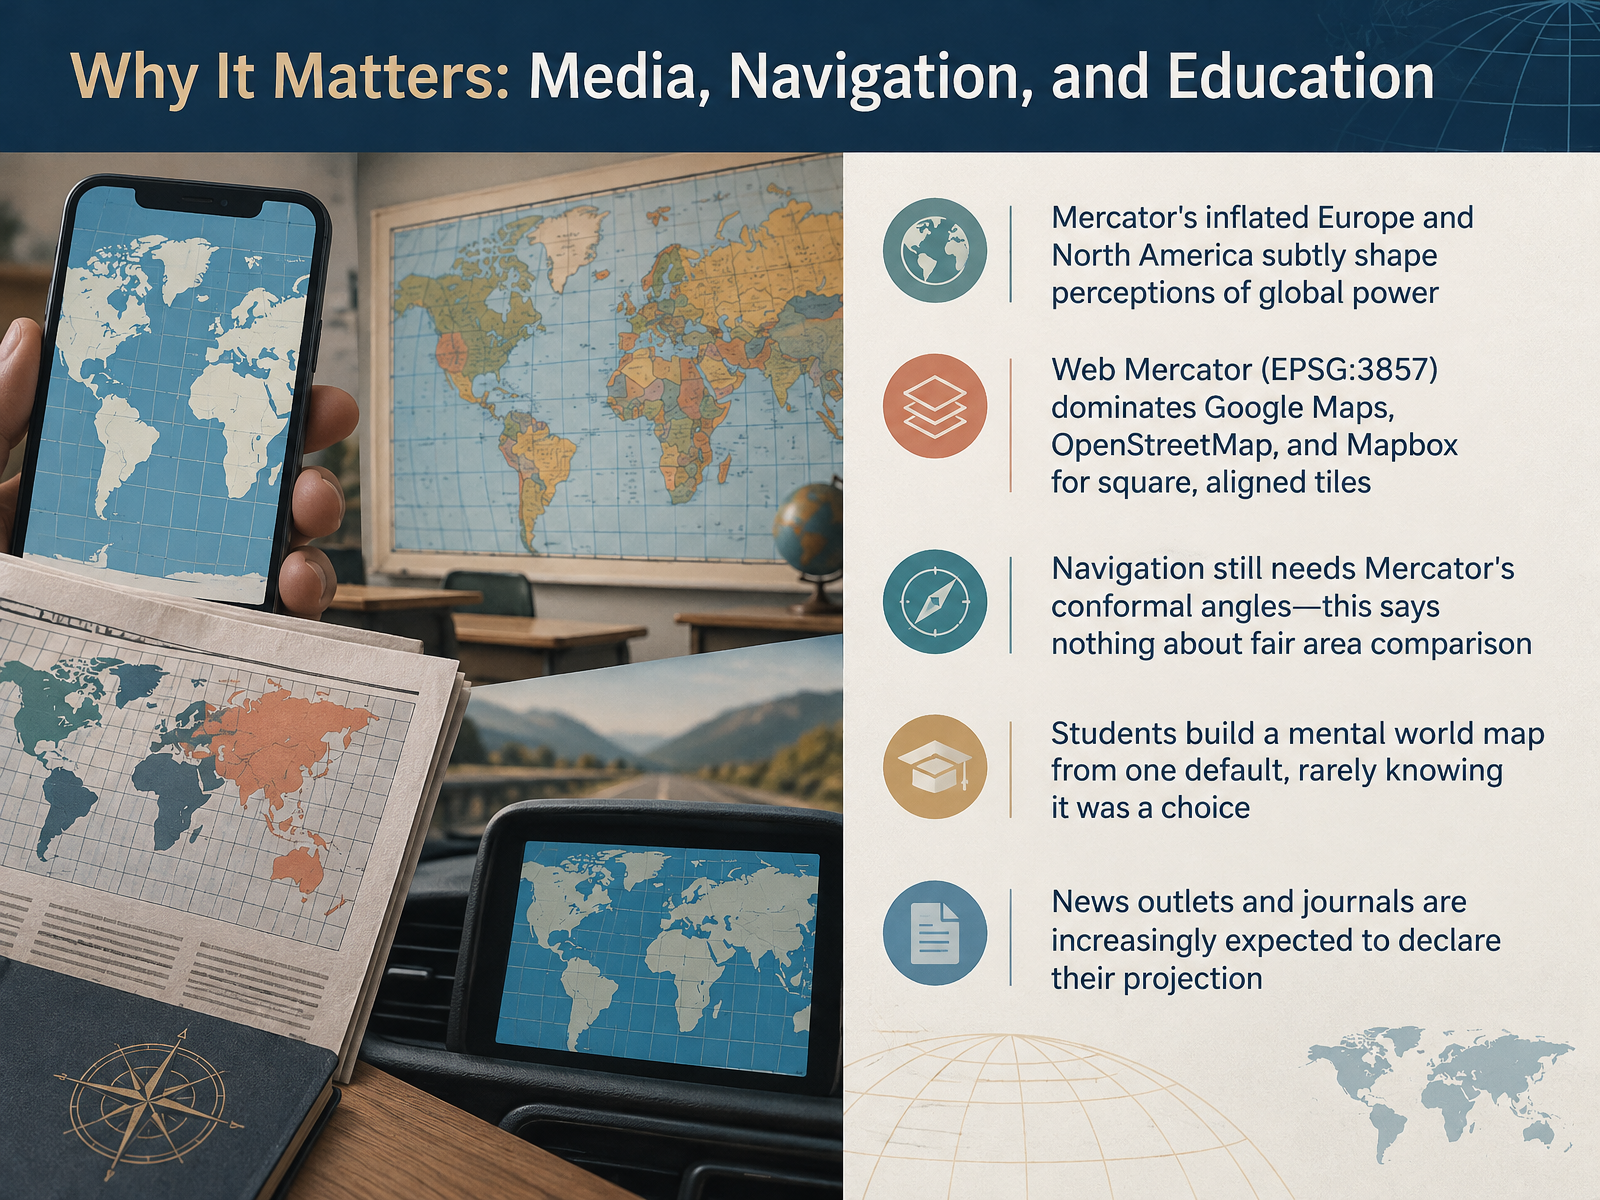
- 09Why It Matters: Media, Navigation, and EducationSo why does all this matter in practice? Because projection choices quietly shape what millions of people believe about the world. The classic Mercator map inflates Europe and North America, subtly suggesting those regions are larger, and perhaps more important, than they really are. Meanwhile, the web maps on your phone use Web Mercator, identified as EPSG three eight five seven, the default for Google Maps, OpenStreetMap, and Mapbox. It became the standard because it produces square tiles that align neatly at every zoom level. And here is the key trade off. Navigation still needs Mercator because it preserves angles, which keeps roads and routes at the right shape. That says nothing about comparing areas fairly. In classrooms, students build a mental world map from one default they rarely know was a choice. And increasingly, news outlets and journals are expected to declare which projection they used. So the takeaway is simple. Every map is a decision, not a neutral window. Next, we will look at ethics and responsibility in map design.
 2 min
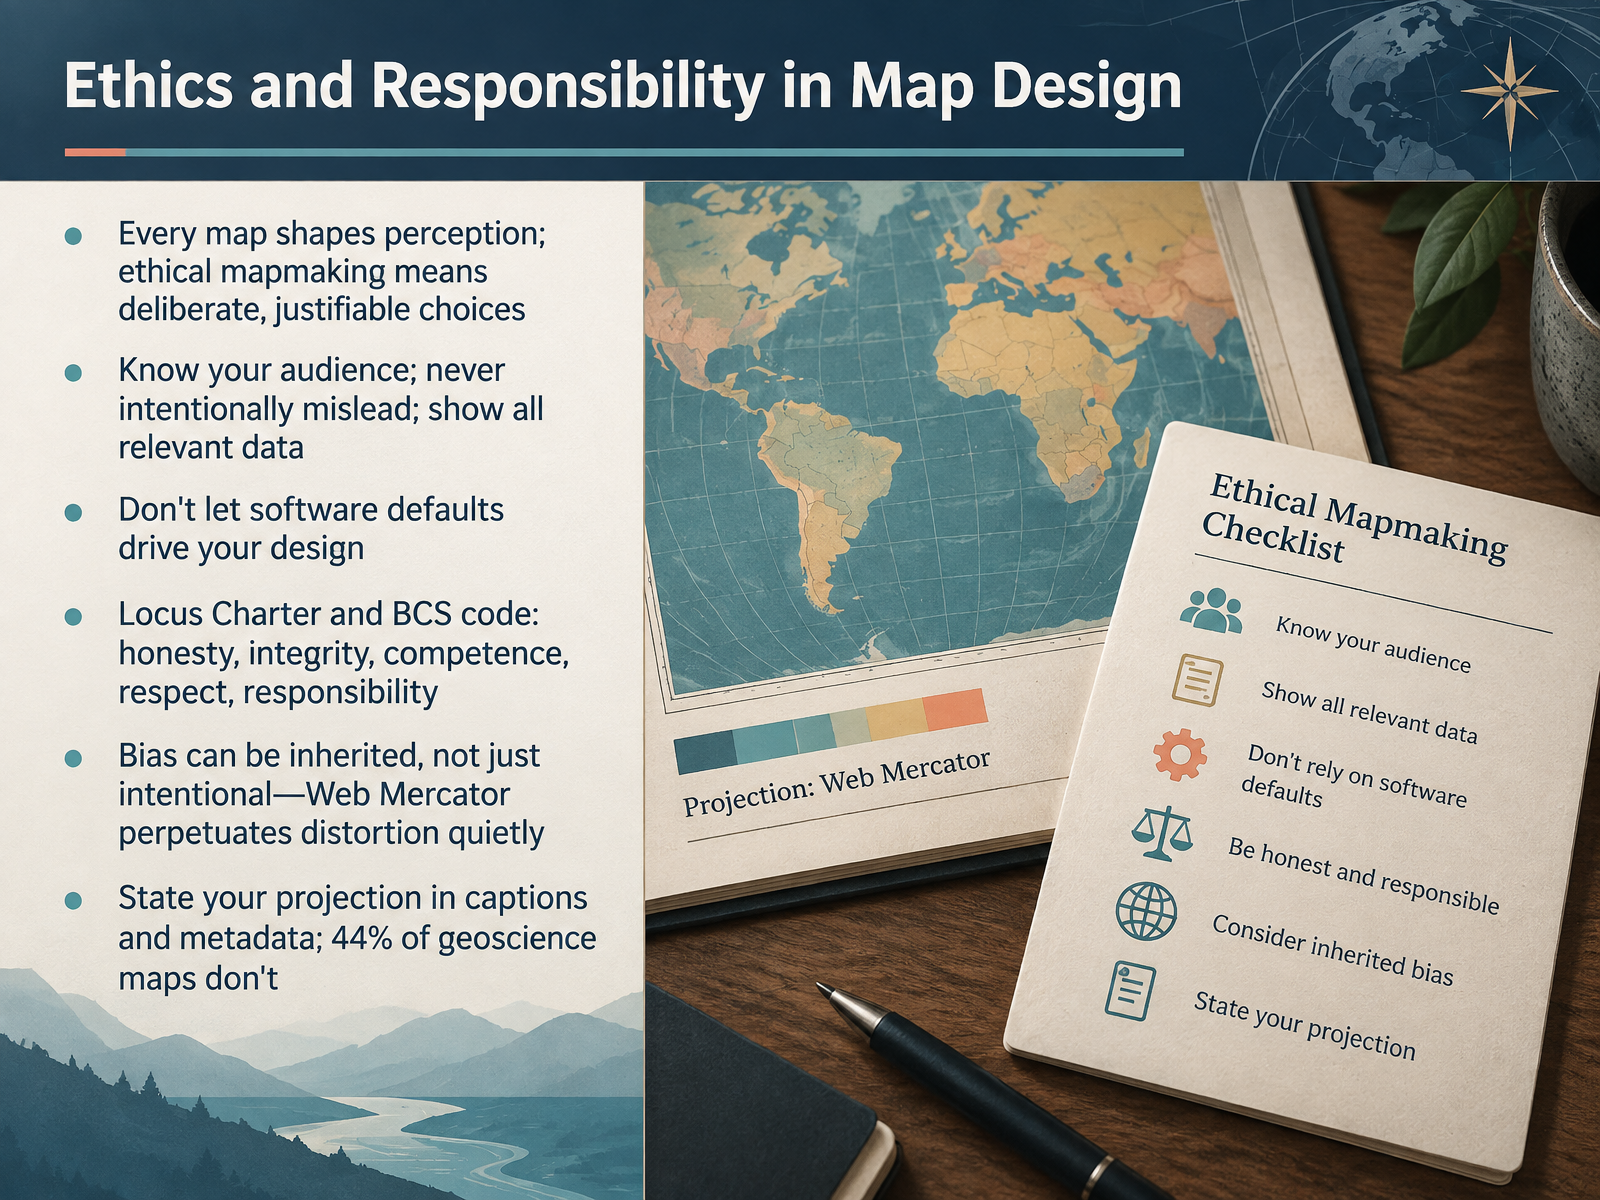
- 10Ethics and Responsibility in Map DesignNow let's talk about ethics and responsibility in map design. Every map shapes perception, so ethical mapmaking means making deliberate, justifiable choices. Know your audience. Never intentionally mislead. And show all relevant data. Here's the key trade-off: convenience versus honesty. Don't let software defaults drive your design, because defaults often carry inherited bias. Take Web Mercator. It is the default in many web tools, and it quietly inflates high-latitude areas, like Greenland. That distortion spreads without anyone intending it. Professional codes, such as the Locus Charter and the British Cartographic Society code, emphasize honesty, integrity, competence, respect, and responsibility. And a survey of geoscience maps found that forty-four percent never state their projection. So always name your projection in captions and metadata. That simple step makes your map transparent, repeatable, and trustworthy. Next, we'll put this into practice in Hands-On: Choosing the Right Projection for the Job.
 2 min
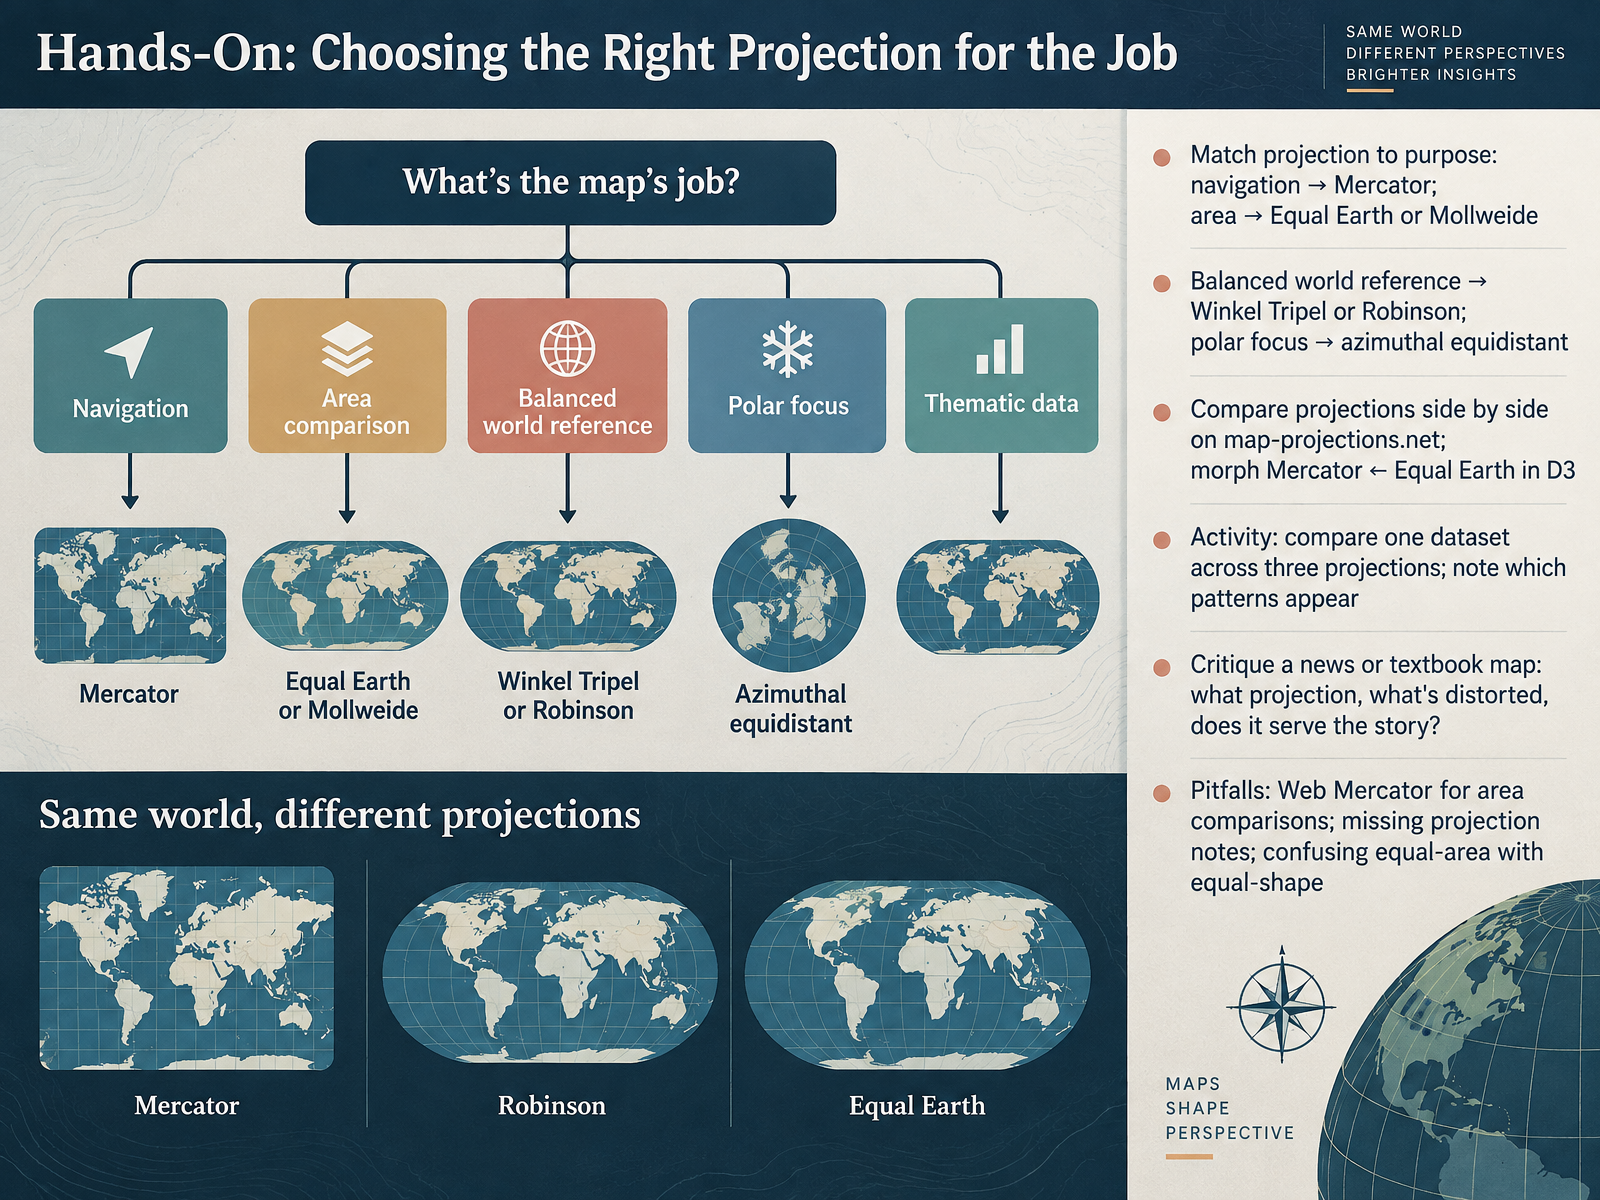
- 11Hands-On: Choosing the Right Projection for the JobNow let's put this into practice. How do you actually choose the right projection for a job? Start with the purpose. If the map is for navigation, like marine charts or your phone's routing, Mercator is the natural fit, because straight lines keep a constant compass bearing. If the point is comparing area, say country sizes or forest cover, reach for an equal-area projection like Equal Earth or Mollweide. For a balanced world reference, Winkel Tripel or Robinson works well, and for polar work, azimuthal equidistant keeps distances from the pole accurate. Here's a simple way to build intuition. On map-projections dot net you can compare any two projections side by side, and in D three you can even animate a morph between Mercator and Equal Earth and watch shapes and areas trade off. So try this activity: take one dataset, such as population density, and draw it three ways. Notice which patterns stay stable and which change. Then critique a news or textbook map. Ask what projection it uses, what's distorted, and whether that distortion serves the story. Finally, watch for a few pitfalls: using Web Mercator for area comparisons, leaving projection notes off your map, and confusing equal-area with equal-shape. Next, let's see these ideas at work in a real redesign.
 education.nationalgeographic.orgen.wikipedia.orgexa.ai+22 min
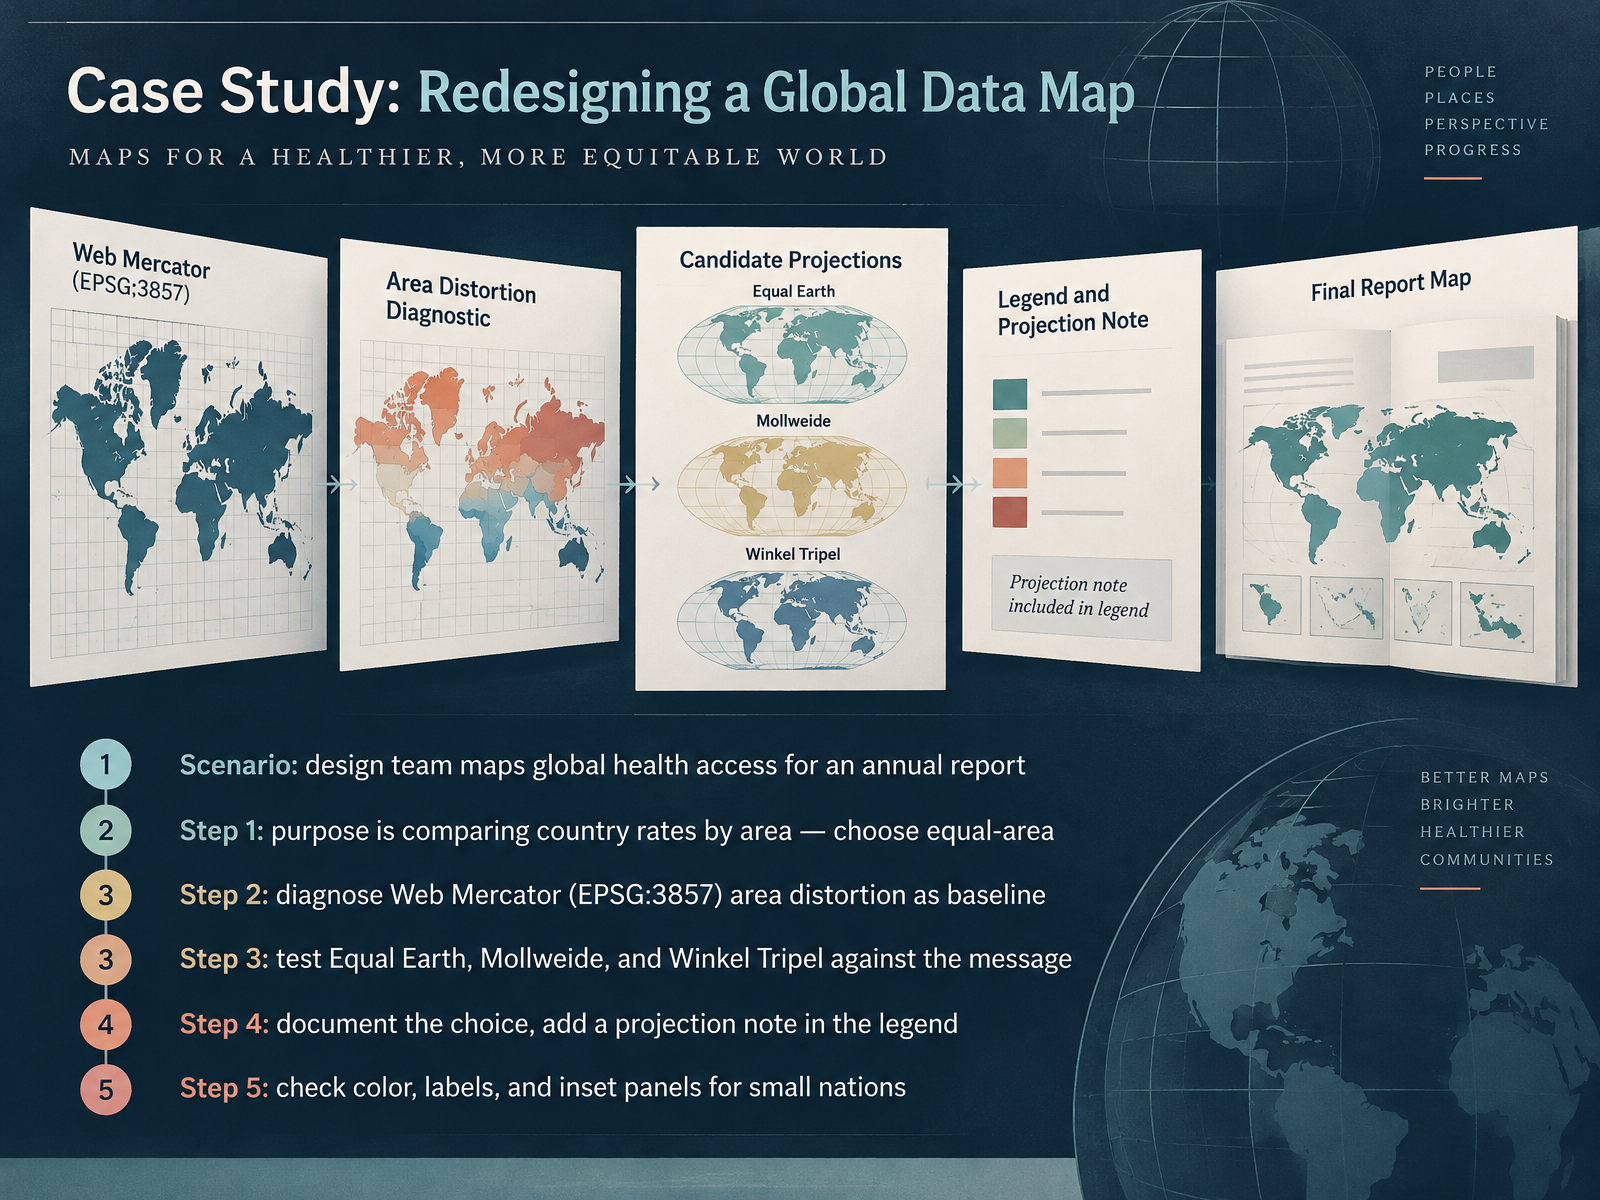
- 12Case Study: Redesigning a Global Data MapLet's walk through how a projection decision actually gets made with a real-world case study. Picture a design team preparing an annual report on global health access. The map's purpose is comparing rates across countries by area, so they need an equal-area projection. Step one: they diagnose their default. Web Mercator, known as EPSG thirty-eight fifty-seven, inflates high-latitude regions, so places like Greenland look far larger than they really are. That makes it a poor baseline when area matters. Step two: they test candidates. They compare Equal Earth, Mollweide, and Winkel Tripel against the message, weighing which distortions they can live with. Here's the key trade-off: equal-area projections preserve relative size but stretch shapes, especially near the edges. Step three: they document the choice and add a projection note in the legend, so readers know what they're seeing and why. Step four: they check color, labels, and inset panels so small nations stay visible rather than vanishing at that scale. Next, let's clear up some common misconceptions and how to address them.
 education.nationalgeographic.orgen.wikipedia.orgexa.ai+22 min
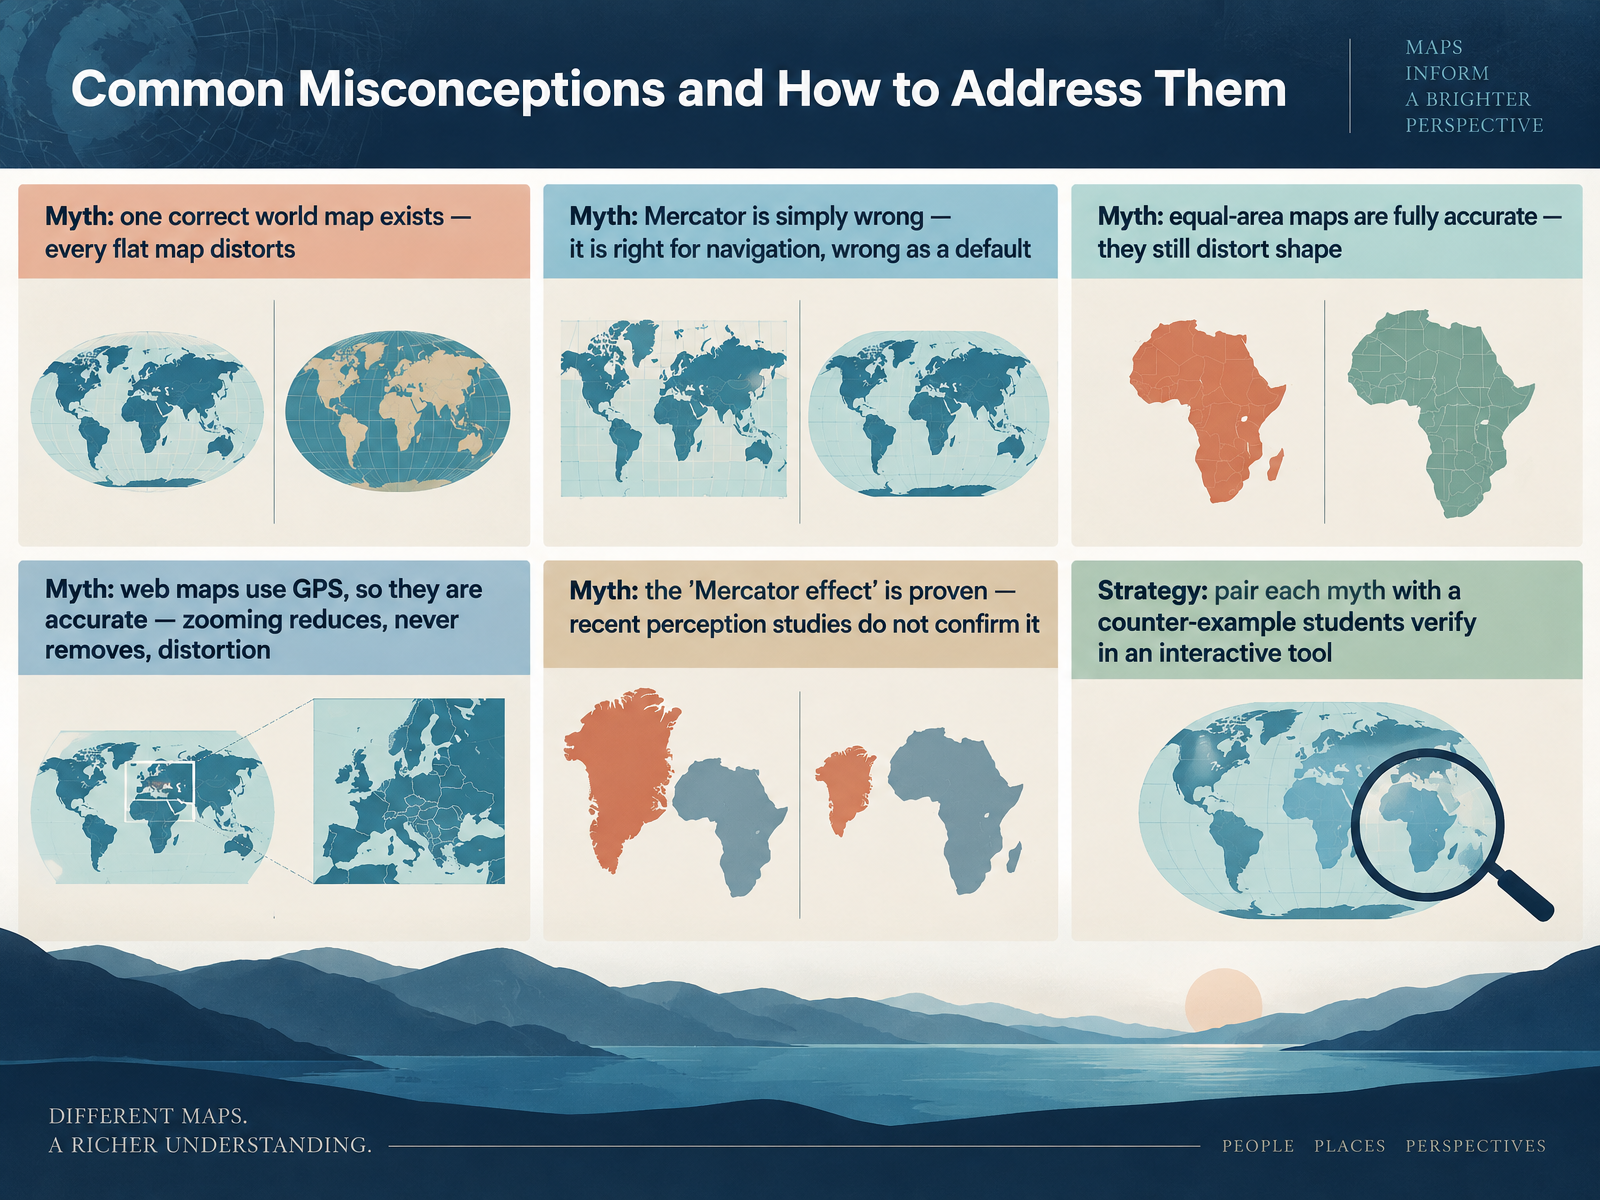
- 13Common Misconceptions and How to Address ThemLet's clear up some common misconceptions about world maps. First, there is no single correct flat map. Every one distorts something, because a sphere simply cannot be flattened without trade-offs. Second, Mercator is not simply wrong. It is genuinely right for navigation, because it keeps compass bearings straight. It becomes wrong when we treat it as the default for comparing country sizes. Third, equal-area maps are not fully accurate either. They fix area, but they still bend and shear shapes, especially near the poles. Fourth, web maps like Google Maps are not automatically accurate just because they use satellite positioning. Zooming in reduces distortion, but it never removes it. And fifth, the so-called Mercator effect is often stated as proven, but recent perception studies have not confirmed it, so we should be careful about overclaiming. Here is a practical strategy. Pair each myth with a counter-example that students check themselves in an interactive tool, such as dragging Greenland onto Africa. Seeing it firsthand is far more convincing than being told. Coming up next, Key Takeaways and Further Exploration.
 youtube.comsites.lsa.umich.eduen.wikipedia.org+22 min
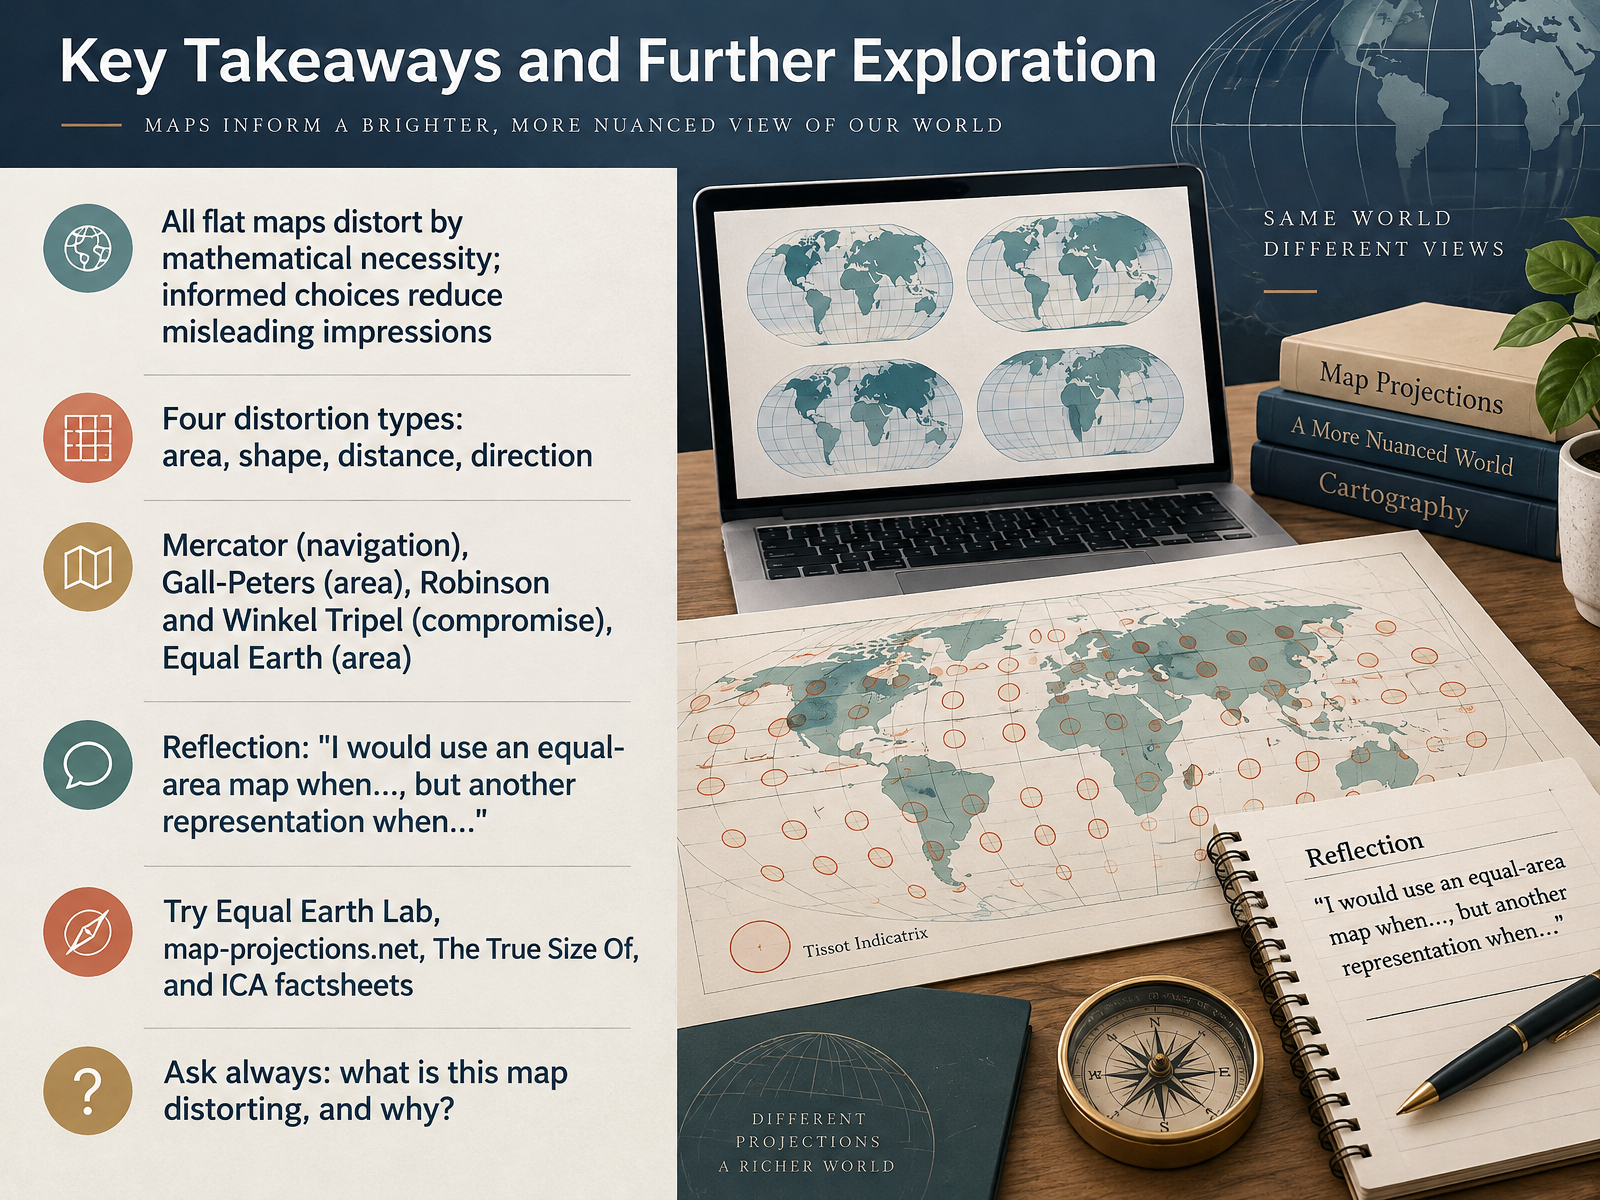
- 14Key Takeaways and Further ExplorationLet's bring it all together. Every flat map distorts by mathematical necessity. A globe is the only truly accurate model, but flat maps are too useful to abandon, so informed choices are what reduce misleading impressions. Remember the four distortion types: area, shape, distance, and direction. No projection preserves all four at once. Mercator remains excellent for navigation because straight lines show constant compass bearing. Gall-Peters and Equal Earth preserve area. Robinson and Winkel Tripel compromise, balancing size and shape, which is why Winkel Tripel has long been used by National Geographic. Now try the reflection for yourself. I would use an equal-area map when comparing the true size of countries, but another representation when planning a journey. To explore further, visit Equal Earth Lab, map-projections.net, The True Size Of, and the International Cartographic Association factsheets. And ask always: what is this map distorting, and why? That question turns you from a map reader into a map thinker. Thank you for joining this course. Keep looking at maps with curiosity, and keep asking better questions.
 education.nationalgeographic.orgen.wikipedia.orgexa.ai+22 min
Take the deck with you
Download this course as a file — free, no sign-up needed.
- PDF handoutEvery slide page, ready to print or share.15 pages · 5.0 MBDownload
- Narrated PowerPointThe deck that presents itself — every slide carries the digital human's narration video.15 pages · 17.1 MBDownload
- PowerPoint slidesThe full deck as a .pptx — open it in PowerPoint, Keynote, or Google Slides.15 pages · 5.0 MBDownload
Free to use in your own training — please keep the PersonWise credit page at the end.
Have your own deck? Turn it into a course
Sources consulted
Web sources consulted while building this course.
- Why all world maps are wrong — youtube.com
- Why Your View of the World May be Completely Wrong — sites.lsa.umich.edu
- Mercator projection — en.wikipedia.org
- Every Flat Map Is Wrong, and There's a Theorem That Proves It | Map Real Size — maprealsize.com
- Every Map Projection Has a Breaking Point — youtube.com
- Tissot's indicatrix helps illustrate map projection distortion — esri.com
- Measuring and Visualizing Areal Distortion using Tissot’s Indicatrix – State Cartographer's Office – UW–Madison — sco.wisc.edu
- 4. Scale Variation and Angular Distortion | Eu, Mircea — neacsu.net
- Visualize Spatial Error Using Tissot Indicatrices - MATLAB & Simulink — mathworks.com
- Tissot's indicatrix · Cartographic Projection — cartographic-projection.com
- The Three Main Families of Map Projections - MATLAB & Simulink — mathworks.com
- 29. Classifying Projection Methods | The Nature of Geographic Information — courses.ems.psu.edu
- ICA course on Toponymy — unstats.un.org
- Projections | Intergovernmental Committee on Surveying and Mapping — icsm.gov.au
- 2.3 What are Map Projections? | GEOG 160: Mapping our Changing World — e-education.psu.edu
- Selecting a Map Projection — education.nationalgeographic.org
- List of map projections — en.wikipedia.org
- Evaluating map projection efficiency for large-area representation: a comparative analysis using tissot’s indicatrix — exa.ai
- Robinson vs. Winkel Tripel — map-projections.net
- 28. Geometric Properties Preserved and Distorted | The Nature of Geographic Information — courses.ems.psu.edu