Begin
14 pages · ~28 min
Satellite Image Interpretation
Learn to interpret satellite images of Earth in this training designed for remote sensing beginners, covering key techniques for analyzing imagery.
A digital instructor presents all 14 pages. Hold “Ask” at any point and ask out loud — the answer comes from this course. No sign-up needed.
What you’ll learn
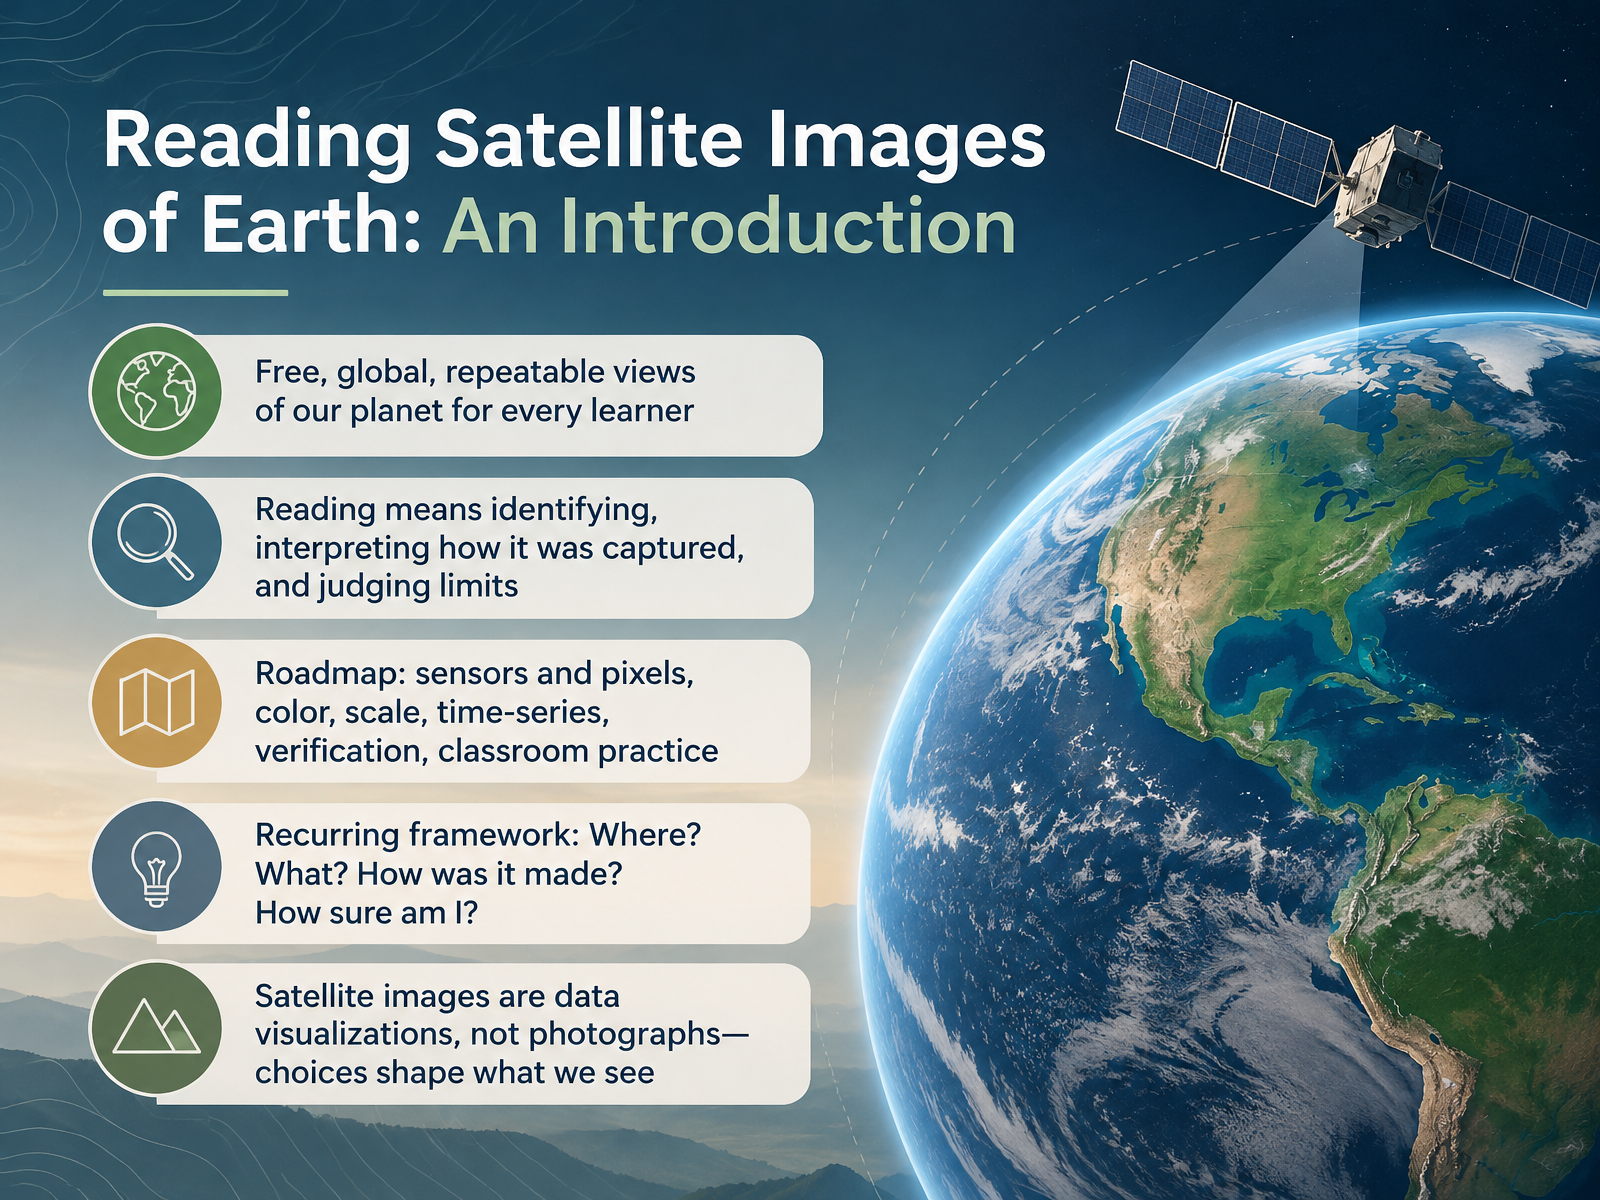
- 01Reading Satellite Images of Earth: An IntroductionWelcome. Today we begin learning to read satellite images of Earth. These images are free, global, and repeatable, so any learner can explore the same view again and again. Reading an image means three things. First, identifying what you see. Next, interpreting how the image was captured. And finally, judging its limits. Our roadmap covers sensors and pixels, color, scale, time series, verification, and classroom practice. Throughout, we will reuse one simple framework. Where? What? How was it made? And how sure am I? Keep this in mind: a satellite image is a data visualization, not a photograph. Human choices shape what we see. Let's look closely, describe the evidence, and only then draw conclusions. Next, we turn to how a satellite image is made, looking at sensors, orbits, and light.science.nasa.govmynasadata.larc.nasa.govclimatedetectives.esa.int+22 min
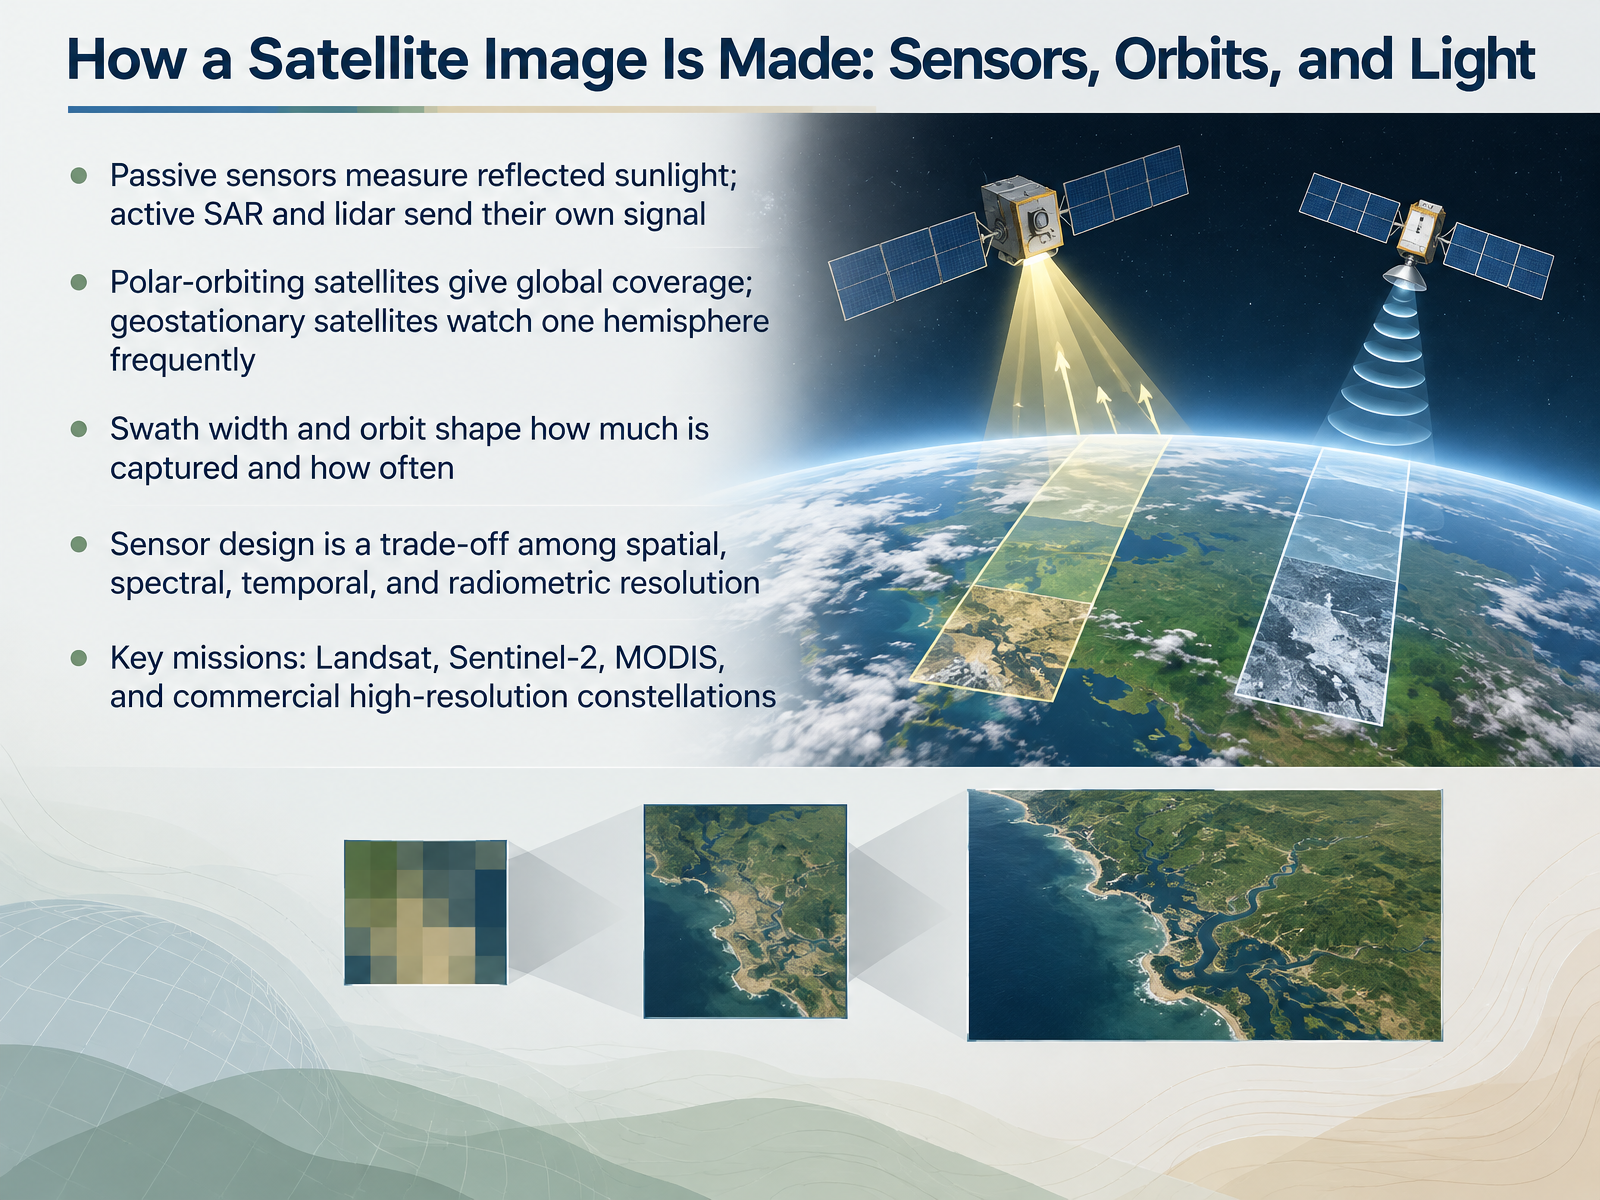
- 02How a Satellite Image Is Made: Sensors, Orbits, and LightNow let's look at how a satellite image is actually made. It starts with light and sensors. Passive sensors, like the ones on Landsat, measure sunlight reflected from Earth's surface. Active sensors, such as SAR and lidar, send out their own signal and measure what comes back. Next, consider the orbit. Polar-orbiting satellites circle from pole to pole and give global coverage. Geostationary satellites stay over one spot and watch a hemisphere frequently. Swath width, the strip of ground the sensor sees at once, and the orbit shape together control how much is captured and how often. Notice that sensor design is always a trade-off among four kinds of resolution: spatial, spectral, temporal, and radiometric. For example, MODIS sees a wide area every day, while commercial high-resolution satellites show fine detail but revisit less often. Keep Landsat and Sentinel-2 in mind as familiar workhorses. So the key takeaway is that every image reflects a set of engineering choices. Next, we will unpack those four kinds of resolution in more detail, in Four Kinds of Resolution: What 'High Resolution' Really Means.
 1 min
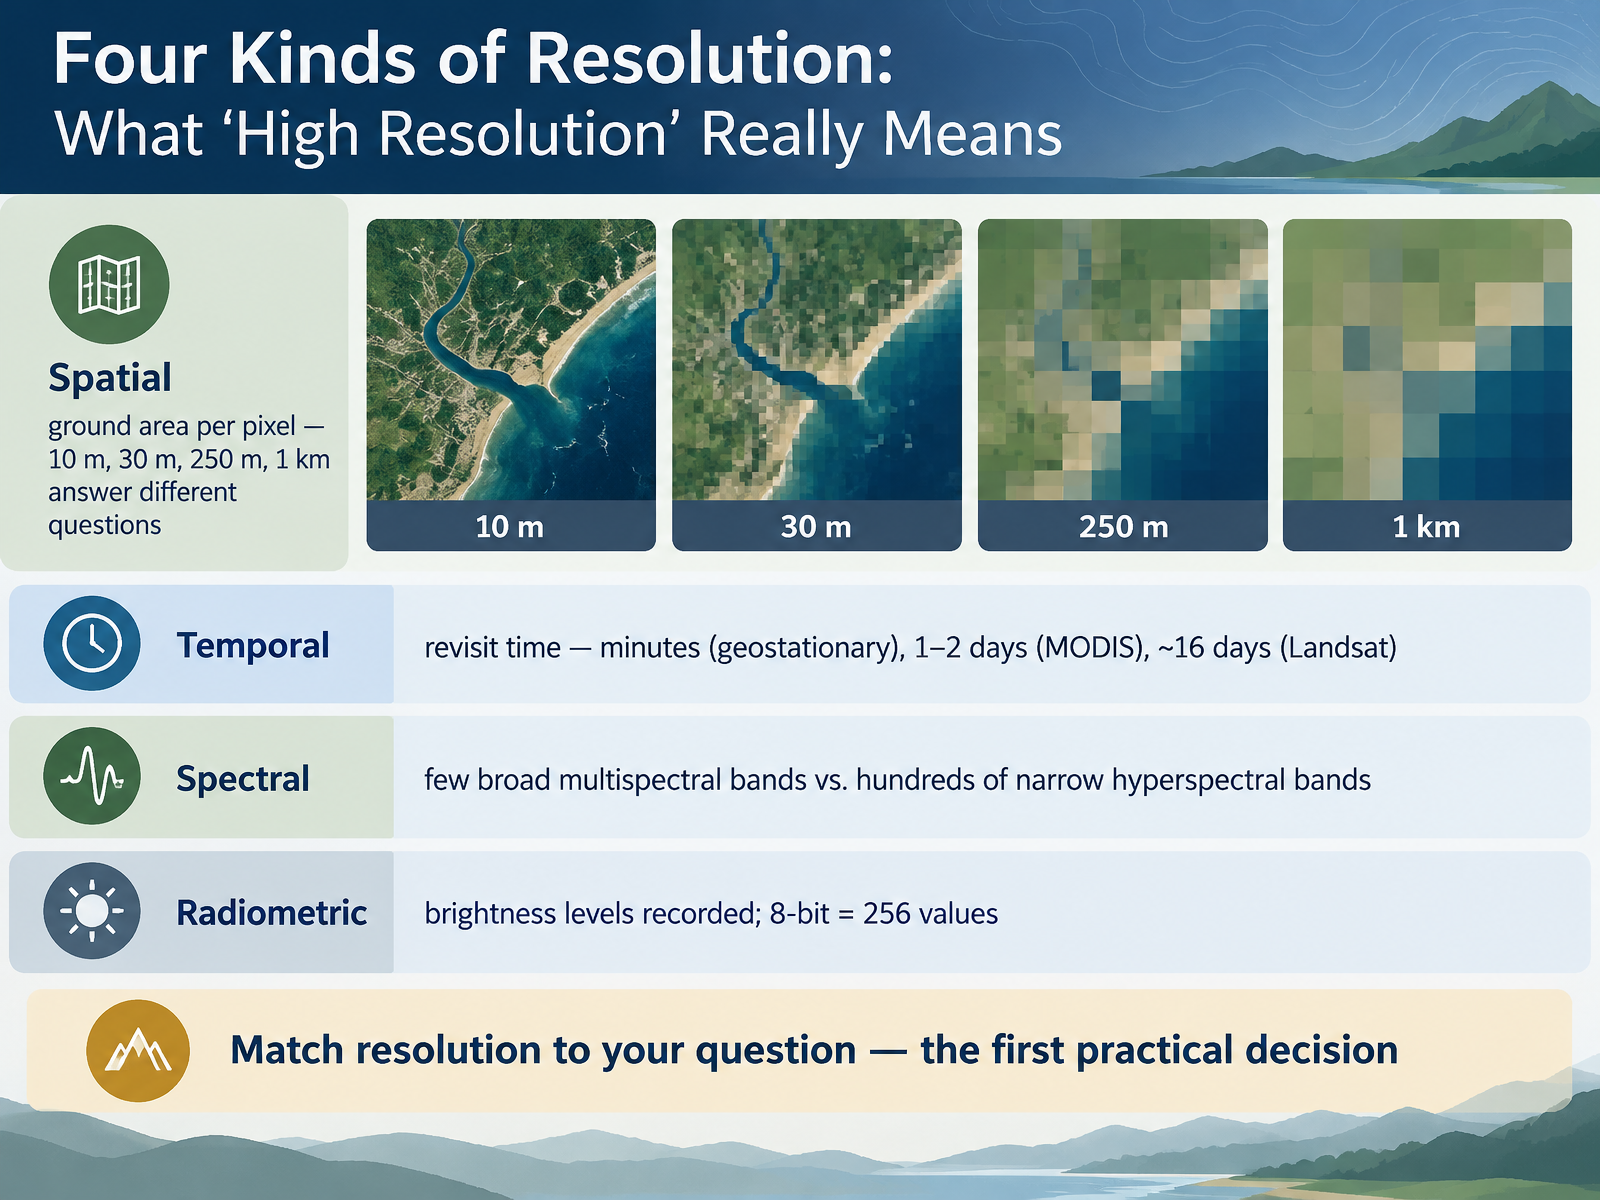
- 03Four Kinds of Resolution: What 'High Resolution' Really MeansNext, let's look at what high resolution really means. It's not one number, but four kinds of resolution working together. First, spatial resolution is the ground area each pixel covers. A ten meter pixel shows a field. A one kilometer pixel shows a whole region. Next, temporal resolution is how often the satellite returns. Geostationary satellites look every few minutes. MODIS revisits in one to two days. Landsat repeats about every sixteen days. Then, spectral resolution describes the number of wavelength bands. Multispectral sensors have a few broad bands. Hyperspectral sensors have hundreds of narrow bands. Finally, radiometric resolution is how many brightness levels are recorded. Eight bit data gives two hundred fifty six values. So match resolution to your question. That's the first practical decision. Next, we'll see how color choices reveal even more, in True Color and False Color: Reading Beyond the Visible.
 1 min
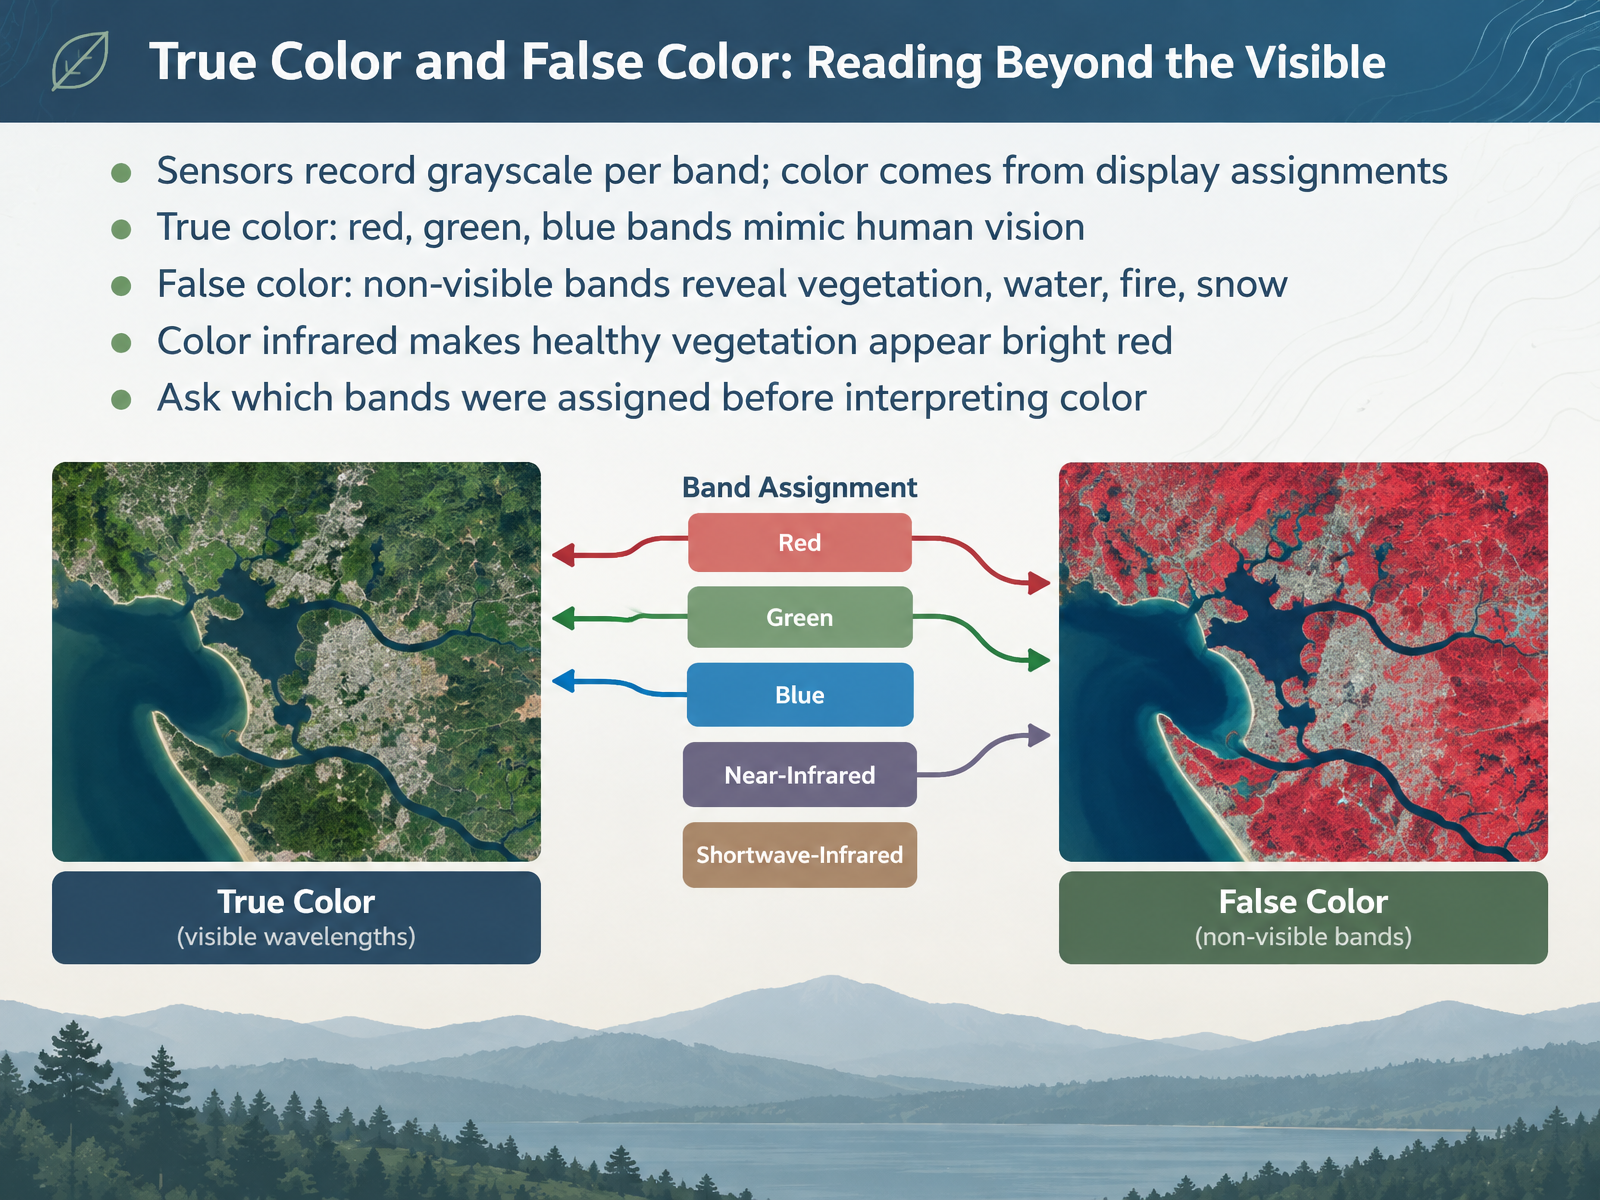
- 04True Color and False Color: Reading Beyond the VisibleNext, let's look at how color works in satellite images. First, remember that sensors record each band as grayscale. Color comes from how we assign those bands on a display. True color uses the red, green, and blue bands, which mimic human vision. So the image looks close to what your eyes would see. False color assigns non-visible bands, such as near infrared, to red, green, or blue. This reveals things our eyes miss, like vegetation health, water bodies, fire scars, and snow. Notice that in color infrared, healthy vegetation appears bright red. Before you interpret any color, ask which bands were assigned. That tells you what the colors actually mean. Coming up next, we'll explore visual interpretation using tone, texture, pattern, shape, and context.
 1 min
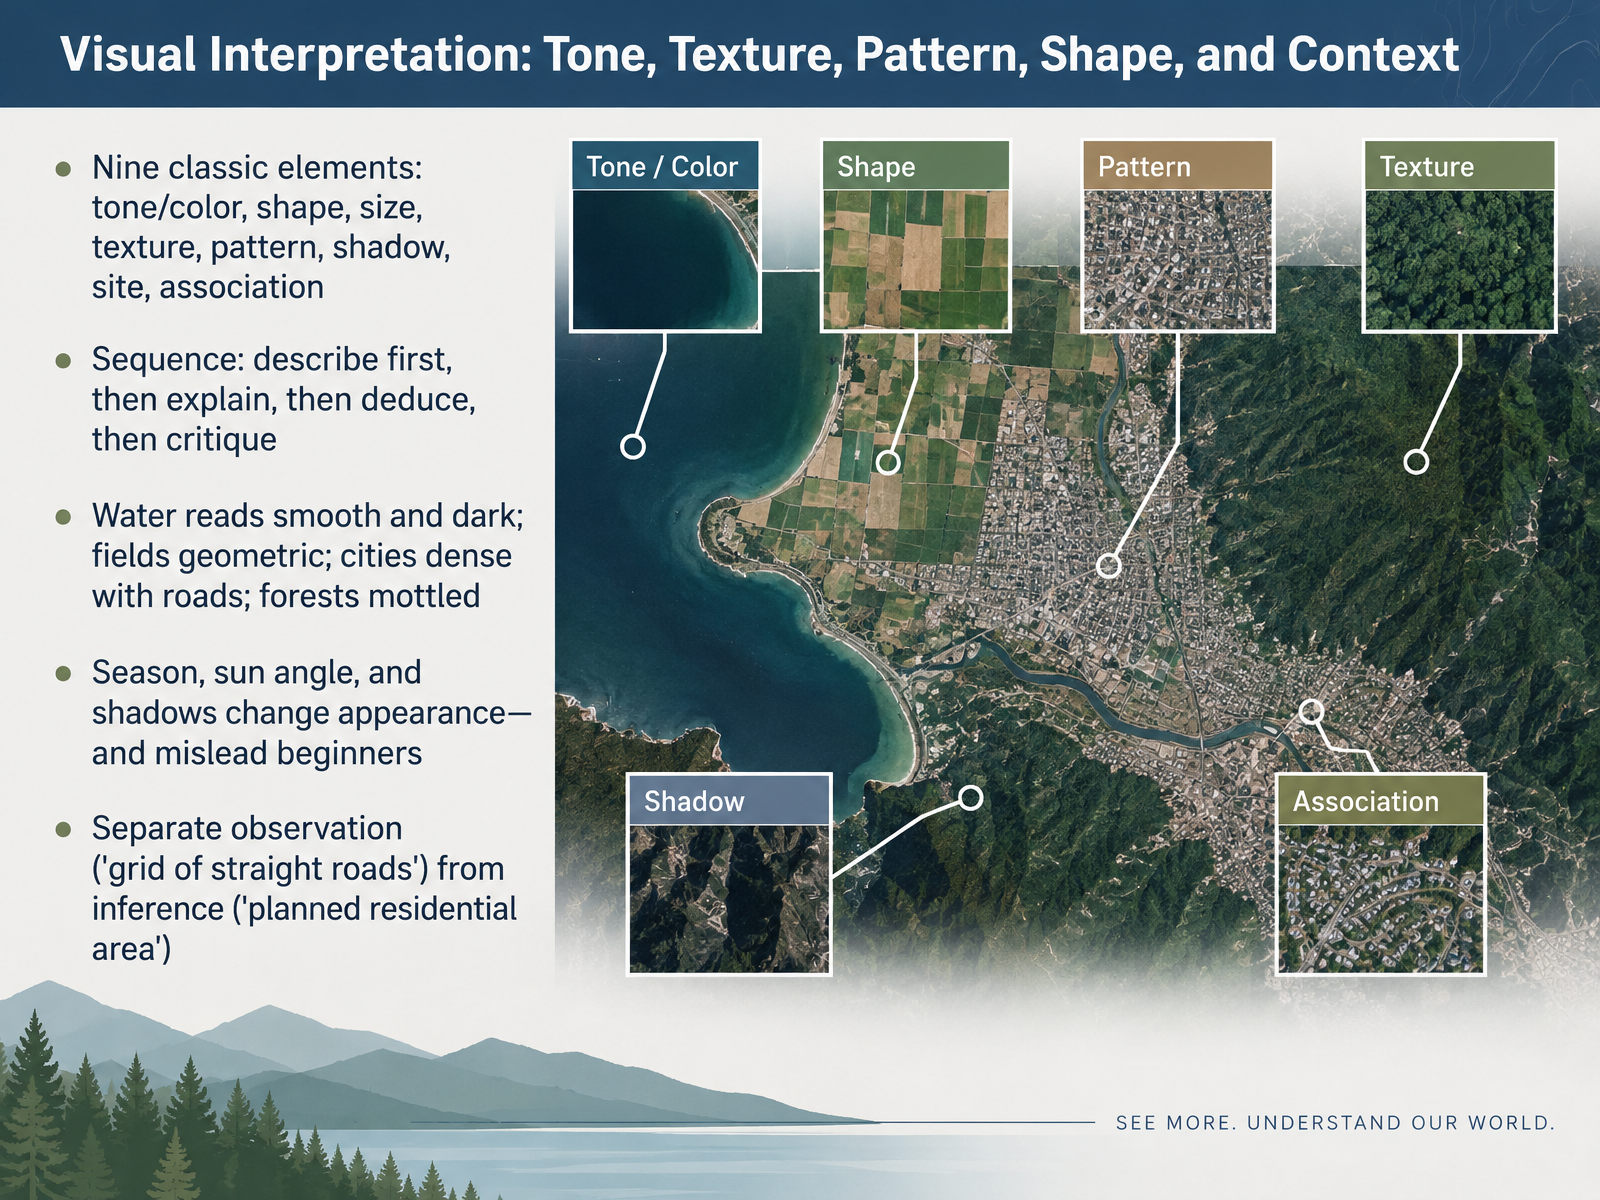
- 05Visual Interpretation: Tone, Texture, Pattern, Shape, and ContextLet's move on to visual interpretation. Think of nine classic elements: tone or color, shape, size, texture, pattern, shadow, site, and association. First, describe what you see. Next, explain it. Then deduce, and finally critique. Water reads smooth and dark. Fields look geometric. Cities are dense, with roads. Forests appear mottled. Notice that season, sun angle, and shadows can change appearance, and they often mislead beginners. So keep observation separate from inference. Say "a grid of straight roads" before you conclude "a planned residential area." Describe the evidence first, then explain. Next, we'll look at resolution, scale, and what an image can hide.
 1 min
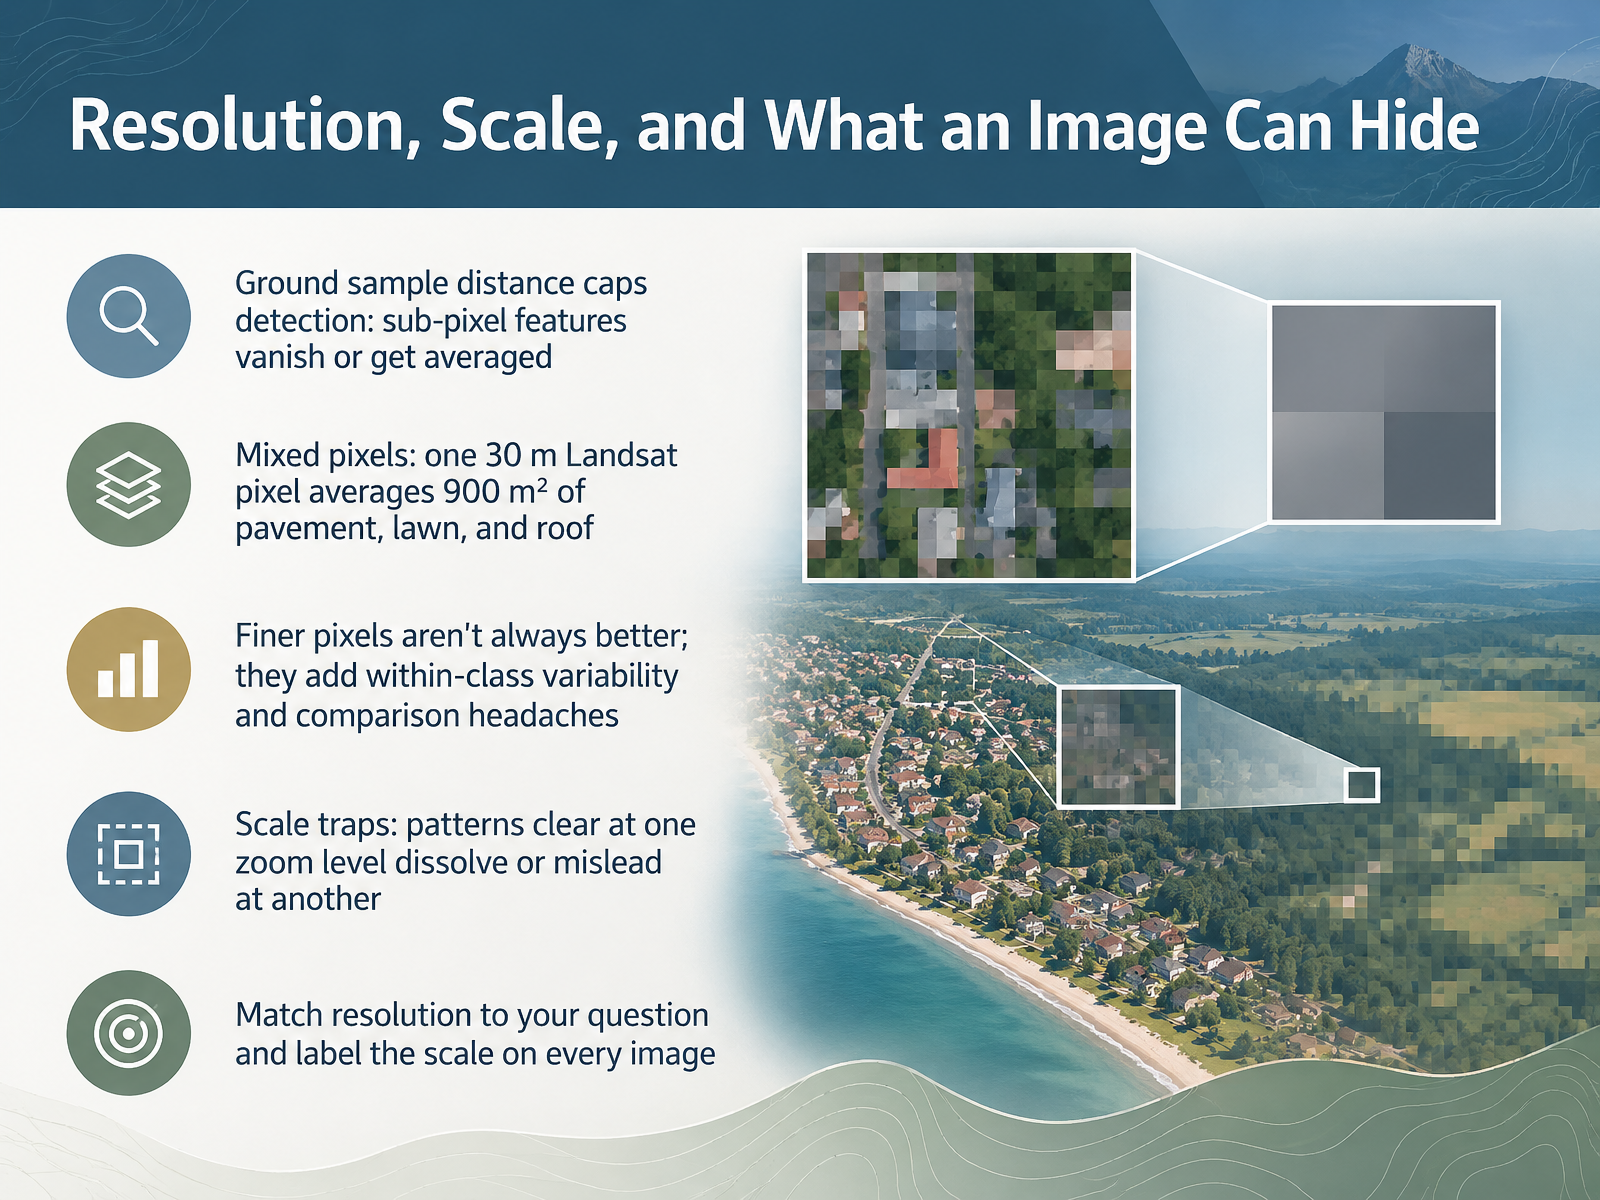
- 06Resolution, Scale, and What an Image Can HideNow let's look at resolution, scale, and what an image can hide. Resolution sets a limit on what you can detect. Ground sample distance is the size of the smallest area one pixel represents. Features smaller than a pixel either disappear or get averaged into their neighbors. Notice this: a single Landsat pixel at thirty meters covers nine hundred square meters, mixing pavement, lawn, and roof into one value. That is a mixed pixel. Finer pixels are not always better. They add variability within each class and make comparisons harder. Scale traps matter too. A pattern that looks clear at one zoom level can dissolve or mislead at another. So match resolution to your question, and label the scale on every image. Next, we turn to changes over time, separating real change from apparent change.
 1 min
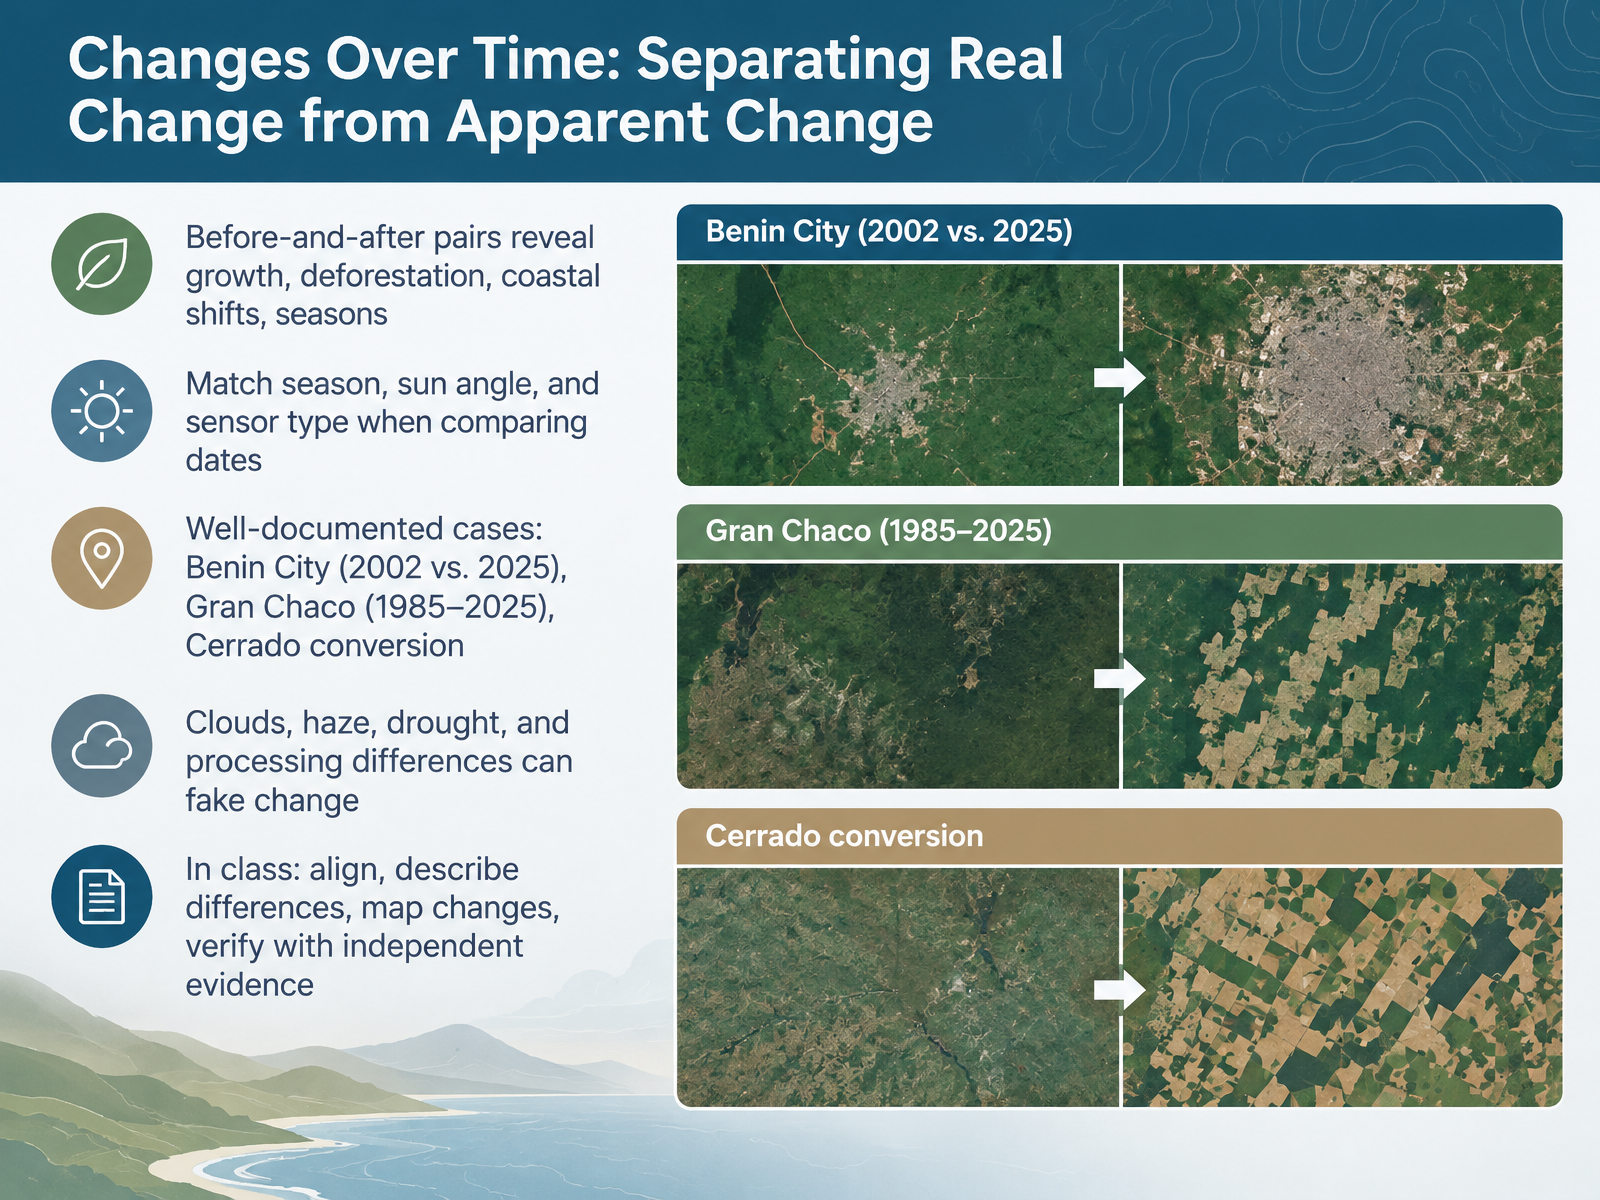
- 07Changes Over Time: Separating Real Change from Apparent ChangeNow let's look at changes over time, and how to separate real change from apparent change. Before-and-after image pairs are powerful. They can reveal city growth, deforestation, shifting coastlines, and seasonal cycles. But first, match the conditions. Compare images from the same season, with similar sun angle and the same sensor type. Otherwise, you may be seeing lighting or processing differences, not real change. Next, notice well-documented examples. Benin City, in Nigeria, shows striking urban growth between two thousand two and twenty twenty-five. The Gran Chaco, in South America, shows land conversion from nineteen eighty-five to twenty twenty-five. And the Cerrado, in Brazil, shows rapid agricultural conversion. Then check for false signals. Clouds, haze, drought, and different processing can fake change. In class, align the images, describe differences in color, shape, and location, map the changes, and verify with independent evidence. The key takeaway is this: describe the evidence before drawing conclusions. Next, we'll see where to find imagery and how to read its metadata.
 1 min
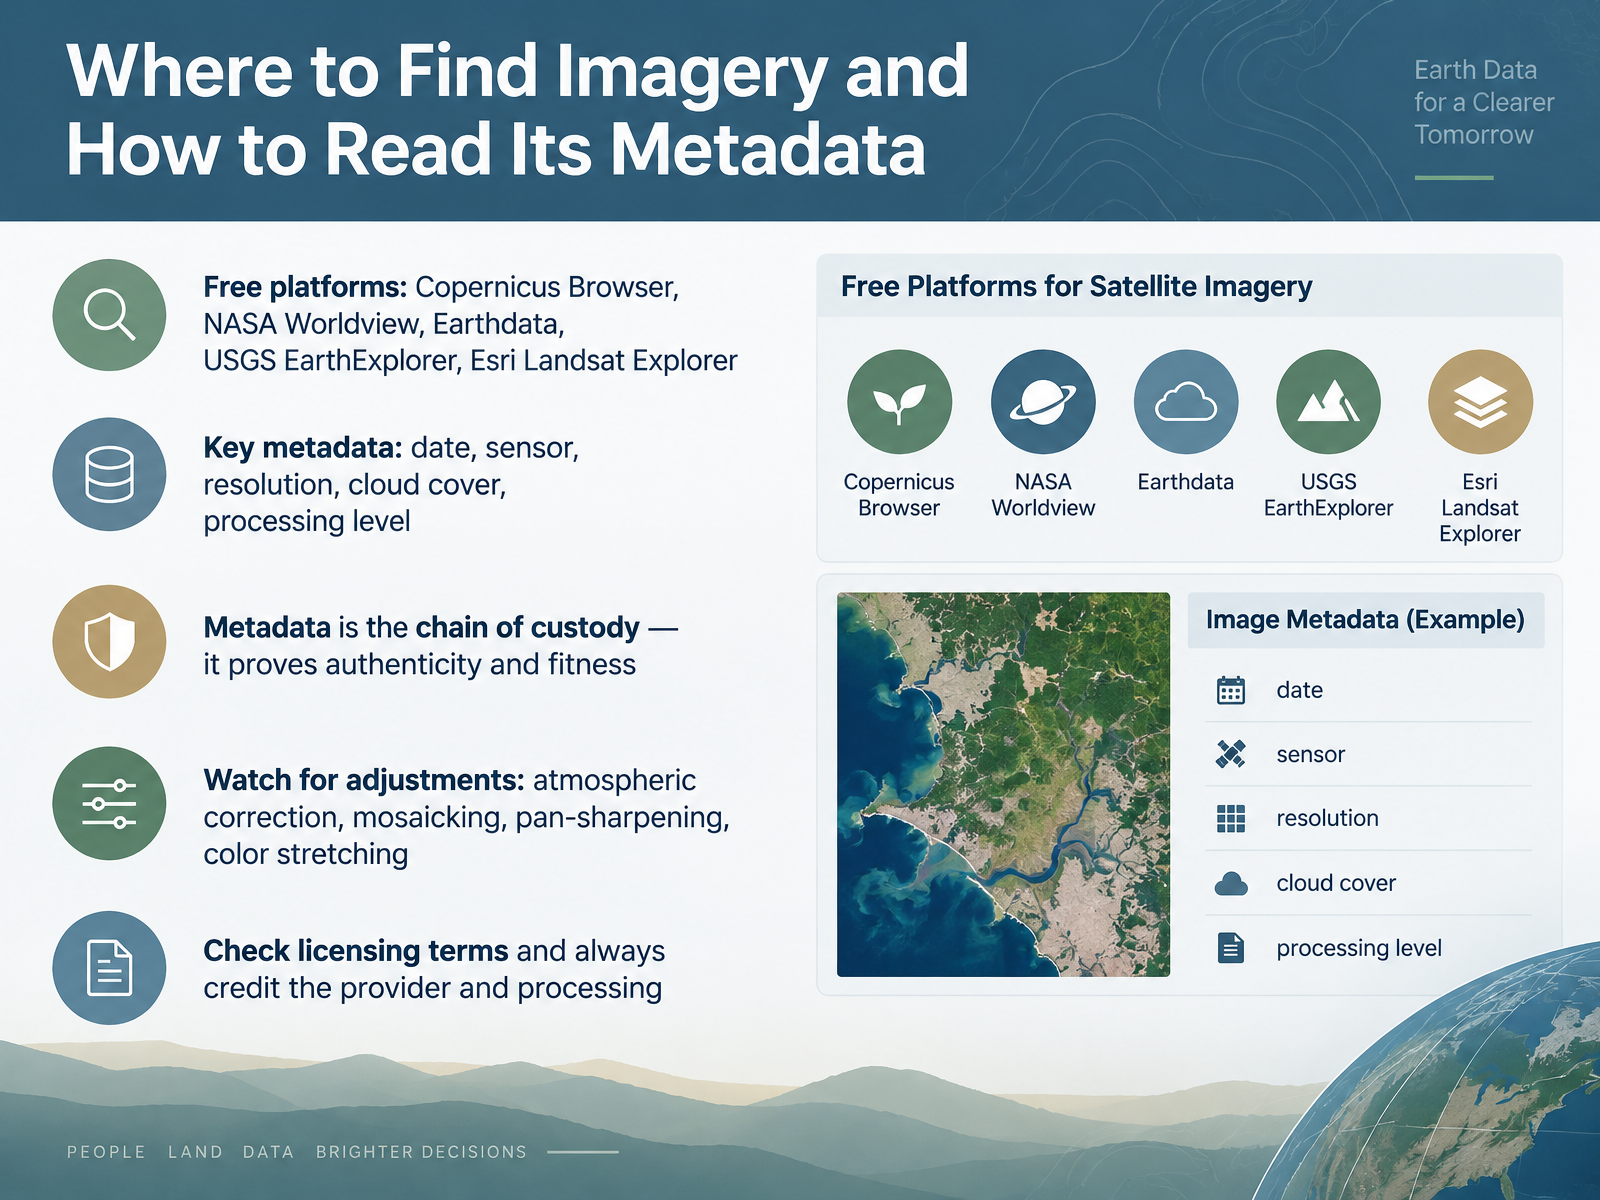
- 08Where to Find Imagery and How to Read Its MetadataNow that you know what to look for, let's talk about where to find imagery, and how to read its metadata. Several free platforms are reliable starting points. Try the Copernicus Browser, NASA Worldview, Earthdata, USGS EarthExplorer, or Esri Landsat Explorer. Before you trust an image, check its metadata. Look for five things: the date, the sensor, the resolution, the cloud cover, and the processing level. Think of metadata as a chain of custody. It proves the image is authentic and fit for your question. Also watch for adjustments such as atmospheric correction, mosaicking, pan-sharpening, and color stretching. These change how an image looks. Finally, check the licensing terms, and always credit the provider and the processing. Next, we move from interpretation to inquiry, and design image-based activities.
 1 min
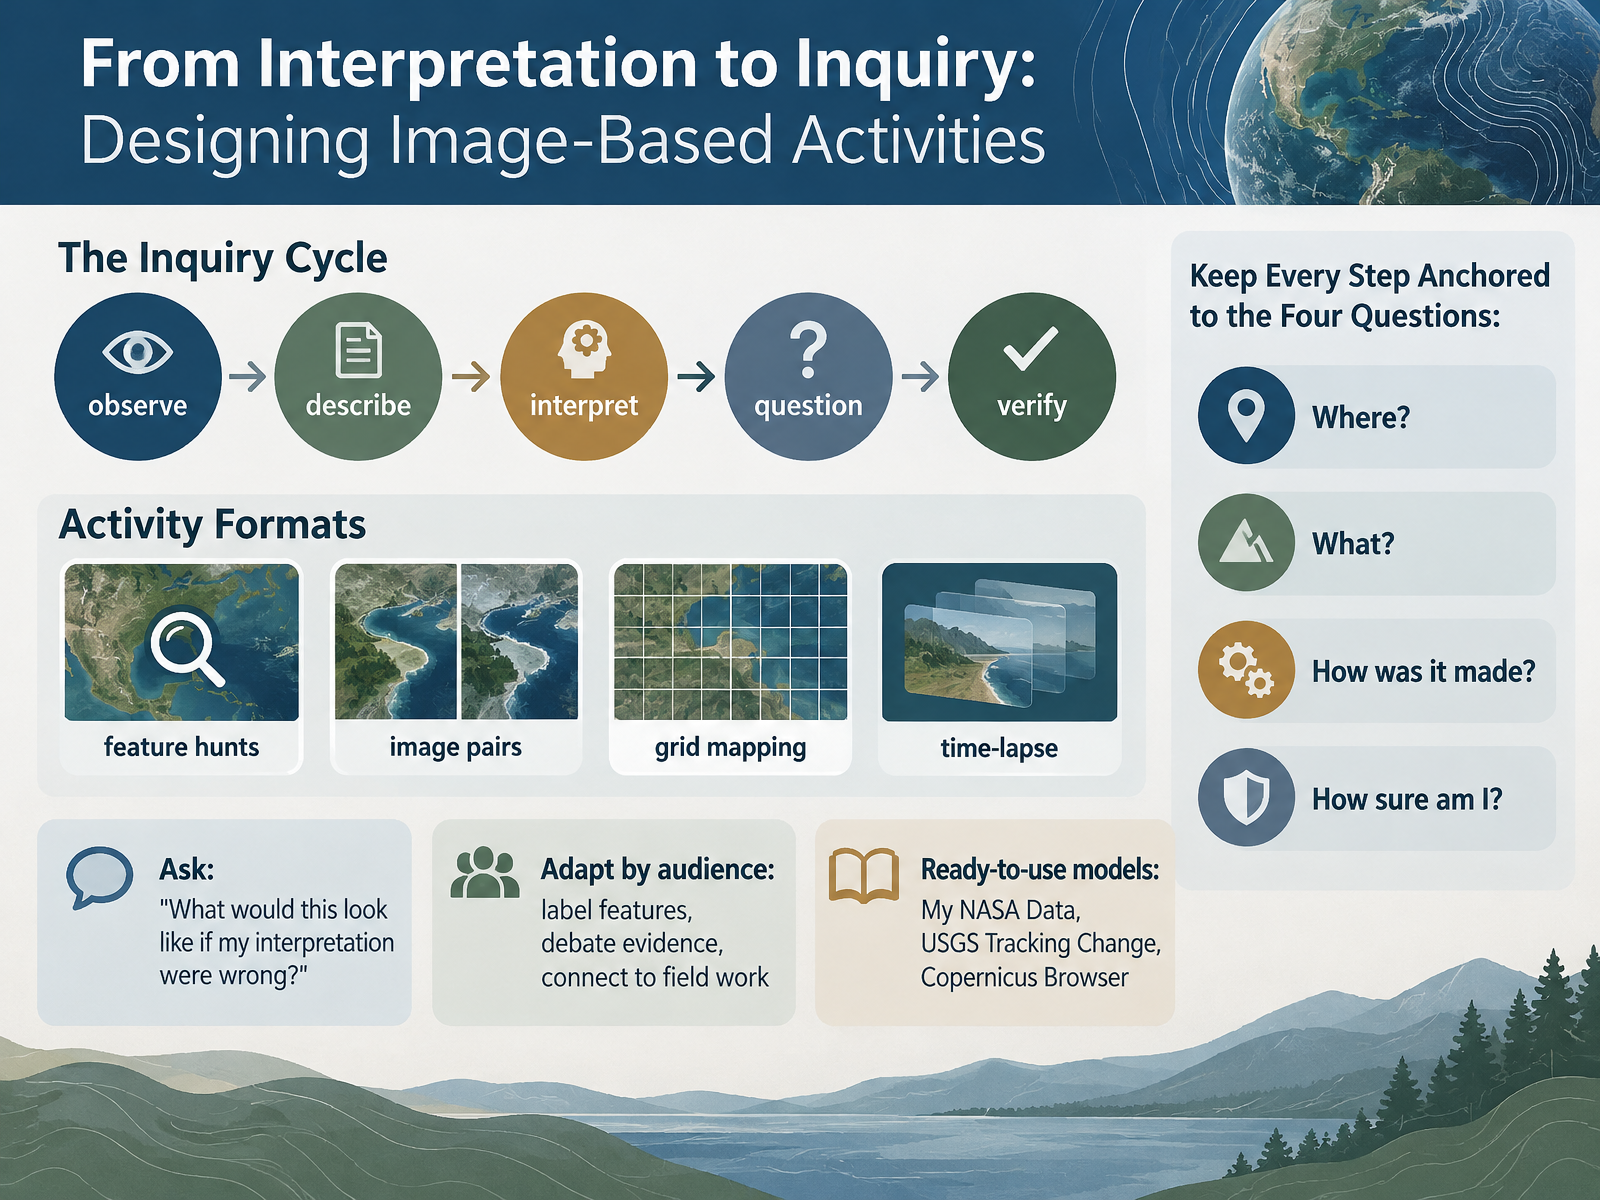
- 09From Interpretation to Inquiry: Designing Image-Based ActivitiesNow let's turn interpretation into inquiry. A simple cycle guides the work: observe, describe, interpret, question, and verify. You can build activities like feature hunts, image pairs, grid mapping, or time-lapse comparisons. With each one, ask a powerful check question: What would this look like if my interpretation were wrong? Then adapt to your audience. Beginners may label features, while advanced learners debate evidence or connect images to field work. Ready-to-use models include My NASA Data, USGS Tracking Change, and the Copernicus Browser. Keep every step anchored to four questions: Where? What? How? And how sure? Next, we'll look at common pitfalls and responsible interpretation.
 1 min
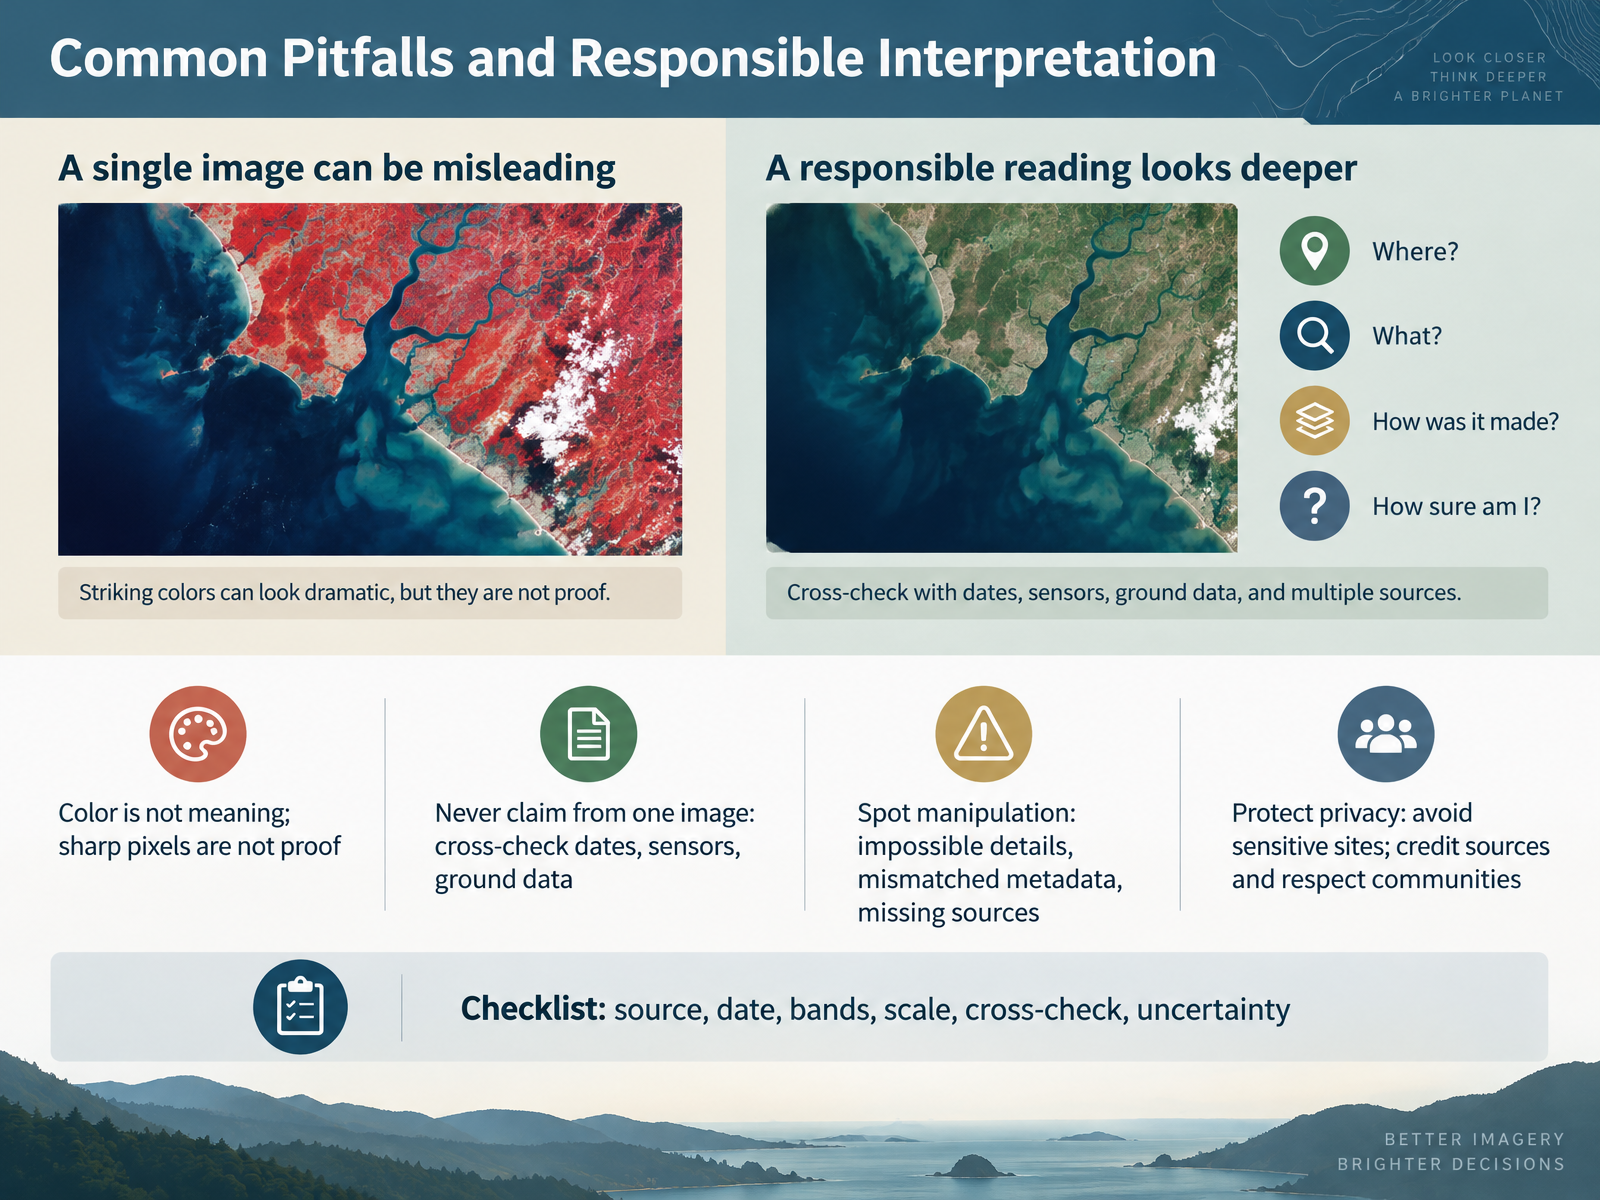
- 10Common Pitfalls and Responsible InterpretationNow let's talk about common pitfalls and responsible interpretation. First, color is not meaning, and sharp pixels are not proof. A bright red patch could be bare soil, a burn scar, or a processing choice, so describe what you see before you explain it. Next, never make a strong claim from a single image. Cross-check dates, sensor types, and ground data. If two images disagree, that gap is useful evidence, not a problem to hide. Then, spot manipulation by looking for impossible details, mismatched metadata, or missing sources. Protect privacy too. Avoid sharing sensitive sites, credit the source, and respect local communities. Finally, use a checklist: source, date, bands, scale, cross-check, and uncertainty. That habit keeps your reading honest and careful. Let's put these habits into practice in our next session, Guided Practice: Reading One Image Together.
 1 min
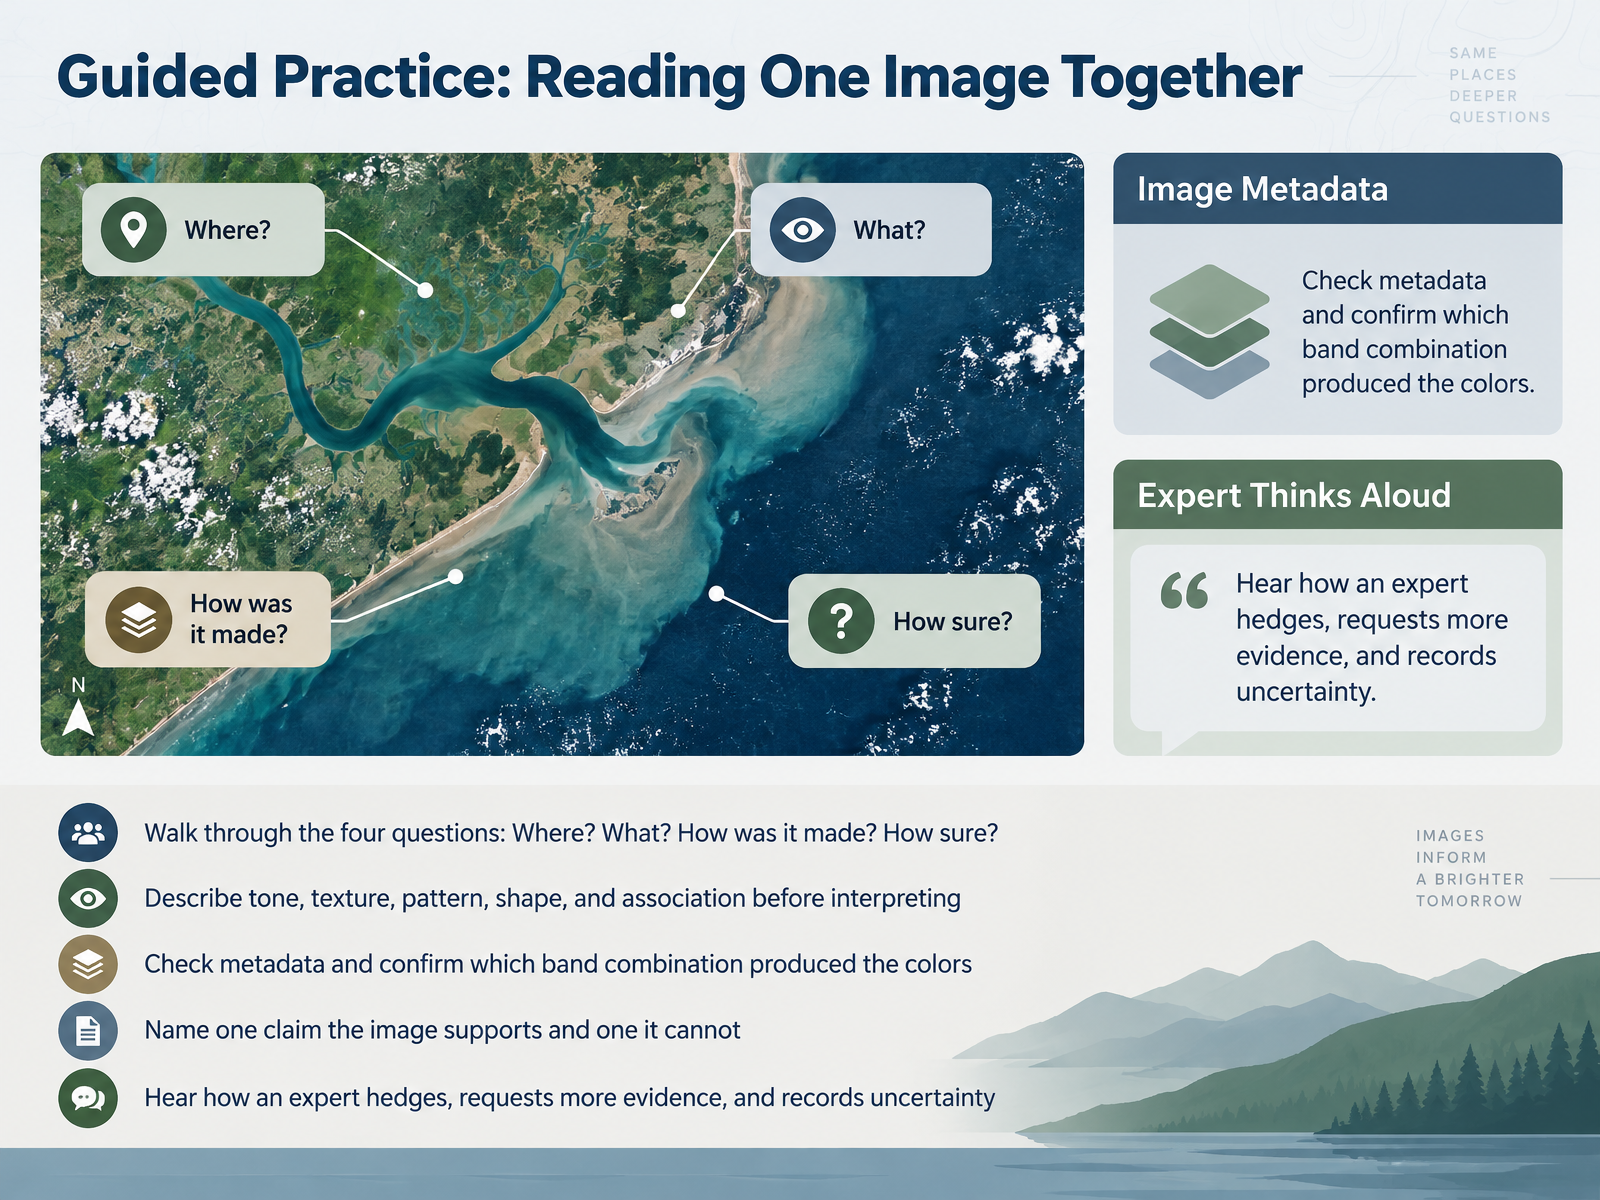
- 11Guided Practice: Reading One Image TogetherNow, let's apply all of this to one image, together. We'll walk through four simple questions: Where, What, How was it made, and How sure are we? First, look before you interpret. Notice the tone, the texture, the pattern, and the shapes. For example, a smooth dark green patch might be forest, while a light, blocky grid often suggests farmland. Then check the metadata. Confirm which band combination produced these colors. A false-color image can make healthy vegetation appear red. Next, name one claim the image clearly supports, and one claim it cannot. Finally, listen to how an expert hedges. They might say, the pattern suggests a recent fire, but I would need another date to confirm it. That is not weakness. It is careful science. Let's try the same with a pair of images next, in our paired-image exercise: defend an interpretation.
 2 min
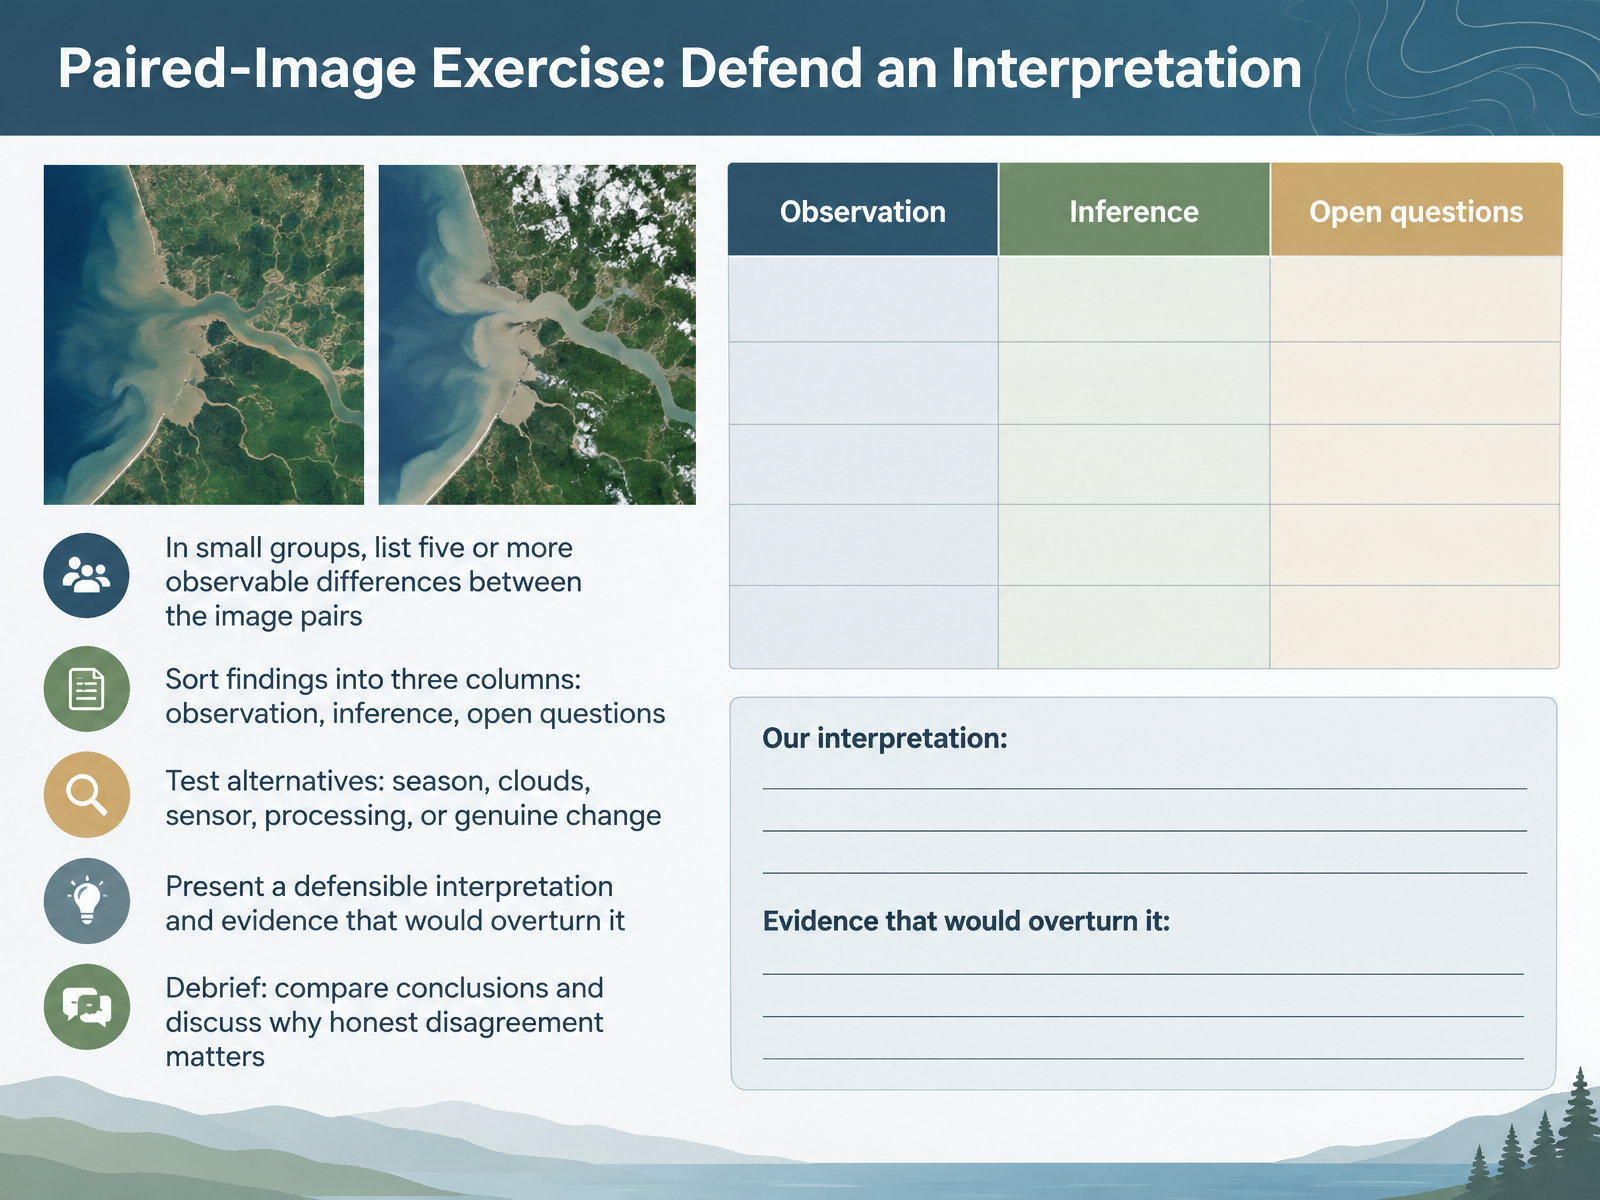
- 12Paired-Image Exercise: Defend an InterpretationNow let's put your observation skills to the test with a paired-image exercise. In small groups, compare two images of the same place and list at least five observable differences. Name the colors, shapes, and locations you actually see. Next, sort your findings into three columns: observations, inferences, and open questions. An observation is what is visible. An inference is what you think it means. An open question is what you still cannot tell. Then test alternatives before settling on change. Could the difference come from season, clouds, a different sensor, or image processing? For example, a greener patch might be spring growth, not recovery. Finally, present a defensible interpretation and say what evidence would overturn it. In the debrief, compare conclusions and discuss why honest disagreement matters. Next, we will connect global imagery to local observation.
 1 min
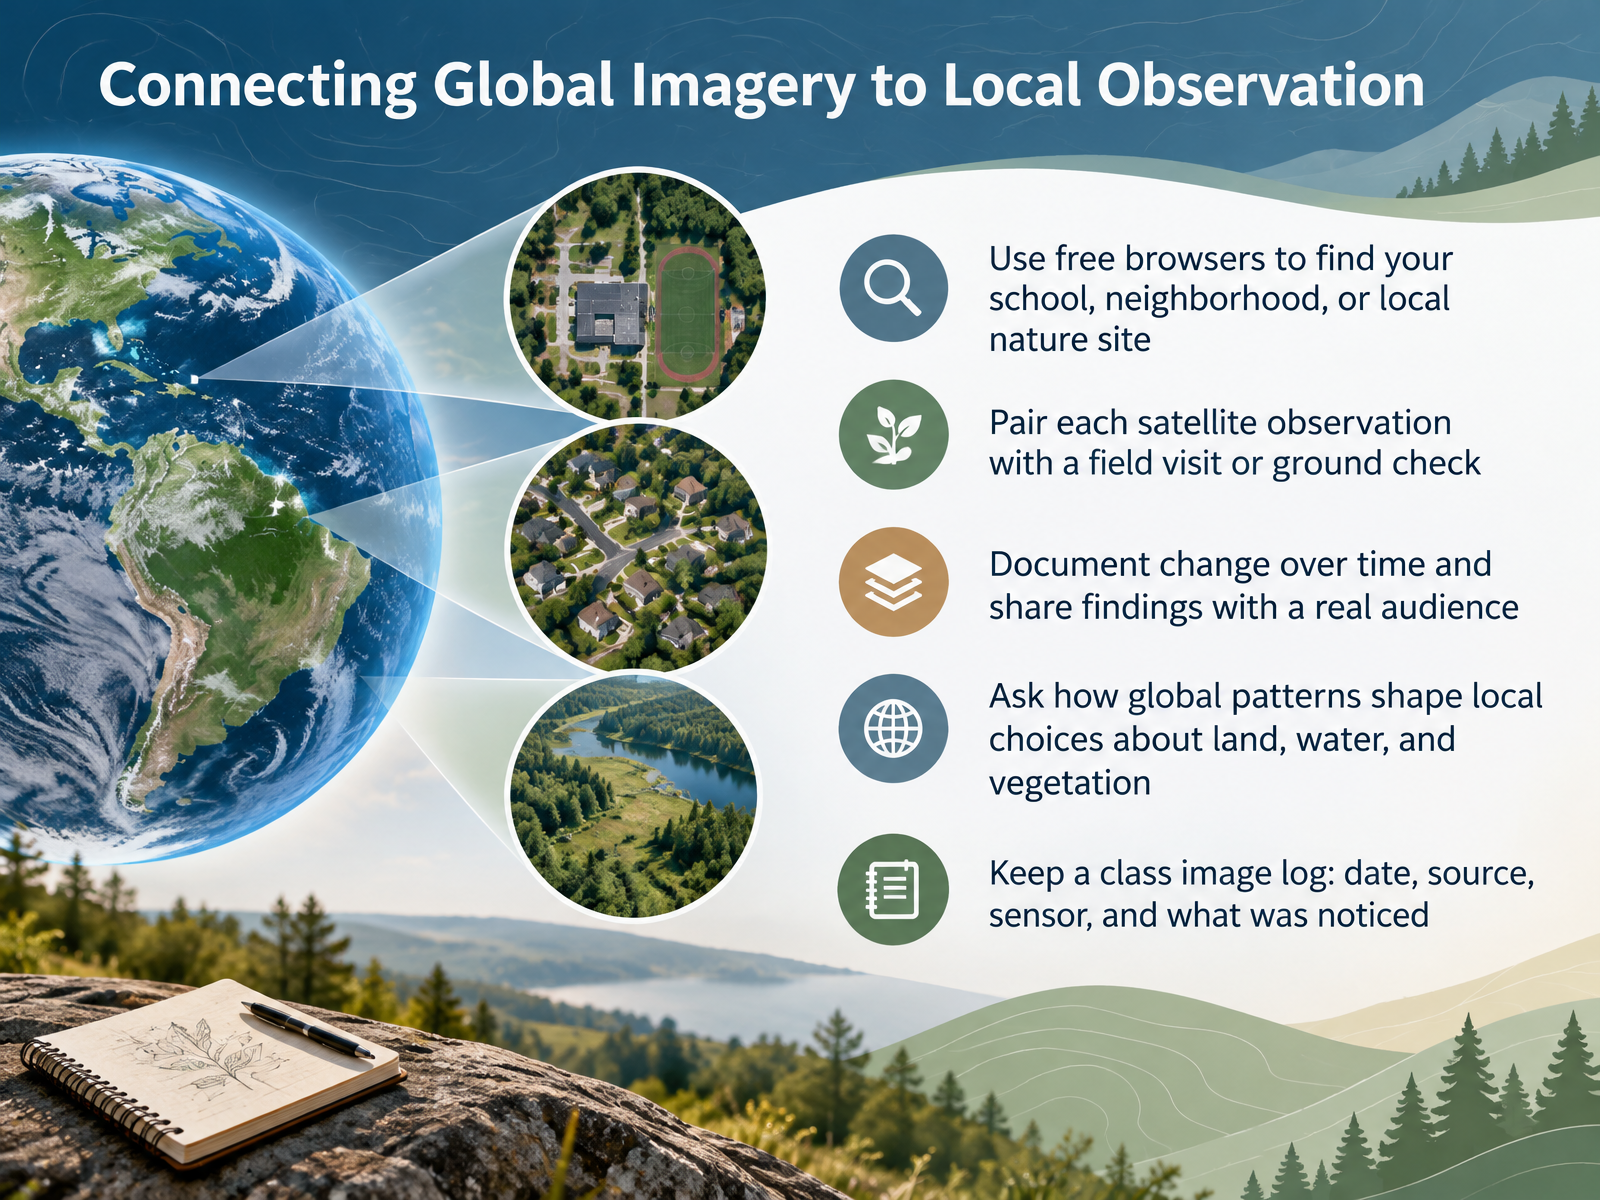
- 13Connecting Global Imagery to Local ObservationNow let's bring all of this down to your own place. First, open a free satellite browser and find your school, your neighborhood, or a local nature site you know well. Next, pair every image you look at with a field visit or a ground check, so you can confirm what the pixels actually show. Then document change over time, for example a new building or a shrinking wetland, and share your findings with a real audience, like another class or a community group. Ask yourselves how global patterns shape local choices about land, water, and vegetation. And finally, keep a class image log with the date, source, sensor, and what you noticed. That log turns observations into evidence, and evidence into better questions. Let's move on to the takeaway checklist and next steps.
 1 min
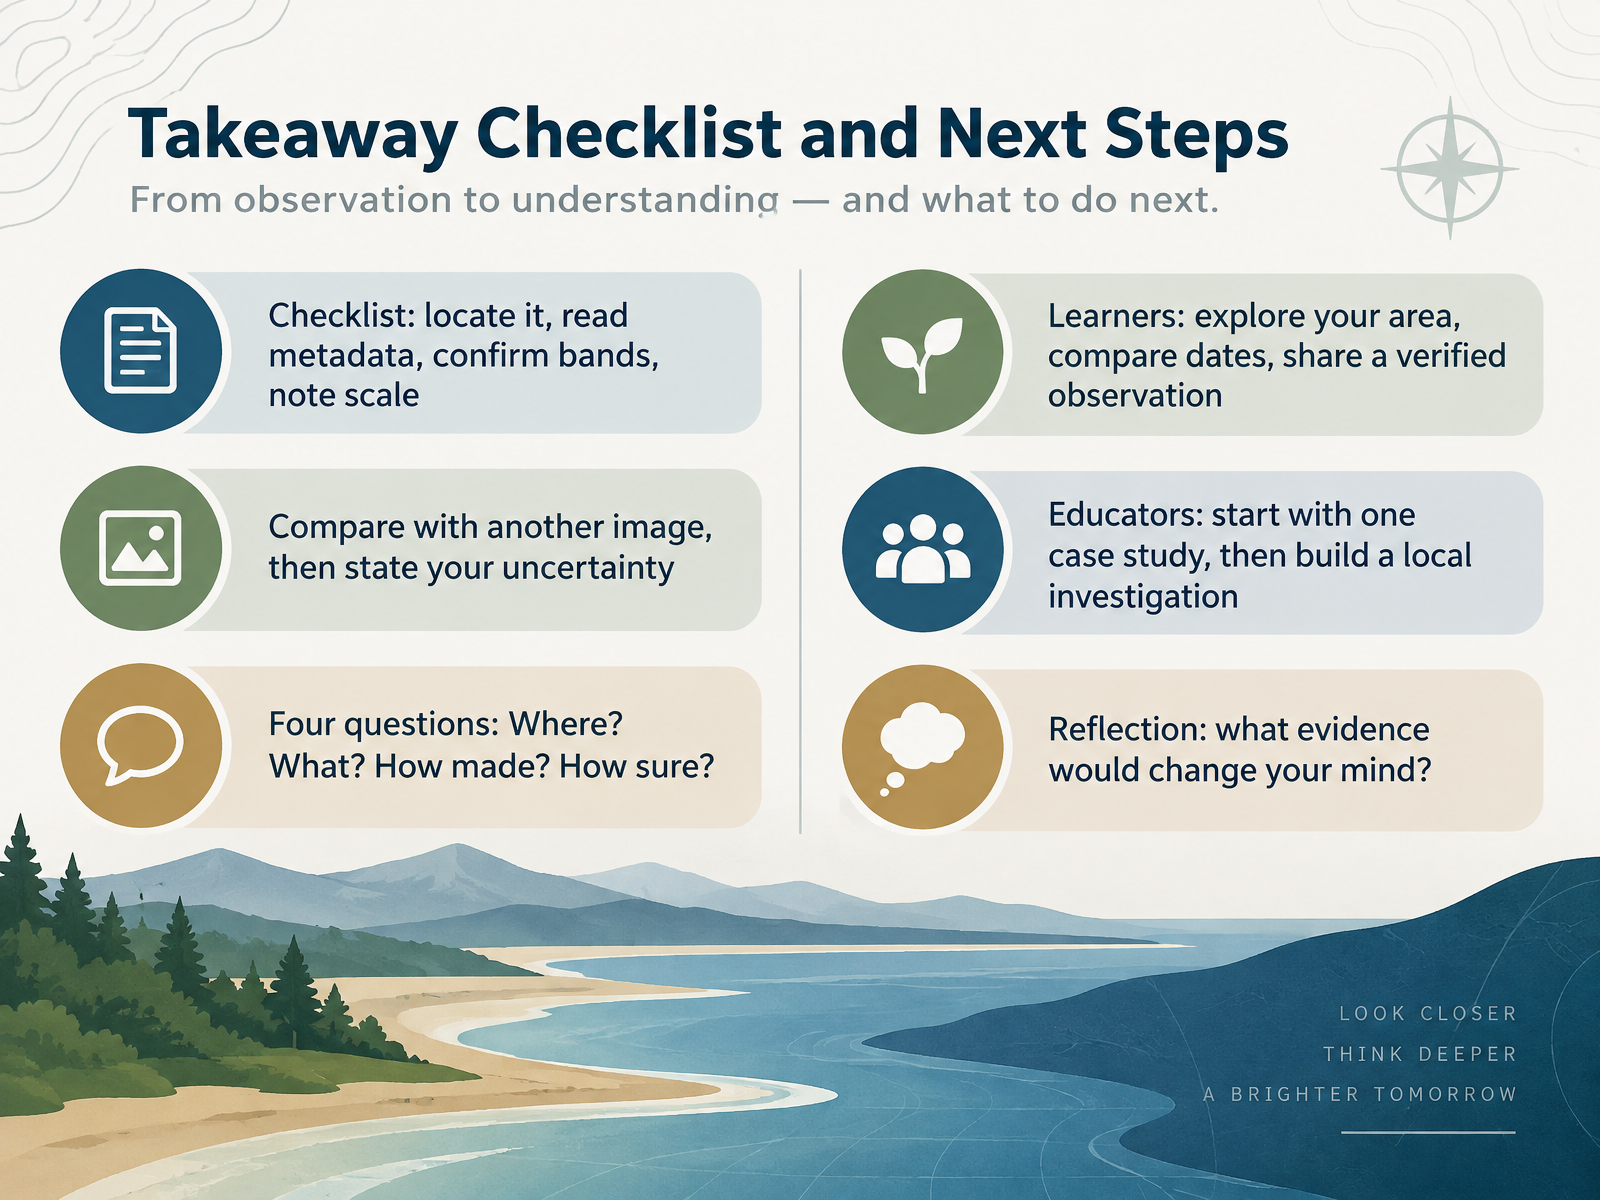
- 14Takeaway Checklist and Next StepsLet's bring everything together into a simple checklist you can use from now on. First, locate the place, read the metadata, confirm the bands, and note the scale. Next, compare your image with another one from a different date, and then state your uncertainty out loud. Ask the four questions every time: Where? What? How was it made? And how sure are we? If you are a learner, explore your own area, compare dates, and share one verified observation. If you are an educator, start with a single case study, then build a local investigation around it. And here is a good reflection to carry with you. Ask yourself, what evidence would change my mind? Keep that question close. Thank you for learning with me, and enjoy your next look at the Earth from above.
 1 min
Take the deck with you
Download this course as a file — free, no sign-up needed.
- PDF handoutEvery slide page, ready to print or share.15 pages · 4.6 MBDownload
- Narrated PowerPointThe deck that presents itself — every slide carries the digital human's narration video.15 pages · 13.1 MBDownload
- PowerPoint slidesThe full deck as a .pptx — open it in PowerPoint, Keynote, or Google Slides.15 pages · 4.5 MBDownload
Free to use in your own training — please keep the PersonWise credit page at the end.
Have your own deck? Turn it into a course
Sources consulted
Web sources consulted while building this course.
- How to Interpret a Satellite Image: Five Tips and Strategies - NASA Science — science.nasa.gov
- Exploring Satellite Imagery and False Color Images — mynasadata.larc.nasa.gov
- teach with space — climatedetectives.esa.int
- How to use Copernicus Browser in your classroom – ESA Education — education.esa.int
- Earth in Focus - Digital Learning Kit - Interpret Images of Earth from Space — ingeniumcanada.org